
Toward Multidimensional Front-of-Pack Labels: Integrating Nutritional, Environmental, and Processing Information
 , ,
, , 
 , ,
, ,  and
and 
Abstract
1. Introduction
2. Materials and Methods
2.1. Network Analysis
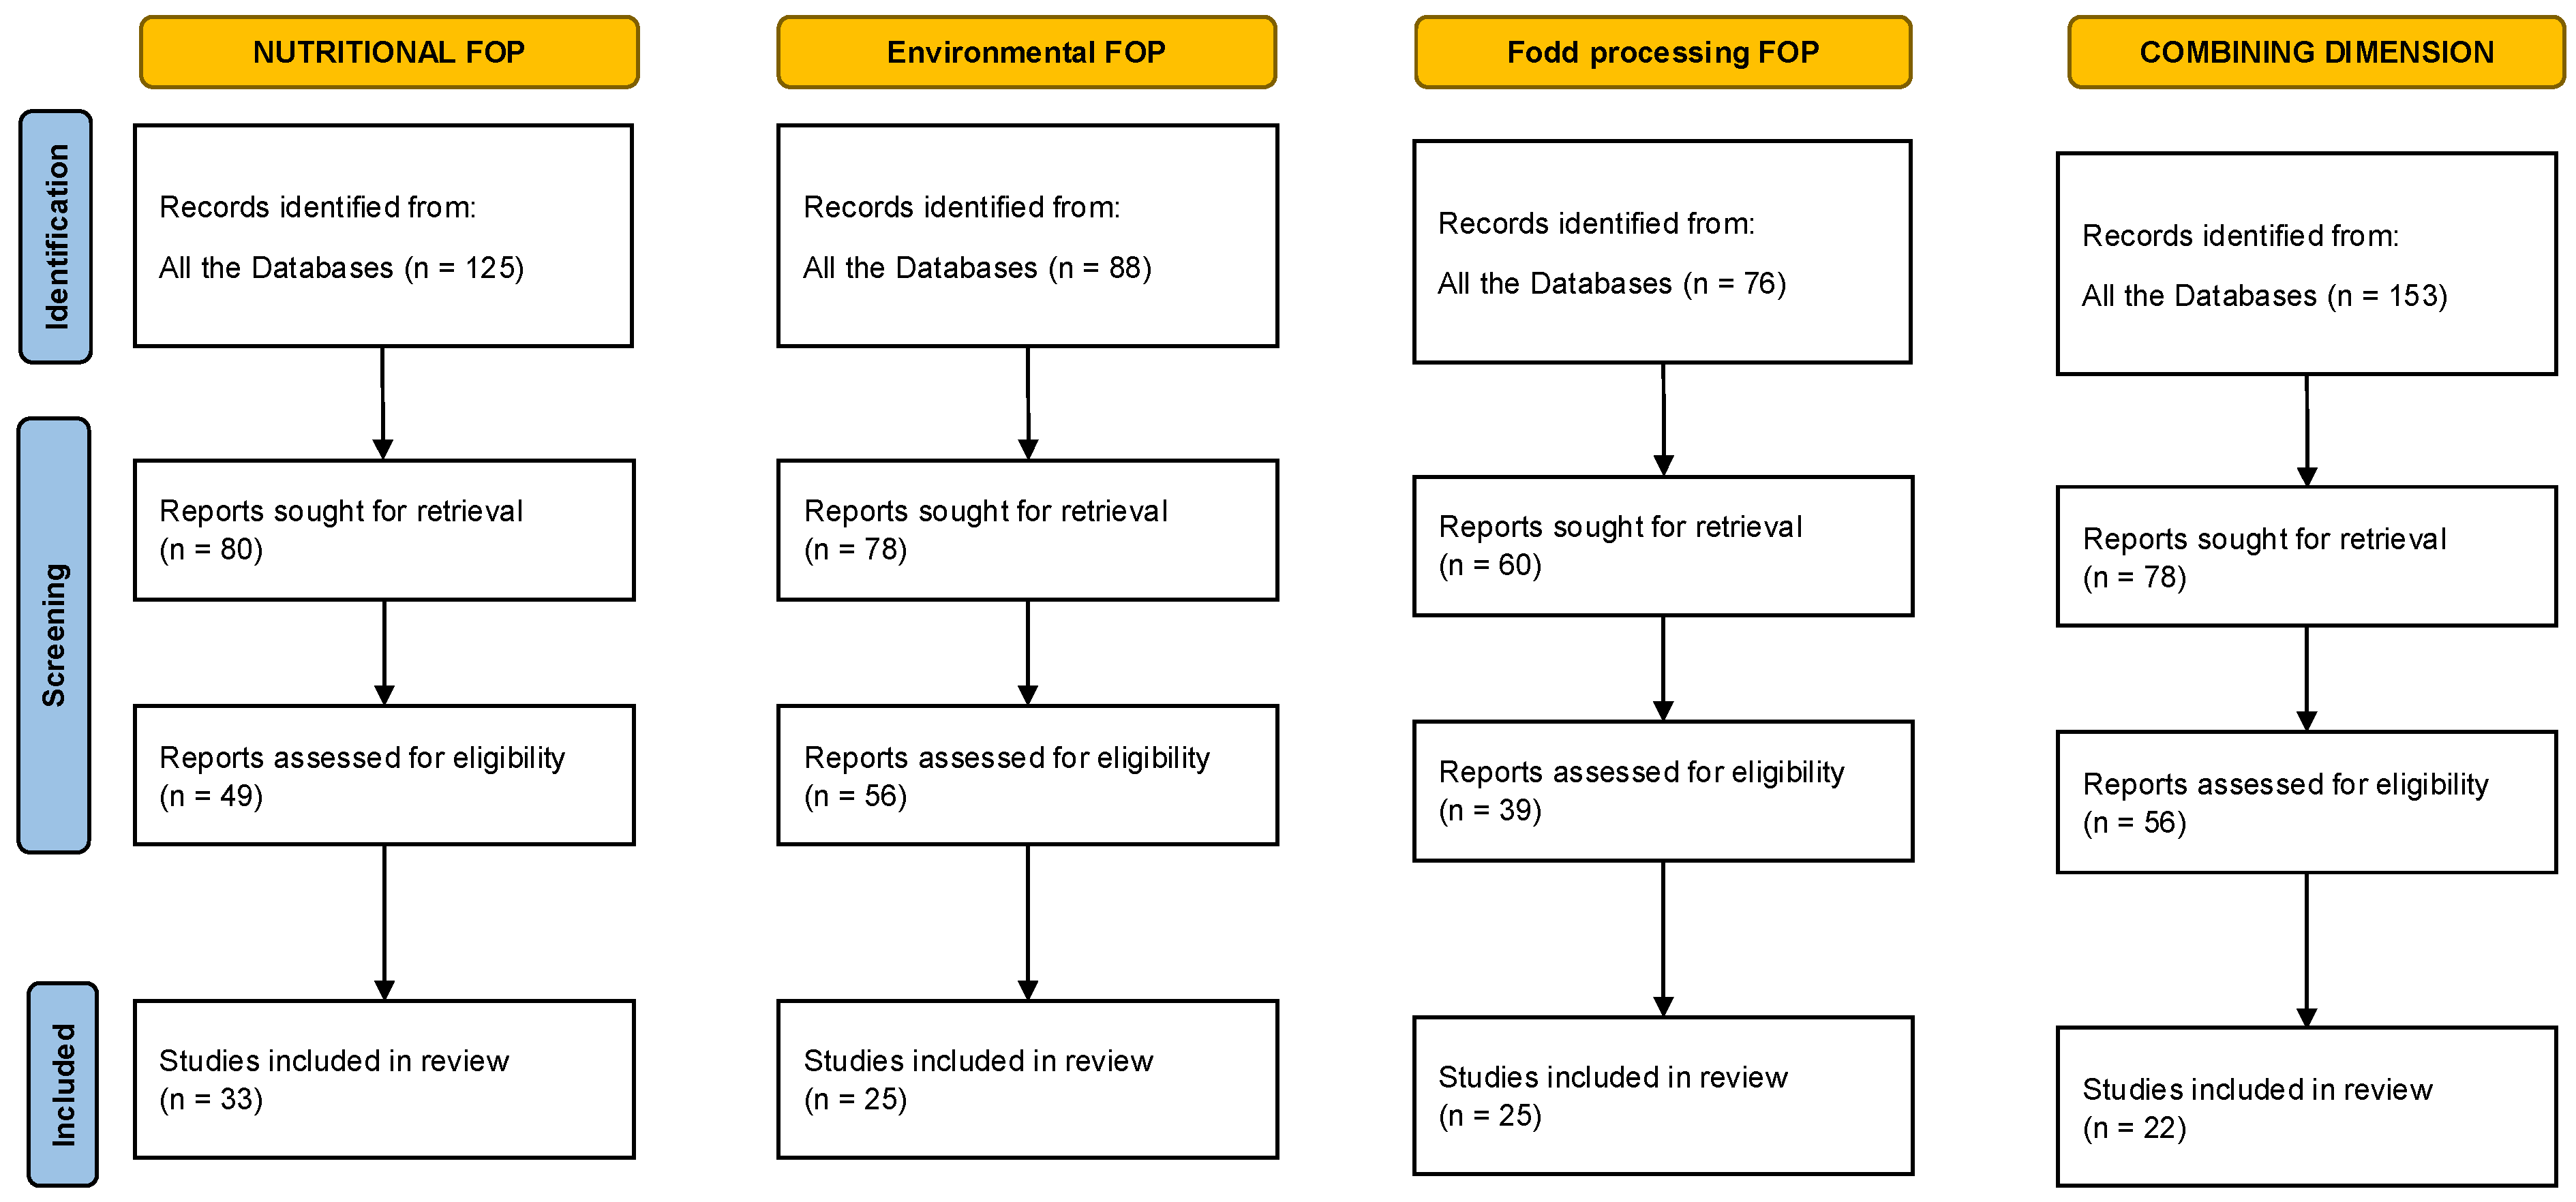
2.2. Literature Review
- (i)
- Nutritional FOPLs: [FOP AND (nutritional label OR Nutri-Score OR Food nutrition OR food choice), [food AND (nutritional AND nutrients AND health choice) AND (label OR labelling)];
- (ii)
- Environmental FOPLs: [FOP AND (ecolabel OR ecolabeling)], [food AND (sustainability OR sustainable OR environmental) AND (labelling OR label)];
- (iii)
- Processing FOPLs: (Food processing OR Processed food OR Food classification OR Ultra-processed food OR processed food OR Food processing classification) AND (classification system OR classification OR system);
- (iv)
- Combined FOPLs: FOP AND (ecol* OR eco-* OR sustainab* OR enviro*) AND (food processing OR NOVA OR UPF); FOP AND (ecol* OR eco-* OR sustainab* OR enviro*) and FOP AND nutrition AND (food processing OR NOVA OR UPF).
3. Results
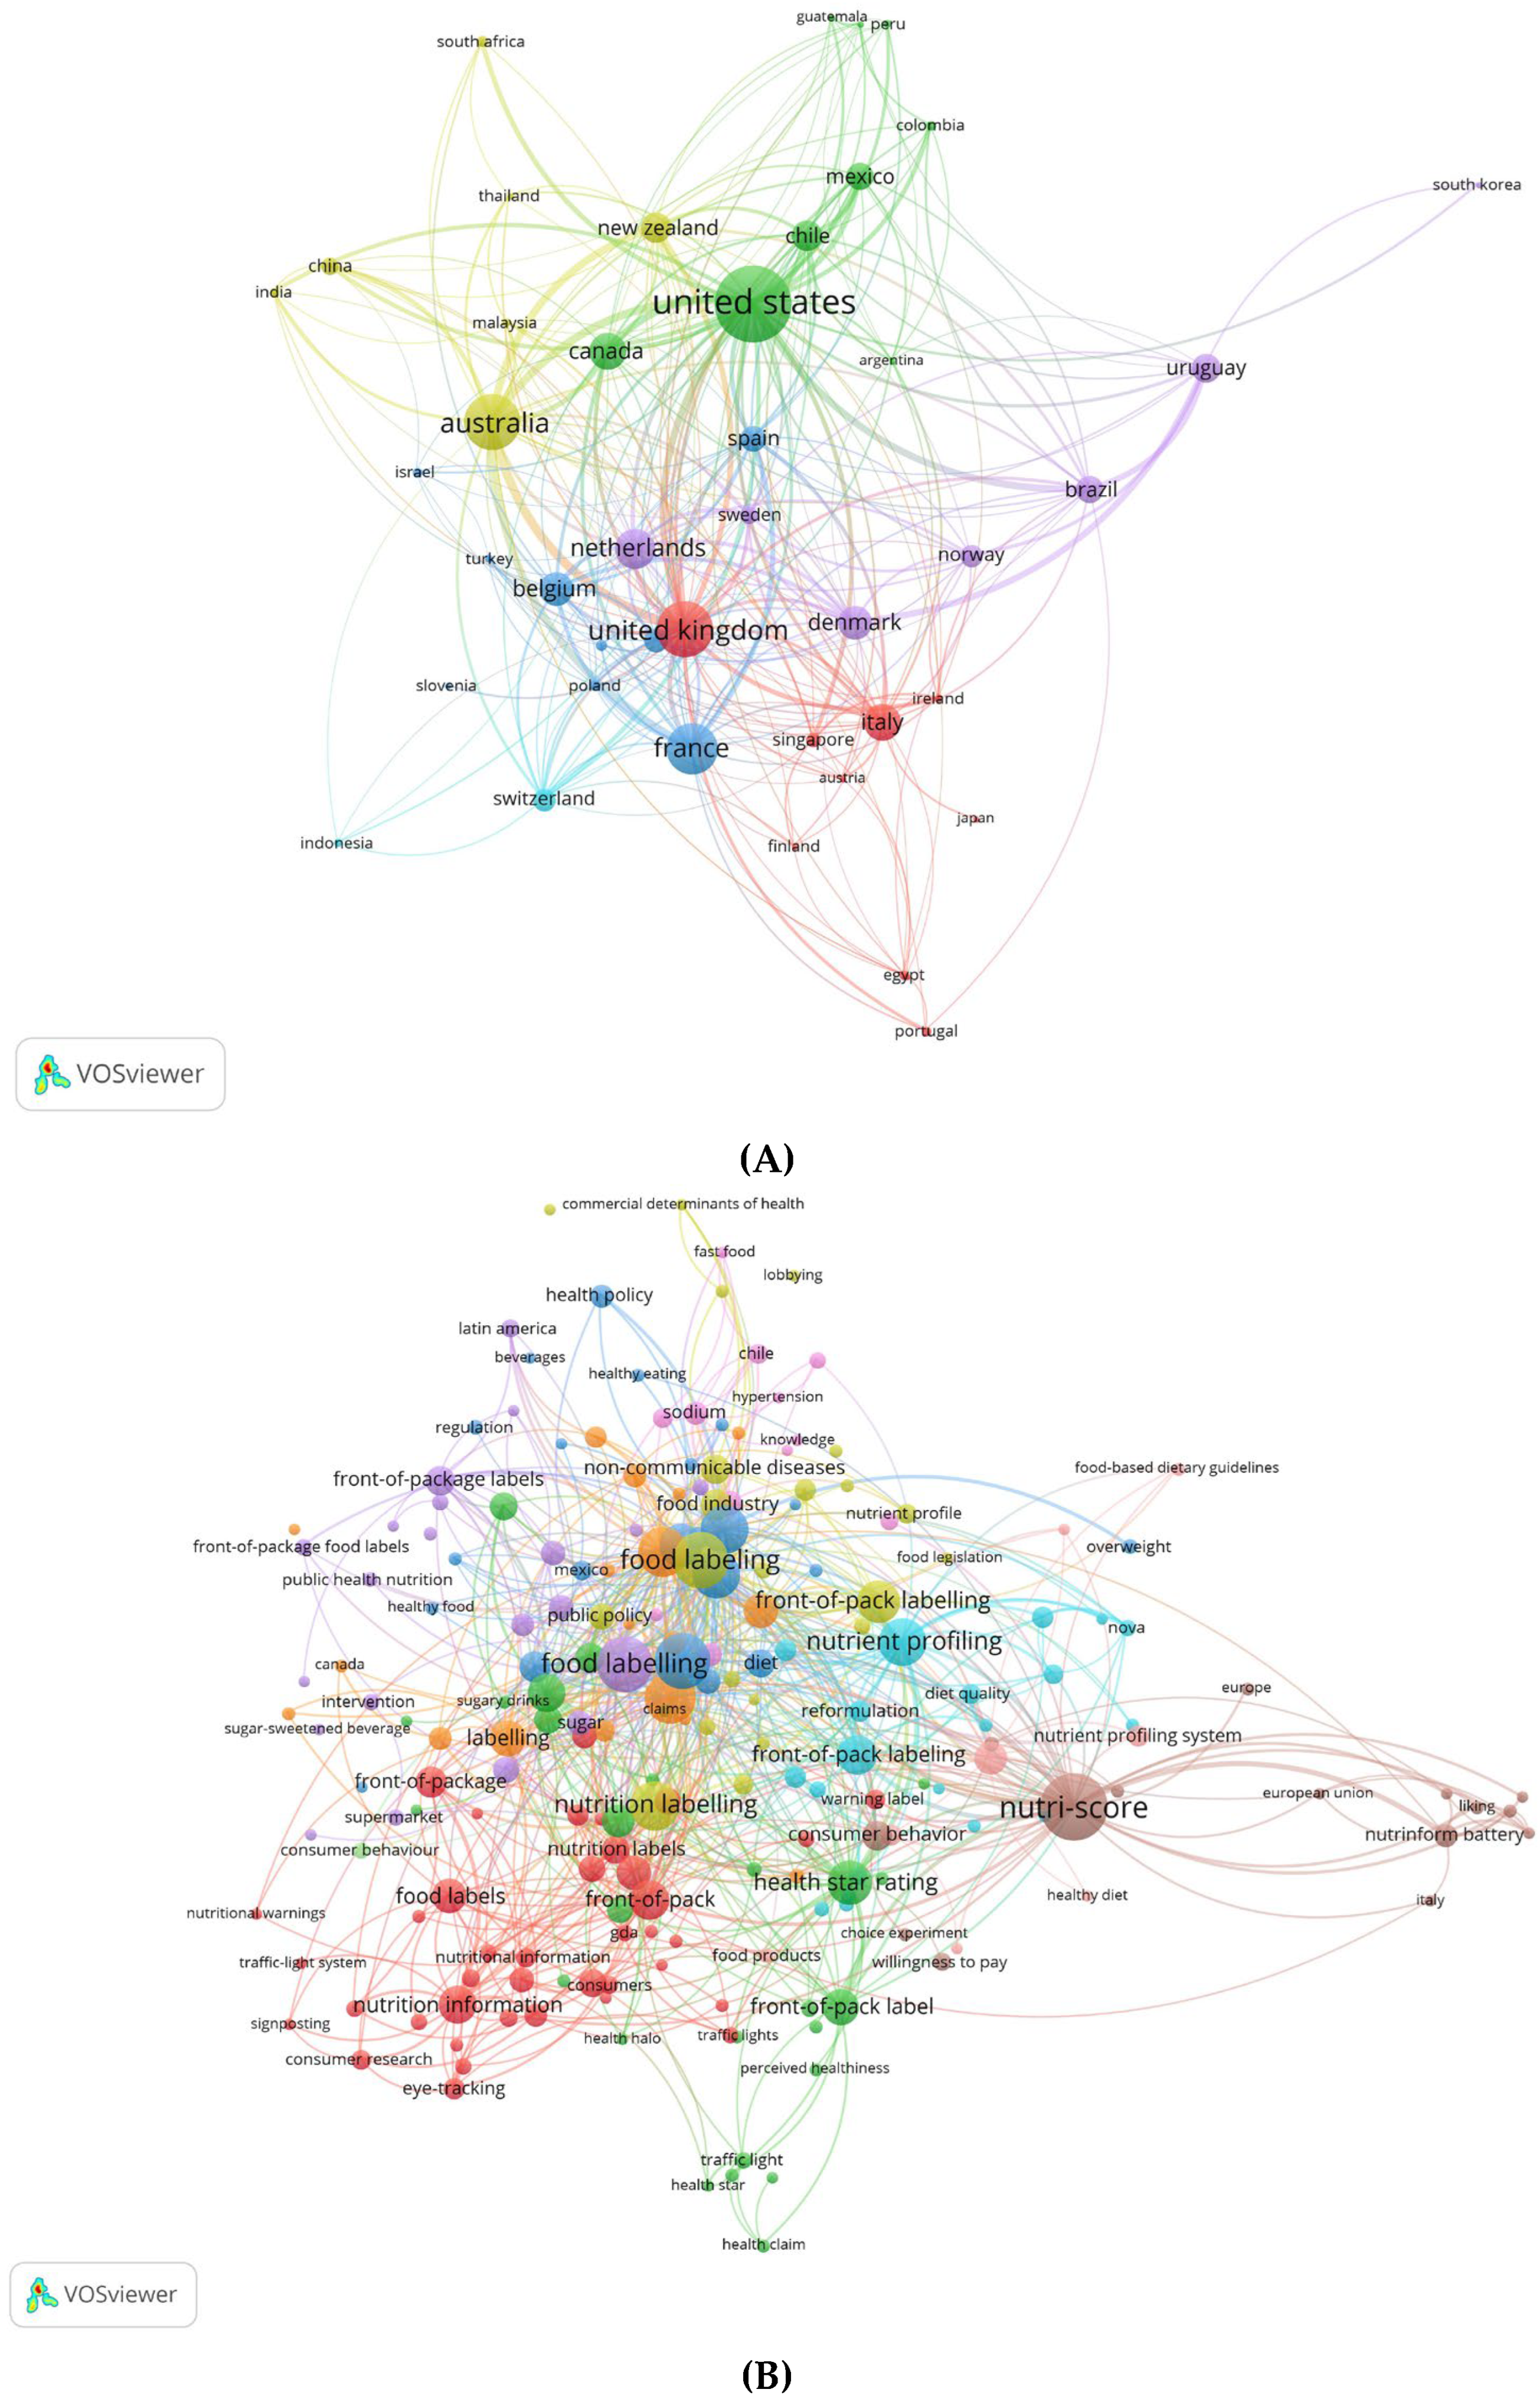
3.1. Bibliometric Analysis
3.2. Literature Review
3.2.1. Front-of-Pack Nutritional Label
3.2.2. Environmental Food Label

| Name | State | Methodology | Score | Infographic | Refs. |
|---|---|---|---|---|---|
| Eco-Score | France | LCA + PEF | From A to E | [2,35,41] | |
| Planet-Score | France | LCA + PEF | Icons + numeric | [25,42] | |
| Carbon Trust Label | UK | Carbon FootPrint | Numeric | 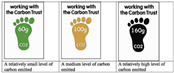 | [3,43] |
| Eco-Impact label | UK | LCA | From A+ to G | 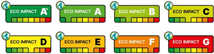 | [35,44] |
| Enviroscore | France | LCA + PEF | From A to E | [45,46] |
3.2.3. Processed Food Label
| System | Origin | Number of Categories | Category | Subcategory | Examples |
|---|---|---|---|---|---|
| NIPH [65] | Mexico | 3 | Non-processed foods | Not processed | Corn, fruits, vegetables |
| Locally made traditional Mexican foods | Corn tortillas | ||||
| Traditional Mexican preparation outside the home | Tacos, vegetables pie | ||||
| Modern preparations outside the home | Pizza, milkshakes | ||||
| Industrialized traditional | Corn flour for tortillas | ||||
| Modern industrialized | Corn flakes | ||||
| IARC [68] | Europe | 4 | Foods with unknown process | ||
| Non-processed foods, consumed raw | Corn, fresh raw vegetables | ||||
| Moderately processed foods | No further cooking | Vacuum packed potato, vegetables canned in own juice or in water | |||
| Cooked foods, from raw or moderately processed foods | Boiled grain, frozen cooked potato | ||||
| Highly processed foods | Flakes and flour, vegetables dried in oil, potato flakes | ||||
NOVA [59] | Brazil | 4 | Unprocessed or minimally processed foods | Grains, leafy and root vegetables, starchy roots and tubers such as potatoes, sweet potatoes, and cassava | |
| Processed culinary ingredients | Starches and flours | ||||
| Processed foods | Grilled vegetables in oil, canned corn with water and salt | ||||
| Ultra-processed foods | flavoured potato chips, breakfast cereals | ||||
| IFRPI [69] | Guatemala | 3 | Unprocessed | Corn (staple), fruits | |
| Partially (Primary) processed | Corn tortillas, vegetable oils | ||||
| Highly processed. | Corn flakes, pasta products | ||||
| IFIC [60] | USA | 5 | Minimally processed foods | Washed and packaged fruit and vegetables, bagged salads. | |
| Foods processed for preservation | Frozen fruit and vegetables, green beans | ||||
| Mixtures of combine ingredients | Packaged mixes, jarred sauce | Instant potato mix, jarred tomato sauce, tortillas | |||
| Mixtures, home prepared | Instant potato mix, jarred tomato sauce, tortillas | ||||
| Ready-to-eat processed | Packaged ready to eat foods | Potato chips, crackers, breakfast cereal | |||
| Mixtures, store prepared | |||||
| Prepared foods/meals | Pies, pizzas, frozen meals | ||||
| UNC [63] | USA | 4 | Unprocessed food | Fresh, frozen, or dried vegetables, brown rice | |
| Basic processed foods | Processed basic ingredients | whole-grain pasta, unsweetened fruit juice not from concentrate | |||
| Processed for basic preservation or precooking | Unsweetened fruit juice from concentrate, unsweetened/unflavored canned vegetables, refined-grain pasta | ||||
| Moderately processed foods | Moderately processed for flavour | Flavoured canned, dried, refrigerated, or frozen vegetables, frozen French fries, flavoured pasta | |||
| Moderately processed green products | Whole-grain breads/tortillas/crackers | ||||
| Highly processed foods. | Highly processed ingredients | Tomato sauce, breadcrumbs/breading with refined grains or added sugar/fat | |||
| Highly processed stand-alone | Instant potato dishes (mashed potatoes, stuffed baked potatoes), tortillas. | ||||
| Louzada [70] | Brazil | 3 | Unprocessed, minimally, or Moderately processed foods | Corn, wheat, vegetables | |
| Processed foods | Vegetables in brine or oil | ||||
| Ultra-processed foods | Pizzas, pies, industrialized bread | ||||
| FSANZ [30] | Australia | 2 | Unprocessed | Tomato | |
| Processed | Canned tomato sauce | ||||
| INFOODS Botelho [57,58] | Brazil | 2 | Simply Foods | Food in their natural status, being removed of non-edible or rejected parts | Fresh fruits and vegetables |
| Food which one edible part has been removed during processing | Skimmed milk, white wheat flour | ||||
| Food with a single main ingredient, dehydrated or added water | Dried fruits, cooked rice | ||||
| Food with a single main ingredient, added of other ingredients in quantities that not significantly impact on energetic value | Canned tomato sauce (ingredients: tomatoes, salt) | ||||
| Food that has been processed with or without removal of edible parts with or without addition of small amount of other ingredients | Fortified corn flakes | ||||
| Composed Food | flavoured potato chips | ||||
Siga [62,71] | France | 3 | Un-/minimally processed | A0. Intact raw initial matrix | Wheat, fresh fruits |
| A1-A2 Degraded raw metrics and culinary ingredients | Wheat flour, frozen fruits | ||||
| Processed | B1. added salt, sugars, fat ≤ official recommendations | Traditional bread, puree w/sugar fruits | |||
| B2. added salt, sugars, fat > official recommendations | Shortbread, canned fruits | ||||
| Ultra-processed—loss of matrix/contain purified and/or denatured ingredient (excludes vitamins, minerals, tolerance of preservatives) | C01. balanced nutritional profile and one industrial ingredient/additive (acceptable) | Ravioli w/ natural flavouring, fruit drinks/ natural flavoring | |||
| C02. high added fat/sugar/salt | Sweet crepe w/ refined oil, fruits jam w/ pectin | ||||
| C1. unprocessed industrial ingredients and/or limited additives | Soft bread w/ modified starch and aromas, fruits lollipop w/glucose syrup | ||||
| IPAN (Model 1) [61] | Australia | 4 | Unprocessed or minimally processed foods | Grains, leafy and root vegetables, starchy roots and tubers such as potatoes, sweet potatoes and cassava | |
| Processed culinary ingredients | Starches and flours | ||||
| Processed foods | Healthy | Group 3 NOVA foods with <10 g sugar/100 g and/or <450 mg sodium/100 g (excluding cheese, which has different limits). | |||
| Unhealthy | Group 3 NOVA foods with ≥10 g sugar/100 g and/or ≥450 mg sodium/100 g (excluding cheese, which has different limits) | ||||
| Ultra-processed foods | flavoured potato chips, breakfast cereals | ||||
| IPAN (Model 2) [61] | Australia | 4 | Unprocessed or minimally processed foods | Grains, leafy and root vegetables, starchy roots and tubers such as potatoes, sweet potatoes, and cassava | |
| Processed culinary ingredients | Starches and flours | ||||
| Processed foods | Healthy | Group 3 NOVA foods with <10 g sugar/100 g and/or <450 mg sodium/100 g (excluding cheese, which has different limits). | |||
| Unhealthy | Group 3 NOVA foods with ≥10 g sugar/100 g and/or ≥450 mg sodium/100 g (excluding cheese, which has different limits) | ||||
| Ultra-processed foods | Healthy | Group 4 NOVA foods with <10 g sugar/100 g and/or <450 mg sodium/100 g (excluding cheese, which has different limits). | |||
| Unhealthy | Group 4 NOVA foods with two or more markers of ultra-processing (MUP), or with one MUP as the first ingredient, or containing flavour enhancers, or with only one MUP but exceeding sugar and/or sodium limits. |
3.2.4. Combined Food Label
4. Strengths and Limitations
5. Conclusions
Author Contributions
Funding
Conflicts of Interest
References
- Srour, B.; Hercberg, S.; Galan, P.; Monteiro, C.A.; de Edelenyi, F.S.; Bourhis, L.; Fialon, M.; Sarda, B.; Druesne-Pecollo, N.; Esseddik, Y.; et al. Effect of a New Graphically Modified Nutri-Score on the Objective Understanding of Foods’ Nutrient Profile and Ultraprocessing: A Randomised Controlled Trial. BMJ Nutr. Prev. Health 2023, 6, 108–118. [Google Scholar] [CrossRef] [PubMed]
- Büttner, V.; Gassler, B.; Teuber, R. Does the Eco-Score Lead to a Halo Effect? Influence of a Sustainability Label on Product Perceptions and Purchase Intention. Food Qual. Prefer. 2024, 121, 105246. [Google Scholar] [CrossRef]
- The Carbon Trust Label. Available online: https://www.carbontrust.com/what-we-do/product-carbon-footprint-labelling/product-carbon-footprint-label (accessed on 20 April 2025).
- Kelly, B.; Ng, S.H.; Carrad, A.; Pettigrew, S. The Potential Effectiveness of Nutrient Declarations and Nutrition and Health Claims for Improving Population Diets. Annu. Rev. Nutr. 2024, 44, 441–470. [Google Scholar] [CrossRef] [PubMed]
- Minkov, N.; Lehmann, A.; Winter, L.; Finkbeiner, M. Characterization of Environmental Labels beyond the Criteria of ISO 14020 Series. Int. J. Life Cycle Assess. 2020, 25, 840–855. [Google Scholar] [CrossRef]
- Bolhuis, D.; Mosca, A.C.; Pellegrini, N. Consumer Awareness of the Degree of Industrial Food Processing and the Association with Healthiness—A Pilot Study. Nutrients 2022, 14, 4438. [Google Scholar] [CrossRef]
- De Bauw, M.; Matthys, C.; Poppe, V.; Franssens, S.; Vranken, L. A Combined Nutri-Score and ‘Eco-Score’ Approach for More Nutritious and More Environmentally Friendly Food Choices? Evidence from a Consumer Experiment in Belgium. Food Qual. Prefer. 2021, 93, 104276. [Google Scholar] [CrossRef]
- Muzzioli, L.; Penzavecchia, C.; Donini, L.M.; Pinto, A. Are Front-of-Pack Labels a Health Policy Tool? Nutrients 2022, 14, 771. [Google Scholar] [CrossRef]
- Singh, A.; Singh, A.; Bhattacharya, S. Front-of-Package Food Labeling and Noncommunicable Disease Prevention: A Comprehensive Bibliometric Analysis of Three Decades. Med. J. Armed. Forces India 2025, 81, 126–138. [Google Scholar] [CrossRef]
- Barrett, E.M.; Afrin, H.; Rayner, M.; Pettigrew, S.; Gaines, A.; Maganja, D.; Jones, A.; Mozaffarian, D.; Beck, E.J.; Neal, B.; et al. Criterion Validation of Nutrient Profiling Systems: A Systematic Review and Meta-Analysis. Am. J. Clin. Nutr. 2024, 119, 145–163. [Google Scholar] [CrossRef]
- European Parliament Regulation (UE), N. 1169/2011. Off. J. Eur. Union 2011, 2, 18–64. [Google Scholar]
- EU Commission. Farm to Fork Strategy. DG SANTE/Unit Food Information and Composition Food Waste; EU Commission: Brussels, Belgium, 2020; pp. 1–23. [Google Scholar]
- Castellini, G.; Bertorelli, S.; Carruba, M.; Donini, L.M.; Martini, D.; Graffigna, G. The Role of Nutri-Score and NutrInform Battery in Guiding the Food Choices of Consumers with Specific Nutritional Needs: A Controlled Study. Nutr. Metab. Cardiovasc. Dis. 2024, 34, 2789–2798. [Google Scholar] [CrossRef] [PubMed]
- Waltman, L.; van Eck, N.J. VOSviewer Database Version 1.6.18. Available online: http://www.vosviewer.com/ (accessed on 10 April 2025).
- Pettigrew, S.; Coyle, D.; McKenzie, B.; Vu, D.; Lim, S.C.; Berasi, K.; Poowanasatien, A.; Suya, I.; Kowal, P. A Review of Front-of-Pack Nutrition Labelling in Southeast Asia: Industry Interference, Lessons Learned, and Future Directions. Lancet Reg. Health S. Asia 2022, 3, 100017. [Google Scholar] [CrossRef] [PubMed]
- Donini, L.M.; Penzavecchia, C.; Muzzioli, L.; Poggiogalle, E.; Giusti, A.M.; Lenzi, A.; Pinto, A. Efficacy of Front-of-Pack Nutrition Labels in Improving Health Status. Nutrition 2022, 102, 111770. [Google Scholar] [CrossRef] [PubMed]
- Guo, Z.; Ning, Y.; Mustafa, M. Impact of Five Types of Front-of-Package Nutrition Labels on Consumer Behavior among Young Adults: A Systematic Review. Nutrition 2024, 16, 2819. [Google Scholar] [CrossRef]
- Muzzioli, L.; Donini, L.M.; Mazziotta, M.; Iosa, M.; Frigerio, F.; Poggiogalle, E.; Lenzi, A.; Pinto, A. How Much Do Front-Of-Pack Labels Correlate with Food Environmental Impacts? Nutrients 2023, 15, 1176. [Google Scholar] [CrossRef]
- Dumoitier, A.; Abbo, V.; Neuhofer, Z.T.; McFadden, B.R. A Review of Nutrition Labeling and Food Choice in the United States. Obes. Sci. Pract. 2019, 5, 581–591. [Google Scholar] [CrossRef]
- Crosbie, E.; Gomes, F.S.; Olvera, J.; Rincón-Gallardo Patiño, S.; Hoeper, S.; Carriedo, A. A Policy Study on Front–of–Pack Nutrition Labeling in the Americas: Emerging Developments and Outcomes. Lancet Reg. Health Am. 2023, 18, 100400. [Google Scholar] [CrossRef]
- Muzzioli, L.; Poggiogalle, E.; Donini, L.M.; Pinto, A. How to Communicate the Healthiness and Sustainability of Foods to Consumers? Proc. Natl. Acad. Sci. USA 2023, 120, 2–3. [Google Scholar] [CrossRef]
- Afroza, U.; Abrar, A.K.; Nowar, A.; Sobhan, S.M.M.; Ide, N.; Choudhury, S.R. Global Overview of Government-Endorsed Nutrition Labeling Policies of Packaged Foods: A Document Review. Front. Public Health 2024, 12, 1426639. [Google Scholar] [CrossRef]
- Devaux, M.; Aldea, A.; Lerouge, A.; Vuik, S.; Cecchini, M. Establishing an EU-Wide Front-of-Pack Nutrition Label: Review of Options and Model-Based Evaluation. Obes. Rev. 2024, 25, e13719. [Google Scholar] [CrossRef]
- Touvier, M.; Srour, B.; Hercberg, S.; Galan, P.; Kesse-Guyot, E.; Julia, C. Health Impact of Foods: Time to Switch to a 3D-Vision. Front. Nutr. 2022, 9, 966310. [Google Scholar] [CrossRef] [PubMed]
- Isabel Sonntag, W.; Lemken, D.; Spiller, A.; Schulze, M. Welcome to the (Label) Jungle? Analyzing How Consumers Deal with Intra-Sustainability Label Trade-Offs on Food. Food Qual. Prefer. 2023, 104, 104746. [Google Scholar] [CrossRef]
- Bonaccio, M.; Di Castelnuovo, A.; Ruggiero, E.; Costanzo, S.; Grosso, G.; De Curtis, A.; Cerletti, C.; Donati, M.B.; De Gaetano, G.; Iacoviello, L. Joint Association of Food Nutritional Profile by Nutri-Score Front-of-Pack Label and Ultra-Processed Food Intake with Mortality: Moli-Sani Prospective Cohort Study. BMJ 2022, 378, 6–8. [Google Scholar] [CrossRef] [PubMed]
- Berden, J.; Hung, Y. Effectiveness of the Eco-Score Food Label: An Information Experiment Combined with 2 Nutri-Score Label in Belgium. Appetite 2024, 204, 107759. [Google Scholar] [CrossRef]
- Carruba, M.O.; Caretto, A.; De Lorenzo, A.; Fatati, G.; Ghiselli, A.; Lucchin, L.; Maffeis, C.; Malavazos, A.; Malfi, G.; Riva, E.; et al. Front-of-Pack (FOP) Labelling Systems to Improve the Quality of Nutrition Information to Prevent Obesity: NutrInform Battery vs Nutri-Score. Eat. Weight Disord. 2022, 27, 1575–1584. [Google Scholar] [CrossRef]
- Ni Mhurchu, C.; Eyles, H.; Jiang, Y.; Blakely, T. Do Nutrition Labels Influence Healthier Food Choices? Analysis of Label Viewing Behaviour and Subsequent Food Purchases in a Labelling Intervention Trial. Appetite 2018, 121, 360–365. [Google Scholar] [CrossRef]
- Crino, M.; Barakat, T.; Trevena, H.; Neal, B. Systematic Review and Comparison of Classification Frameworks Describing the Degree of Food Processing. Nutr. Food Technol. Open Access 2017, 3, 138. [Google Scholar] [CrossRef]
- Hasni, M.J.S.; Rehman, M.A.; Pontes, N.; Yaqub, M.Z. Health Star Rating Labels: A Systematic Review and Future Research Agenda. Food Qual. Prefer. 2025, 122, 105310. [Google Scholar] [CrossRef]
- Hafner, E.; Pravst, I. A Systematic Assessment of the Revised Nutri-Score Algorithm: Potentials for the Implementation of Front-of-Package Nutrition Labeling across Europe. Food Front. 2024, 5, 947–963. [Google Scholar] [CrossRef]
- Steenbergen, E.; Vellinga, R.E.; Beulens, J.W.; Temme, E.H. The Potential of Nutri-Score to Discriminate Foods According to Environmental Impact. Eur. J. Nutr. 2025, 64, 121. [Google Scholar] [CrossRef]
- Stiletto, A.; Cembalo, L.; Trestini, S. All That Glitters Is Not Gold: The Impact of the Nutri-Score Label on Food with Geographical Indication. Agric. Food Econ. 2024, 12, 45. [Google Scholar] [CrossRef]
- Williams, V.; Flannery, O.; Patel, A. Eco-Score Labels on Meat Products: Consumer Perceptions and Attitudes towards Sustainable Choices. Food Qual. Prefer. 2023, 111, 104973. [Google Scholar] [CrossRef]
- Bunge, A.C.; Wickramasinghe, K.; Renzella, J.; Clark, M.; Rayner, M.; Rippin, H.; Halloran, A.; Roberts, N.; Breda, J. Sustainable Food Profiling Models to Inform the Development of Food Labels That Account for Nutrition and the Environment: A Systematic Review. Lancet Planet. Health 2021, 5, e818–e826. [Google Scholar] [CrossRef] [PubMed]
- ISO 14024:2018; Environmental Labels and Declarations—Type I Environmental Labelling—Principles and Procedures. International Organization for Standardization (ISO): Geneve, Switzerland, 2018.
- ISO 14021:2016; Environmental Labels and Declarations—Self-Declared Environmental Claims (Type II Environmental Labelling). International Organization for Standardization (ISO): Geneve, Switzerland, 2016.
- ISO 14040:2021; Environmental Management—Life Cycle Assessment—Principles and Framework. International Organization for Standardization (ISO): Geneve, Switzerland, 2021.
- ISO 14044:2021; Environmental Management—Life Cycle Assessment—Requirements and Guidelines. International Organization for Standardization (ISO): Geneve, Switzerland, 2021.
- Jürkenbeck, K.; Sanchez-Siles, L.; Siegrist, M. Nutri-Score and Eco-Score: Consumers’ Trade-Offs When Facing Two Sustainability Labels. Food Qual. Prefer. 2024, 118, 105200. [Google Scholar] [CrossRef]
- Planet Score. Available online: https://www.planet-score.org/ (accessed on 5 February 2025).
- Lin, W.; Nayga, R.M. Green Identity Labeling, Environmental Information, and pro-Environmental Food Choices. Food Policy 2022, 106, 102187. [Google Scholar] [CrossRef]
- Boone, K.; Broekema, R.; Van Haaster-De Winter, M.; Verweij-Novikova, I.; Adema, H. LCA-Based Labelling Systems: Game Changer towards More Sustainable Food Production and Consumption across Europe; Wageningen Economic Research: Den Haag, The Netherland, 2023; pp. 1–9. [Google Scholar]
- Ramos, S.; Segovia, L.; Melado-Herreros, A.; Cidad, M.; Zufía, J.; Vranken, L.; Matthys, C. Enviroscore: Normalization, Weighting, and Categorization Algorithm to Evaluate the Relative Environmental Impact of Food and Drink Products. npj Sci. Food 2022, 6, 54. [Google Scholar] [CrossRef]
- Enviroscore. Available online: https://www.azti.es/enviroscore/en/ (accessed on 20 April 2025).
- Kolber, A.; Meixner, O. Effects of Multi-Level Eco-Labels on the Product Evaluation of Meat and Meat Alternatives—A Discrete Choice Experiment. Foods 2023, 12, 2941. [Google Scholar] [CrossRef]
- Taufique, K.M.R.; Nielsen, K.S.; Dietz, T.; Shwom, R.; Stern, P.C.; Vandenbergh, M.P. Revisiting the Promise of Carbon Labelling. Nat. Clim. Change 2022, 12, 132–140. [Google Scholar] [CrossRef]
- Pedersen, E.; Remmen, A. Challenges with Product Environmental Footprint: A Systematic Review. Int. J. Life Cycle Assess. 2022, 27, 342–352. [Google Scholar] [CrossRef]
- De Bauw, M.; Peracaula Moner, A.; Santa Cruz, E.; Vranken, L. Please Don’t Throw Me in the Briar Patch! Empirical Evidence on the Role of Instructional Cues on Eco-Label Usage in Fish Consumption Decisions. Appetite 2024, 197, 107291. [Google Scholar] [CrossRef]
- Peracaula-Moner, A.; De Bauw, M.; Santa Cruz, E.; da Quinta, N.; Vranken, L. Sustainability at First Sight: How Adding an Environmental Impact Index to a Fresh and Packed Fish Food Label Impacts Visual Behaviour of Consumers. Sci. Talks 2023, 6, 100171. [Google Scholar] [CrossRef]
- Spedicato, G. Alma Mater Studiorum Università Di Bologna Archivio Istituzionale Della Ricerca Deceptively Green: How the EU’s Unfair Commercial Practices Directive Can Support Trademark Law in Combating Corporate Greenwashing; Springer: Berlin/Heidelberg, Germany, 2025. [Google Scholar]
- Tiboni-Oschilewski, O.; Abarca, M.; Santa Rosa Pierre, F.; Rosi, A.; Biasini, B.; Menozzi, D.; Scazzina, F. Strengths and Weaknesses of Food Eco-Labeling: A Review. Front. Nutr. 2024, 11, 1381135. [Google Scholar] [CrossRef] [PubMed]
- Steele, E.M.; O’Connor, L.E.; Juul, F.; Khandpur, N.; Galastri Baraldi, L.; Monteiro, C.A.; Parekh, N.; Herrick, K.A. Identifying and Estimating Ultraprocessed Food Intake in the US NHANES According to the Nova Classification System of Food Processing. J. Nutr. 2023, 153, 225–241. [Google Scholar] [CrossRef] [PubMed]
- O’Connor, L.E.; Higgins, K.A.; Smiljanec, K.; Bergia, R.; Brown, A.W.; Baer, D.; Davis, C.; Ferruzzi, M.G.; Miller, K.; Rowe, S.; et al. Perspective: A Research Roadmap about Ultra-Processed Foods and Human Health for the United States Food System: Proceedings from an Interdisciplinary, Multi-Stakeholder Workshop. Adv. Nutr. 2023, 14, 1255–1269. [Google Scholar] [CrossRef]
- Huybrechts, I.; Rauber, F.; Nicolas, G.; Casagrande, C.; Kliemann, N.; Wedekind, R.; Biessy, C.; Scalbert, A.; Touvier, M.; Aleksandrova, K.; et al. Characterization of the Degree of Food Processing in the European Prospective Investigation into Cancer and Nutrition: Application of the Nova Classification and Validation Using Selected Biomarkers of Food Processing. Front. Nutr. 2022, 9, 1035580. [Google Scholar] [CrossRef]
- Botelho, R.; Araújo, W.; Pineli, L. Food Formulation and Not Processing Level: Conceptual Divergences between Public Health and Food Science and Technology Sectors. Crit. Rev. Food Sci. Nutr. 2018, 58, 639–650. [Google Scholar] [CrossRef]
- Botelho, A.M.; De Camargo, A.M.; Mazzonetto, A.C.; Fiates, G.M.R. Decision Flowchart for Food Classification by the Extension and Purpose of Industrial Processing: Update and Practical Application. Rev. Nutr. 2022, 35, e210184. [Google Scholar] [CrossRef]
- González-Castell, D.; González-Cossío, T.; Barquera, S.; Rivera, J.A. Contribution of Processed Foods to the Energy, Macronutrient and Fiber Intakes of Mexican Children Aged 1 to 4 Years. Salud Publica Mex. 2007, 49, 345–356. [Google Scholar]
- Asfaw, A. Does consumption of processed foods explain disparities in the body weight of individuals? The case of guatemala abay. Health Econ. 2011, 20, 184–195. [Google Scholar] [CrossRef]
- Louzada, M.L.D.C.; Baraldi, L.G.; Steele, E.M.; Martins, A.P.B.; Canella, D.S.; Moubarac, J.C.; Levy, R.B.; Cannon, G.; Afshin, A.; Imamura, F.; et al. Consumption of Ultra-Processed Foods and Obesity in Brazilian Adolescents and Adults. Prev. Med. 2015, 81, 9–15. [Google Scholar] [CrossRef]
- Davidou, S.; Christodoulou, A.; Fardet, A.; Frank, K. The Holistico-Reductionist Siga Classification According to the Degree of Food Processing: An Evaluation of Ultra-Processed Foods in French Supermarkets. Food Funct. 2020, 11, 2026–2039. [Google Scholar] [CrossRef] [PubMed]
- Davidou, S.; Christodoulou, A.; Frank, K.; Fardet, A. A Study of Ultra-Processing Marker Profiles in 22,028 Packaged Ultra-Processed Foods Using the Siga Classification. J. Food Compos. Anal. 2021, 99, 103848. [Google Scholar] [CrossRef]
- Slimani, N.; Deharveng, G.; Southgate, D.A.T.; Biessy, C.; Chajès, V.; Van Bakel, M.M.E.; Boutron-Ruault, M.C.; McTaggart, A.; Grioni, S.; Verkaik-Kloosterman, J.; et al. Contribution of Highly Industrially Processed Foods to the Nutrient Intakes and Patterns of Middle-Aged Populations in the European Prospective Investigation into Cancer and Nutrition Study. Eur. J. Clin. Nutr. 2009, 63, S206–S225. [Google Scholar] [CrossRef] [PubMed]
- Monteiro, C.A.; Cannon, G.; Levy, R.B.; Moubarac, J.C.; Louzada, M.L.C.; Rauber, F.; Khandpur, N.; Cediel, G.; Neri, D.; Martinez-Steele, E.; et al. Ultra-Processed Foods: What They Are and How to Identify Them. Public Health Nutr. 2019, 22, 936–941. [Google Scholar] [CrossRef]
- Dickie, S.; Woods, J.; Machado, P.; Lawrence, M. A Novel Food Processing-Based Nutrition Classification Scheme for Guiding Policy Actions Applied to the Australian Food Supply. Front. Nutr. 2023, 10, 1071356. [Google Scholar] [CrossRef]
- Eicher-Miller, H.A.; Fulgoni, V.L.; Keast, D.R. Contributions of Processed Foods to Dietary Intake in the Us from 2003-2008: A Report of the Food and Nutrition Science Solutions Joint Task Force of the Academy of Nutrition and Dietetics, American Society for Nutrition, Institute of Food Technologists. J. Nutr. 2012, 142, 2065–2072. [Google Scholar] [CrossRef]
- Marino, M.; Puppo, F.; Del Bo’, C.; Vinelli, V.; Riso, P.; Porrini, M.; Martini, D. A Systematic Review of Worldwide Consumption of Ultra-Processed Foods: Findings and Criticisms. Nutrients 2021, 13, 2778. [Google Scholar] [CrossRef]
- Baker, P.; Machado, P.; Santos, T.; Sievert, K.; Backholer, K.; Hadjikakou, M.; Russell, C.; Huse, O.; Bell, C.; Scrinis, G.; et al. Ultra-Processed Foods and the Nutrition Transition: Global, Regional and National Trends, Food Systems Transformations and Political Economy Drivers. Obes. Rev. 2020, 21, e13126. [Google Scholar] [CrossRef]
- Poti, J.M.; Mendez, M.A.; Ng, S.W.; Popkin, B.M. Is the Degree of Food Processing and Convenience Linked with the Nutritional Quality of Foods Purchased by US Households? Am. J. Clin. Nutr. 2015, 101, 1251–1262. [Google Scholar] [CrossRef]
- Martinez-Perez, C.; San-Cristobal, R.; Guallar-Castillon, P.; Martínez-González, M.Á.; Salas-Salvadó, J.; Corella, D.; Castañer, O.; Martinez, J.A.; Alonso-Gómez, Á.M.; Wärnberg, J.; et al. Use of Different Food Classification Systems to Assess the Association between Ultra-Processed Food Consumption and Cardiometabolic Health in an Elderly Population with Metabolic Syndrome (Predimed-plus Cohort). Nutrients 2021, 13, 2471. [Google Scholar] [CrossRef]
- Moubarac, J.-C.; Parra, D.C.; Cannon, G.; Monteiro, C.A. Food Classification Systems Based on Food Processing: Significance and Implications for Policies and Actions: A Systematic Literature Review and Assessment. Curr. Obes. Rep. 2014, 3, 256–272. [Google Scholar] [CrossRef] [PubMed]
- Bleiweiss-Sande, R.; Chui, K.; Evans, E.W.; Goldberg, J.; Amin, S.; Sacheck, J. Robustness of Food Processing Classification Systems. Nutrients 2019, 11, 1344. [Google Scholar] [CrossRef] [PubMed]
- De Araújo, T.P.; De Moraes, M.M.; Afonso, C.; Santos, C.; Rodrigues, S.S.P. Food Processing: Comparison of Different Food Classification Systems. Nutrients 2022, 14, 729. [Google Scholar] [CrossRef] [PubMed]
- Sadler, C.R.; Grassby, T.; Hart, K.; Raats, M.; Sokolović, M.; Timotijevic, L. Processed Food Classification: Conceptualisation and Challenges. Trends Food Sci. Technol. 2021, 112, 149–162. [Google Scholar] [CrossRef]
- Hall, K.D.; Ayuketah, A.; Brychta, R.; Cai, H.; Cassimatis, T.; Chen, K.Y.; Chung, S.T.; Costa, E.; Courville, A.; Darcey, V.; et al. Ultra-Processed Diets Cause Excess Calorie Intake and Weight Gain: An Inpatient Randomized Controlled Trial of Ad Libitum Food Intake. Cell Metab. 2019, 30, 67–77.e3. [Google Scholar] [CrossRef]
- Ristic, D.; Bender, D.; Jaeger, H.; Heinz, V.; Smetana, S. Towards a Definition of Food Processing: Conceptualization and Relevant Parameters. Food Prod. Process. Nutr. 2024, 6, 79. [Google Scholar] [CrossRef]
- Gibney, M.J.; Forde, C.G. Nutrition Research Challenges for Processed Food and Health. Nat. Food 2022, 3, 4–109. [Google Scholar] [CrossRef]
- Dima, C.; Assadpour, E.; Dima, S.; Jafari, S.M. Bioavailability of Nutraceuticals: Role of the Food Matrix, Processing Conditions, the Gastrointestinal Tract, and Nanodelivery Systems. Compr. Rev. Food Sci. Food Saf. 2020, 19, 954–994. [Google Scholar] [CrossRef]
- Lane, M.M.; Gamage, E.; Du, S.; Ashtree, D.N.; McGuinness, A.J.; Gauci, S.; Baker, P.; Lawrence, M.; Rebholz, C.M.; Srour, B.; et al. Ultra-Processed Food Exposure and Adverse Health Outcomes: Umbrella Review of Epidemiological Meta-Analyses. Bmj 2024, 384, e077310. [Google Scholar] [CrossRef]
- Fardet, A. Characterization of the Degree of Food Processing in Relation With Its Health Potential and Effects. Adv. Food Nutr. Res. 2018, 85, 79–129. [Google Scholar] [CrossRef]
- Anastasiou, K.; Baker, P.; Hadjikakou, M.; Hendrie, G.A.; Lawrence, M. A Conceptual Framework for Understanding the Environmental Impacts of Ultra-Processed Foods and Implications for Sustainable Food Systems. J. Clean. Prod. 2022, 368, 133155. [Google Scholar] [CrossRef]
- Garzillo, J.M.F.; Poli, V.F.S.; Leite, F.H.M.; Steele, E.M.; Machado, P.P.; da Costa Louzada, M.L.; Levy, R.B.; Monteiro, C.A. Ultra-Processed Food Intake and Diet Carbon and Water Footprints: A National Study in Brazil. Rev. Saude Publica 2022, 56, 6. [Google Scholar] [CrossRef] [PubMed]
- Tompa, O.; Kiss, A.; Soós, S.; Lakner, Z.; Raner, A.; Kasza, G.; Szakos, D. Fifteen Years of NOVA Food-Processing Classification: “Friend or Foe” Among Sustainable Diet Indicators? A Scoping Review. Nutr. Rev. 2025, 83, 771–791. [Google Scholar] [CrossRef] [PubMed]
- FAO/WHO Codex Alimentarius International Food Stamdards. Guidlines of Nutritional International Standards. Available online: https://www.fao.org/fao-who-codexalimentarius/sh-proxy/tr/?lnk=1&url=https%253A%252F%252Fworkspace.fao.org%252Fsites%252Fcodex%252FStandards%252FCXG%2B2-1985%252FCXG_002e.pdf (accessed on 1 May 2025).
- Julia, C.; Baudry, J.; Fialon, M.; Hercberg, S.; Galan, P.; Srour, B.; Andreeva, V.A.; Touvier, M.; Kesse-Guyot, E. Respective Contribution of Ultra-Processing and Nutritional Quality of Foods to the Overall Diet Quality: Results from the NutriNet-Santé Study. Eur. J. Nutr. 2023, 62, 157–164. [Google Scholar] [CrossRef]
- Romero Ferreiro, C.; Lora Pablos, D.; Gómez de la Cámara, A. Two Dimensions of Nutritional Value: Nutri-Score and Nova. Nutrients 2021, 13, 2783. [Google Scholar] [CrossRef]
- Barrett, E.M.; Shi, P.; Blumberg, J.B.; O’Hearn, M.; Micha, R.; Mozaffarian, D. Food Compass 2.0 Is an Improved Nutrient Profiling System to Characterize Healthfulness of Foods and Beverages. Nat. Food 2024, 5, 911–915. [Google Scholar] [CrossRef]
- Drewnowski, A. Matters Arising: Food Compass Novelty and NOVA Category Assignments. Nat. Food 2022, 3, 581–583. [Google Scholar] [CrossRef]
- Jürkenbeck, K. The Effect of Information among Established and New Sustainability Labelling on Consumers’ Preference and Willingness to Pay. Clean. Responsible Consum. 2023, 10, 100131. [Google Scholar] [CrossRef]
- Fretes, G.; Wilson, N.L.W.; Corvalan, C.; Economos, C.D.; Cash, S.B. Front-of-Pack Labels and Young Consumers: An Experimental Investigation of Nutrition and Sustainability Claims in Chile. Food Qual. Prefer. 2025, 127, 105432. [Google Scholar] [CrossRef]
- Marette, S. Ecological and/or Nutritional Scores for Food Traffic-lights: Results of an Online Survey Conducted on Pizza in France. Sustainability 2022, 14, 247. [Google Scholar] [CrossRef]
- Andreani, G.; Sogari, G.; Wongprawmas, R.; Menozzi, D.; Mora, C. Nutri-Score and Eco-Score Labeling: A Systematic Review of Their Impact on Consumer Understanding, Attitudes, and Behaviors. Food Rev. Int. 2025, 41, 1981–2005. [Google Scholar] [CrossRef]
- Biondi, B.; Camanzi, L. Nutrition, Hedonic or Environmental? The Effect of Front-of-Pack Messages on Consumers’ Perception and Purchase Intention of a Novel Food Product with Multiple Attributes. Food Res. Int. 2020, 130, 108962. [Google Scholar] [CrossRef] [PubMed]
- Valenzuela, A.; Zambrano, L.; Velásquez, R.; Groff, C.; Apablaza, T.; Riffo, C.; Moldenhauer, S.; Brisso, P.; Leonario-Rodriguez, M. Discrepancy between Food Classification Systems: Evaluation of Nutri-Score, NOVA Classification and Chilean Front-of-Package Food Warning Labels. Int. J. Environ. Res. Public Health 2022, 19, 14631. [Google Scholar] [CrossRef] [PubMed]
- Vermeir, I.; Weijters, B.; De Houwer, J.; Geuens, M.; Slabbinck, H.; Spruyt, A.; Van Kerckhove, A.; Van Lippevelde, W.; De Steur, H.; Verbeke, W. Environmentally Sustainable Food Consumption: A Review and Research Agenda From a Goal-Directed Perspective. Front. Psychol. 2020, 11, 1603. [Google Scholar] [CrossRef]
- Zupo, R.; Castellana, F.; Piscitelli, P.; Crupi, P.; Desantis, A.; Greco, E.; Severino, F.P.; Pulimeno, M.; Guazzini, A.; Kyriakides, T.C.; et al. Scientific Evidence Supporting the Newly Developed One-Health Labeling Tool “Med-Index”: An Umbrella Systematic Review on Health Benefits of Mediterranean Diet Principles and Adherence in a Planeterranean Perspective. J. Transl. Med. 2023, 21, 755. [Google Scholar] [CrossRef]
- Lisa Clodoveo, M.; Tarsitano, E.; Crupi, P.; Pasculli, L.; Piscitelli, P.; Miani, A.; Corbo, F. Towards a New Food Labelling System for Sustainable Food Production and Healthy Responsible Consumption: The Med Index Checklist. J. Funct. Foods 2022, 98, 105277. [Google Scholar] [CrossRef]
- OECD. Health at a Glance 2023: EOCD Indicators; OECD: Paris, France, 2023; ISBN 9781000870596. [Google Scholar]
Disclaimer/Publisher’s Note: The statements, opinions and data contained in all publications are solely those of the individual author(s) and contributor(s) and not of MDPI and/or the editor(s). MDPI and/or the editor(s) disclaim responsibility for any injury to people or property resulting from any ideas, methods, instructions or products referred to in the content. |
© 2025 by the authors. Licensee MDPI, Basel, Switzerland. This article is an open access article distributed under the terms and conditions of the Creative Commons Attribution (CC BY) license (https://creativecommons.org/licenses/by/4.0/).
Share and Cite
Muzzioli, L.; Maddaloni, L.; Pintavalle, M.; Poggiogalle, E.; Di Vincenzo, O.; Migliaccio, S.; Vinci, G.; Donini, L.M. Toward Multidimensional Front-of-Pack Labels: Integrating Nutritional, Environmental, and Processing Information. Nutrients 2025, 17, 2258. https://doi.org/10.3390/nu17142258
Muzzioli L, Maddaloni L, Pintavalle M, Poggiogalle E, Di Vincenzo O, Migliaccio S, Vinci G, Donini LM. Toward Multidimensional Front-of-Pack Labels: Integrating Nutritional, Environmental, and Processing Information. Nutrients. 2025; 17(14):2258. https://doi.org/10.3390/nu17142258
Chicago/Turabian StyleMuzzioli, Luca, Lucia Maddaloni, Maria Pintavalle, Eleonora Poggiogalle, Olivia Di Vincenzo, Silvia Migliaccio, Giuliana Vinci, and Lorenzo Maria Donini. 2025. "Toward Multidimensional Front-of-Pack Labels: Integrating Nutritional, Environmental, and Processing Information" Nutrients 17, no. 14: 2258. https://doi.org/10.3390/nu17142258
APA StyleMuzzioli, L., Maddaloni, L., Pintavalle, M., Poggiogalle, E., Di Vincenzo, O., Migliaccio, S., Vinci, G., & Donini, L. M. (2025). Toward Multidimensional Front-of-Pack Labels: Integrating Nutritional, Environmental, and Processing Information. Nutrients, 17(14), 2258. https://doi.org/10.3390/nu17142258