
Why Do We Eat Comfort Food? Exploring Expectations Regarding Comfort Food and Their Relationship with Comfort Eating Frequency

Abstract
1. Introduction
2. Materials and Methods
2.1. Participants
2.2. Materials and Procedure
2.3. Statistical Analysis
3. Results
3.1. Primary Comfort Food
3.2. Frequency of Eating Comfort Food
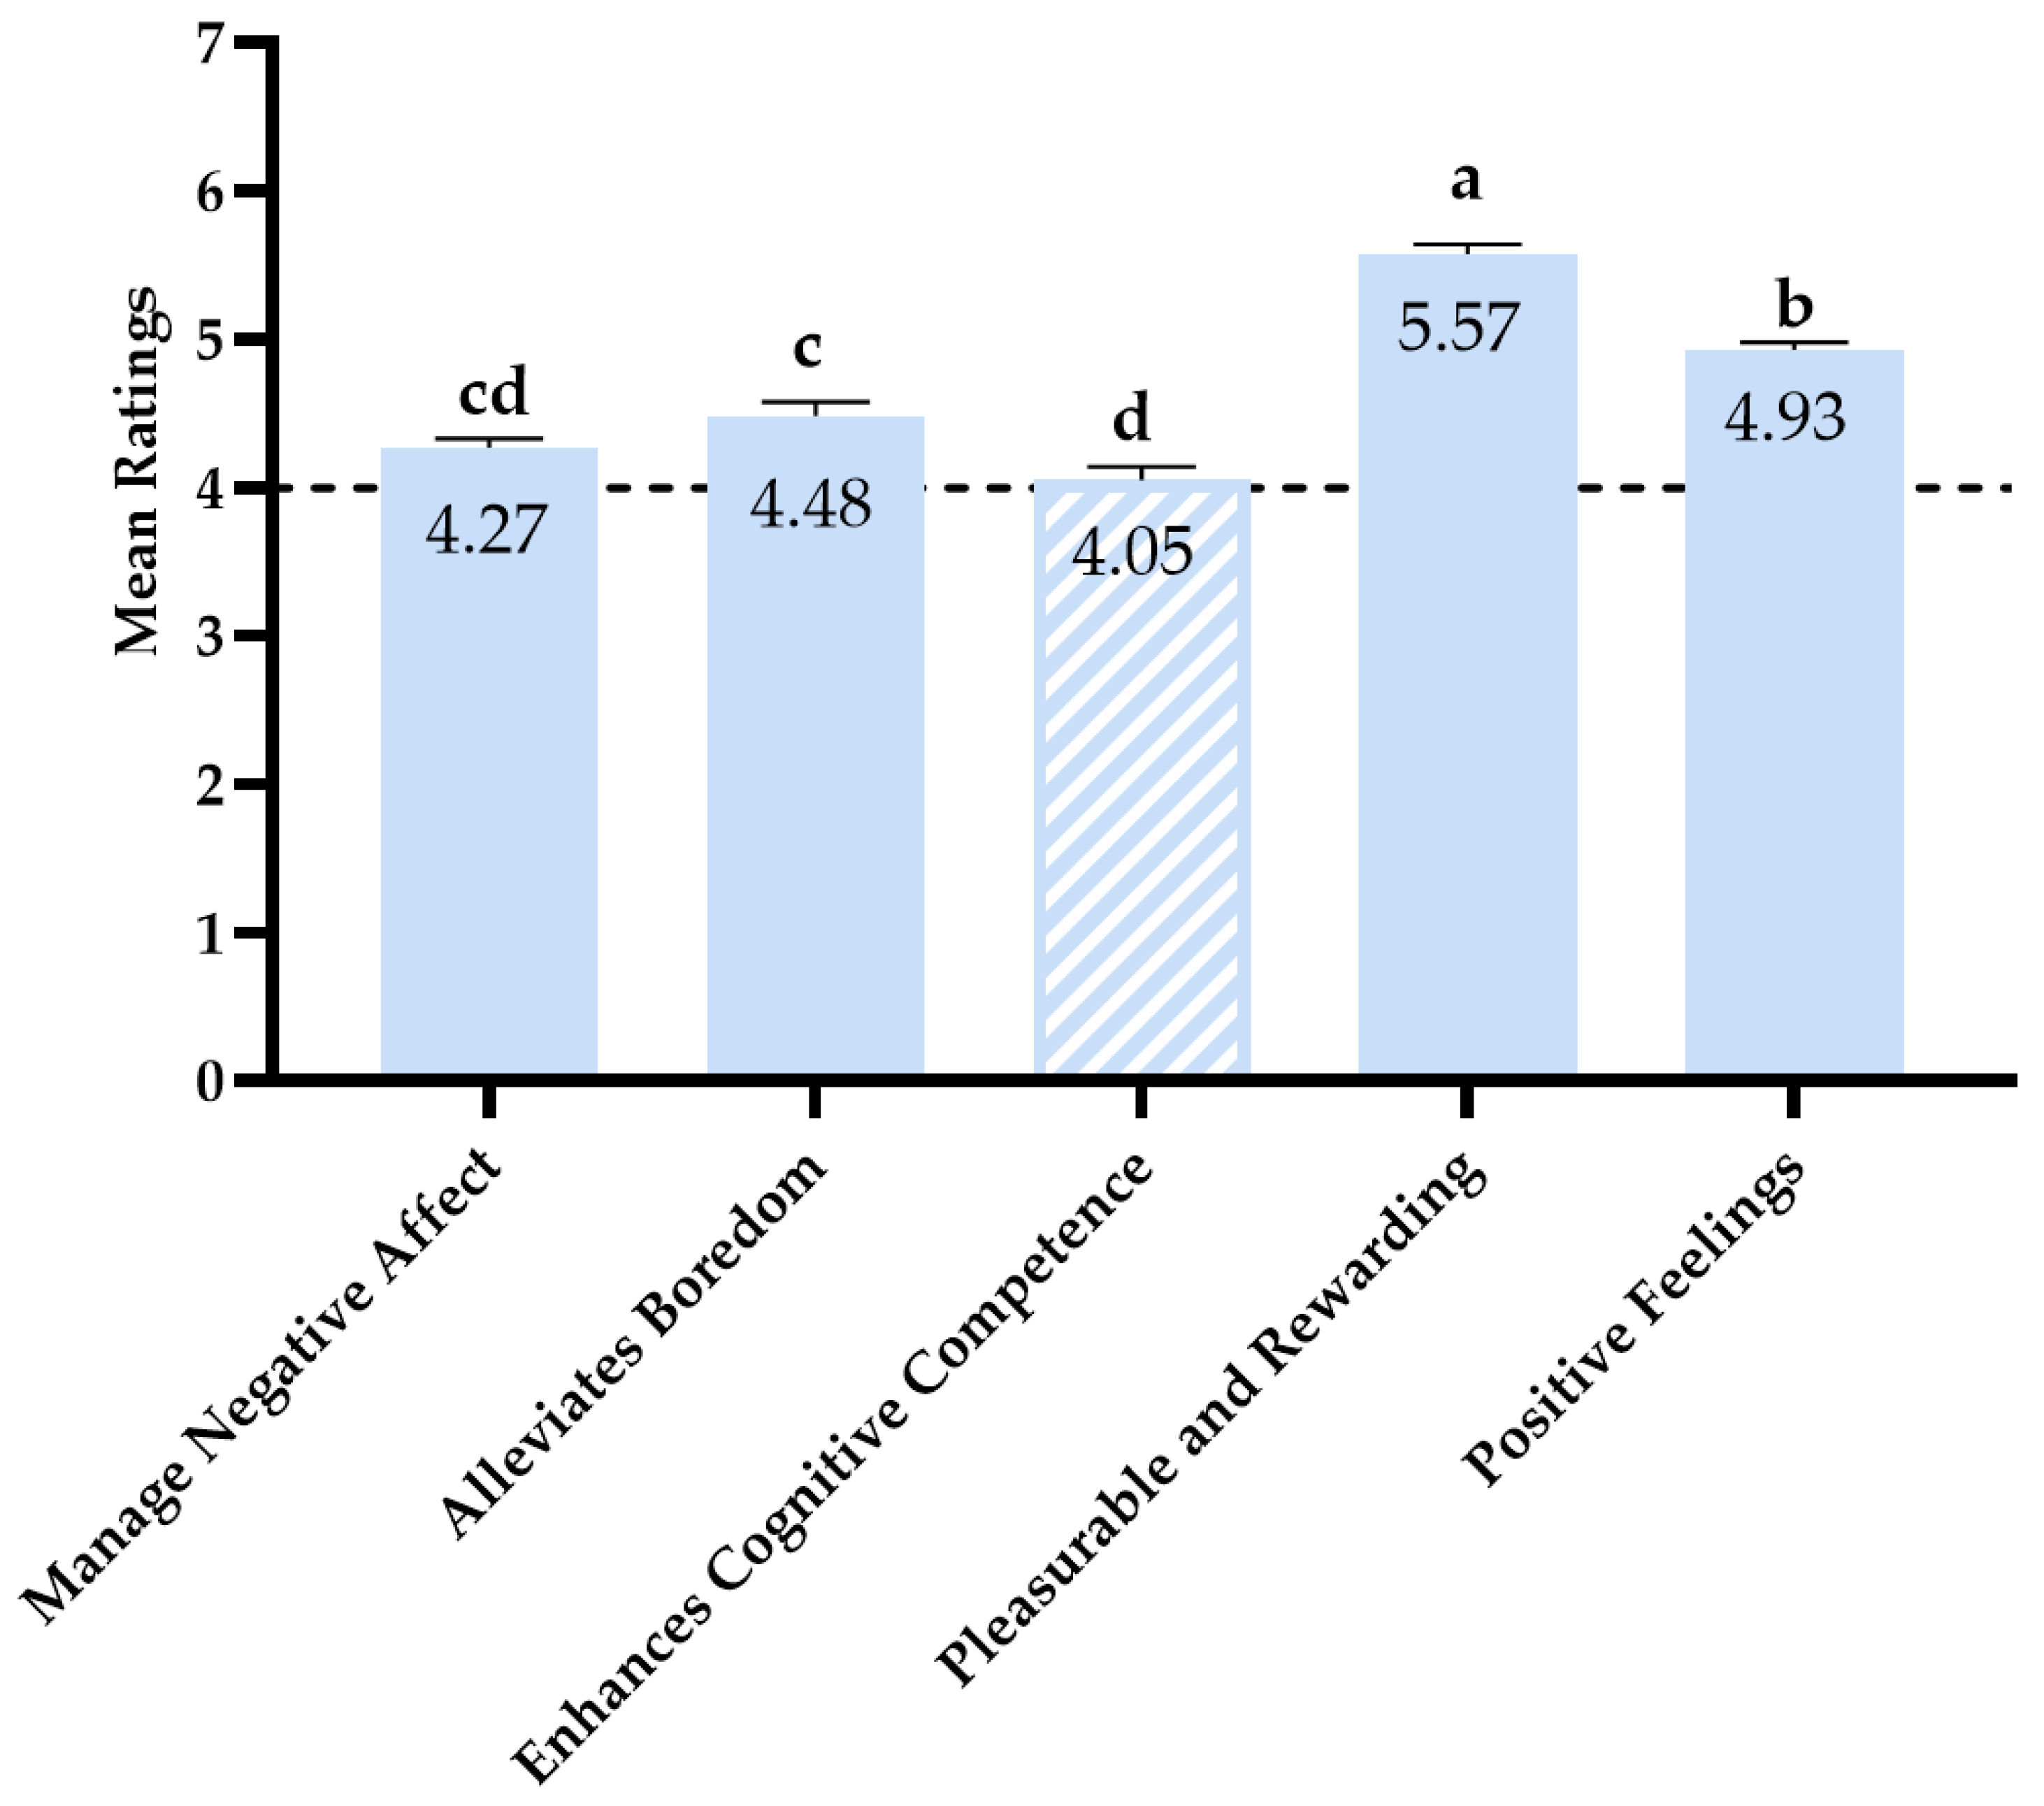
3.3. Ratings on Expectation Subscales
3.4. Correlation
3.5. Regression
4. Discussion
5. Conclusions
Author Contributions
Funding
Institutional Review Board Statement
Informed Consent Statement
Data Availability Statement
Conflicts of Interest
References
- Spence, C. Comfort food: A review. Int. J. Gastron. Food Sci. 2017, 9, 105–109. [Google Scholar] [CrossRef]
- Wansink, B.; Cheney, M.M.; Chan, N. Exploring comfort food preferences across age and gender. Physiol. Behav. 2003, 79, 739–747. [Google Scholar] [CrossRef] [PubMed]
- Dubé, L.; LeBel, J.L.; Lu, J. Affect asymmetry and comfort food consumption. Physiol. Behav. 2005, 86, 559–567. [Google Scholar] [CrossRef] [PubMed]
- Finch, L.E.; Tomiyama, A.J. Comfort eating, psychological stress, and depressive symptoms in young adult women. Appetite 2015, 95, 239–244. [Google Scholar] [CrossRef] [PubMed]
- Wagner, H.S.; Ahlstrom, B.; Redden, J.P.; Vickers, Z.; Mann, T. The myth of comfort food. Health Psychol. 2014, 33, 1552–1557. [Google Scholar] [CrossRef]
- Soffin, M.T.; Batsell, W.R., Jr. Towards a situational taxonomy of comfort foods: A retrospective analysis. Appetite 2019, 137, 152–162. [Google Scholar] [CrossRef]
- Macht, M.; Mueller, J. Immediate effects of chocolate on experimentally induced mood states. Appetite 2007, 49, 667–674. [Google Scholar] [CrossRef]
- Standen, E.C.; Finch, L.E.; Tiongco-Hofschneider, L.; Schopp, E.; Lee, K.M.; Parker, J.E.; Bamishigbin, O.N.; Tomiyama, A.J. Healthy versus unhealthy comfort eating for psychophysiological stress recovery in low-income Black and Latinx adults. Appetite 2022, 176, 106140. [Google Scholar] [CrossRef]
- Finch, L.E.; Cummings, J.R.; Tomiyama, A.J. Cookie or clementine? Psychophysiological stress reactivity and recovery after eating healthy and unhealthy comfort foods. Psychoneuroendocrinology 2019, 107, 26–36. [Google Scholar] [CrossRef]
- Privitera, G.J.; Welling, D.; Tejada, G.; Sweazy, N.; Cuifolo, K.N.; King-Shepard, Q.W.; Doraiswamy, P.M. No calorie comfort: Viewing and drawing “comfort foods” similarly augment positive mood for those with depression. J. Health Psychol. 2018, 23, 598–607. [Google Scholar] [CrossRef]
- Troisi, J.D.; Gabriel, S. Chicken soup really is good for the soul: “Comfort food” fulfills the need to belong. Psychol. Sci. 2011, 22, 747–753. [Google Scholar] [CrossRef] [PubMed]
- Goubet, K.E.; Chrysikou, E.G. Emotion regulation flexibility: Gender differences in context sensitivity and repertoire. Front. Psychol. 2019, 10, 935. [Google Scholar] [CrossRef] [PubMed]
- Zlomke, K.R.; Hahn, K.S. Cognitive emotion regulation strategies: Gender differences and associations to worry. Personal. Individ. Differ. 2010, 48, 408–413. [Google Scholar] [CrossRef]
- Flynn, J.J.; Hollenstein, T.; Mackey, A. The effect of suppressing and not accepting emotions on depressive symptoms: Is suppression different for men and women? Personal. Individ. Differ. 2010, 49, 582–586. [Google Scholar] [CrossRef]
- Goldman, M.S.; Del Boca, F.K.; Darkes, J. Alcohol expectancy theory: The application of cognitive neuroscience. In Psychological Theories of Drinking and Alcoholism, 2nd ed.; The Guilford Substance Abuse Series; The Guilford Press: New York, NY, USA, 1999; pp. 203–246. [Google Scholar]
- Cummings, J.R.; Joyner, M.A.; Gearhardt, A.N. Development and preliminary validation of the Anticipated Effects of Food Scale. Psychol. Addict. Behav. 2020, 34, 403–413. [Google Scholar] [CrossRef]
- Montes, K.S.; Witkiewitz, K.; Pearson, M.R.; Leventhal, A.M. Alcohol, tobacco, and marijuana expectancies as predictors of substance use initiation in adolescence: A longitudinal examination. Psychol. Addict. Behav. 2019, 33, 26–34. [Google Scholar] [CrossRef]
- Morean, M.E.; Corbin, W.R.; Treat, T.A. The Anticipated Effects of Alcohol Scale: Development and psychometric evaluation of a novel assessment tool for measuring alcohol expectancies. Psychol. Assess. 2012, 24, 1008–1023. [Google Scholar] [CrossRef]
- Sharkansky, E.J.; Finn, P.R. Effects of outcome expectancies and disinhibition on ad lib alcohol consumption. J. Stud. Alcohol 1998, 59, 198–206. [Google Scholar] [CrossRef]
- McMahon, J.; Jones, B.T.; O’Donnell, P. Comparing positive and negative alcohol expectancies in male and female social drinkers. Addict. Res. 1994, 1, 349–365. [Google Scholar] [CrossRef]
- Creamer, M.R.; Delk, J.; Case, K.; Perry, C.L.; Harrell, M.B. Positive outcome expectations and tobacco product use behaviors in youth. Subst. Use Misuse 2018, 53, 1399–1402. [Google Scholar] [CrossRef]
- Parker, M.N.; Wilkinson, M.L.; Hunt, R.A.; Ortiz, A.; Manasse, S.M.; Juarascio, A.S. Eating expectancies and hedonic hunger among individuals with bulimia-spectrum eating disorders who plan binge-eating episodes. Int. J. Eat. Disord. 2022, 55, 120–124. [Google Scholar] [CrossRef] [PubMed]
- Hayaki, J.; Free, S. Positive and negative eating expectancies in disordered eating among women and men. Eat. Behav. 2016, 22, 22–26. [Google Scholar] [CrossRef] [PubMed]
- Combs, J.L.; Smith, G.T.; Simmons, J.R. Distinctions between two expectancies in the prediction of maladaptive eating behavior. Personal. Individ. Differ. 2011, 50, 25–30. [Google Scholar] [CrossRef] [PubMed]
- Hohlstein, L.A.; Smith, G.T.; Atlas, J.G. An application of expectancy theory to eating disorders: Development and validation of measures of eating and dieting expectancies. Psychol. Assess. 1998, 10, 49–58. [Google Scholar] [CrossRef]
- Adler, N.E.; Epel, E.S.; Castellazzo, G.; Ickovics, J.R. Relationship of subjective and objective social status with psychological and physiological functioning: Preliminary data in healthy, White women. Health Psychol. 2000, 19, 586–592. [Google Scholar] [CrossRef]
- Hoaglin, D.C.; Iglewicz, B. Fine-tuning some resistant rules for outlier labeling. J. Am. Stat. Assoc. 1987, 82, 1147–1149. [Google Scholar] [CrossRef]
- Boneau, C.A. The effects of violations of assumptions underlying the t test. Psychol. Bull. 1960, 57, 49–64. [Google Scholar] [CrossRef]
- Schmider, E.; Ziegler, M.; Danay, E.; Beyer, L.; Bühner, M. Is it really robust? Reinvestigating the robustness of ANOVA against violations of the normal distribution assumption. Methodol. Eur. J. Res. Methods Behav. Soc. Sci. 2010, 6, 147–151. [Google Scholar] [CrossRef]
- Locher, J.L.; Yoels, W.C.; Donna, M.; van Ells, J. Comfort foods: An exploratory journey into the social and emotional significance of food. Food Foodways 2005, 13, 273–297. [Google Scholar] [CrossRef]
- Hepper, E.G.; Wildschut, T.; Sedikides, C.; Ritchie, T.D.; Yung, Y.F.; Hansen, N.; Abakoumkin, G.; Arikan, G.; Cisek, S.Z.; Demassosso, D.B.; et al. Pancultural nostalgia: Prototypical conceptions across cultures. Emotion 2014, 14, 733–747. [Google Scholar] [CrossRef]
- Zhou, X.; van Tilburg, W.A.P.; Mei, D.; Wildschut, T.; Sedikides, C. Hungering for the past: Nostalgic food labels increase purchase intentions and actual consumption. Appetite 2019, 140, 151–158. [Google Scholar] [CrossRef] [PubMed]
- Hulsken, S.; Märtin, A.; Mohajeri, M.H.; Homberg, J.R. Food-derived serotonergic modulators: Effects on mood and cognition. Nutr. Res. Rev. 2013, 26, 223–234. [Google Scholar] [CrossRef] [PubMed]
- Dallman, M.F.; Pecoraro, N.; Akana, S.F.; La Fleur, S.E.; Gomez, F.; Houshyar, H.; Bell, M.E.; Bhatnagar, S.; Laugero, K.D.; Manalo, S. Chronic stress and obesity: A new view of “comfort food”. Proc. Natl. Acad. Sci. USA 2003, 100, 11696–11701. [Google Scholar] [CrossRef] [PubMed]
- Abramson, E.E.; Stinson, S.G. Boredom and eating in obese and non-obese individuals. Addict. Behav. 1977, 2, 181–185. [Google Scholar] [CrossRef]
- Havermans, R.C.; Vancleef, L.; Kalamatianos, A.; Nederkoorn, C. Eating and inflicting pain out of boredom. Appetite 2015, 85, 52–57. [Google Scholar] [CrossRef]
- Aulbach, M.B.; Bamberg, C.; Reichenberger, J.; Arend, A.K.; Blechert, J. Taming “hanger” and falling prey to boredom-emotional and stress-eating in 801 healthy individuals using ecological momentary assessment. Appetite 2025, 207, 107897. [Google Scholar] [CrossRef]
- Macht, M.; Haupt, C.; Ellgring, H. The perceived function of eating is changed during examination stress: A field study. Eat. Behav. 2005, 6, 109–112. [Google Scholar] [CrossRef]
- Rief, W.; Hofmann, S.G.; Nestoriuc, Y. The power of expectation: Understanding the placebo and nocebo Phenomenon. Soc. Personal. Psychol. Compass 2008, 2, 1624–1637. [Google Scholar] [CrossRef]
- Petrie, K.J.; Weinman, J.; Sharpe, N.; Buckley, J. Role of patients’ view of their illness in predicting return to work and functioning after myocardial infarction: Longitudinal study. BMJ 1996, 312, 1191–1194. [Google Scholar] [CrossRef]
- Ong, L.S.; H, I.J.; Leung, A.K. Is comfort food really good for the soul? A replication of Troisi and Gabriel’s (2011) Study 2. Front. Psychol. 2015, 6, 314. [Google Scholar] [CrossRef]
- Gemesi, K.; Holzmann, S.L.; Kaiser, B.; Wintergerst, M.; Lurz, M.; Groh, G.; Böhm, M.; Krcmar, H.; Gedrich, K.; Hauner, H.; et al. Stress eating: An online survey of eating behaviours, comfort foods, and healthy food substitutes in German adults. BMC Public Health 2022, 22, 391. [Google Scholar] [CrossRef]

| Rank | Primary Comfort Food | Category | Frequency |
|---|---|---|---|
| 1 | chocolate | Sweet | 52 |
| 2 | chips or crisps | Savory | 35 |
| 3 | sweet bakery | Sweet | 17 |
| 4 | pizza | Savory | 15 |
| 5 | noodles or pasta | Savory | 13 |
| 6 | ice cream | Sweet | 12 |
| 7 | chicken dishes | Savory | 10 |
| 8 | biscuits or cookies | Sweet | 8 |
| 9 | bread or toast | Savory | 7 |
| 9 | cheese | Savory | 7 |
| 9 | potato dishes | Savory | 7 |
| 10 | burger | Savory | 4 |
| Reasons | Frequency | Percentage |
|---|---|---|
| It’s the comfort food I eat most often. | 169 | 78.97% |
| It’s the easiest comfort food for me to obtain. | 101 | 47.20% |
| It comforts me in various situations or moods. | 81 | 37.85% |
| It provides me with the strongest sense of comfort. | 70 | 32.71% |
| It has the strongest sentimental meaning in my life. | 45 | 21.03% |
| It’s deeply rooted in my cultural or family traditions. | 29 | 13.55% |
| The comforting effect of this food lasts the longest. | 25 | 11.68% |
| Other | 17 | 7.94% |
| Option | Primary Comfort Food | All Comfort Foods | ||
|---|---|---|---|---|
| Number | Percentage | Number | Percentage | |
| Several times in your life | 7 | 3.27 | 7 | 3.27 |
| About once a year | 3 | 1.40 | 3 | 1.40 |
| Several times per year | 27 | 12.62 | 17 | 7.94 |
| About once a month | 62 | 28.97 | 29 | 13.55 |
| Several times per month | 46 | 21.50 | 61 | 28.50 |
| About once a week | 31 | 14.49 | 21 | 9.81 |
| Several times per week | 34 | 15.89 | 63 | 29.44 |
| Daily | 4 | 1.87 | 13 | 6.07 |
| Subscale | Men (M, SD/Mdn) | Women (M, SD/Mdn) | t-Value | p-Value | Effect Size (r) |
|---|---|---|---|---|---|
| Manage Negative Affect | M = 4.11, SD = 1.02 | M = 4.43, SD = 0.82 | t(200.20) = −2.52 | p = 0.013 | r = 0.175 |
| Alleviates Boredom | M = 4.30, SD = 1.34 | M = 4.68, SD = 1.44 | t(211) = −1.985 | p = 0.048 | r = 0.136 |
| Enhances Cognitive Competence | M = 4.03, SD = 1.38 | M = 4.07, SD = 1.37 | t(211) = −0.222 | p = 0.825 | r = 0.015 |
| Positive Feelings | M = 4.99, SD = 0.80 | M = 4.87, SD = 0.76 | t(211) = 1.151 | p = 0.251 | r = 0.079 |
| Pleasurable and Rewarding | M = 5.45, SD = 0.96 | M = 5.69, SD = 0.93 | t(211) = −1.860 | p = 0.064 | r = 0.127 |
| Primary Comfort Food in the Last Two Weeks | Typical Frequency of Primary Comfort Food | All Comfort Food in the Last Two Weeks | Typical Frequency of All Comfort Food | |
|---|---|---|---|---|
| Manage Negative Affect | 0.245 *** | 0.270 *** | 0.273 *** | 0.265 *** |
| Alleviates Boredom | 0.378 *** | 0.355 *** | 0.275 *** | 0.268 *** |
| Enhances Cognitive Competence | 0.320 *** | 0.306 *** | 0.145 * | 0.143 * |
| Pleasurable and Rewarding | 0.010 | 0.033 | 0.102 | 0.090 |
| Positive Feelings | 0.108 | 0.148 * | 0.146 * | 0.150 * |
| Subscale | β | t | p |
|---|---|---|---|
| Primary comfort food in the last two weeks (log transformed) | |||
| (F(5, 208) = 11.03, p < 0.001, Adjusted R2 = 0.19) | |||
| Manage Negative Affect | 0.14 | 1.76 | 0.080 |
| Alleviates Boredom | 0.29 | 4.21 | 0.000 |
| Enhances Cognitive Competence | 0.24 | 3.18 | 0.002 |
| Pleasurable and Rewarding | −0.15 | −2.11 | 0.036 |
| Positive Feelings | −0.06 | −0.71 | 0.479 |
| Primary comfort food in the last two weeks (outliers excluded, log transformed) | |||
| (F(5, 200) = 8.84, p < 0.001, Adjusted R2 = 0.16) | |||
| Manage Negative Affect | 0.10 | 1.16 | 0.248 |
| Alleviates Boredom | 0.27 | 3.80 | 0.000 |
| Enhances Cognitive Competence | 0.27 | 3.45 | 0.001 |
| Pleasurable and Rewarding | −0.13 | −1.76 | 0.080 |
| Positive Feelings | −0.11 | −1.21 | 0.229 |
| All comfort food in the last two weeks (log transformed) | |||
| (F(5, 208) = 5.43, p < 0.001, Adjusted R2 = 0.09) | |||
| Manage Negative Affect | 0.21 | 2.48 | 0.014 |
| Alleviates Boredom | 0.20 | 2.76 | 0.006 |
| Enhances Cognitive Competence | 0.01 | 0.09 | 0.932 |
| Pleasurable and Rewarding | −0.07 | −0.91 | 0.364 |
| Positive Feelings | 0.02 | 0.22 | 0.828 |
| All comfort food in the last two weeks (outliers excluded, log transformed) | |||
| (F(5, 200) = 5.11, p < 0.001, Adjusted R2 = 0.09) | |||
| Manage Negative Affect | 0.14 | 1.59 | 0.113 |
| Alleviates Boredom | 0.26 | 3.47 | 0.001 |
| Enhances Cognitive Competence | 0.03 | 0.34 | 0.732 |
| Pleasurable and Rewarding | −0.05 | −0.62 | 0.538 |
| Positive Feelings | −0.01 | −0.08 | 0.933 |
| Typical frequency of primary comfort food | |||
| (F(5, 208) = 9.67, p < 0.001, Adjusted R2 = 0.17) | |||
| Manage Negative Affect | 0.13 | 1.54 | 0.125 |
| Alleviates Boredom | 0.26 | 3.71 | 0.003 |
| Enhances Cognitive Competence | 0.23 | 2.98 | 0.003 |
| Pleasurable and Rewarding | −0.14 | −1.96 | 0.051 |
| Positive Feelings | 0.00 | 0.03 | 0.978 |
| Typical frequency of all comfort food | |||
| (F(5, 208) = 4.70, p < 0.001, Adjusted R2 = 0.08) | |||
| Manage Negative Affect | 0.16 | 1.88 | 0.061 |
| Alleviates Boredom | 0.20 | 2.68 | 0.008 |
| Enhances Cognitive Competence | −0.01 | −0.11 | 0.917 |
| Pleasurable and Rewarding | −0.08 | −1.08 | 0.283 |
| Positive Feelings | 0.09 | 0.97 | 0.332 |
Disclaimer/Publisher’s Note: The statements, opinions and data contained in all publications are solely those of the individual author(s) and contributor(s) and not of MDPI and/or the editor(s). MDPI and/or the editor(s) disclaim responsibility for any injury to people or property resulting from any ideas, methods, instructions or products referred to in the content. |
© 2025 by the authors. Licensee MDPI, Basel, Switzerland. This article is an open access article distributed under the terms and conditions of the Creative Commons Attribution (CC BY) license (https://creativecommons.org/licenses/by/4.0/).
Share and Cite
Wu, F.; Vartanian, L.R.; Faasse, K. Why Do We Eat Comfort Food? Exploring Expectations Regarding Comfort Food and Their Relationship with Comfort Eating Frequency. Nutrients 2025, 17, 2259. https://doi.org/10.3390/nu17142259
Wu F, Vartanian LR, Faasse K. Why Do We Eat Comfort Food? Exploring Expectations Regarding Comfort Food and Their Relationship with Comfort Eating Frequency. Nutrients. 2025; 17(14):2259. https://doi.org/10.3390/nu17142259
Chicago/Turabian StyleWu, Fei, Lenny R. Vartanian, and Kate Faasse. 2025. "Why Do We Eat Comfort Food? Exploring Expectations Regarding Comfort Food and Their Relationship with Comfort Eating Frequency" Nutrients 17, no. 14: 2259. https://doi.org/10.3390/nu17142259
APA StyleWu, F., Vartanian, L. R., & Faasse, K. (2025). Why Do We Eat Comfort Food? Exploring Expectations Regarding Comfort Food and Their Relationship with Comfort Eating Frequency. Nutrients, 17(14), 2259. https://doi.org/10.3390/nu17142259