
Exploring the Health Effects of New Additive- and Allergen-Free Reformulated Cooked Meat Products: Consumer Survey, Clinical Trial, and Perceived Satiety

 ,
,  ,
,  and
and 
Abstract

1. Introduction
2. Materials and Methods
2.1. Food Additives Questionnaire
2.2. Reformulated and Commercial Meat Products
2.3. Randomized Clinical Trial (RCT)
2.3.1. RCT Study Design and Approval
2.3.2. Participant Recruitment and Allocation
2.3.3. Participants and Random Allocation
2.3.4. Demographic and Anthropometric Assessments
2.3.5. Sample Collection and Analysis
Biochemical Parameters
Inflammatory Markers and Oxidative Stress Markers
Sample Preparation for FRAP and Short-Chain Fatty Acid Analysis
DNA Extraction and Metagenomic Sequencing
Bioinformatic Analysis
Nitrate and Nitrite Analysis
2.4. Palatability and Satiety Evaluation
2.4.1. Participants and Study Design
2.4.2. Appetite and Satiety Evaluation
2.5. Statistical Analysis
3. Results
3.1. Food Additives Survey
3.2. Clinical Trial
3.2.1. Body Composition Measurements
3.2.2. Blood and Urine Biomarkers
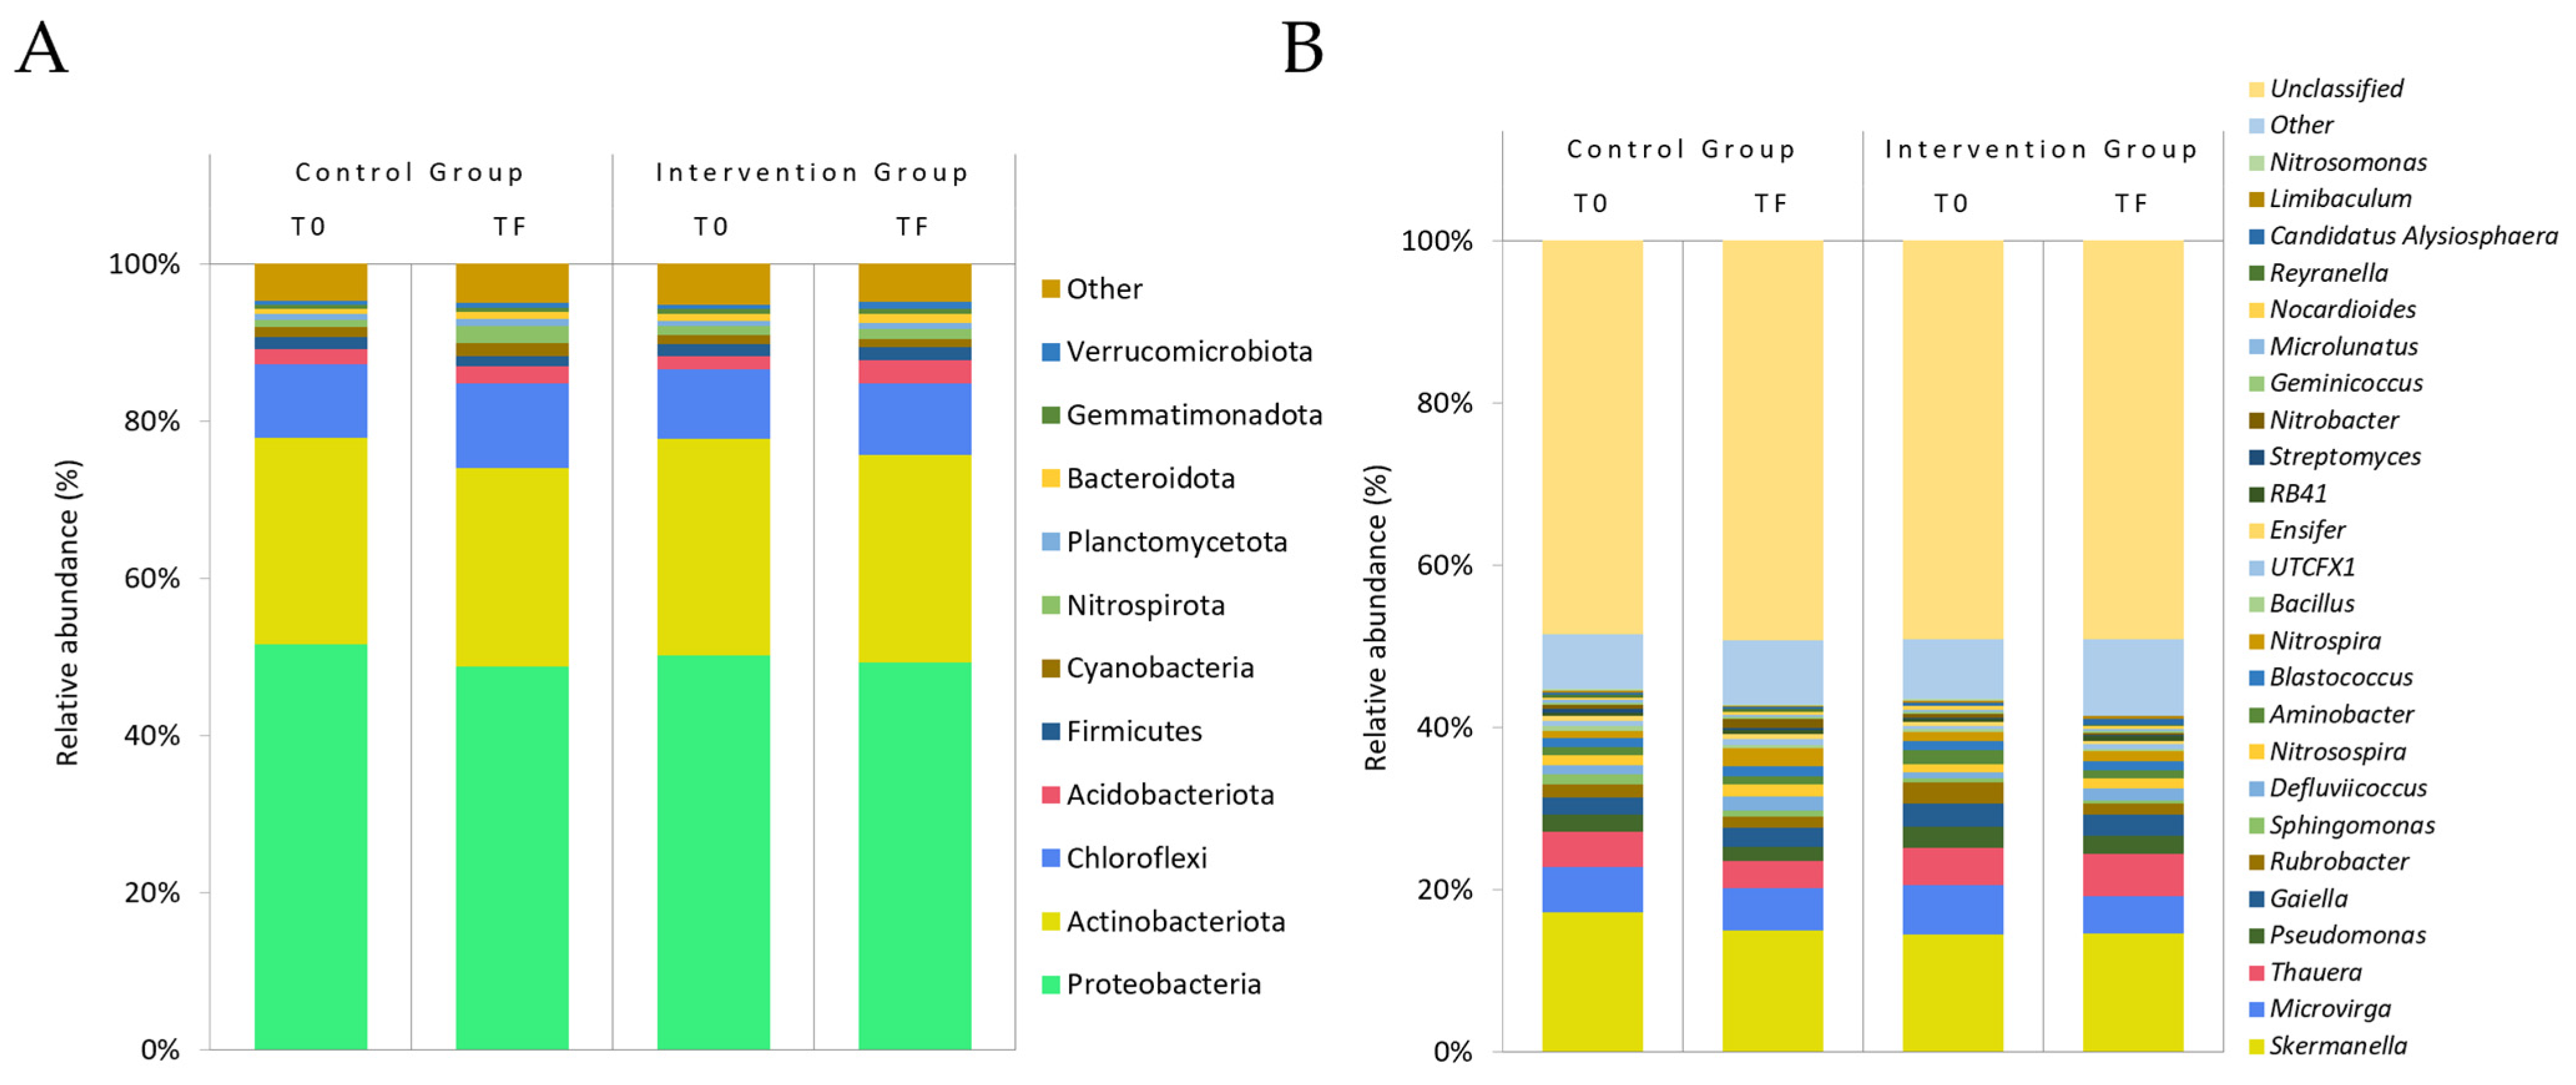
3.2.3. Gut Microbiota
Alpha and Beta Diversity
Relative Abundance
3.2.4. Faecal Markers
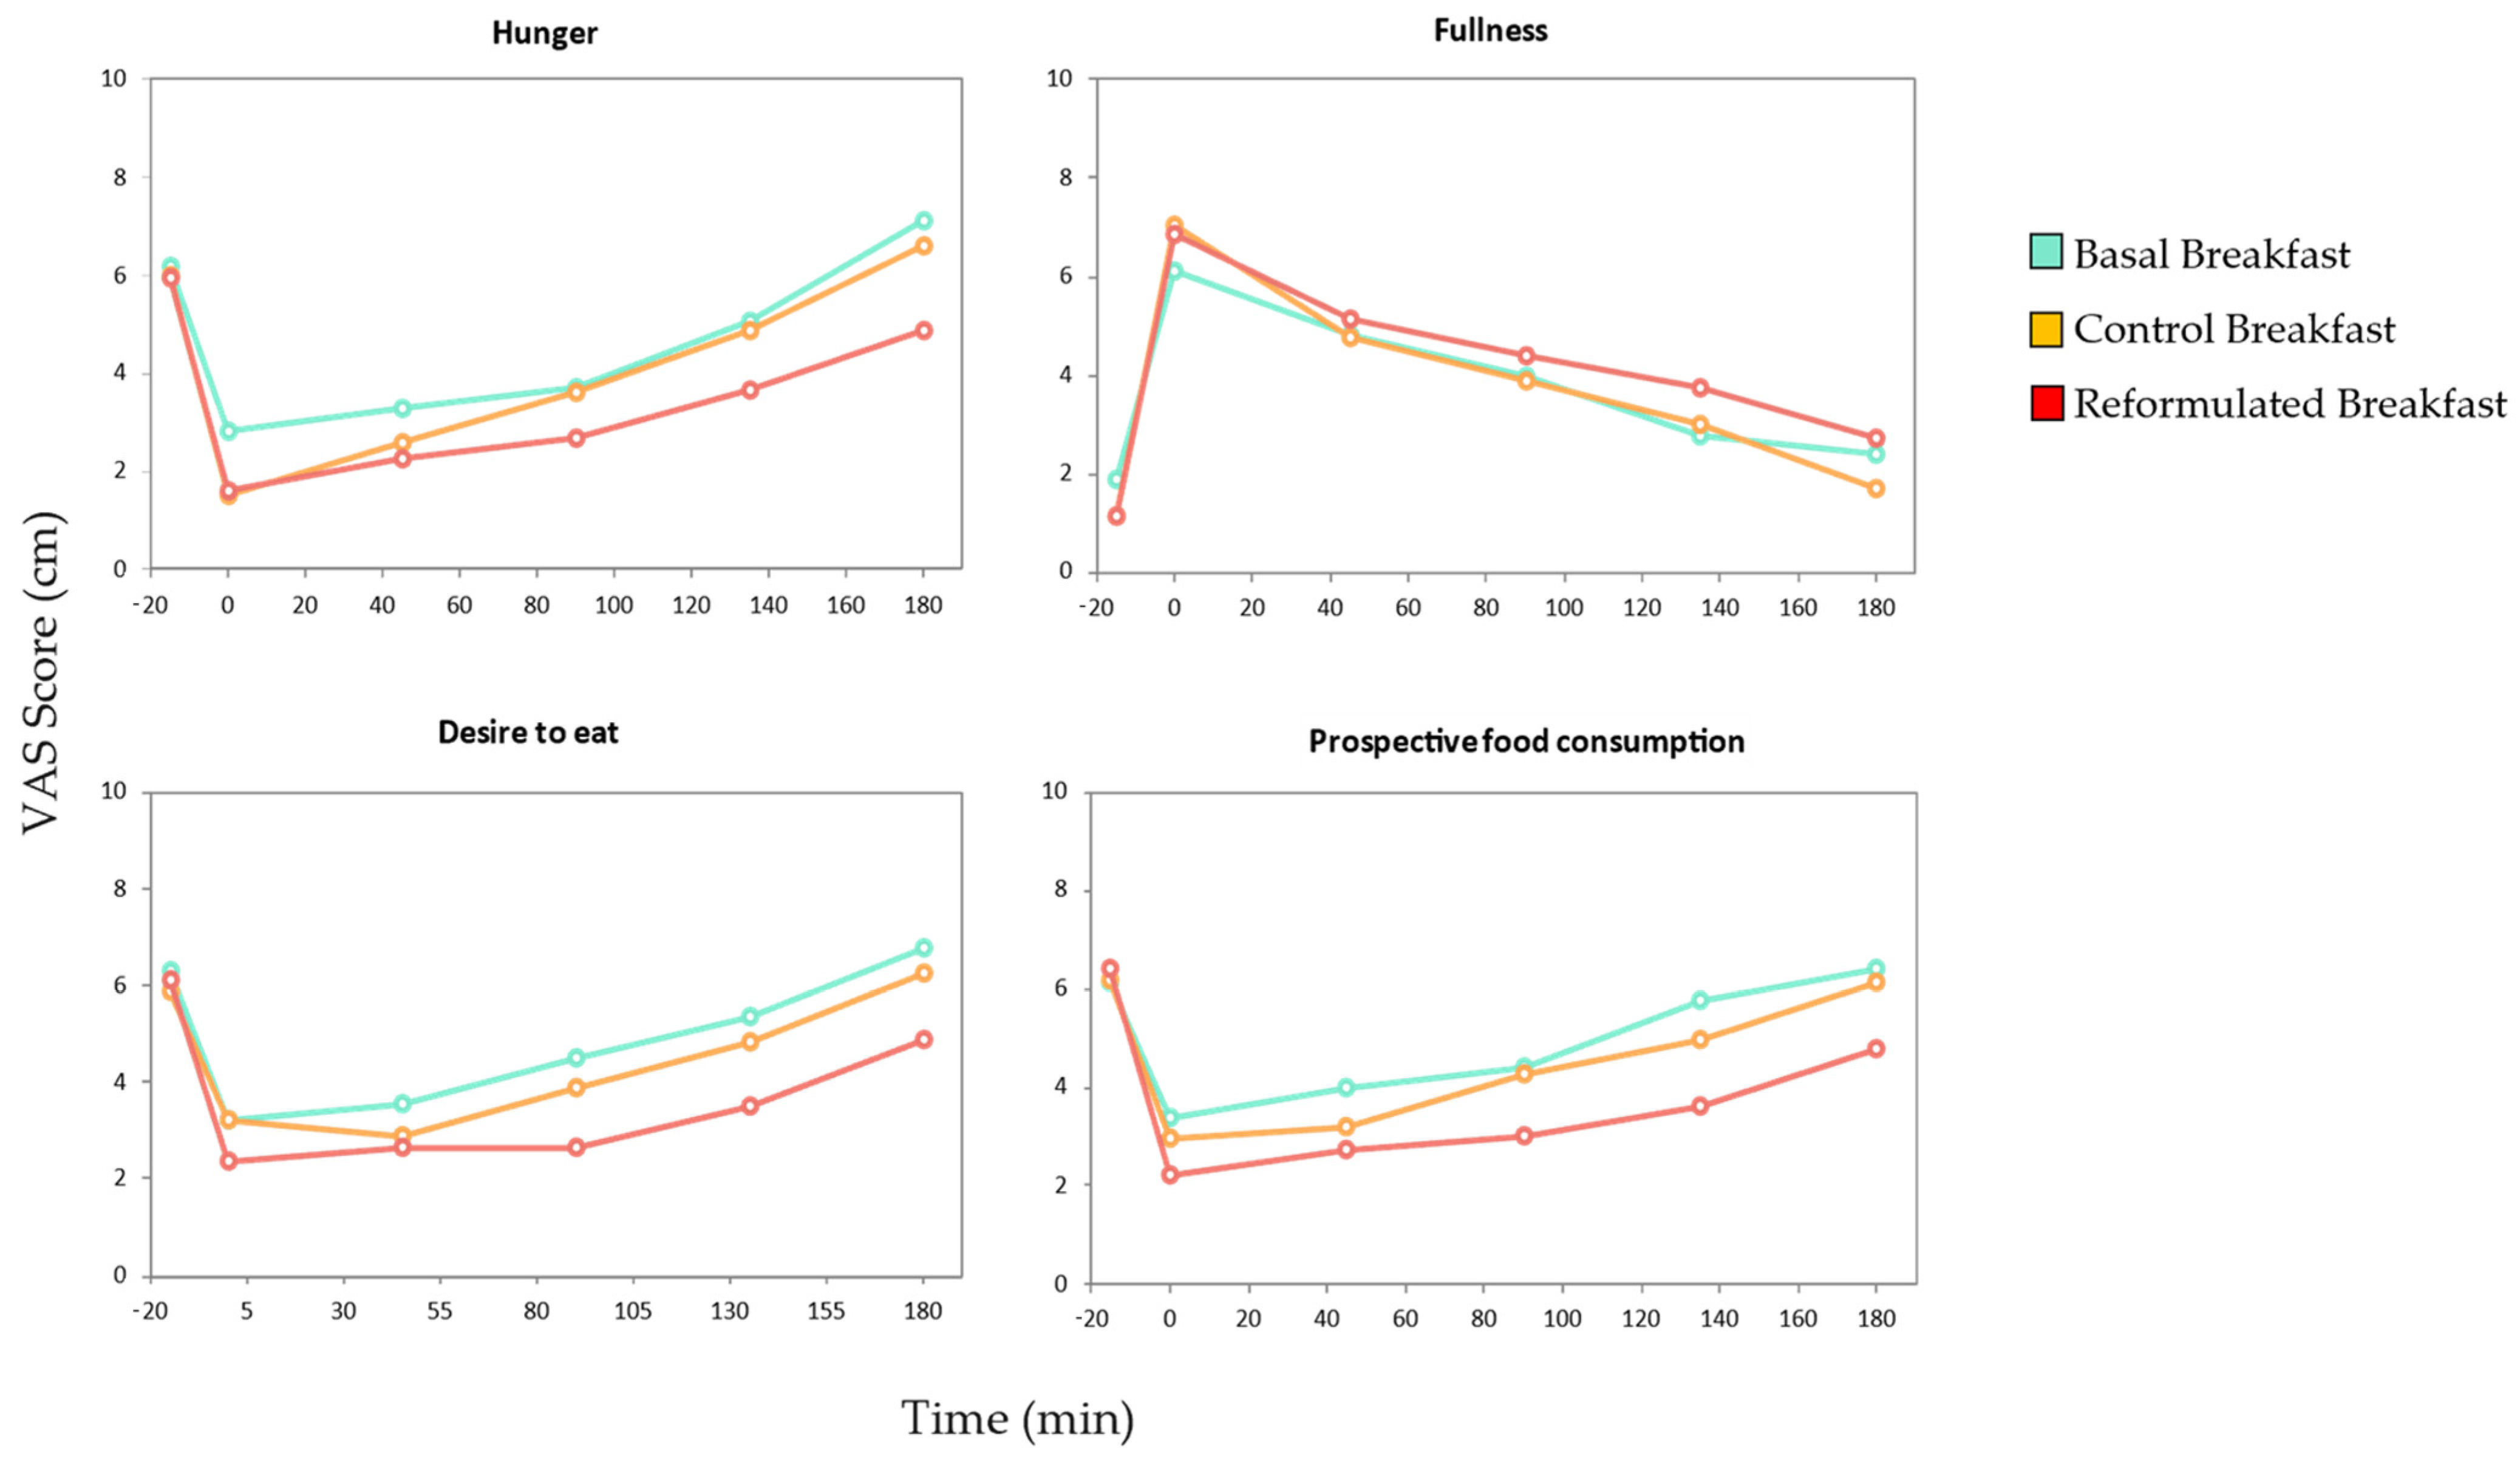
3.3. Satiety Assay
4. Discussion
5. Limitations and Strengths of This Study
6. Conclusions
Supplementary Materials
Author Contributions
Funding
Institutional Review Board Statement
Informed Consent Statement
Data Availability Statement
Conflicts of Interest
References
- Abraham, J.; A, I. Anxieties, Concerns and Facts about Meat Consumption and Health: A Short Review. J. Food Anim. Sci. 2020, 1, 66–80. [Google Scholar] [CrossRef]
- Pereira, P.M.d.C.C.; Vicente, A.F.d.R.B. Meat Nutritional Composition and Nutritive Role in the Human Diet. Meat Sci. 2013, 93, 586–592. [Google Scholar] [CrossRef] [PubMed]
- Leroy, F.; Smith, N.W.; Adesogan, A.T.; Beal, T.; Iannotti, L.; Moughan, P.J.; Mann, N. The Role of Meat in the Human Diet: Evolutionary Aspects and Nutritional Value. Anim. Front. 2023, 13, 11–18. [Google Scholar] [CrossRef] [PubMed]
- González, N.; Marquès, M.; Nadal, M.; Domingo, J.L. Meat Consumption: Which Are the Current Global Risks? A Review of Recent (2010–2020) Evidences. Food Res. Int. 2020, 137, 109341. [Google Scholar] [CrossRef]
- Harguess, J.M.; Crespo, N.C.; Hong, M.Y. Strategies to Reduce Meat Consumption: A Systematic Literature Review of Experimental Studies. Appetite 2020, 144, 104478. [Google Scholar] [CrossRef]
- Kumar, N.; Singh, A.; Sharma, D.K.; Kishore, K. Toxicity of Food Additives. In Food Safety and Human Health; Elsevier: Amsterdam, The Netherlands, 2019; pp. 67–98. [Google Scholar] [CrossRef]
- Jiang, J.; Xiong, Y.L. Natural Antioxidants as Food and Feed Additives to Promote Health Benefits and Quality of Meat Products: A Review. Meat Sci. 2016, 120, 107–117. [Google Scholar] [CrossRef]
- Laganà, P.; Avventuroso, E.; Romano, G.; Gioffré, M.E.; Patanè, P.; Parisi, S.; Moscato, U.; Delia, S. Use and Overuse of Food Additives in Edible Products: Health Consequences for Consumers. In Chemistry and Hygiene of Food Additives; Springer: Berlin/Heidelberg, Germany, 2017; pp. 39–46. [Google Scholar]
- Younes, M.; Aquilina, G.; Castle, L.; Engel, K.H.; Fowler, P.; Frutos Fernandez, M.J.; Fürst, P.; Gürtler, R.; Husøy, T.; Mennes, W.; et al. Re-Evaluation of Phosphoric Acid–Phosphates—Di-, Tri- and Polyphosphates (E 338–341, E 343, E 450–452) as Food Additives and the Safety of Proposed Extension of Use. EFSA J. 2019, 17, e05674. [Google Scholar] [CrossRef]
- Silva, M.M.; Lidon, F.C. An Overview on Applications and Side Effects of Antioxidant Food Additives. Emir. J. Food Agric. 2016, 28, 823–832. [Google Scholar] [CrossRef]
- Wu, W.; Zhou, J.; Xuan, R.; Chen, J.; Han, H.; Liu, J.; Niu, T.; Chen, H.; Wang, F. Dietary κ-Carrageenan Facilitates Gut Microbiota-Mediated Intestinal Inflammation. Carbohydr. Polym. 2022, 277, 118830. [Google Scholar] [CrossRef]
- Munyaka, P.M.; Sepehri, S.; Ghia, J.E.; Khafipour, E. Carrageenan Gum and Adherent Invasive Escherichia Coli in a Piglet Model of Inflammatory Bowel Disease: Impact on Intestinal Mucosa-Associated Microbiota. Front. Microbiol. 2016, 7, 179500. [Google Scholar] [CrossRef]
- Tobacman, J.K. Review of Harmful Gastrointestinal Effects of Carrageenan in Animal Experiments. Environ. Health Perspect. 2001, 109, 983–994. [Google Scholar] [CrossRef] [PubMed]
- Guimaraes, D.A.; Batista, R.I.M.; Tanus-Santos, J.E. Nitrate and Nitrite-Based Therapy to Attenuate Cardiovascular Remodelling in Arterial Hypertension. Basic. Clin. Pharmacol. Toxicol. 2021, 128, 9–17. [Google Scholar] [CrossRef] [PubMed]
- Deveci, G.; Tek, N.A. N-Nitrosamines: A Potential Hazard in Processed Meat Products. J. Sci. Food Agric. 2023, 104, 2551–2560. [Google Scholar] [CrossRef] [PubMed]
- Dusemund, B.; Gilbert, J.; Gott, D.; Kenigswald, H.; König, J.; Lambré, C.; Leblanc, J.C.; Mortensen, A.; Tobback, P. Food Additives and Nutrient Sources Added to Food: Developments since the Creation of EFSA. EFSA J. 2012, 10, S1006. [Google Scholar] [CrossRef]
- Kwon, Y.; López-García, R.; Socolovsky, S.; Magnuson, B. Global Regulations for the Use of Food Additives and Processing Aids. In Present Knowledge in Food Safety: A Risk-Based Approach Through the Food Chain; Academic Press: Cambridge, MA, USA, 2023; pp. 170–193. [Google Scholar] [CrossRef]
- Teixeira, A.; Rodrigues, S. Consumer Perceptions towards Healthier Meat Products. Curr. Opin. Food Sci. 2021, 38, 147–154. [Google Scholar] [CrossRef]
- Román, S.; Sánchez-Siles, L.M.; Siegrist, M. The Importance of Food Naturalness for Consumers: Results of a Systematic Review. Trends Food Sci. Technol. 2017, 67, 44–57. [Google Scholar] [CrossRef]
- Szücs, V.; Guerrero, L.; Claret, A.; Tarcea, M.; Szabó, E.; Bánáti, D. Food Additives and Consumer Preferences: A Cross-Cultural Choice-Based Conjoint Analysis. Acta Aliment. 2014, 43, 180–187. [Google Scholar] [CrossRef]
- Gökce, A.; Bozkir, C.; Seyitoglu, D.; Pehlivan, E.; Ozer, A. Level of Food Additive Knowledge and Perceptions of Food Safety of University Students. Eur. J. Public Health 2017, 27, ckx186.125. [Google Scholar] [CrossRef]
- Martínez-Zamora, L.; Peñalver, R.; Ros, G.; Nieto, G. Substitution of Synthetic Nitrates and Antioxidants by Spices, Fruits and Vegetables in Clean Label Spanish Chorizo. Food Res. Int. 2021, 139, 109835. [Google Scholar] [CrossRef]
- Powell, M.J.; Sebranek, J.G.; Prusa, K.J.; Tarté, R. Evaluation of Citrus Fiber as a Natural Replacer of Sodium Phosphate in Alternatively-Cured All-Pork Bologna Sausage. Meat Sci. 2019, 157, 107883. [Google Scholar] [CrossRef]
- Martínez-Zamora, L.; Ros, G.; Nieto, G. Synthetic vs. Natural Hydroxytyrosol for Clean Label Lamb Burgers. Antioxidants 2020, 9, 851. [Google Scholar] [CrossRef]
- Møller, P. Satisfaction, Satiation and Food Behaviour. Curr. Opin. Food Sci. 2015, 3, 59–64. [Google Scholar] [CrossRef]
- Stribiţcaia, E.; Evans, C.E.L.; Gibbons, C.; Blundell, J.; Sarkar, A. Food Texture Influences on Satiety: Systematic Review and Meta-Analysis. Sci. Rep. 2020, 10, 12929. [Google Scholar] [CrossRef] [PubMed]
- Tremblay, A.; Bellisle, F. Nutrients, Satiety, and Control of Energy Intake. Appl. Physiol. Nutr. Metab. 2015, 40, 971–979. [Google Scholar] [CrossRef] [PubMed]
- Ayuso, P.; Quizhpe, J.; Yepes, F.; Miranzo, D.; Avellaneda, A.; Nieto, G.; Ros, G. Improving the Nutritional Quality of Protein and Microbiota Effects in Additive- and Allergen-Free Cooked Meat Products. Foods 2024, 13, 1792. [Google Scholar] [CrossRef]
- Marfell-Jones, M.; Olds, T.; Stewart, A.; Carter, L. International Standards for Anthropometric Assessment; International Society for the Advancement of Kinanthropometry: Potchefstroom, South Africa, 2012; ISBN 9780620362078. [Google Scholar]
- Slaughter, M.R.; O’brien, P.J. Fully-Automated Spectrophotometric Method for Measurement of Antioxidant Activity of Catalase. Clin. Biochem. 2000, 33, 525–534. [Google Scholar] [CrossRef]
- Benzie, I.F.F.; Strain, J.J. The Ferric Reducing Ability of Plasma (FRAP) as a Measure of “‘Antioxidant Power’”: The FRAP Assay. Anal. Biochem. 1996, 239, 70–76. [Google Scholar] [CrossRef]
- Tvarijonaviciute, A.; Aznar-Cayuela, C.; Rubio, C.P.; Ceron, J.J.; López-Jornet, P. Evaluation of Salivary Oxidate Stress Biomarkers, Nitric Oxide and C-Reactive Protein in Patients with Oral Lichen Planus and Burning Mouth Syndrome. J. Oral. Pathol. Med. 2017, 46, 387–392. [Google Scholar] [CrossRef]
- Aust, S.D.; Fleischer, S. Microsomal Lipid Peroxidation. In Biomembranes—Part C: Biological Oxidations; Elsevier: Amsterdam, The Netherlands, 1978; pp. 302–310. [Google Scholar]
- Yang, X.; Sun, W.; Hou, D.; Wang, T.; Li, C.; Luo, Y.; Zhang, S.; Shen, L.; Liu, W.; Wu, D. The Degree of Plasma Oxidized Low-Density Lipoprotein Level Decrease Is Related to Clinical Outcomes for Patients with Acute Ischemic Stroke. Dis. Markers 2021, 2021, 4998823. [Google Scholar] [CrossRef]
- Panzella, L.; Pérez-Burillo, S.; Pastoriza, S.; Martín, M.Á.; Cerruti, P.; Goya, L.; Ramos, S.; Rufián-Henares, J.Á.; Napolitano, A.; d’Ischia, M. High Antioxidant Action and Prebiotic Activity of Hydrolyzed Spent Coffee Grounds (HSCG) in a Simulated Digestion–Fermentation Model: Toward the Development of a Novel Food Supplement. J. Agric. Food Chem. 2017, 65, 6452–6459. [Google Scholar] [CrossRef]
- Gołębiewski, M.; Tretyn, A. Generating Amplicon Reads for Microbial Community Assessment with Next-generation Sequencing. J. Appl. Microbiol. 2020, 128, 330–354. [Google Scholar] [CrossRef] [PubMed]
- Callahan, B.J.; McMurdie, P.J.; Rosen, M.J.; Han, A.W.; Johnson, A.J.A.; Holmes, S.P. DADA2: High-Resolution Sample Inference from Illumina Amplicon Data. Nat. Methods 2016, 13, 581–583. [Google Scholar] [CrossRef] [PubMed]
- Murali, A.; Bhargava, A.; Wright, E.S. IDTAXA: A Novel Approach for Accurate Taxonomic Classification of Microbiome Sequences. Microbiome 2018, 6, 140. [Google Scholar] [CrossRef] [PubMed]
- McMurdie, P.J.; Holmes, S. Phyloseq: An R Package for Reproducible Interactive Analysis and Graphics of Microbiome Census Data. PLoS ONE 2013, 8, e61217. [Google Scholar] [CrossRef]
- Lozupone, C.; Knight, R. UniFrac: A New Phylogenetic Method for Comparing Microbial Communities. Appl. Environ. Microbiol. 2005, 71, 8228–8235. [Google Scholar] [CrossRef]
- Flint, A.; Raben, A.; Blundell, J.E.; Astrup, A. Reproducibility, Power and Validity of Visual Analogue Scales in Assessment of Appetite Sensations in Single Test Meal Studies. Int. J. Obes. Relat. Metab. Disord. 2000, 24, 38–48. [Google Scholar] [CrossRef]
- He, J.; Votruba, S.; Venti, C.; Krakoff, J. Higher Incremental Insulin Area under the Curve during Oral Glucose Tolerance Test Predicts Less Food Intake and Weight Gain. Int. J. Obes. 2011, 35, 1495–1501. [Google Scholar] [CrossRef]
- Shim, S.M.; Seo, S.H.; Lee, Y.; Moon, G.I.; Kim, M.S.; Park, J.H. Consumers’ Knowledge and Safety Perceptions of Food Additives: Evaluation on the Effectiveness of Transmitting Information on Preservatives. Food Control 2011, 22, 1054–1060. [Google Scholar] [CrossRef]
- Buchler, S.; Smith, K.; Lawrence, G. Food Risks, Old and New: Demographic Characteristics and Perceptions of Food Additives, Regulation and Contamination in Australia. J. Sociol. 2010, 46, 353–374. [Google Scholar] [CrossRef]
- WHO. Waist Circumference and Waist–Hip Ratio. WHO Expert. 2011, 64, 2–5. [Google Scholar]
- Khodayari, S.; Sadeghi, O.; Safabakhsh, M.; Mozaffari-Khosravi, H. Meat Consumption and the Risk of General and Central Obesity: The Shahedieh Study. BMC Res. Notes 2022, 15, 1–9. [Google Scholar] [CrossRef] [PubMed]
- Wang, Y.; Beydoun, M.A. Meat Consumption Is Associated with Obesity and Central Obesity among US Adults. Int. J. Obes. 2009, 33, 621–628. [Google Scholar] [CrossRef] [PubMed]
- Poznyak, A.V.; Nikiforov, N.G.; Markin, A.M.; Kashirskikh, D.A.; Myasoedova, V.A.; Gerasimova, E.V.; Orekhov, A.N. Overview of OxLDL and Its Impact on Cardiovascular Health: Focus on Atherosclerosis. Front. Pharmacol. 2021, 11, 1–11. [Google Scholar] [CrossRef] [PubMed]
- Lang, Y.; Gao, N.; Zang, Z.; Meng, X.; Lin, Y.; Yang, S.; Yang, Y.; Jin, Z.; Li, B. Classification and Antioxidant Assays of Polyphenols: A Review. J. Future Foods 2024, 4, 193–204. [Google Scholar] [CrossRef]
- Lubos, E.; Loscalzo, J.; Handy, D.E. Glutathione Peroxidase-1 in Health and Disease: From Molecular Mechanisms to Therapeutic Opportunities. Antioxid. Redox Signal 2011, 15, 1957–1997. [Google Scholar] [CrossRef]
- Kaneko, N.; Kurata, M.; Yamamoto, T.; Morikawa, S.; Masumoto, J. The Role of Interleukin-1 in General Pathology. Inflamm. Regen. 2019, 39, 12. [Google Scholar] [CrossRef]
- D’Esposito, V.; Di Tolla, M.F.; Lecce, M.; Cavalli, F.; Libutti, M.; Misso, S.; Cabaro, S.; Ambrosio, M.R.; Parascandolo, A.; Covelli, B.; et al. Lifestyle and Dietary Habits Affect Plasma Levels of Specific Cytokines in Healthy Subjects. Front. Nutr. 2022, 9, 913176. [Google Scholar] [CrossRef]
- Borsani, B.; De Santis, R.; Perico, V.; Penagini, F.; Pendezza, E.; Dilillo, D.; Bosetti, A.; Zuccotti, G.V.; D’auria, E. The Role of Carrageenan in Inflammatory Bowel Diseases and Allergic Reactions: Where Do We Stand? Nutrients 2021, 13, 3402. [Google Scholar] [CrossRef]
- Martino, J.V.; Van Limbergen, J.; Cahill, L.E. The Role of Carrageenan and Carboxymethylcellulose in the Development of Intestinal Inflammation. Front. Pediatr. 2017, 5, 96. [Google Scholar] [CrossRef]
- Zhang, X.; Cao, J.; Zhong, L. Hydroxytyrosol Inhibits Pro-Inflammatory Cytokines, INOS, and COX-2 Expression in Human Monocytic Cells. Naunyn Schmiedebergs Arch. Pharmacol. 2009, 379, 581–586. [Google Scholar] [CrossRef]
- Fan, F.-Y.; Sang, L.-X.; Jiang, M. Catechins and Their Therapeutic Benefits to Inflammatory Bowel Disease. Molecules 2017, 22, 484. [Google Scholar] [CrossRef] [PubMed]
- Schrenk, D.; Bignami, M.; Bodin, L.; Chipman, J.K.; del Mazo, J.; Hogstrand, C.; Hoogenboom, L.; Leblanc, J.C.; Nebbia, C.S.; Nielsen, E.; et al. Risk Assessment of N-Nitrosamines in Food. EFSA J. 2023, 21, e07884. [Google Scholar] [CrossRef] [PubMed]
- Cao, Y.; Liu, H.; Qin, N.; Ren, X.; Zhu, B.; Xia, X. Impact of Food Additives on the Composition and Function of Gut Microbiota: A Review. Trends Food Sci. Technol. 2020, 99, 295–310. [Google Scholar] [CrossRef]
- Roca-Saavedra, P.; Mendez-Vilabrille, V.; Miranda, J.M.; Nebot, C.; Cardelle-Cobas, A.; Franco, C.M.; Cepeda, A. Food Additives, Contaminants and Other Minor Components: Effects on Human Gut Microbiota—A Review. J. Physiol. Biochem. 2017, 74, 69–83. [Google Scholar] [CrossRef]
- Grundmann, G.L.; Neyra, M.; Normand, P. High-Resolution Phylogenetic Analysis of NO2/–Oxidizing Nitrobacter Species Using the Rrs-Rrl IGS Sequence and Rrl Genes. Int. J. Syst. Evol. Microbiol. 2000, 50, 1893–1898. [Google Scholar] [CrossRef]
- Vijayan, A.; Vattiringal Jayadradhan, R.K.; Pillai, D.; Prasannan Geetha, P.; Joseph, V.; Isaac Sarojini, B.S. Nitrospira as Versatile Nitrifiers: Taxonomy, Ecophysiology, Genome Characteristics, Growth, and Metabolic Diversity. J. Basic. Microbiol. 2021, 61, 88–109. [Google Scholar] [CrossRef]
- Honikel, K.O. The Use and Control of Nitrate and Nitrite for the Processing of Meat Products. Meat Sci. 2008, 78, 68–76. [Google Scholar] [CrossRef]
- Karwowska, M.; Kononiuk, A. Nitrates/Nitrites in Food-Risk for Nitrosative Stress and Benefits. Antioxidants 2020, 9, 241. [Google Scholar] [CrossRef]
- Weitzberg, E.; Lundberg, J.O. Novel Aspects of Dietary Nitrate and Human Health. Annu. Rev. Nutr. 2013, 33, 129–159. [Google Scholar] [CrossRef]
- Shi, J.; Zhao, D.; Song, S.; Zhang, M.; Zamaratskaia, G.; Xu, X.; Zhou, G.; Li, C. High-Meat-Protein High-Fat Diet Induced Dysbiosis of Gut Microbiota and Tryptophan Metabolism in Wistar Rats. J. Agric. Food Chem. 2020, 68, 6333–6346. [Google Scholar] [CrossRef]
- Van Hul, M.; Cani, P.D. The Gut Microbiota in Obesity and Weight Management: Microbes as Friends or Foe? Nat. Rev. Endocrinol. 2023, 19, 258–271. [Google Scholar] [CrossRef] [PubMed]
- Morell, P.; Fiszman, S. Revisiting the Role of Protein-Induced Satiation and Satiety. Food Hydrocoll. 2017, 68, 199–210. [Google Scholar] [CrossRef]
- Bonnema, A.L.; Altschwager, D.; Thomas, W.; Slavin, J.L. The Effects of a Beef-Based Meal Compared to a Calorie Matched Bean-Based Meal on Appetite and Food Intake. J. Food Sci. 2015, 80, 2088–2093. [Google Scholar] [CrossRef] [PubMed]
- Nielsen, L.V.; Kristensen, M.D.; Klingenberg, L.; Ritz, C.; Belza, A.; Astrup, A.; Raben, A. Protein from Meat or Vegetable Sources in Meals Matched for Fiber Content Has Similar Effects on Subjective Appetite Sensations and Energy Intake-A Randomized Acute Cross-Over Meal Test Study. Nutrients 2018, 10, 96. [Google Scholar] [CrossRef]
- Charlton, K.E.; Tapsell, L.C.; Batterham, M.J.; Thorne, R.; O’Shea, J.; Zhang, Q.; Beck, E.J. Pork, Beef and Chicken Have Similar Effects on Acute Satiety and Hormonal Markers of Appetite. Appetite 2011, 56, 1–8. [Google Scholar] [CrossRef]
- Veldhorst, M.; Smeets, A.; Soenen, S.; Hochstenbach-Waelen, A.; Hursel, R.; Diepvens, K.; Lejeune, M.; Luscombe-Marsh, N.; Westerterp-Plantenga, M. Protein-Induced Satiety: Effects and Mechanisms of Different Proteins. Physiol. Behav. 2008, 94, 300–307. [Google Scholar] [CrossRef]
- Muliadi, R.D.; Kartawidjajaputra, F.; Antono, L. The Effect of High Protein Milk Supplementation on Satiety in Normal Weight Subjects. Food Res. 2022, 6, 96–102. [Google Scholar] [CrossRef]
- Joseph, R.J.; Alonso-Alonso, M.; Bond, D.S.; Pascual-Leone, A.; Blackburn, G.L. The Neurocognitive Connection between Physical Activity and Eating Behavior. Obes. Rev. 2011, 12, 800. [Google Scholar] [CrossRef]
- Santos-Hernández, M.; Miralles, B.; Amigo, L.; Recio, I. Intestinal Signaling of Proteins and Digestion-Derived Products Relevant to Satiety. J. Agric. Food Chem. 2018, 66, 10123–10131. [Google Scholar] [CrossRef]
- Zhang, Y.; Guo, K.; LeBlanc, R.E.; Loh, D.; Schwartz, G.J.; Yu, Y.H. Increasing Dietary Leucine Intake Reduces Diet-Induced Obesity and Improves Glucose and Cholesterol Metabolism in Mice via Multimechanisms. Diabetes 2007, 56, 1647–1654. [Google Scholar] [CrossRef]
- Clark, M.J.; Slavin, J.L. The Effect of Fiber on Satiety and Food Intake: A Systematic Review. J. Am. Coll. Nutr. 2013, 32, 200–211. [Google Scholar] [CrossRef]


| Gender | |
| Male | 128 (38.8%) |
| Female | 192 (58.2%) |
| Prefer not to answer | 10 (3.0%) |
| Age | |
| Generation Z (1998–2012) | 185 (56.1%) |
| Millennials (1979–1997) | 60 (18.2%) |
| Generation X (1968–1978) | 40 (12.1%) |
| Baby Boomers (1946–1967) | 45 (13.6%) |
| Allergenicity | |
| Allergic individuals | 57 (17.3%) |
| Non-allergic individuals | 273 (82.7%) |
| Education level | |
| No education/Primary school | 8 (2.4%) |
| Secondary education | 65 (19.7%) |
| University degree | 179 (54.2%) |
| Master’s degree | 59 (17.9%) |
| Doctor/Professor | 19 (5.8%) |
| Control | Intervention | p-Value | |
|---|---|---|---|
| Age (years) | 26.6 ± 11.5 | 26.7 ± 11.7 | 0.97 |
| Men | 15 | 14 | 1.00 |
| Women | 14 | 15 | |
| BMI (kg/m2) | 23.7 ± 2.7 | 23.6 ± 2.8 | 0.98 |
| Weight (kg) | 66.6 ± 11.8 | 68.4 ± 12.7 | 0.58 |
| Fat mass (%) | 26.0 ± 9.0 | 26.9 ± 9.0 | 0.71 |
| TC (mg/dL) | 175.8 ± 34.6 | 178.0 ± 30.9 | 0.80 |
| Ox- LDL (ng/mL) | 238.6 ± 52.1 | 233.6 ± 52.4 | 0.71 |
| Energy (KJ/kcal) | Protein (g) | Fat (g) | Carbohydrates (g) | |
|---|---|---|---|---|
| Basal Breakfast | 1548/370 | 7.4 | 11.5 | 59.1 |
| Control Breakfast | 1702/407 | 14.8 | 12 | 59.5 |
| Reformulated Breakfast | 1723/412 | 16.6 | 11.9 | 59.4 |
| Questions | Number of Survey Respondents | % of Survey Respondents |
|---|---|---|
| What preference would you have for two products of similar taste and price that differ only in the presence of additives? | ||
| 235 | 71.2 |
| 9 | 2.7 |
| 86 | 26.1 |
| Total | 330 | 100.0 |
| Do you consider a product to be more “natural” if it does not contain additives? | ||
| 259 | 78.2 |
| 72 | 21.8 |
| Total | 330 | 100.0 |
| What do you think is the greatest benefit of an additive-free product? | ||
| 151 | 45.8 |
| 15 | 4.5 |
| 52 | 15.8 |
| 23 | 7.0 |
| 45 | 13.6 |
| 17 | 5.2 |
| 13 | 3.9 |
| 14 | 4.2 |
| Total | 330 | 100.0 |
| What is the biggest benefit you think a product with additives can have? | ||
| 203 | 61.5 |
| 45 | 13.6 |
| 40 | 12.1 |
| 26 | 7.9 |
| 4 | 1.2 |
| 0 | 0 |
| Total | 330 | 100.0 |
| Demographics | I Would Choose the Product with Additives | I Would Choose the Product Without Additives | I Would Be Indifferent | Total | Sig. |
|---|---|---|---|---|---|
| Sex | |||||
| Male | 2 (1.6%) | 92 (71.9%) | 34 (26.6%) | 128 (100%) | χ2 = 1.157 df = 2 p < 0.561 |
| Female | 7 (3.6%) | 138 (70.4%) | 51 (26.0%) | 196 (100%) | |
| Age group | |||||
| Generation Z (1998–2012) | 5 (2.7%) | 118 (63.8%) | 62 (28.3%) | 185 (100%) | χ2 = 20.03 df = 6 p < 0.003 |
| Millennial (1979–1997) | 2 (3.3%) | 41 (68.3%) | 17 (28.3%) | 60 (100%) | |
| Generation X (1978–1968) | 1 (2.5%) | 36 (90%) | 3 (7.5%) | 40 (100%) | |
| Baby Boomer (1946–1967) | 1 (2.2%) | 40 (88.9%) | 4 (8.9%) | 45 (100%) | |
| Knowledge of additives | |||||
| Yes | 5 (3.2%) | 98 (62.4%) | 54 (34.4%) | 157 (100%) | χ2 = 11.463 df = 2 p < 0.03 |
| No | 4 (2.3%) | 137 (79.2%) | 32 (18.5%) | 173 (100%) | |
| Measured Parameter | Group | Baseline | Final | p-Value (Time) | p-Value (Product × Time) |
|---|---|---|---|---|---|
| Weight (kg) | Control | 66.6 ± 11.8 | 66.79 ± 11.8 | 0.95 | 1.00 |
| Intervention | 68.4 ± 12.7 | 68.59 ± 13.2 | 0.95 | ||
| BMI (kg/m2) | Control | 23.7 ± 2.7 | 23.7 ± 2.6 | 0.96 | 0.32 |
| Intervention | 23.6 ± 2.8 | 23.7 ± 2.9 | 0.76 | ||
| Fat mass (%) | Control | 26.0 ± 8.9 | 27.2 ± 8.5 | 0.62 | 0.66 |
| Intervention | 26.9 ± 9.0 | 28.3 ± 9.4 | 0.57 | ||
| Abdominal circumference (cm) | Control | 78.5 ± 8.0 | 78.2 ± 8.7 | 0.92 | 0.35 |
| Intervention | 80.3 ± 10.2 | 79.2 ± 9.3 | 0.67 | ||
| WHR (cm waist–cm hip) | Control | 0.79 ± 0.07 | 0.79 ± 0.08 | 0.98 | 0.82 |
| Intervention | 0.80 ± 0.07 | 0.79 ± 0.06 | 0.35 |
| Group | Baseline | Final | p-Value (Time) | p-Value (Product × Time) | |
|---|---|---|---|---|---|
| Lipid and glycaemic markers | |||||
| Basal glucose (mg/dL) | Control | 83.2 ± 7.9 | 83.4 ± 8.2 | 0.94 | 0.77 |
| Intervention | 82.7 ± 6.2 | 83.0 ± 6.3 | 0.83 | ||
| GOT (U/L) | Control | 21.9 ± 8.8 | 22.4 ± 9.7 | 0.84 | 0.63 |
| Intervention | 22.0 ± 10.3 | 20.3 ± 9.1 | 0.52 | ||
| GPT (U/L) | Control | 22.8 ± 19.0 | 26.9 ± 19.9 | 0.43 | 0.17 |
| Intervention | 18.6 ± 7.2 | 21.9 ± 7.7 | 0.09 | ||
| Triglycerides (mg/dL) | Control | 70.9 ± 27.9 | 69.3 ± 37.4 | 0.86 | 0.22 |
| Intervention | 75.0 ± 30.9 | 65.9 ± 29.5 | 0.26 | ||
| HDL cholesterol (mg/dL) | Control | 65.4 ± 14.0 | 62.8 ± 13.8 | 0.49 | 0.90 |
| Intervention | 66.9 ± 13.3 | 62.2 ± 12.7 | 0.17 | ||
| LDL cholesterol (mg/dL) | Control | 98.6 ± 27.9 | 101.6 ± 33.5 | 0.71 | 0.87 |
| Intervention | 100.5 ± 23.6 | 102.0 ± 28.0 | 0.83 | ||
| Total cholesterol (mg/dL) | Control | 175.8 ± 34.6 | 180.1 ± 35.1 | 0.64 | 0.78 |
| Intervention | 178.0 ± 30.9 | 182.8 ± 33.1 | 0.57 | ||
| Oxidation Markers | |||||
| Serum FRAP (μmol eq trolox/L) | Control | 1045.7 ± 184.4 | 1091.2 ± 214.3 | 0.39 | 0.41 |
| Intervention | 1032.6 ± 188.9 | 1052.4 ± 194.5 | 0.70 | ||
| Serum ABTS (μmol eq trolox/L) | Control | 1228.7 ± 192.4 | 1219.6 ± 192.5 | 0.86 | 0.30 |
| Intervention | 1175.3 ± 184.2 | 1146.0 ± 194.3 | 0.56 | ||
| Serum MDA (nmol/L) | Control | 677.7 ± 70.5 | 712.5 ± 100.9 | 0.13 | 0.22 |
| Intervention | 682.4 ± 57.1 | 669.5 ± 83.5 | 0.49 | ||
| Serum glutathione peroxidase (U/L) | Control | 491.6 ± 382.9 | 340.8 ± 76.9 | 0.04 | 0.73 |
| Intervention | 436.5 ± 172.0 | 311.3 ± 59.6 | <0.01 | ||
| Serum catalase (U/mL) | Control | 0.103 ± 0.018 | 0.104 ± 0.023 | 0.73 | 0.32 |
| Intervention | 0.105 ± 0.015 | 0.102 ± 0.015 | 0.49 | ||
| Serum ox-LDL (ng/mL) | Control | 238.6 ± 52.1 | 193.0 ± 40.2 | <0.01 | 0.68 |
| Intervention | 233.6 ± 52.4 | 192.4 ± 29.9 | <0.01 | ||
| Inflammatory Markers | |||||
| Serum hs-CRP (mg/dL) | Control | 3.20 ± 3.06 | 2.82 ± 2.54 | 0.61 | 0.55 |
| Intervention | 2.02 ± 1.54 | 2.40 ± 1.63 | 0.37 | ||
| Serum TNF-α (pg/mL) | Control | 18.28 ± 4.94 | 17.82 ± 4.40 | 0.71 | 0.84 |
| Intervention | 17.13 ± 7.41 | 16.48 ± 5.98 | 0.72 | ||
| Serum TNF-α (pg/mL) IMC < 25 | Control (n = 20) | 19.80 ± 4.63 | 19.02 ± 3.94 | 0.58 | 0.47 |
| Intervention (n = 22) | 17.31 ± 8.28 | 17.24 ± 6.57 | 0.98 | ||
| Serum TNF-α (pg/mL) IMC ≥ 25 | Control (n = 9) | 16.36 ± 5.44 | 16.94 ± 4.27 | 0.80 | 0.05 |
| Intervention (n = 7) | 16.56 ± 3.97 | 14.08 ± 2.66 | 0.19 | ||
| Serum IL-1β (pg/mL) | Control | 3.27 ± 1.64 | 4.68 ± 3.68 | 0.64 | 0.04 |
| Intervention | 3.96 ± 2.74 | 4.01 ± 2.13 | 0.94 | ||
| Serum IL-1β (pg/mL) IMC < 25 | Control (n = 20) | 3.18 ± 1.86 | 4.87 ± 4.47 | 0.14 | 0.11 |
| Intervention (n = 22) | 4.24 ± 2.74 | 4.41 ± 1.98 | 0.83 | ||
| Serum IL-1β (pg/mL) IMC ≥ 25 | Control (n = 9) | 3.28 ± 1.40 | 4.40 ± 1.41 | 0.11 | <0.01 |
| Intervention (n = 7) | 3.07 ± 2.75 | 2.77 ± 2.23 | 0.83 | ||
| Serum IL-6 (pg/mL) | Control | 6.28 ± 9.48 | 6.19 ± 9.15 | 0.97 | 0.37 |
| Intervention | 13.81 ± 24.61 | 12.26 ± 22.59 | 0.80 | ||
| Serum IL-10 (pg/mL) | Control | 17.96 ± 32.35 | 22.14 ± 27.74 | 0.63 | 0.72 |
| Intervention | 47.10 ± 99.20 | 48.40 ± 99.43 | 0.96 | ||
| Additive exposure markers | |||||
| Urinary nitrates (mg/L) | Control | 68.6 ± 50.7 | 74.6 ± 49.5 | 0.65 | 0.05 |
| Intervention | 80.0 ± 51.3 | 59.0 ± 23.0 | 0.05 | ||
| Control | Intervention | Sig. (Time × Group) <0.05 | ||||||
|---|---|---|---|---|---|---|---|---|
| Baseline | Final | Sig. (Time) <0.05 | Baseline | Final | Sig. (Time) <0.05 | |||
| Phylo | ||||||||
| Acidobacteriota | 1.940 ± 1.607 | 2.201 ± 1.612 | 1.621 ± 1.794 | 2.948 ± 2.740 | 0.033 | |||
| Nitrospirota | 0.877 ± 0.859 | 2.197 ± 2.922 | 0.023 | 1.135 ± 1.213 | 1.313 ± 1.478 | 0.043 | ||
| Genus | ||||||||
| Rubrobacter | 1.598 ± 1.641 | 1.294 ± 0.871 | 2.578 >± 2.771 | 1.422 ± 1.319 | 0.047 | |||
| Nitrospira | 0.877 ± 0.859 | 2.197 ± 2.922 | 0.023 | 1.135 ± 1.213 | 1.313 ± 1.478 | 0.043 | ||
| Nitrobacter | 0.427 ± 0.587 | 1.053 ± 1.944 | 0.494 ± 0.845 | 0.163 ± 0.241 | 0.047 | 0.010 | ||
| Candidatus Alysiosphaera | 0.295 ± 0.389 | 0.222 ± 0.222 | 0.403 ± 0.478 | 0.798 ± 0.988 | 0.024 | |||
| Group | Baseline | Final | p-Value (Time) | p-Value (Product × Time) | |
|---|---|---|---|---|---|
| FRAP in faeces (mmol eq Trolox/kg of faeces) | Control | 150.9 ± 81.8 | 162.5 ± 107.6 | 0.648 | 0.938 |
| Intervention | 160.7 ± 103.9 | 156.6 ± 109.9 | 0.884 | ||
| Acetic acid in faeces (mmol/kg of faeces) | Control | 67.97 ± 43.51 | 51.55 ± 25.89 | 0.086 | 0.906 |
| Intervention | 70.43 ± 45.84 | 55.29 ± 31.31 | 0.148 | ||
| Propionic acid in faeces (mmol/kg of faeces) | Control | 76.27 ± 60.27 | 58.32 ± 47.07 | 0.211 | 0.613 |
| Intervention | 69.37 ± 65.91 | 57.95 ± 55.39 | 0.476 | ||
| Butyric acid in faeces (mmol/kg of faeces) | Control | 4.16 ± 6.12 | 4.15 ± 7.53 | 1.000 | 0.836 |
| Intervention | 3.54 ± 6.52 | 3.27 ± 6.77 | 0.877 | ||
| Total short-chain fatty acids (mmol/kg of faeces) | Control | 148.39 ± 76.31 | 114.03 ± 61.36 | 0.064 | 0.685 |
| Intervention | 143.34 ± 78.19 | 116.52 ± 56.39 | 0.140 |
| Basal Breakfast | Control Breakfast | Reformulated Breakfast | |
|---|---|---|---|
| Area under curve (AUC) | |||
| Hunger | 766.18 ± 282.13 b | 681.82 ± 260.04 ab | 533.25 ± 233.95 a |
| Fullness | 712.39 ± 303.96 a | 721.84 ± 323.25 a | 813.43 ± 421.38 a |
| Desire to eat | 825.86 ± 342.91 b | 731.64 ± 298.24 ab | 557.57 ± 276.06 a |
| Prospective food consumption | 855.96 ± 297.70 b | 760.92 ± 260.23 ab | 576.11 ± 294.40 a |
| Initial VAS (cm) | |||
| Hunger | −3.36 ± 2.15 a | −4.46 ± 2.37 a | −4.37 ± 3.23 a |
| Fullness | 4.23 ± 2.99 a | 5.90 ± 2.03 a | 5.74 ± 3.05 a |
| Desire to eat | −3.09 ± 3.44 a | −2.64 ± 2.90 a | −3.74 ± 3.10 a |
| Prospective food consumption | −2.74 ± 2.59 a | −3.22 ± 2.26 a | −4.20 ± 2.21 a |
| Incremental VAS180 score (cm) | |||
| Hunger | 4.28 ± 2.88 ab | 5.08 ± 2.47 b | 3.27 ± 2.97 a |
| Fullness | −3.70 ± 2.89 a | −5.36 ± 2.43 a | −4.17 ± 2.73 a |
| Desire to eat | 3.55 ± 3.39 a | 3.02 ± 3.45 a | 2.53 ± 3.96 a |
| Prospective food consumption | 3.04 ± 3.08 a | 3.15 ± 3.03 a | 2.54 ± 3.18 a |
Disclaimer/Publisher’s Note: The statements, opinions and data contained in all publications are solely those of the individual author(s) and contributor(s) and not of MDPI and/or the editor(s). MDPI and/or the editor(s) disclaim responsibility for any injury to people or property resulting from any ideas, methods, instructions or products referred to in the content. |
© 2025 by the authors. Licensee MDPI, Basel, Switzerland. This article is an open access article distributed under the terms and conditions of the Creative Commons Attribution (CC BY) license (https://creativecommons.org/licenses/by/4.0/).
Share and Cite
Quizhpe, J.; Ayuso, P.; Yepes, F.; Miranzo, D.; Avellaneda, A.; Nieto, G.; Ros, G. Exploring the Health Effects of New Additive- and Allergen-Free Reformulated Cooked Meat Products: Consumer Survey, Clinical Trial, and Perceived Satiety. Nutrients 2025, 17, 1616. https://doi.org/10.3390/nu17101616
Quizhpe J, Ayuso P, Yepes F, Miranzo D, Avellaneda A, Nieto G, Ros G. Exploring the Health Effects of New Additive- and Allergen-Free Reformulated Cooked Meat Products: Consumer Survey, Clinical Trial, and Perceived Satiety. Nutrients. 2025; 17(10):1616. https://doi.org/10.3390/nu17101616
Chicago/Turabian StyleQuizhpe, Jhazmin, Pablo Ayuso, Fani Yepes, Domingo Miranzo, Antonio Avellaneda, Gema Nieto, and Gaspar Ros. 2025. "Exploring the Health Effects of New Additive- and Allergen-Free Reformulated Cooked Meat Products: Consumer Survey, Clinical Trial, and Perceived Satiety" Nutrients 17, no. 10: 1616. https://doi.org/10.3390/nu17101616
APA StyleQuizhpe, J., Ayuso, P., Yepes, F., Miranzo, D., Avellaneda, A., Nieto, G., & Ros, G. (2025). Exploring the Health Effects of New Additive- and Allergen-Free Reformulated Cooked Meat Products: Consumer Survey, Clinical Trial, and Perceived Satiety. Nutrients, 17(10), 1616. https://doi.org/10.3390/nu17101616