
Exploring the Dynamic Relationship between the Gut Microbiome and Body Composition across the Human Lifespan: A Systematic Review

 ,
,  , ,
, , 
 and
and 
Abstract
1. Introduction
2. Materials and Methods
2.1. Information Sources and Search Strategy
2.2. Eligibility Criteria
2.3. Data Collection Process
2.4. Data Extraction and Quality Assessment
3. Results
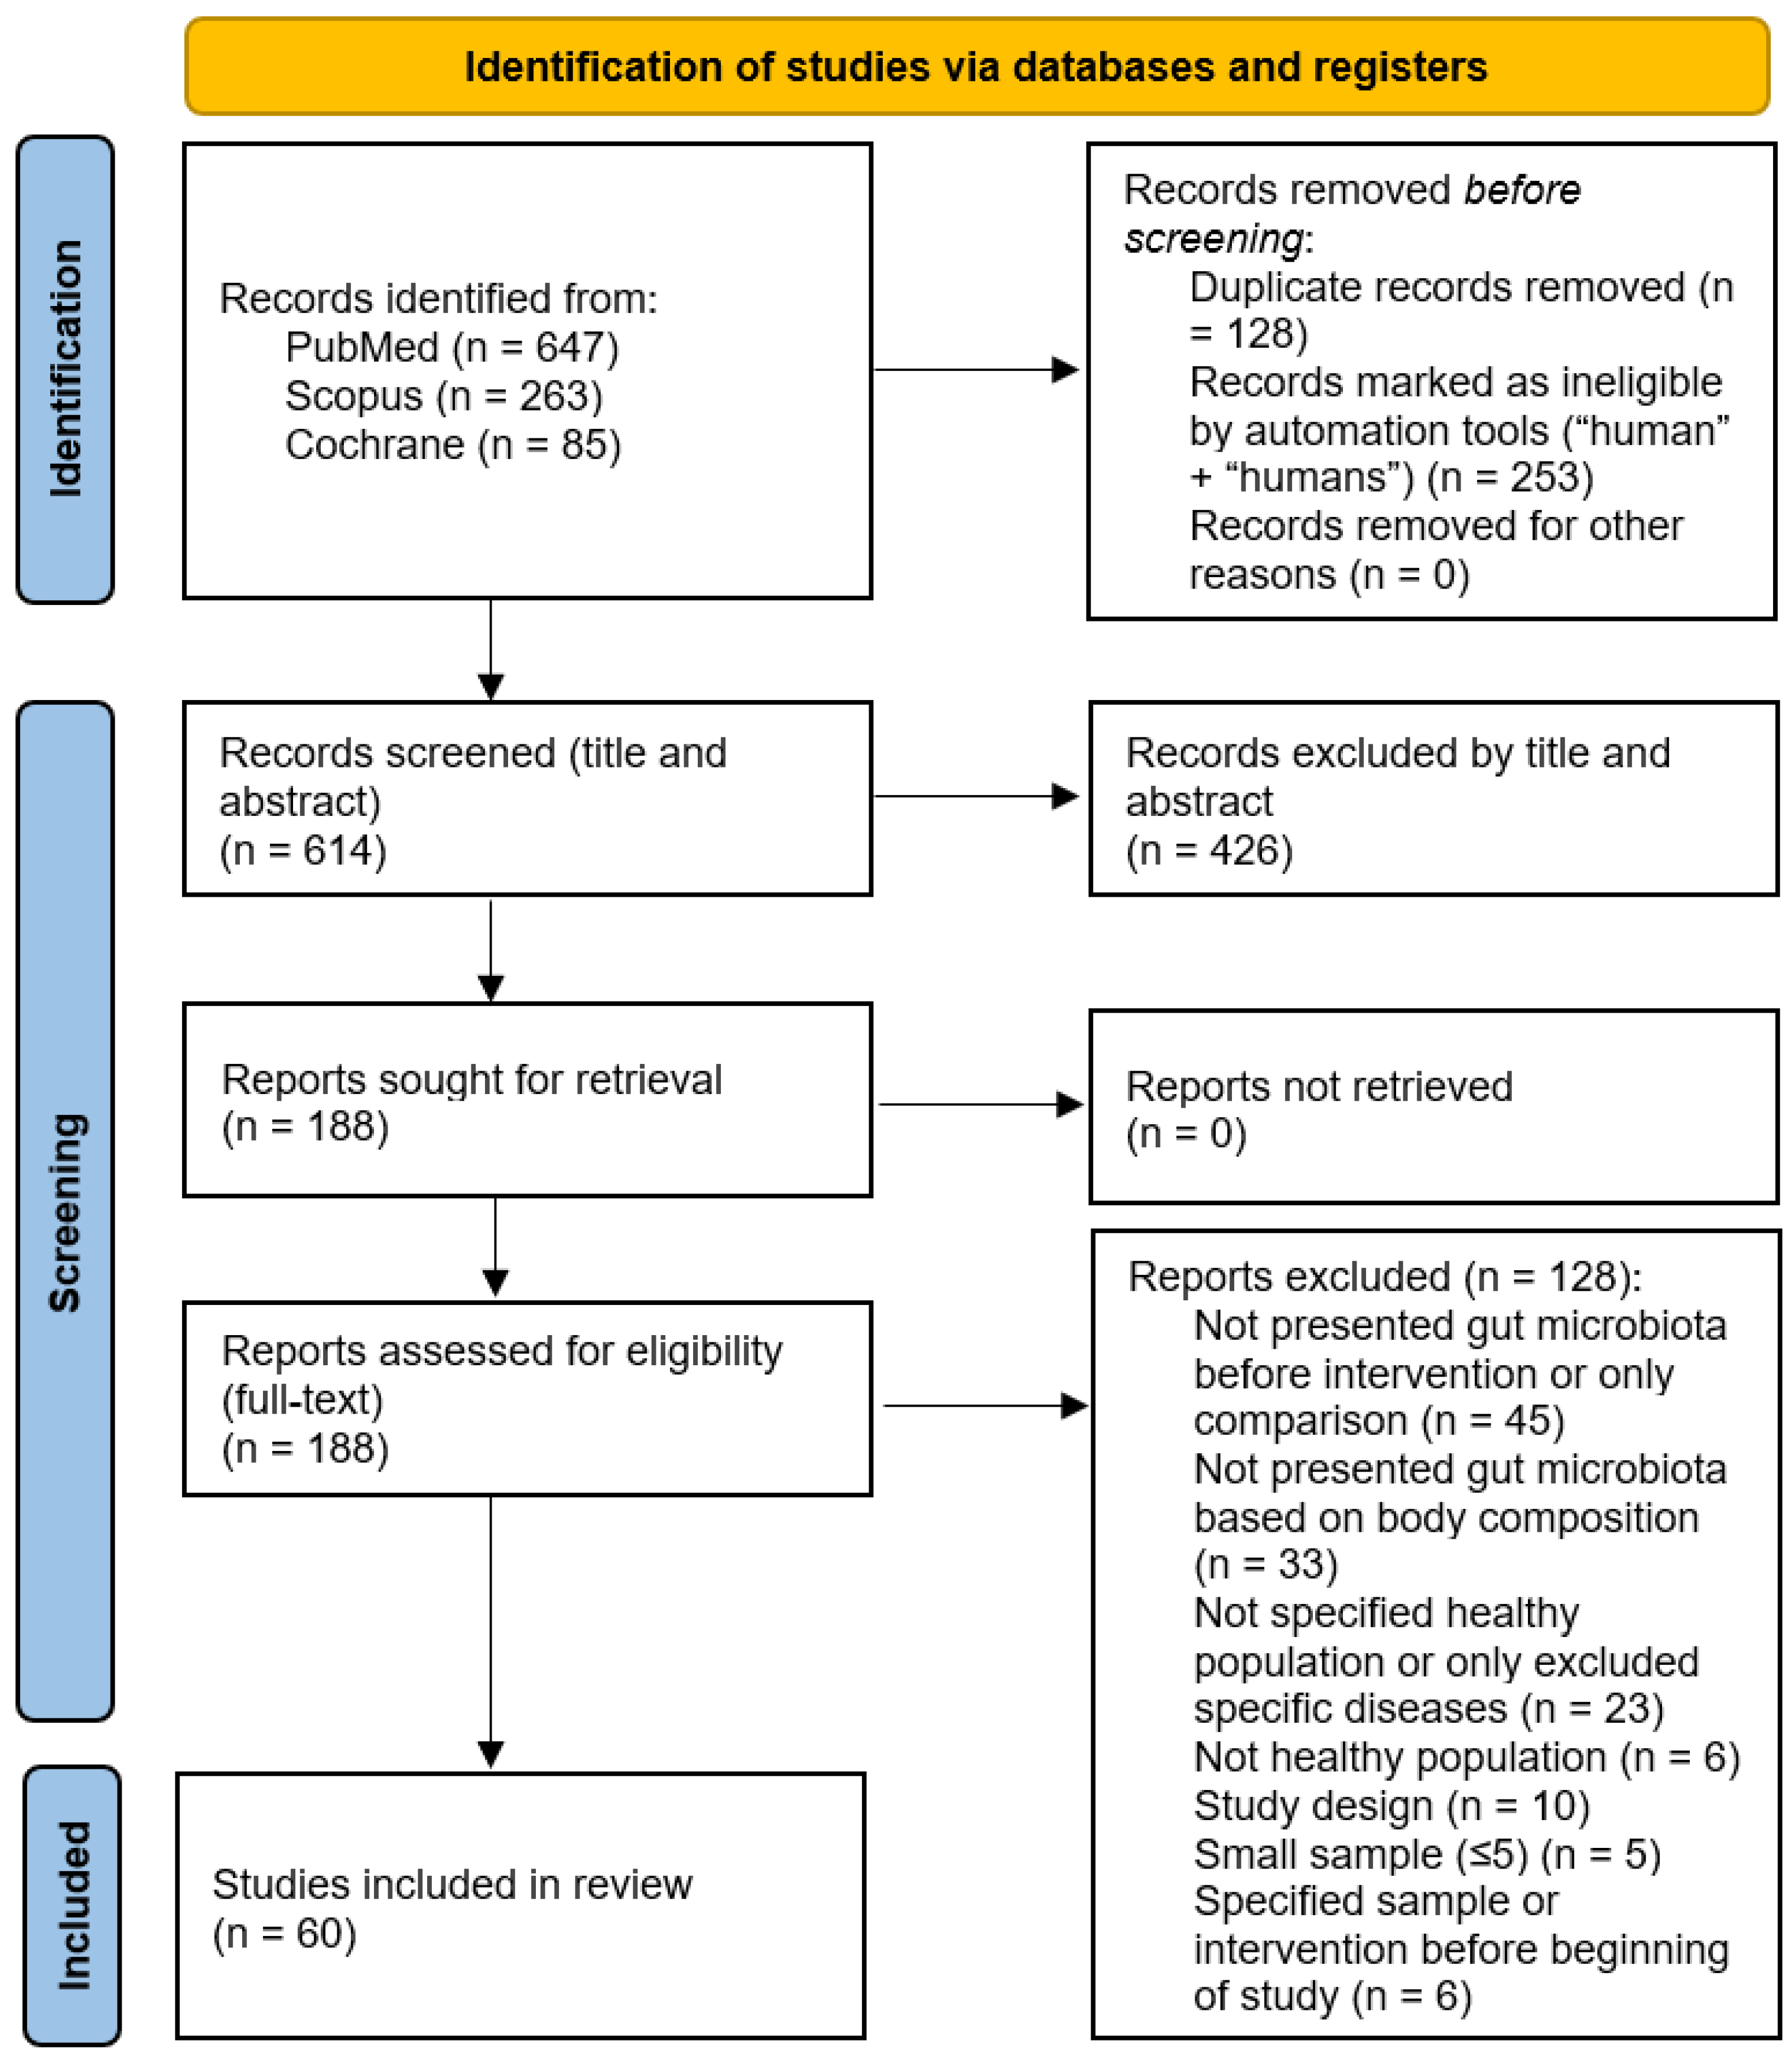
3.1. Study Selection
3.2. Study Characteristics

| Author(s), Date | N | Sex | Age (Years) | BMI Category (kg/m2) | Body Composition | Results |
|---|---|---|---|---|---|---|
| Allen et al., 2018 [61] | 32 | M and F | 20–45 | Lean: 22.21 ± 2.76 Obese: 35.71 ± 5.11 | Lean (body fat % = 26.04 ± 6.12, lean mass % = 71.52 ± 6.18, bone density = 1.11 ± 0.08) Obese (body fat % = 38.42 ± 4.98, lean mass % = 59.42 ± 5.03, bone density = 1.21 ± 0.12) | Gut microbiota composition was different between lean and obese adults at baseline (p = 0.034) |
| Assmann et al., 2020 [33] | 103 | M and F | Eutropic: 44.7 ± 9.1 Obesity: 46.6 ± 9.4 | Eutropic: 18.6 ± 2.1 Obesity: 32.9 ± 2.4 | Eutropic (WC cm = 75.2 ± 7.6, fat mass % = 13.6 ± 5.7, lean mass % = 47.6 ± 12.2) Obesity (WC cm = 104.9 ± 10.2, fat mass % = 34.7 ± 6.5, lean mass % = 57.0 ± 11.7) | Bacterial genera: 18 were statistically different between obese and normal-weight individuals (p < 0.05) → ↑ Mogibacterium, Mitsuokella, Megamonas, Howardella, Anaerovibrio, Bacteroides, Allisonella, Adlercreutzia, Abiotrophia. ↓ Victivallis, Succinivibrio, Rothia, Parvimonas, Intestimonas, Haemophilus, Faecalibacterium, Dorea, Anaerococcus Bacterial species: 12 were statistically different between obese and normal-weight individuals (p < 0.02) → ↑ Abiotrophia defectiva, Actinomyces odontolyticus, Allisonella histaminiformans, Barnesiella intestinihominis, Dorea longicatena, Howardella ureilytica, Lactobacillus curvatus, Megamonas funiformis, Mitsuokella jaladudinii, Odoribacter laneus. ↓ Bacteroides eggerthii, Haemophilus parainfluenzae. Shannon index (α-diversity) was not different between obese and normal-weight groups. Β-diversity was statistically different. |
| Barnes et al., 2019 [62] | 32 | M and F | 18–50 | Lean control: 22.1 (1.6) Lean mango: 22.9 (2.2) Obese mango: 34.6 (4.9) | NR | Day 0: Obese → ↑ Clostridium leptum (p = 0.0264), Bacteroides thetaiotaomicron (p = 0.0359). ↓ Lactococcus lactis (p = 0.443). |
| Basciani et al., 2020 [63] | 48 | M and F | 56.2 ± 6.1 | Obese: 35.9 ± 4.1 | WPG (WC = 110.0 ± 9.4 cm, HC = 123.6 ± 12.1 cm, TC = 63.6 ± 5.3 cm, arm circumference = 36.6 ± 3.9 cm) VPG (WC = 108.2 ± 8.5 cm, HC = 123.3 ± 9.3 cm, TC = 64.1 ± 5.3 cm, arm circumference = 36.3 ± 3.7 cm) APG (WC = 105.3 ± 9.1 cm, HC = 122.5 ± 10.6 cm, TC = 65.4 ± 7.2 cm, arm circumference = 37.7 ± 3.0 cm) | TO: Obese → dominant phyla: Firmicutes, Bacteroidetes, Proteobacteria, Verrucomicrobia, Fusobacteria, Actinobacteria. Firmicutes: 80–90%, Bacteroidetes: 0–10%. |
| Bezek et al., 2020 [70] | 200 | M and F | 35.4 ± 7.0 (25–50) | 24.2 ± 3.5 (18.5–35) | WHR: 0.87 ± 0.07, visceral fat index: 4.7 ± 2.9 | All participants: Phylum (%) → Firmicutes (71.02 ± 11.45), Bacteroidetes (13.85 ± 10.20), Proteobacteria (3.52 ± 3.33), Actinobacteria (2.80 ± 3.25), Verrucomicrobia (0.28 ± 2.87). Genus (%) → Blautia (11.79 ± 5.84), Faecalibacterium (8.59 ± 5.09), Bacteroides (7.97 ± 8.05), Ruminococcus (6.51 ± 3.17), Clostridium (4.79 ± 3.48). Clusters (most prevalent): C1 → Phylum = Bacteroidetes, Genus = Bacteroides, Prevotella. C2 → Phylum = Firmicutes, Genus = Blautia, Clostridium. C3 → Phylum = Actinobacteria, Genus = Bifidobacterium. C4 → Phylum = Proteobacteria, Verrucomicrobia, Genus = Erysipelothrix. C2: higher obesity measures → ↑ Firmicutes, Firmicutes/Bacteroidetes (F/B) ratio, ↓ Bacteroidetes. |
| Bielik et al., 2020 [64] | 24 | M | Lean athletes (LA): 27.3 (23.5–31.0) Control athletes (CTRLs): 30.0 (25.1–34.9) | LA: 20.14 (19.31–20.97) CTRLs: 24.1 (22.9–25.2) | LA: body fat % = 11.73 (9.9–13.6) CTRLs: body fat % = 13.1 (11.2–14.9) | Phylum: Actinobacteria (p ≤ 0.01). Class: LA → ↓ Gamma proteobacteria (Proteobacteria) (p = 0.04), Shewanella (p = 0.04), Xanthomonas (p = 0.03). Order: LA → ↓ Alteromonadales (Proteobacteria) (p = 0.04). Genus: LA → ↑ Roseburia spp. (Firmicutes) (p = 0.03), Barnesiella spp. (Bacteroidetes) (p = 0.05). Family: LA → ↓ Coriobacteriaceae (Actinobacteria) (p = 0.04). |
| Bloemendaal et al., 2021 [78] | 56 | F | 18–40 | Probiotics group: 21.9 ± 0.32 Control group: 21.7 ± 0.30 | NR | Phylum before intervention: Firmicutes (68.0%), Bacteroidetes (19.5%), Actinobacteria (8.7%), Proteobacteria (1.5%), Verrucomicrobiota (1.4%), Euryarcheota (0.4%), Tenericutes (0.29%), Cyanobacteria (0.25%). |
| Borgo et al., 2018 [71] | 40 | M and F | NW (M: 48.7 ± 10.2, F: 51.7 ± 8.3) O (M: 53.8 ± 7.7, F: 51.3 ± 6.7) | NW: 22.8 ± 1.8 O: 35.8 ± 8.3 | NW (M: 83.1 ± 2.4, F: 82.9 ± 3.2) O (M: 112.1 ± 8.5, F: 109.3 ± 9.8) | Lumen-associated microbiota (LAM): Obese → ↓ α-diversity, Oscillospira genus. ↑ Veillonellaceae, Dialister spp. Flavonifractor plautii + Faecalibacterium prausnitzii negatively associated with BMI. Mucosal-associated microbiota (MAM): no significant differences between BMI groups. |
| Brignardello et al., 2010 [72] | 24 | M and F | 18–50 | Normal-weight: 23.5 ± 2.4 Obese: 35.9 ± 5.0 | Normal-weight (waist circumference = 78.7 ± 7.5 cm, body fat = 25.1 ± 7.3%, fat body mass = 15.6 ± 3.8 kg, lean body mass = 47.2 ± 11.3 kg) Obese (waist circumference = 112.5 ± 9.6 cm, body fat = 48.9 ± 9.3%, fat body mass = 43.1 ± 11.2 kg, lean body mass = 54.9 ± 10.6 kg) | Obese: ↑ relative abundance of bacteria with 23–37% G + C content in their DNA, ↓ bacteria with 40–47% and 57–61% G + C content in their DNA. Dominant bacteria regarding G + C content: obese → 36.2 ± 1.0%, normal-weight → 41.7 ± 1.4%. |
| Clarke et al., 2014 [34] | 86 | M | Elite athletes: 28.8 ± 3.8 Low BMI controls: 28.1 ± 5.1 High BMI controls: 30.8 ± 5.6 | Elite athletes: 29.1 ± 3.0 Low BMI controls: 22.7 ± 1.8 High BMI controls: 31.2 ± 3.0 | Elite athletes (body mass = 101.3 ± 13.8 kg, body fat = 16.9 ± 6.1 kg, lean body mass = 80 ± 8.9 kg, waist/hip ratio = 0.8 ± 0.04) Low BMI controls (body mass = 74.3 ± 6.3 kg, body fat = 15 ± 4.6 kg, lean body mass = 55.4 ± 5.6 kg, waist/hip ratio = 0.8 ± 0.05) High BMI controls (body mass = 103.1 ± 13.8 kg, body fat = 33.9 ± 8.8 kg, lean body mass = 65 ± 8 kg, waist/hip ratio = 0.9 ± 0.07) | α-diversity: ↑ Elite athletes compared with both control groups, no difference between the control groups. Elite athletes—High BMI controls: ↑ 48 taxa (top 6 → Firmicutes, Ruminococcaceae, S24-7, Succinivibrionaceae, RC9, Succinivibrio), ↑ Family Akkermansiaceae (p = 0.049) + Genus Akkermansia (p = 0.035), ↓ Bacteroidetes (p = 0.022). Elite athletes—Low BMI controls: ↑ 40 taxa (top 6 → Prevotellaceae, Erysipelotrichaceae, S24-7, Succinivibrionaceae, Prevotella, Succinivibrio), ↓ Lactobacillaceae (p = 0.001), Bacteroides (p = 0.035), Lactobacillus (p = 0.001). High BMI controls—Low BMI controls: difference in 7 taxa, ↑ Dorea (p = 0.026), Pseudobutyrivibrio (p = 0.022), ↓ Ruminococcaceae Incertae Sedis (p = 0.021), Akkermansia (p = 0.006). |
| Dekker Nitert et al., 2020 [35] | 36 | M and F | No back pain: 34 (25–42) Back pain: 30 (27–36) | ≥25. No back pain: 29.9 (28.0–32.4) Back pain: 30.9 (28.2–34.5) | No back pain: WHR = 1.1 (0.8–1.4) Back pain: WHR = 1.1 (0.9–1.2) | Adlercreutzia: positively correlated with BMI (p = 0.03). |
| Durk et al., 2019 [65] | 37 | M and F | 25.7 ± 2.2 (22–32) | 23.7 ± 3.6 (17.9–31.4) | Body fat % = 23.1 ± 9.1 (7.0–38.0), fat mass kg = 16.2 ± 8.0 (4.1–40.2), fat-free mass kg = 53.0 ± 11.4 (33.7–80.1) | F/B: statistically correlated only with VO2max (p < 0.003) No other BMI or body composition variables were significantly correlated. |
| F S Teixeira et al., 2013 [66] | 32 | F | Lean: 28.05 ± 6.9 Obese: 30.7 ± 5.7 | Lean: 20.6–21.9 Obese: 32.8–36.7 | Lean (waist circumference cm = 66.5–72.0, body fat % = 18.0–23.8) Obese (waist circumference cm = 89.5–97.0, body fat % = 36.7–38.9) | Obese: ↓ Lactobacillus plantarum, Akkermansia muciniphila (p = 0.06), Bifidobacterium genus, Bifidobacterium longum, Clostridium coccoides, Clostridium leptum (p < 0.05) → negative correlations with BMI and waist circumference (p < 0.05). Body fat %: correlated inversely with Bifidobacterium genus, Bifidobacterium longum, Clostridium leptum, Clostridium coccoides, Lactobacillus plantarum (p < 0.05). |
| Fernandes et al., 2014 [67] | 94 | M and F | LN: 32.0 ± 1.8 OWOB: 37.9 ± 2.0 | LN: 21.8 ± 0.3 OWOB: 30.3 ± 0.7 | NR | Obese: ↓ Escherichia coli (p = 0.005). F/B: not significantly different between 2 groups. Combined 2 groups: BMI → inversely related to Bacteroidetes (r = −0.21, p = 0.04) and E. coli (r = −0.34, p = 0.002), no association with F/B. |
| Gallè et al., 2020 [79] | 140 | M and F | 22.5 ± 2.9 (18–36) | 22.4 ± 2.8 (15.2–33.8) | NR | Phyla: 28 different phyla detected—the most abundant → Firmicutes (61.6 ± 14.6) and Bacteroidetes (30.7 ± 13.3). BMI (underweight/normal-weight—overweight/obese): No significant differences in Shannon index, Firmicutes, Bacteroidetes, and F/B. Genera → ↑ Selemonas (p = 0.02), Megasphaera (p = 0.001), Streptococcus (p = 0.001), Dorea (p = 0.001), Lachnobacterium (p = 0.007), Jannaschia (p = 0.02), Dialister (p = 0.001), Eubacterium (p = 0.01), ↓ Paraprevotella (p = 0.01) in overweight/obese compared with underweight/normal-weight participants. |
| Henning et al., 2019 [36] | 63 | M and F | CTRL: 36.4 ± 10.8 AVO: 42.5 ± 12.7 | CTRL: 30.0 ± 3.7 AVO: 30.1 ± 3.2 | CTRL: Total body fat % = 38.3 ± 8.5 AVO: Total body fat % = 41.2 ± 5.1 | Baseline bacteria: Phylum (CTRL, AVO) → Firmicutes (61.29 ± 11.00, 53.91 ± 10.02), Bacteroidetes (26.94 ± 9.83, 34.88 ± 14.41), Actinobacteria (7.24 ± 6.07, 7.59 ± 7.86), Euryarcheota (1.76 ± 2.95, 1.05 ± 2.42), Verrucomicrobia (0.75 ± 1.90, 1.23 ± 1.73), Proteobacteria (1.09 ± 1.61, 0.89 ± 1.22). Family (CTRL, AVO)—Top 3 → Bacteroidaceae (Bacteroidetes) (17.27 ± 11.31, 23.37 ± 12.55), Ruminococcaceae (Firmicutes) (20.03 ± 6.02, 18.54 ± 7.33), Lachnospiraceae (Firmicutes) (16.56 ± 5.89, 15.37 ± 4.82). Genus (CTRL, AVO)—Top 3 → Bacteroides (Bacteroidetes) (17.27 ± 11.31, 23.37 ± 12.55), Clostridium (Firmicutes) (8.75 ± 3.17, 8.20 ± 3.41), Dialister (Firmicutes) (0.39 ± 0.61, 0.63 ± 1.01). |
| Hjorth et al., 2019 [37] | 52 | M and F | 0-P: 47.9 ± 6.8 Low P/B: 43.4 ± 8.7 High P/B: 41.8 ± 11.5 | 0-P: 30.7 ± 1.1 Low P/B: 29.7 ± 2.2 High P/B: 31.9 ± 2.8 | 0-P: Body fat % = 48.7 ± 3.9 Low P/B: Body fat % = 44.9 ± 4.1 High P/B: Body fat % = 44.4 ± 5.0 | Baseline: High P/B group → statistically significant ↑ body weight, BMI, relative abundance of Prevotella spp. and ↓ relative abundance of Bacteroides spp. |
| Janssens et al., 2016 [73] | 58 | M and F | Green tea: 28.2 ± 10.8 Placebo: 28.1 ± 10.5 | Green tea: 23.0 ± 4.0 Placebo: 23.6 ± 4.6 | Green tea (FMI kg/m2 = 6.9 ± 3.1, FFMI kg/m2 = 16.1 ± 1.9, WHR = 0.76 ± 0.09, FM kg = 19.9 ± 8.9, FFM kg = 46.9 ± 9.1, body fat % = 29.1 ± 8.2) Placebo (FMI kg/m2 = 7.2 ± 3.5, FFMI kg/m2 = 16.3 ± 2.0, WHR = 0.73 ± 0.08, FM kg = 20.4 ± 9.0, FFM kg = 47.2 ± 9.1, body fat % = 29.5 ± 8.7) | Participants categorized based on their BMI as normal-weight (18–25 kg/m2) and overweight (≥25 kg/m2). Baseline: Overweight → ↓ Shannon diversity index (α-diversity) for all phyla combined compared with normal-weight subjects (r = −0.39; p = 0.002). |
| Joller et al., 2020 [76] | 26 | F | 25–35 | 30–35 | NR | Baseline: 3 different enterotypes (most common to less common) → Enterotype 3—Firmicutes/Ruminococcus observed enriched in 21 females, Enterotype 2—Prevotella observed enriched in 3 females, Enterotype 1—Bacteroides observed enriched in 2 females. F/B ratio: ↑ (>1.6) in 12 females. |
| Kasai et al., 2015 [80] | 56 | M and F | N-Ob: 45.6 ± 9.6 Ob: 54.4 ± 8.2 | Non-obese: BMI < 20 Obese: BMI ≥ 25 | NR | Phylum: Obese → ↓ Bacteroidetes, ↑ F/B ratio, bacterial diversity and richness. Species: Obese → significantly associated with Blautia hydrogenotorophica (Firmicutes), Coprococcus catus (Firmicutes), Eubacterium ventriosum (Firmicutes), Ruminococcus bromii (Firmicutes), Ruminococcus obeum (Firmicutes); Non-obese → Bacteroides faecichinchillae, Bacteroides thetaiotaomicron, Blautia wexlerae, Clostridium bolteae, Flavonifractor plautii |
| Kobayashi et al., 2015 [38] | 92 | M | 21–59 | Lean: <18.5 Obese: >25.0 (17.3–30.2) | NR | Bacillus spp., Erysipelothrix spp., Holdemania spp. → related to lean group. Microbacteriaceae, Actinobacterium → related to obese group → Presence of Firmicutes and Actinobacteria may be related to BMI. |
| Koliada et al., 2017 [77] | 61 | M and F | 20–60+ | Underweight: <18.5 Normal: 18.5–24.9 Overweight: 25.0–29.9 Obese: ≥30 | NR | Phylum: ↑ BMI → ↑ Firmicutes, F/B ratio, ↓ Bacteroidetes |
| Million et al., 2013 [16] | 263 | M and F | 50 ± 17 | Anorexic: 13.5 (11.7–14.6) Lean: 22.4 (20.7–23.7) Overweight: 27.1 (25.9–28.6) Obese: 40.0 (36.4–46.8) | NR | Positive correlation with BMI: Lactobacillus reuteri (p = 0.02). Negative correlation with BMI: Bifidobacterium animalis (p = 0.03), Methanobrevibacter smithii (p = 0.08), Escherichia coli (p < 0.001). |
| Most et al., 2017 [68] | 37 | M and F | 37.8 ± 1.6 | 29.6 ± 0.5 | EGCG + RES (waist/hip ratio = 0.88 ± 0.02, body fat % = 29.7 ± 1.9) F (waist/hip ratio = 0.87 ± 0.02, body fat % = 31.6 ± 1.4) | Baseline bacteria: Genus (PLA—EGCG + RES) → Bacteroidetes % (82.5 ± 2.9–84.3 ± 2.9), Firmicutes % (12.6 ± 2.1–12.5 ± 2.7), Actinobacteria % (2.8 ± 1–2 ± 0.5), γ-Proteobacteria % (1.7 ± 0.4–1.1 ± 0.3), Akkermansia muciniphila % (0.4 ± 0.2–0 ± 0). Males compared with Females → ↑ Bacteroidetes (p < 0.001), ↓ Firmicutes (p < 0.001), Actinobacteria (p = 0.04). |
| Murtaza et al., 2019 [39] | 21 | M | 20–35 | 16.91–23.03 | NR | Baseline bacteria: 3 distinct clusters (genus) → Cluster 1—Prevotella dominant, Cluster 2—Bacteroides dominant, Cluster 3—Firmicutes dominant. Cluster 1 and Cluster 2 were more common. Shannon diversity → no significant differences between 3 clusters. |
| Palmas et al., 2021 [40] | 92 | M and F | NW: 49 ± 11 OB: 50 ± 12 | NW: 21.6 ± 2.1 OB: 36.0 ± 6.0 | NW (waist circumference cm = 73.7 ± 5.7) OB (Fat mass kg = 39.1 ± 11.9, fat mass % = 42.3 ± 5.7, muscle mass kg = 48.5 ± 11.3, waist circumference cm = 111 ± 15) | Richness and diversity: α-diversity → ↓ in obese group, although no significant difference in Shannon index (p = 0.833). β-diversity → significant difference between 2 groups (p = 0.002). Bacterial abundance: Obese → ↑ F/B ratio (p = 0.007), Firmicutes and Firmicutes taxa (main biomarkers: Lachnospiraceae, Megasphaera spp. + Gemellaceae, Paenibacilleae, Streptococcaceae, Thermicanaceae, Gemella, Mitsuokella, Streptococcus, Acidaminococcus spp., Eubacterium spp., Ruminococcus spp., Megamonas spp., Streptococcus, Thermicanus, Veillonella spp.), Proteobacterium taxa (main biomarkers: Escherichia, E. albertii), ↓ Bacteroidetes and Bacteroidetes taxa (main biomarkers: Flavobacteria, Flavobacterium, Bacteroides spp. + Porphyromonadaceae, Sphingobacteriaceae, Rikenella spp., Pedobacter spp., Parabacteroides spp.). Body fat and waist circumference → negatively correlated with Bacteroidetes taxa. Body fat → positively correlated with Firmicutes taxa. Muscle mass and physical activity → negatively correlated with Firmicutes taxa. |
| Resende et al., 2021 [41] | 24 | M | 20–45 | CG: 23.68 ± 3.29 EG: 25.28 ± 4.11 (18.5–29.9) | CG (%FM = 21.87 ± 12.18, %FFM = 78.12 ± 12.18) EG (%FM = 23.59 ± 11.63, %FFM = 76.40 ± 11.63) | Baseline bacteria. 10 phyla were detected → most abundant: Bacteroidetes, Firmicutes, Proteobacteria—no statistical difference between 2 groups. BMI: negative correlation with Desulfovibrio. Body fat: negative association with Faecalibacterium. Fat-free mass %: positive association with Faecalibacterium. |
| Sergeev et al., 2020 [42] | 20 | M and F | Placebo: 47.0 ± 15.4 Synbiotic: 47.8 ± 8.99 | Placebo: 32.77 ± 4.51 Synbiotic: 34.20 ± 5.60 | Placebo (body mass kg = 97.6 ± 23.1, WC = 106.9 ± 12.47, body fat mass kg = 40.66 ± 6.92, body fat % = 40.97 ± 5.02, body lean mass kg = 57.39 ± 17.76, BMC kg = 2.66 ± 0.64, body lean mass + BMC kg = 60.05 ± 18.38) Synbiotic (body mass kg = 90.6 ± 11.9, WC = 109.6 ± 8.07, body fat mass kg = 36.97 ± 11.35, body fat % = 40.51 ± 8.96, body lean mass kg = 51.13 ± 8.87, BMC kg = 2.38 ± 0.48, body lean mass + BMC kg = 53.52 ± 9.35) | Baseline bacteria: Firmicutes and Bacteroidetes → the 2 most abundant phyla, Bacteroides → the most abundant genus. |
| Valeriani et al., 2020 [43] | 59 | M and F | 23.1 ± 3.14 (20–36) | 22.2 ± 2.6 (16.6–29.7) | NR | Phylum: Most abundant → Firmicutes (61.6 ± 14.6), Bacteroidetes (30.7 ± 13.3). Correlation analysis: BMI → positive but not significant correlation with Firmicutes (r = 0.22; p = 0.08), Bacteroidetes (r = 0.06; p = 0.63), F/B ratio (r = 0.11; p = 0.38). |
| Whisner et al., 2018 [44] | 82 | M and F | 18.4 ± 0.6 | <18.5 18.5–24.9 25.0–29.9 ≥30 | NR | F/B ratio: 0.65 (0.39–1.23) → no statistically significant difference by BMI (p = 0.413). |
| Yang et al., 2017 [45] | 71 | F | 19–49 | Low VO2max: 31.7 (30.2–33.1) Moderate VO2max: 27.9 (26.7–29.1) High VO2max: 24.6 (23.0–26.2) | Low VO2max (fat % = 40.6 (38.1–43.0)) Moderate VO2max (fat % = 35.5 (33.2–37.8)) High VO2max (fat % = 28.0 (25.0–31.0)) | Eubacterium rectale–Clostridium coccoides: positively correlated with fat% → ↑ in low VO2max, followed by moderate and high VO2max. |
| Zuo et al., 2011 [81] | 104 | M and F | Normal-weight: 33.02 ± 10.37 Obese: 34.65 ± 11.91 | Normal-weight: 20.26 ± 1.50 (18.5–24) Obese: 30.79 ± 2.80 (≥28) | NR | Obese: ↓ Bacteroides (p = 0.012), Clostridium perfringens (p = 0.001). No other statistically significant differences in Escherichia coli, Enterococci, Lactobacilli, Bifidobacteria between groups → Enterococci: tendency to be ↑ in the obese group. |
| Author(s), Date | N | Sex | Age (Years) | BMI Category (kg/m2) | Body Composition | Results |
|---|---|---|---|---|---|---|
| Morita et al., 2019 [74] | 29 | F | 70 (66–75) | 21.4 (18.8–23.1) | Body fat % = 29.0 (23.6–32.7) | Baseline bacteria: Genus (TM group—AE group) → Bacteroides (40.7%–43.0%), Clostridium subcluster XIVa (16.6%–17.9%), Bifidobacterium (not available %), Clostridium cluster IV (not available %). |
| Šoltys et al., 2021 [46] | 22 | M | LA: 63.5 (61.4–65.7) CTRL: 64.9 (62.1–67.7) | LA: 24.8 (24.0–25.6) CTRL: 27.3 (24.9–29.7) | LA (total body fat % = 19.4 (17.3–21.5), visceral body fat = 9.5 (8.3–10.6), muscle mass % = 37.44 (34.9–40.0)) CTRL (total body fat % = 26.2 (21.9–30.5), visceral body fat = 14.1 (10.6–17.7), muscle mass % = 34.4 (27.6–44.9)) | Dominant phylum (CTRL/LA): Firmicutes (73.9%/75.6%), Bacteroidetes (18.6%/14.4%), Proteobacteria (0.5%/1.5%). F/B ratio + α-diversity: no statistical difference between 2 groups. Family level: LA → ↑ Ruminococcaceae, ↓ Bacteroidaceae, Clostridiales Incertae Sedis XI, Cytophagia. Genus level: LA → ↑ Prevotella, Intestimonas, Subdoligranulum, Pseudobutyrivibrio, Marvinbryantia, Vallitalea, Porphyromonas, Anaerovorax, ↓ Bacteroides, Anaerosporobacter, Phascolarctobacterium, Bacteroides/Prevotella ratio. |
| Tamura et al., 2017 [47] | 56 | M and F | 72.1 ± 0.6 (65–84) | 23.1 ± 0.4 | NR | Most abundant families: Lachnospiraceae (25.4% ± 1.3%), Ruminococcaceae (13.5% ± 1.0%), Bifidobacteriaceae (9.9% ± 1.2%), Streptococcaceae (6.0% ± 1.2%), Bacteroidaceae (5.9% ± 0.7%), Eubacteriaceae (4.9% ± 0.4%), Coriobacteriaceae (4.3% ± 0.5%), Peptostreptococcaceae (2.8% ± 0.5%), Enterobacteriaceae (2.0% ± 0.5%), Erysipelotrichaceae (1.7% ± 0.4%), Clostridiaceae (1.5% ± 0.3%), Lactobacillaceae (1.0% ± 0.2%), Porphyromonadaceae (0.8% ± 0.1%), Rikenellaceae (0.7% ± 0.1%), Prevotellaceae (0.6% ± 0.2%). Correlations between BMI and fecal microbiota: Negative correlations → Porphyromonadaceae (r = −0.342), Rikenellaceae (r = −0.299), Christensenellaceae (r = −0.341), Oxalobacteraceae (r = −0.329)—Positive correlations → Aerococcaceae (r = 0.32). |
| Tavella et al., 2021 [48] | 201 | M and F | 71.2 ± 3.8 (65–79) | G1: 27.04 ± 3.60 G2: 24.68 ± 3.25 G3: 28.48 ± 4.18 | G1 (waist circumference cm = 93.12 ± 11.63, hip circumference cm = 1014.3 ± 7.75, waist/hip ratio = 0.92 ± 0.09) G2 (waist circumference cm = 84.75 ± 9.31, hip circumference cm = 97.58 ± 7.36, waist/hip ratio = 0.86 ± 0.07) G3 (waist circumference cm = 95.79 ± 11.05, hip circumference cm = 104.75 ± 7.04, waist/hip ratio = 0.91 ± 0.08) | Overall: Most abundant phylum → Firmicutes (80%), Bacteroidetes (8.9%), Actinobacteria (7.4%). Most abundant family → Ruminococcaceae (37.5%), Lachnospiraceae (27.6%)—both belonging to Firmicutes). Most abundant genus → Subdoligranulum (12.5%), Faecalibacterium (7.8%), Bifidobacterium (4.6%). 3 groups: G1, G2, G3. α-diversity: ↑ G2, G3. G1 → enriched in Lachnospiraceae (Eubacterium rectale group, Fusitanetibacter, Blautia: negatively correlated with SMI—positively correlated with DXA variables, especially those related to fat mass distribution—FM, FMI, AF/AL, AF/GF, VAT) G2 (significantly ↓ anthropometric and body composition values) → enriched in Christensellaceae, Porphyromonadaceae, Rikenellaceae (Christensellaceae R7 group, Parabacteroides, Alistipes: inversely associated with DXA variables—visceral adipose tissue) G3 → enriched in Ruminococcaceae (Ruminococcaceae UCG 014, 002, 005: negatively correlated with most adiposity-related DXA variables, directly correlated with SMI and Faecalibacterium, Subdoligranulum, Ruminococcus: positively correlated with most adiposity-related DXA variables, negatively correlated with SMI). |
| Author(s), Date | N | Sex | Age (Years) | BMI Category (kg/m2) | Body Composition | Results |
|---|---|---|---|---|---|---|
| Kulecka et al., 2020 [49] | 71 | M and F | 14–72 | NR | FMR (TBW lt = 30.9 ± 4.4, BF kg = 8.2 ± 1.1, FFM kg = 42.2 ± 5.9, MM kg = 23.4 ± 3.25) FCCS (TBW lt = 36.5 ± 2.7, BF kg = 9.3 ± 1.8, FFM kg = 50 ± 3.9, MM kg = 28.3 ± 2.3) MMR (TBW lt = 43.2 ± 3.6, BF kg = 5.9 ± 2.7, FFM kg = 59.8 ± 5.1, MM kg = 38.5 ± 10.1) MCCS (TBW lt = 49 ± 3.4, BF kg = 4.9 ± 1, FFM kg = 67 ± 4.74, MM kg = 39.3 ± 2.9) | Both athlete groups (MR, CCS) compared with healthy controls: ↓ Bacteroides, ↑ Prevotella, microbial diversity, and richness. F/B ratio: ↓ in healthy controls compared with CCS (p = 0.043), no statistically significant difference between healthy controls and MR. |
| La-Ongkham et al., 2020 [50] | 120 | M and F | Adult: 34.60 ± 3.19, elderly: 69.53 ± 3.44 | Adult: 22.39 ± 3.33, elderly: 24.30 ± 2.68 | NR | Phylum: >96% belonged to Firmicutes, Bacteroidetes, Proteobacteria, Actinobacteria. Statistically significant differences only in Bacteroidetes and Actinobacteria. Elderly → ↑ Bacteroidetes (phylum) (p = 0.019)—Bacteroidaceae (family) (p = 0.001)—Bacteroides (genus) (p = 0.001)—species: Bacteroides uniformis, Bacteroides ovatus, Bacteroides caccae, Bacteroides thetaiotaomicron, Parabacteroides (genus) (p = 0.02), ↓ Actinobacteria (phylum) (p = 0.001)—Bifidobacteriaceae (family) (p = 0.001)—Bifidobacterium (genus) (p = 0.001)—species: Bifidobacterium adolescentis, Bifidobacterium longum, Bifidobacterium pseudocatenulatum, Dorea (genus) (p = 0.01), F/B ratio (p = 0.01). ↑ age → ↓ Bifidobacterium, ↑ Bacteroides. |
| Latorre-Pérez et al., 2021 [51] | 528 | M and F | 18.3–71 | 17.26–36.33 | NR | All participants: Dominant phylum → Firmicutes (53.9%), Bacteroidetes (37.2%), Proteobacteria (5%), Verrucomicrobia (1.8%), Actinobacteria (0.9%). Dominant genera → Bacteroides (18.4%), Faecalibacterium (12.5%) (12.5%), Prevotella (6.7%), Alistipes (3.4%), Oscillospiraceae taxa (2.3%). ↑ BMI → positive correlation with Roseburia (genus), proteobacteria (phylum)—negative association with Marvinbryantia (genus) and Christensenellaceae (family). ↑ Age → ↓ Faecalibacterium, Bifidobacterium, ↑ alpha diversity—no significant associations with Akkermansia and Bacteroides |
| Martínez-Cuesta et al., 2021 [52] | 26 | M and F | 18+ | Normo-weight (N): 18–25, obese (O): >30 | NR | Richness and diversity: Obese → ↓ Chao1 index (α diversity), no other statistical differences. Phylum: No statistical differences in Firmicutes, Bacteroidetes, F/B ratio. Family: Obese → ↓ Ruminococcaceae, Rikenellaceae, Peptostreptococcaceae, Clostridiales. Genus: Obese → ↑ Collisnella, Clostridium XIVa, Catenibacterium, ↓ Alistipes, Clostridium sensu stricto, Romboutsia, Oscilibacter. |
| Oki et al., 2016 [53] | 516 | M and F | 52.4 ± 13.4 (21–88) | Lean: <25, obese: >30 | NR | Predominant bacterial families: Bacteroidaceae (33.1 ± 19.0%), Lachnospiraceae (17.6 ± 10.1%), Ruminococcaceae (15.8 ± 9.3%), Prevotellaceae (9.1 ± 18.0%). Obese: ↓ Christensenellaceae, Mogibacteriaceae, Rikenellaceae (p < 0.05). |
| Schwiertz et al., 2010 [54] | 98 | M and F | 47 ± 13 (14–74) | Lean: 18.5–24.9, overweight: 25.0–29.9, obese: ≥30.0 | NR | Most abundant bacterial groups in all groups: Clostridium leptum group, Clostridium coccoides group, Bacteroides spp. → all belonged to Firmicutes and Bacteroidetes phyla. Differences between groups: Overweight/obese compared with lean → ↓ Firmicutes (p = 0.001, p = 0.002), F/B ratio (p = 0.001, p = 0.005), Ruminococcus flacefaciens subgroup (phylum: Firmicutes; p = 0.006, p = 0.011), ↑ Bacteroidetes (p = 0.001, p = 0.006). Overweight compared with lean → ↑ Bacteroides (p = 0.002). Obese compared with lean → ↓ Clostridium leptum group (p = 0.07), Bifidobacterium (p = 0.02), Methanobrevibacter (p = 0.017). |
| α-diversity | Phyla | Genera (Phylum) | Species | ||||||||||||||||||
|---|---|---|---|---|---|---|---|---|---|---|---|---|---|---|---|---|---|---|---|---|---|
| Bacteroidetes | Firmicutes | Firmicutes/ Bacteroidetes Ratio | Akkermansia (Verrucomicrobia) | Alistipes (Bacteroidetes) | Bacteroides (Bacteroidetes) | Bifidobacterium (Actinobacteria) | Dorea (Firmicutes) | Eubacterium (Firmicutes) | Faecalibacterium (Firmicutes) | Intestimonas (Firmicutes) | Lactobacillus (Firmicutes) | Megasphaera (Firmicutes) | Oscilibacter (Firmicutes) | Streptococcus (Firmicutes) | Faecalibacterium Prausnitzii | Lactobacillus Plantarum | Akkermansia Muciniphila | Roseburia spp. | |||
| Children | Normo-weight | ↑ | ↑ | ↓ | ↓ | ↑ | – | ↑ | ↑ | ↓ | ↓ | – | – | – | – | ↑ | – | ↓ | ↑ | ↑ | – |
| Overweight | ↓ | ↓ | ↑ | ↑ | ↓ | – | ↓ | ↓ | ↑ | ↑ | – | – | – | – | ↓ | – | ↑ | ↓ | ↓ | – | |
| Obese | ↓ | ↓ | ↑ | ↑ | ↓ | – | ↓ | ↓ | ↑ | ↑ | – | – | – | – | ↓ | – | ↑ | ↓ | ↓ | – | |
| Athletes | – | – | – | – | – | – | – | – | – | – | – | – | – | – | – | – | – | – | – | – | |
| Adults | Normo-weight | ↑ | ↑ | ↓ | ↓ | – | ↑ | ↑ | ↑ | ↓ | ↓ | ↑ | ↑ | ↓ | ↓ | ↑ | ↓ | ↑ | ↑ | ↑ | – |
| Overweight | ↓ | ↓ | ↑ | ↑ | – | ↓ | ↓ | ↓ | ↑ | ↑ | ↓ | ↓ | ↑ | ↑ | ↓ | ↑ | ↓ | ↓ | ↓ | – | |
| Obese | ↓ | ↓ | ↑ | ↑ | – | ↓ | ↓ | ↓ | ↑ | ↑ | ↓ | ↓ | ↑ | ↑ | ↓ | ↑ | ↓ | ↓ | ↓ | – | |
| Athletes | ↑↑ | ↓ | – | – | ↑ | – | – | – | – | – | – | – | – | – | – | – | – | – | – | ↑ | |
| Older Adults | Normo-weight | – | – | – | – | – | – | – | – | – | – | – | – | – | – | – | – | – | – | – | – |
| Overweight | – | – | – | – | – | – | ↑ | – | – | – | – | – | – | – | – | – | – | – | – | – | |
| Obese | – | – | – | – | – | – | ↑ | – | – | – | – | – | – | – | – | – | – | – | – | – | |
| Athletes | ↑↓ | – | – | ↑↓ | – | – | ↓ | – | – | – | – | ↓ | – | – | – | – | – | – | – | – | |
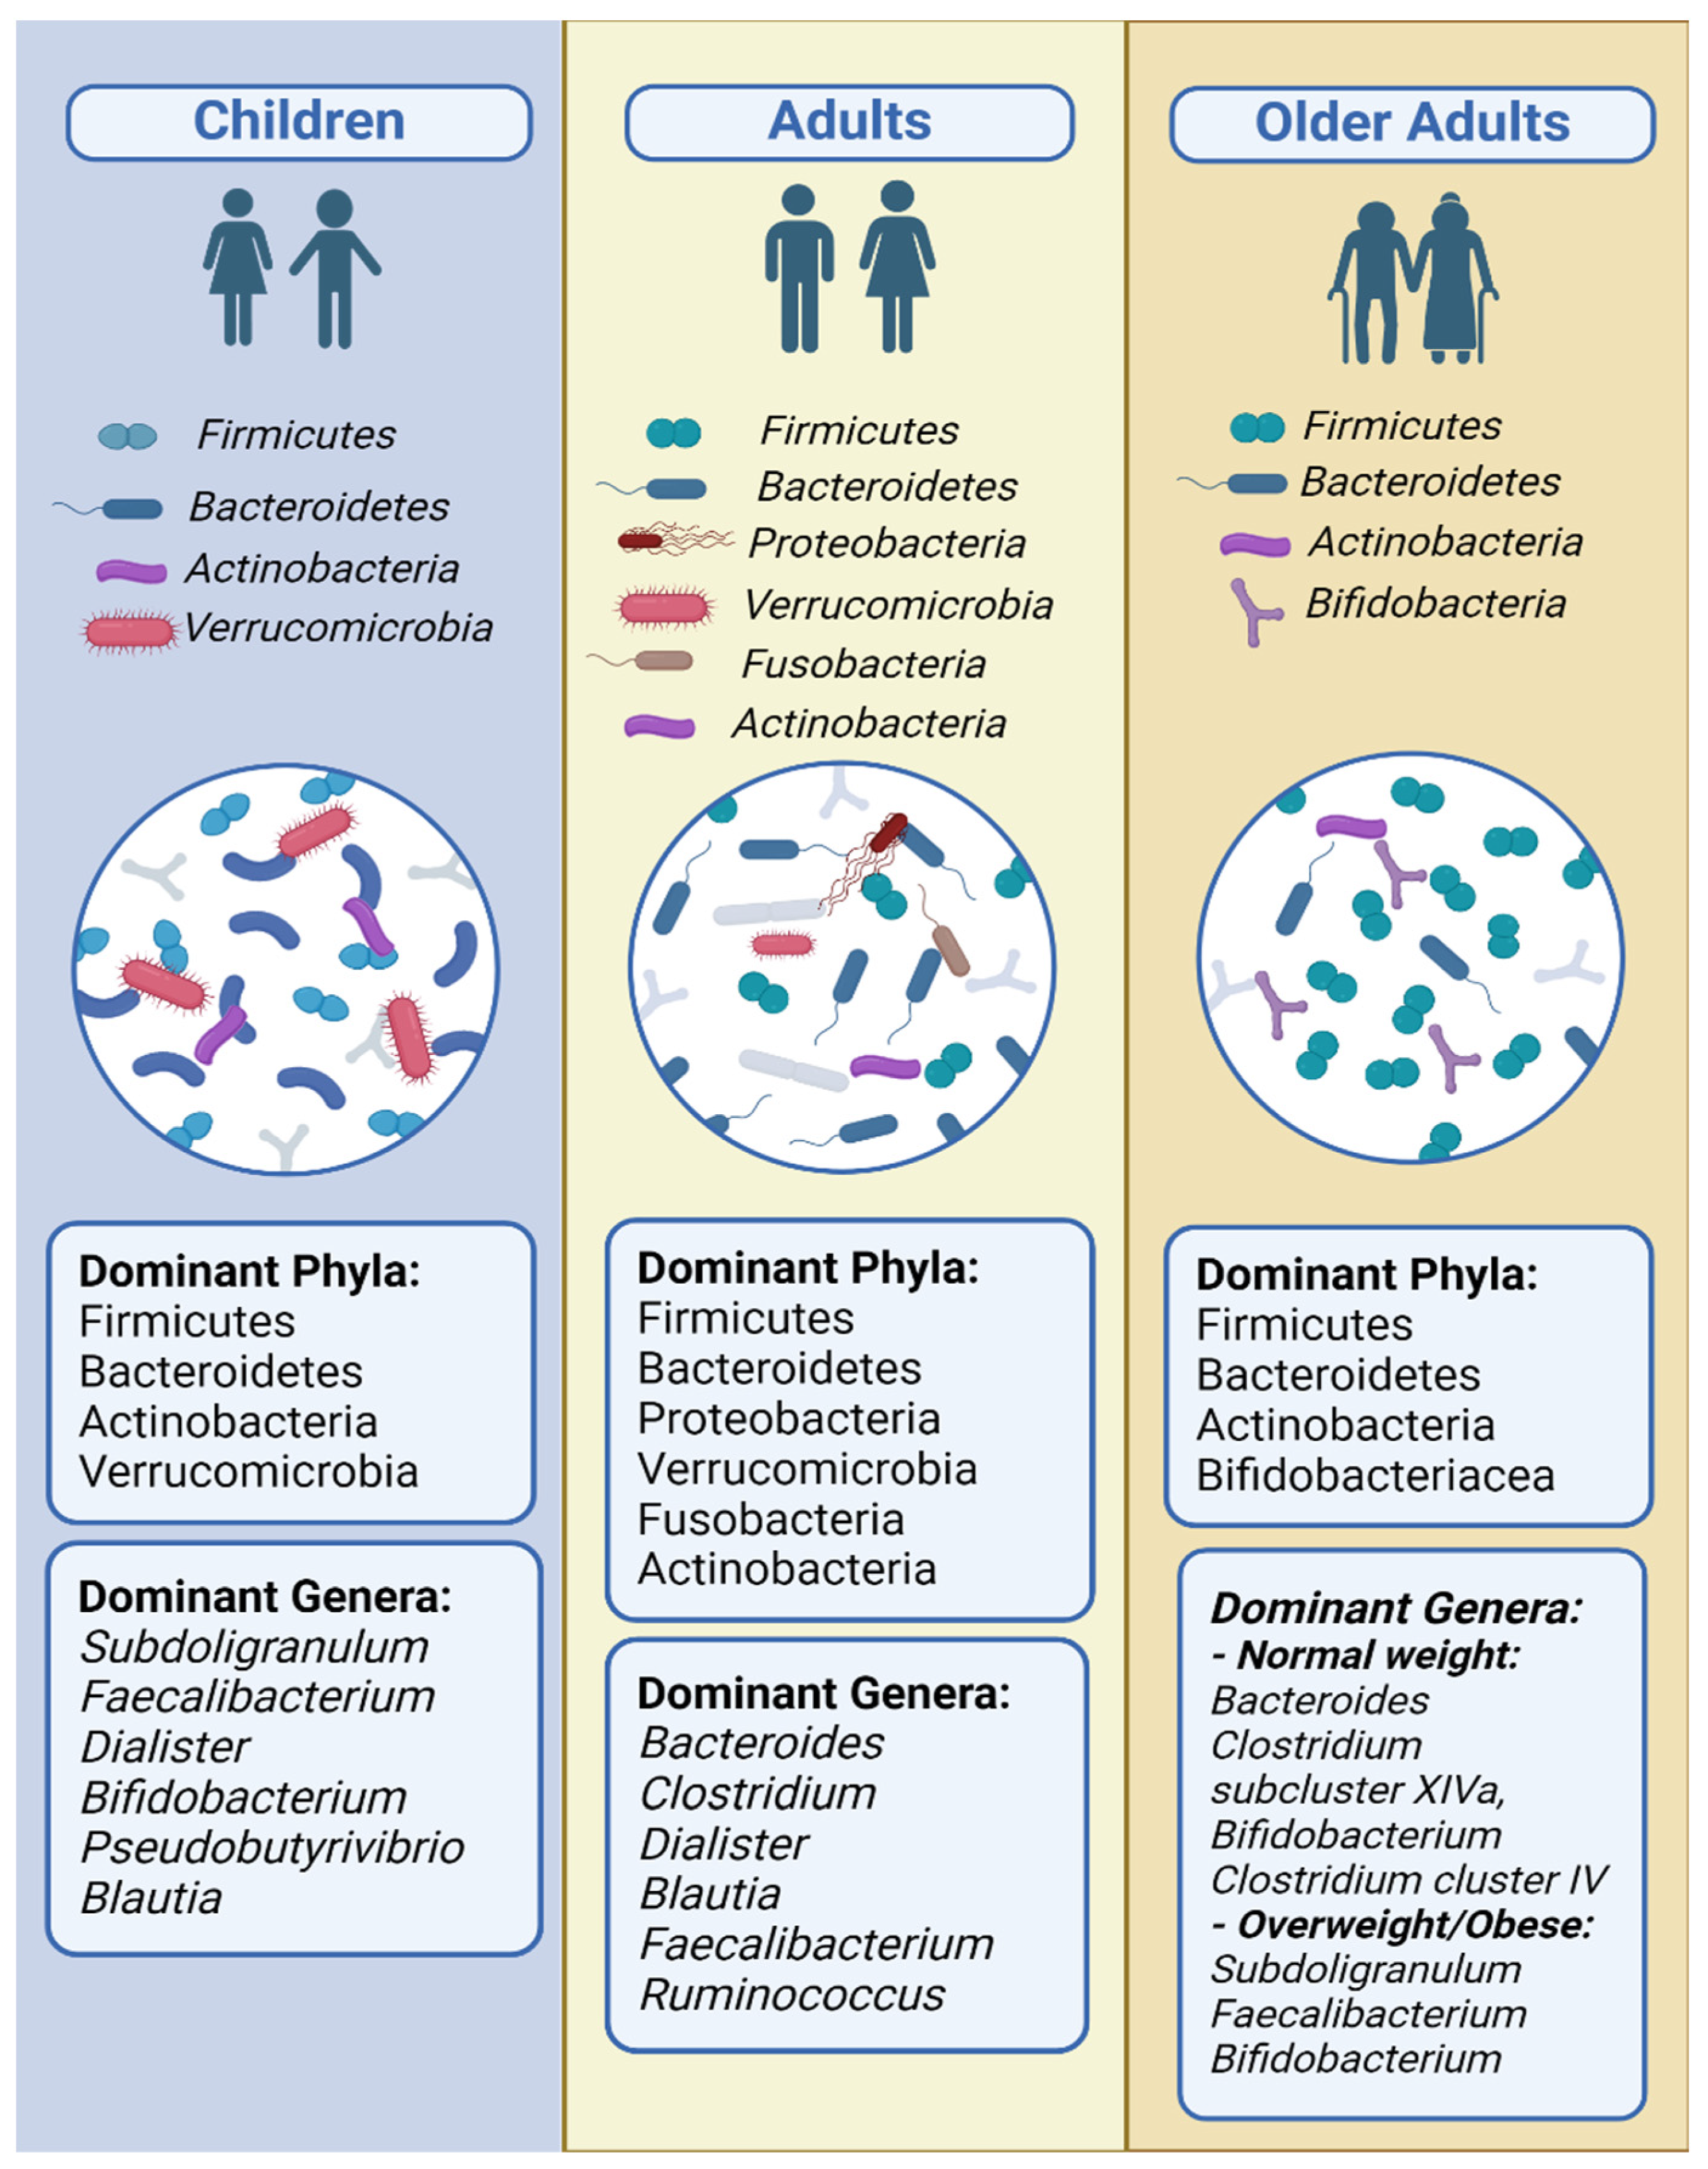
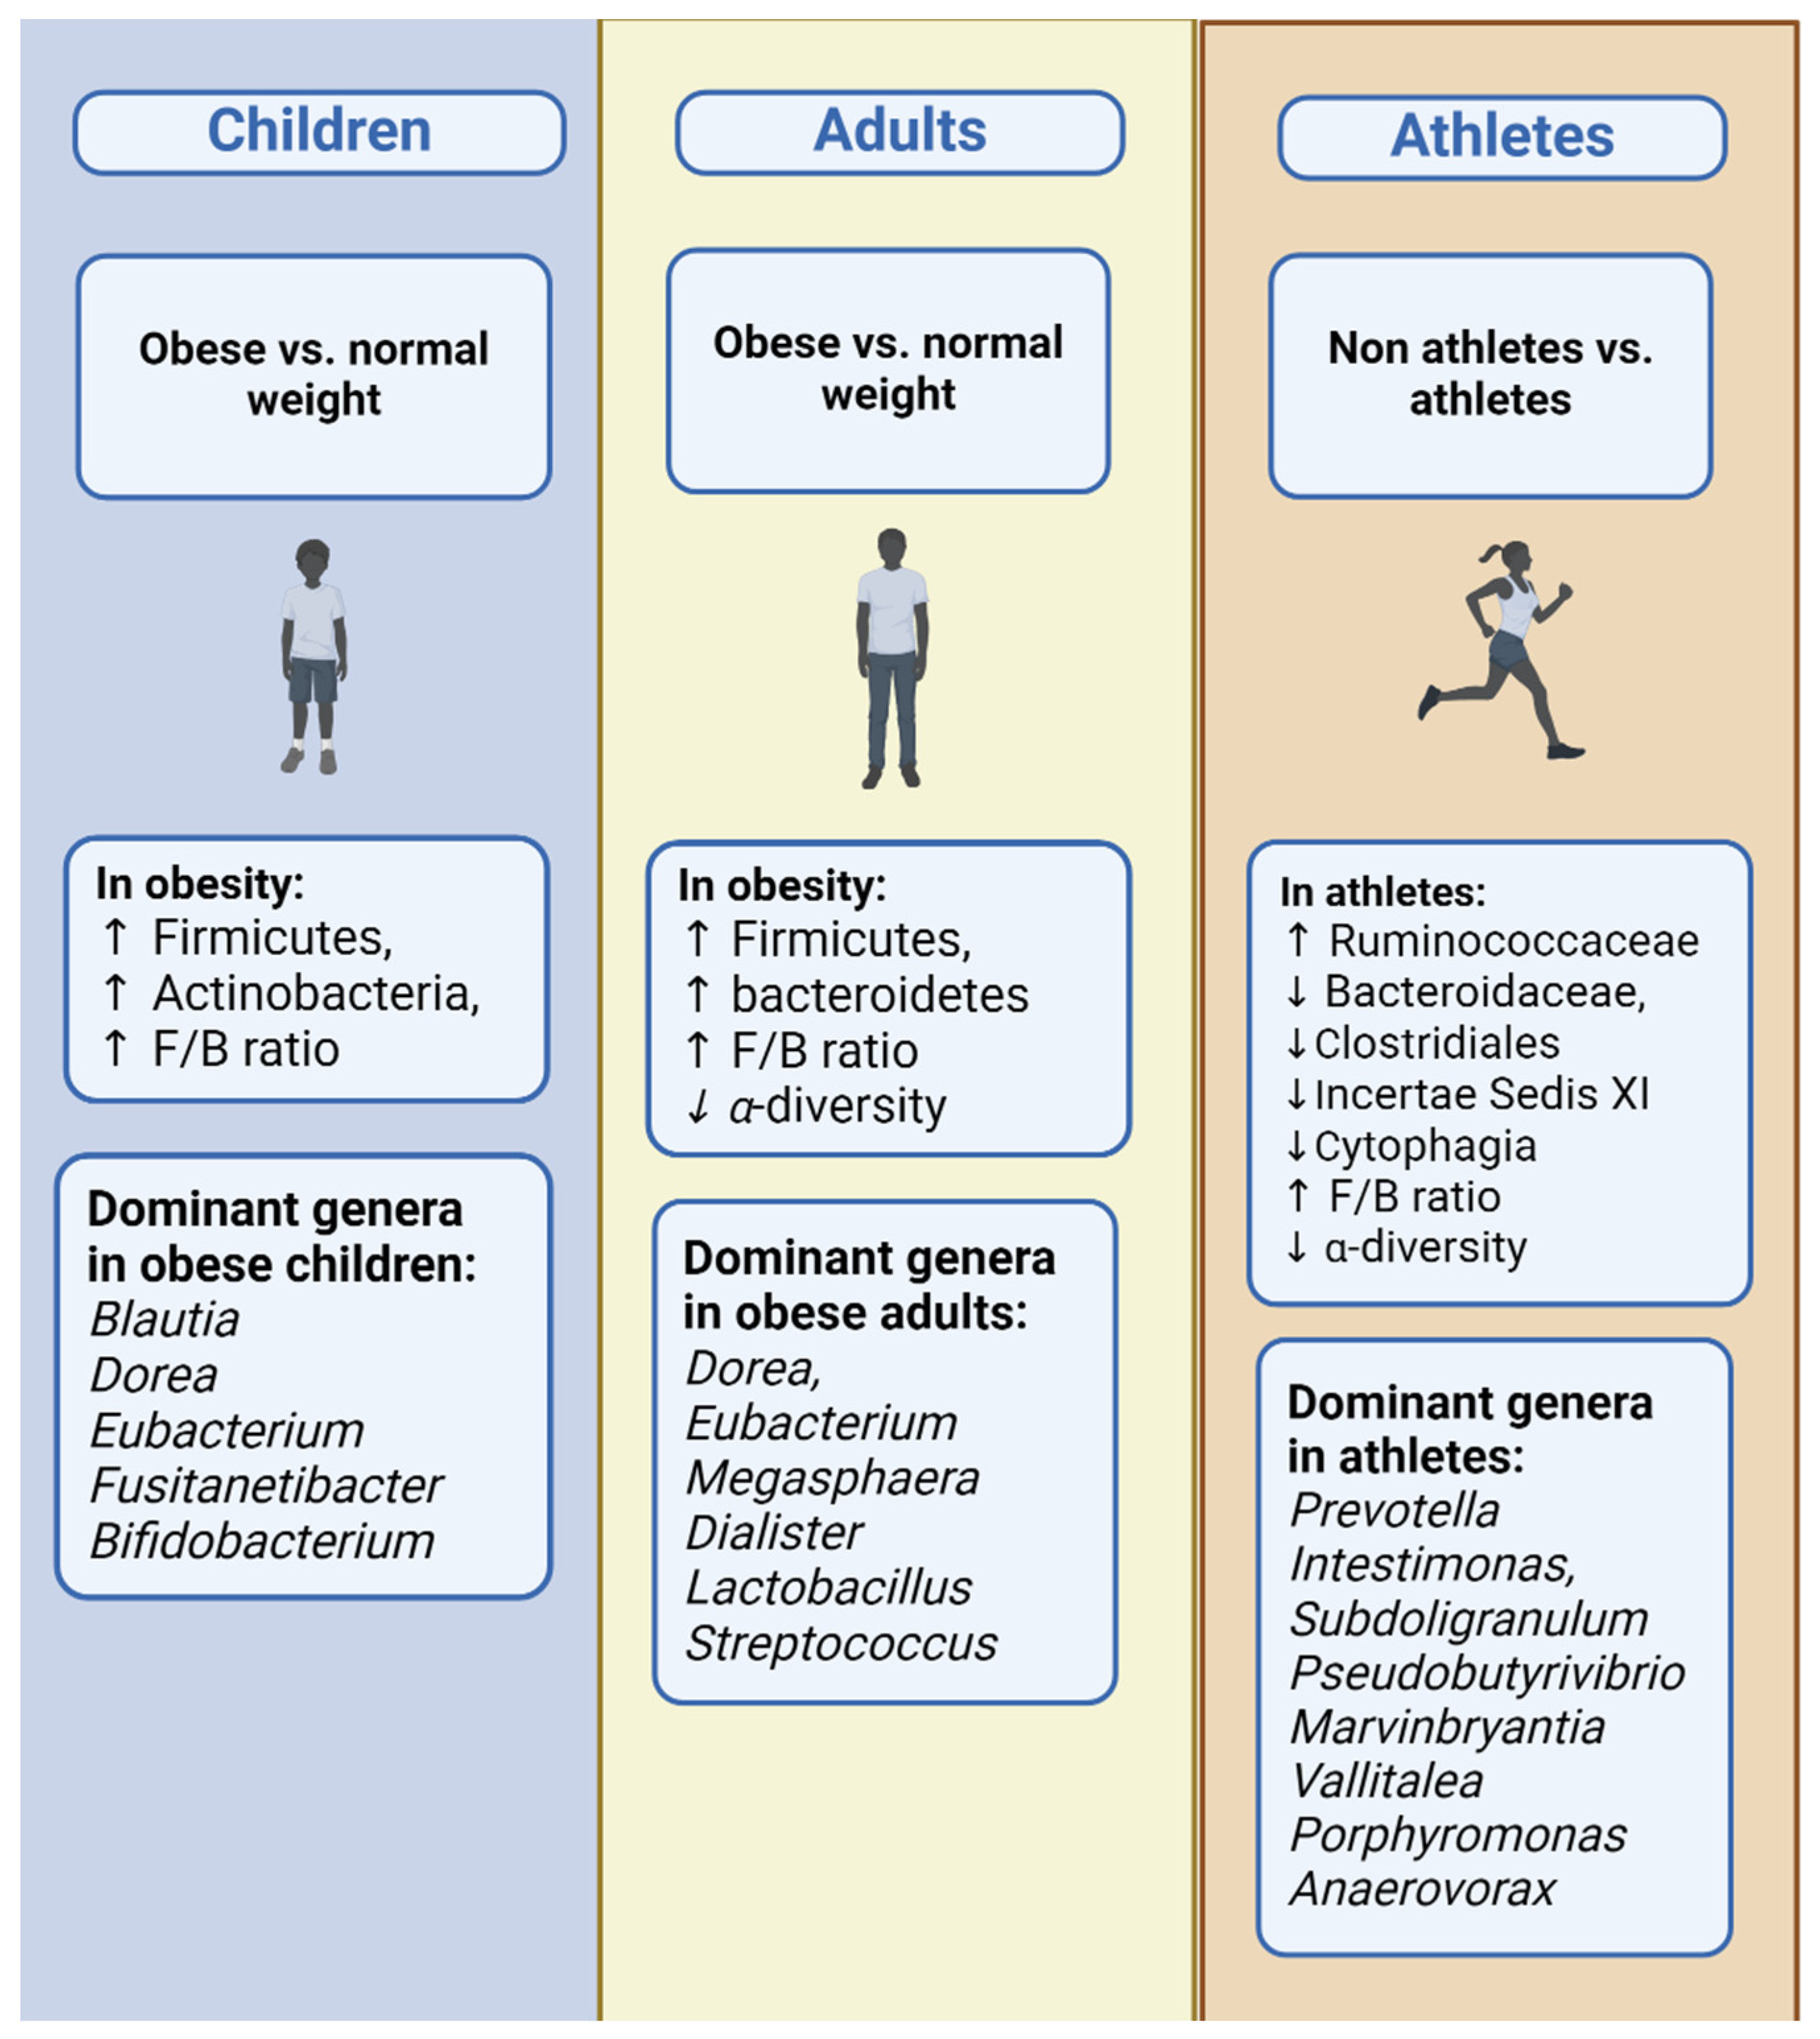
3.3. Children
3.4. Adults
3.5. Older Adults
3.6. Whole Age Range
4. Discussion
5. Conclusions
Author Contributions
Funding
Conflicts of Interest
References
- Gomaa, E.Z. Human Gut Microbiota/Microbiome in Health and Diseases: A Review. Antonie Leeuwenhoek 2020, 113, 2019–2040. [Google Scholar] [CrossRef] [PubMed]
- Heintz-Buschart, A.; Wilmes, P. Human Gut Microbiome: Function Matters. Trends Microbiol. 2018, 26, 563–574. [Google Scholar] [CrossRef] [PubMed]
- Ursell, L.K.; Metcalf, J.L.; Parfrey, L.W.; Knight, R. Defining the Human Microbiome. Nutr. Rev. 2012, 70, S38–S44. [Google Scholar] [CrossRef] [PubMed]
- Baranowski, T.; Motil, K.J. Simple Energy Balance or Microbiome for Childhood Obesity Prevention? Nutrients 2021, 13, 2730. [Google Scholar] [CrossRef]
- Appleton, J. The Gut-Brain Axis: Influence of Microbiota on Mood and Mental Health. Integr. Med. 2018, 17, 28–32. [Google Scholar]
- Heiss, C.N.; Olofsson, L.E. Gut Microbiota-Dependent Modulation of Energy Metabolism. J. Innate Immun. 2018, 10, 163–171. [Google Scholar] [CrossRef]
- de Clercq, N.C.; Groen, A.K.; Romijn, J.A.; Nieuwdorp, M. Gut Microbiota in Obesity and Undernutrition. Adv. Nutr. 2016, 7, 1080–1089. [Google Scholar] [CrossRef]
- Cornejo-Pareja, I.; Muñoz-Garach, A.; Clemente-Postigo, M.; Tinahones, F.J. Importance of Gut Microbiota in Obesity. Eur. J. Clin. Nutr. 2019, 72, 26–37. [Google Scholar] [CrossRef]
- Gomes, A.C.; Hoffmann, C.; Mota, J.F. The Human Gut Microbiota: Metabolism and Perspective in Obesity. Gut Microbes 2018, 9, 308–325. [Google Scholar] [CrossRef] [PubMed]
- Amabebe, E.; Robert, F.O.; Agbalalah, T.; Orubu, E.S.F. Microbial Dysbiosis-Induced Obesity: Role of Gut Microbiota in Homoeostasis of Energy Metabolism. Br. J. Nutr. 2020, 123, 1127–1137. [Google Scholar] [CrossRef] [PubMed]
- Bakker, G.J.; Zhao, J.; Herrema, H.; Nieuwdorp, M. Gut Microbiota and Energy Expenditure in Health and Obesity. J. Clin. Gastroenterol. 2015, 49, S13–S19. [Google Scholar] [CrossRef]
- Bliss, E.S.; Whiteside, E. The Gut-Brain Axis, the Human Gut Microbiota and Their Integration in the Development of Obesity. Front. Physiol. 2018, 9, 900. [Google Scholar] [CrossRef]
- Duca, F.A.; Lam, T.K.T. Gut Microbiota, Nutrient Sensing and Energy Balance. Diabetes Obes. Metab. 2014, 16, 68–76. [Google Scholar] [CrossRef] [PubMed]
- Companys, J.; Gosalbes, M.J.; Pla-Pagà, L.; Calderón-Pérez, L.; Llauradó, E.; Pedret, A.; Valls, R.M.; Jiménez-Hernández, N.; Sandoval-Ramirez, B.A.; del Bas, J.M.; et al. Gut Microbiota Profile and Its Association with Clinical Variables and Dietary Intake in Overweight/Obese and Lean Subjects: A Cross-Sectional Study. Nutrients 2021, 13, 2032. [Google Scholar] [CrossRef]
- Crovesy, L.; Masterson, D.; Rosado, E.L. Profile of the Gut Microbiota of Adults with Obesity: A Systematic Review. Eur. J. Clin. Nutr. 2020, 74, 1251–1262. [Google Scholar] [CrossRef] [PubMed]
- Million, M.; Angelakis, E.; Maraninchi, M.; Henry, M.; Giorgi, R.; Valero, R.; Vialettes, B.; Raoult, D. Correlation between Body Mass Index and Gut Concentrations of Lactobacillus Reuteri, Bifidobacterium Animalis, Methanobrevibacter Smithii and Escherichia Coli. Int. J. Obes. 2013, 37, 1460–1466. [Google Scholar] [CrossRef]
- Chen, Y.; Wu, G.; Zhao, Y. Gut Microbiota and Alimentary Tract Injury; Springer: Berlin/Heidelberg, Germany, 2020; pp. 11–22. [Google Scholar]
- Huang, K.; Wu, L.; Yang, Y. Gut Microbiota: An Emerging Biological Diagnostic and Treatment Approach for Gastrointestinal Diseases. JGH Open 2021, 5, 973–975. [Google Scholar] [CrossRef]
- Davis, C.D. The Gut Microbiome and Its Role in Obesity. Nutr. Today 2016, 51, 167–174. [Google Scholar] [CrossRef]
- Maruvada, P.; Leone, V.; Kaplan, L.M.; Chang, E.B. The Human Microbiome and Obesity: Moving beyond Associations. Cell Host Microbe 2017, 22, 589–599. [Google Scholar] [CrossRef] [PubMed]
- Radua, J. PRISMA 2020—An Updated Checklist for Systematic Reviews and Meta-Analyses. Neurosci. Biobehav. Rev. 2021, 124, 324–325. [Google Scholar] [CrossRef] [PubMed]
- Wells, G.; Shea, B.; O’Connell, D.; Peterson, J.; Welch, V.; Losos, M.; Tugwell, P. The Newcastle-Ottawa Scale (NOS) for Assessing the Quality of Nonrandomised Studies in Meta-Analyses. Available online: https://www.ohri.ca/programs/clinical_epidemiology/oxford.asp (accessed on 15 June 2022).
- Chen, F.; Li, Q.; Chen, Y.; Wei, Y.; Liang, J.; Song, Y.; Shi, L.; Wang, J.; Mao, L.; Zhang, B.; et al. Association of the Gut Microbiota and Fecal Short-chain Fatty Acids with Skeletal Muscle Mass and Strength in Children. FASEB J. 2022, 36, e22109. [Google Scholar] [CrossRef] [PubMed]
- Cho, K.Y. Lifestyle Modifications Result in Alterations in the Gut Microbiota in Obese Children. BMC Microbiol. 2021, 21, 10. [Google Scholar] [CrossRef] [PubMed]
- Ignacio, A.; Fernandes, M.R.; Rodrigues, V.A.A.; Groppo, F.C.; Cardoso, A.L.; Avila-Campos, M.J.; Nakano, V. Correlation between Body Mass Index and Faecal Microbiota from Children. Clin. Microbiol. Infect. 2016, 22, 258.e1–258.e8. [Google Scholar] [CrossRef] [PubMed]
- Karvonen, A.M.; Sordillo, J.E.; Gold, D.R.; Bacharier, L.B.; O’Connor, G.T.; Zeiger, R.S.; Beigelman, A.; Weiss, S.T.; Litonjua, A.A. Gut Microbiota and Overweight in 3-Year Old Children. Int. J. Obes. 2019, 43, 713–723. [Google Scholar] [CrossRef]
- López-Contreras, B.E.; Morán-Ramos, S.; Villarruel-Vázquez, R.; Macías-Kauffer, L.; Villamil-Ramírez, H.; León-Mimila, P.; Vega-Badillo, J.; Sánchez-Muñoz, F.; Llanos-Moreno, L.E.; Canizalez-Román, A.; et al. Composition of Gut Microbiota in Obese and Normal-Weight Mexican School-Age Children and Its Association with Metabolic Traits. Pediatr. Obes. 2018, 13, 381–388. [Google Scholar] [CrossRef]
- McCann, J.R.; Bihlmeyer, N.A.; Roche, K.; Catherine, C.; Jawahar, J.; Kwee, L.C.; Younge, N.E.; Silverman, J.; Ilkayeva, O.; Sarria, C.; et al. The Pediatric Obesity Microbiome and Metabolism Study (POMMS): Methods, Baseline Data, and Early Insights. Obesity 2021, 29, 569–578. [Google Scholar] [CrossRef]
- Riva, A.; Borgo, F.; Lassandro, C.; Verduci, E.; Morace, G.; Borghi, E.; Berry, D. Pediatric Obesity Is Associated with an Altered Gut Microbiota and Discordant Shifts in F. irmicutes Populations. Environ. Microbiol. 2017, 19, 95–105. [Google Scholar] [CrossRef]
- Ruiz, A.; Cerdó, T.; Jáuregui, R.; Pieper, D.H.; Marcos, A.; Clemente, A.; García, F.; Margolles, A.; Ferrer, M.; Campoy, C.; et al. One-Year Calorie Restriction Impacts Gut Microbial Composition but Not Its Metabolic Performance in Obese Adolescents. Environ. Microbiol. 2017, 19, 1536–1551. [Google Scholar] [CrossRef] [PubMed]
- Smith-Brown, P.; Morrison, M.; Krause, L.; Davies, P.S.W. Male-Specific Association Between Fat-Free Mass Index and Fecal Microbiota in 2- to 3-Year-Old Australian Children. J. Pediatr. Gastroenterol. Nutr. 2018, 66, 147–151. [Google Scholar] [CrossRef]
- Yuan, X.; Chen, R.; Zhang, Y.; Lin, X.; Yang, X. Gut Microbiota: Effect of Pubertal Status. BMC Microbiol. 2020, 20, 334. [Google Scholar] [CrossRef] [PubMed]
- Assmann, T.S.; Cuevas-Sierra, A.; Riezu-Boj, J.I.; Milagro, F.I.; Martínez, J.A. Comprehensive Analysis Reveals Novel Interactions between Circulating MicroRNAs and Gut Microbiota Composition in Human Obesity. Int. J. Mol. Sci. 2020, 21, 9509. [Google Scholar] [CrossRef]
- Clarke, S.F.; Murphy, E.F.; O’Sullivan, O.; Lucey, A.J.; Humphreys, M.; Hogan, A.; Hayes, P.; O’Reilly, M.; Jeffery, I.B.; Wood-Martin, R.; et al. Exercise and Associated Dietary Extremes Impact on Gut Microbial Diversity. Gut 2014, 63, 1913–1920. [Google Scholar] [CrossRef]
- Dekker Nitert, M.; Mousa, A.; Barrett, H.L.; Naderpoor, N.; de Courten, B. Altered Gut Microbiota Composition Is Associated with Back Pain in Overweight and Obese Individuals. Front. Endocrinol. 2020, 11, 605. [Google Scholar] [CrossRef] [PubMed]
- Henning, S.M.; Yang, J.; Woo, S.L.; Lee, R.-P.; Huang, J.; Rasmusen, A.; Carpenter, C.L.; Thames, G.; Gilbuena, I.; Tseng, C.-H.; et al. Hass Avocado Inclusion in a Weight-Loss Diet Supported Weight Loss and Altered Gut Microbiota: A 12-Week Randomized, Parallel-Controlled Trial. Curr. Dev. Nutr. 2019, 3, nzz068. [Google Scholar] [CrossRef] [PubMed]
- Hjorth, M.F.; Blædel, T.; Bendtsen, L.Q.; Lorenzen, J.K.; Holm, J.B.; Kiilerich, P.; Roager, H.M.; Kristiansen, K.; Larsen, L.H.; Astrup, A. Prevotella-to-Bacteroides Ratio Predicts Body Weight and Fat Loss Success on 24-Week Diets Varying in Macronutrient Composition and Dietary Fiber: Results from a Post-Hoc Analysis. Int. J. Obes. 2019, 43, 149–157. [Google Scholar] [CrossRef] [PubMed]
- Kobayashi, T.; Osaki, T.; Oikawa, S. Use of T-RFLP and Seven Restriction Enzymes to Compare the Faecal Microbiota of Obese and Lean Japanese Healthy Men. Benef. Microbes 2015, 6, 735–745. [Google Scholar] [CrossRef] [PubMed]
- Murtaza, N.; Burke, L.; Vlahovich, N.; Charlesson, B.; O’Neill, H.; Ross, M.; Campbell, K.; Krause, L.; Morrison, M. The Effects of Dietary Pattern during Intensified Training on Stool Microbiota of Elite Race Walkers. Nutrients 2019, 11, 261. [Google Scholar] [CrossRef]
- Palmas, V.; Pisanu, S.; Madau, V.; Casula, E.; Deledda, A.; Cusano, R.; Uva, P.; Vascellari, S.; Loviselli, A.; Manzin, A.; et al. Gut Microbiota Markers Associated with Obesity and Overweight in Italian Adults. Sci. Rep. 2021, 11, 5532. [Google Scholar] [CrossRef]
- Resende, A.S.; Leite, G.S.F.; Lancha Junior, A.H. Changes in the Gut Bacteria Composition of Healthy Men with the Same Nutritional Profile Undergoing 10-Week Aerobic Exercise Training: A Randomized Controlled Trial. Nutrients 2021, 13, 2839. [Google Scholar] [CrossRef] [PubMed]
- Sergeev, I.N.; Aljutaily, T.; Walton, G.; Huarte, E. Effects of Synbiotic Supplement on Human Gut Microbiota, Body Composition and Weight Loss in Obesity. Nutrients 2020, 12, 222. [Google Scholar] [CrossRef]
- Valeriani, F.; Gallè, F.; Cattaruzza, M.S.; Antinozzi, M.; Gianfranceschi, G.; Postiglione, N.; Romano Spica, V.; Liguori, G. Are Nutrition and Physical Activity Associated with Gut Microbiota? A Pilot Study on a Sample of Healthy Young Adults. Ann. Ig. 2020, 32, 521–527. [Google Scholar] [CrossRef]
- Whisner, C.M.; Maldonado, J.; Dente, B.; Krajmalnik-Brown, R.; Bruening, M. Diet, Physical Activity and Screen Time but Not Body Mass Index Are Associated with the Gut Microbiome of a Diverse Cohort of College Students Living in University Housing: A Cross-Sectional Study. BMC Microbiol. 2018, 18, 210. [Google Scholar] [CrossRef]
- Yang, Y.; Shi, Y.; Wiklund, P.; Tan, X.; Wu, N.; Zhang, X.; Tikkanen, O.; Zhang, C.; Munukka, E.; Cheng, S. The Association between Cardiorespiratory Fitness and Gut Microbiota Composition in Premenopausal Women. Nutrients 2017, 9, 792. [Google Scholar] [CrossRef] [PubMed]
- Šoltys, K.; Lendvorský, L.; Hric, I.; Baranovičová, E.; Penesová, A.; Mikula, I.; Bohmer, M.; Budiš, J.; Vávrová, S.; Grones, J.; et al. Strenuous Physical Training, Physical Fitness, Body Composition and Bacteroides to Prevotella Ratio in the Gut of Elderly Athletes. Front. Physiol. 2021, 12, 670989. [Google Scholar] [CrossRef] [PubMed]
- Tamura, M.; Hoshi, C.; Kobori, M.; Takahashi, S.; Tomita, J.; Nishimura, M.; Nishihira, J. Quercetin Metabolism by Fecal Microbiota from Healthy Elderly Human Subjects. PLoS ONE 2017, 12, e0188271. [Google Scholar] [CrossRef] [PubMed]
- Tavella, T.; Rampelli, S.; Guidarelli, G.; Bazzocchi, A.; Gasperini, C.; Pujos-Guillot, E.; Comte, B.; Barone, M.; Biagi, E.; Candela, M.; et al. Elevated Gut Microbiome Abundance of Christensenellaceae, Porphyromonadaceae and Rikenellaceae Is Associated with Reduced Visceral Adipose Tissue and Healthier Metabolic Profile in Italian Elderly. Gut Microbes 2021, 13, 1880221. [Google Scholar] [CrossRef] [PubMed]
- Kulecka, M.; Fraczek, B.; Mikula, M.; Zeber-Lubecka, N.; Karczmarski, J.; Paziewska, A.; Ambrozkiewicz, F.; Jagusztyn-Krynicka, K.; Cieszczyk, P.; Ostrowski, J. The Composition and Richness of the Gut Microbiota Differentiate the Top Polish Endurance Athletes from Sedentary Controls. Gut Microbes 2020, 11, 1374–1384. [Google Scholar] [CrossRef]
- La-ongkham, O.; Nakphaichit, M.; Nakayama, J.; Keawsompong, S.; Nitisinprasert, S. Age-Related Changes in the Gut Microbiota and the Core Gut Microbiome of Healthy Thai Humans. 3 Biotech 2020, 10, 276. [Google Scholar] [CrossRef] [PubMed]
- Latorre-Pérez, A.; Hernández, M.; Iglesias, J.R.; Morán, J.; Pascual, J.; Porcar, M.; Vilanova, C.; Collado, L. The Spanish Gut Microbiome Reveals Links between Microorganisms and Mediterranean Diet. Sci. Rep. 2021, 11, 21602. [Google Scholar] [CrossRef] [PubMed]
- Martínez-Cuesta, M.C.; del Campo, R.; Garriga-García, M.; Peláez, C.; Requena, T. Taxonomic Characterization and Short-Chain Fatty Acids Production of the Obese Microbiota. Front. Cell. Infect. Microbiol. 2021, 11, 598093. [Google Scholar] [CrossRef]
- Oki, K.; Toyama, M.; Banno, T.; Chonan, O.; Benno, Y.; Watanabe, K. Comprehensive Analysis of the Fecal Microbiota of Healthy Japanese Adults Reveals a New Bacterial Lineage Associated with a Phenotype Characterized by a High Frequency of Bowel Movements and a Lean Body Type. BMC Microbiol. 2016, 16, 284. [Google Scholar] [CrossRef] [PubMed]
- Schwiertz, A.; Taras, D.; Schäfer, K.; Beijer, S.; Bos, N.A.; Donus, C.; Hardt, P.D. Microbiota and SCFA in Lean and Overweight Healthy Subjects. Obesity 2010, 18, 190–195. [Google Scholar] [CrossRef] [PubMed]
- Aguilar, T.; Nava, G.M.; Olvera-Ramírez, A.M.; Ronquillo, D.; Camacho, M.; Zavala, G.A.; Caamaño, M.C.; Acevedo-Whitehouse, K.; Rosado, J.L.; García, O.P. Gut Bacterial Families Are Associated with Body Composition and Metabolic Risk Markers in School-Aged Children in Rural Mexico. Child. Obes. 2020, 16, 358–366. [Google Scholar] [CrossRef] [PubMed]
- Balamurugan, R.; George, G.; Kabeerdoss, J.; Hepsiba, J.; Chandragunasekaran, A.M.S.; Ramakrishna, B.S. Quantitative Differences in Intestinal Faecalibacterium prausnitzii in Obese Indian Children. Br. J. Nutr. 2010, 103, 335–338. [Google Scholar] [CrossRef]
- Karlsson, C.L.J.; Önnerfält, J.; Xu, J.; Molin, G.; Ahrné, S.; Thorngren-Jerneck, K. The Microbiota of the Gut in Preschool Children With Normal and Excessive Body Weight. Obesity 2012, 20, 2257–2261. [Google Scholar] [CrossRef] [PubMed]
- Miranda, V.P.N.; dos Santos Amorim, P.R.; Bastos, R.R.; de Faria, E.R.; de Castro Moreira, M.E.; do Carmo Castro Franceschini, S.; do Carmo Gouveia Peluzio, M.; de Luces Fortes Ferreira, C.L.; Priore, S.E. Abundance of Gut Microbiota, Concentration of Short-Chain Fatty Acids, and Inflammatory Markers Associated with Elevated Body Fat, Overweight, and Obesity in Female Adolescents. Mediat. Inflamm. 2019, 2019, 7346863. [Google Scholar] [CrossRef]
- Nagata, S.; Chiba, Y.; Wang, C.; Yamashiro, Y. The Effects of the Lactobacillus casei Strain on Obesity in Children: A Pilot Study. Benef. Microbes 2017, 8, 535–543. [Google Scholar] [CrossRef]
- Xu, P.; Li, M.; Zhang, J.; Zhang, T. Correlation of Intestinal Microbiota with Overweight and Obesity in Kazakh School Children. BMC Microbiol. 2012, 12, 283. [Google Scholar] [CrossRef]
- Allen, J.M.; Mailing, L.J.; Niemiro, G.M.; Moore, R.; Cook, M.D.; White, B.A.; Holscher, H.D.; Woods, J.A. Exercise Alters Gut Microbiota Composition and Function in Lean and Obese Humans. Med. Sci. Sport. Exerc. 2018, 50, 747–757. [Google Scholar] [CrossRef] [PubMed]
- Barnes, R.C.; Kim, H.; Fang, C.; Bennett, W.; Nemec, M.; Sirven, M.A.; Suchodolski, J.S.; Deutz, N.; Britton, R.A.; Mertens-Talcott, S.U.; et al. Body Mass Index as a Determinant of Systemic Exposure to Gallotannin Metabolites during 6-Week Consumption of Mango (Mangifera indica L.) and Modulation of Intestinal Microbiota in Lean and Obese Individuals. Mol. Nutr. Food Res. 2019, 63, 1800512. [Google Scholar] [CrossRef] [PubMed]
- Basciani, S.; Camajani, E.; Contini, S.; Persichetti, A.; Risi, R.; Bertoldi, L.; Strigari, L.; Prossomariti, G.; Watanabe, M.; Mariani, S.; et al. Very-Low-Calorie Ketogenic Diets With Whey, Vegetable, or Animal Protein in Patients with Obesity: A Randomized Pilot Study. J. Clin. Endocrinol. Metab. 2020, 105, 2939–2949. [Google Scholar] [CrossRef] [PubMed]
- Bielik, V.; Hric, I.; Baláž, V.; Penesová, A.; Vávrová, S.; Grones, J.; Bokor, B.; Budiš, J.; Bohmer, M.; Minárik, G.; et al. Gut Microbiota Diversity in Lean Athletes Is Associated with Positive Energy Balance. Ann. Nutr. Metab. 2020, 76, 242–250. [Google Scholar] [CrossRef] [PubMed]
- Durk, R.P.; Castillo, E.; Márquez-Magaña, L.; Grosicki, G.J.; Bolter, N.D.; Lee, C.M.; Bagley, J.R. Gut Microbiota Composition Is Related to Cardiorespiratory Fitness in Healthy Young Adults. Int. J. Sport Nutr. Exerc. Metab. 2019, 29, 249–253. [Google Scholar] [CrossRef]
- Teixeira, T.F.S.; Grześkowiak, Ł.M.; Salminen, S.; Laitinen, K.; Bressan, J.; do Carmo Gouveia Peluzio, M. Faecal Levels of Bifidobacterium and Clostridium Coccoides but Not Plasma Lipopolysaccharide Are Inversely Related to Insulin and HOMA Index in Women. Clin. Nutr. 2013, 32, 1017–1022. [Google Scholar] [CrossRef] [PubMed]
- Fernandes, J.; Su, W.; Rahat-Rozenbloom, S.; Wolever, T.M.S.; Comelli, E.M. Adiposity, Gut Microbiota and Faecal Short Chain Fatty Acids Are Linked in Adult Humans. Nutr. Diabetes 2014, 4, e121. [Google Scholar] [CrossRef]
- Most, J.; Penders, J.; Lucchesi, M.; Goossens, G.H.; Blaak, E.E. Gut Microbiota Composition in Relation to the Metabolic Response to 12-Week Combined Polyphenol Supplementation in Overweight Men and Women. Eur. J. Clin. Nutr. 2017, 71, 1040–1045. [Google Scholar] [CrossRef]
- Goffredo, M.; Mass, K.; Parks, E.J.; Wagner, D.A.; McClure, E.A.; Graf, J.; Savoye, M.; Pierpont, B.; Cline, G.; Santoro, N. Role of Gut Microbiota and Short Chain Fatty Acids in Modulating Energy Harvest and Fat Partitioning in Youth. J. Clin. Endocrinol. Metab. 2016, 101, 4367–4376. [Google Scholar] [CrossRef]
- Bezek, K.; Petelin, A.; Pražnikar, J.; Nova, E.; Redondo, N.; Marcos, A.; Jenko Pražnikar, Z. Obesity Measures and Dietary Parameters as Predictors of Gut Microbiota Phyla in Healthy Individuals. Nutrients 2020, 12, 2695. [Google Scholar] [CrossRef]
- Borgo, F.; Garbossa, S.; Riva, A.; Severgnini, M.; Luigiano, C.; Benetti, A.; Pontiroli, A.E.; Morace, G.; Borghi, E. Body Mass Index and Sex Affect Diverse Microbial Niches within the Gut. Front. Microbiol. 2018, 9, 213. [Google Scholar] [CrossRef]
- Brignardello, J.; Morales, P.; Diaz, E.; Romero, J.; Brunser, O.; Gotteland, M. Pilot Study: Alterations of Intestinal Microbiota in Obese Humans Are Not Associated with Colonic Inflammation or Disturbances of Barrier Function. Aliment. Pharmacol. Ther. 2010, 32, 1307–1314. [Google Scholar] [CrossRef]
- Janssens, P.L.H.R.; Penders, J.; Hursel, R.; Budding, A.E.; Savelkoul, P.H.M.; Westerterp-Plantenga, M.S. Long-Term Green Tea Supplementation Does Not Change the Human Gut Microbiota. PLoS ONE 2016, 11, e0153134. [Google Scholar] [CrossRef] [PubMed]
- Morita, E.; Yokoyama, H.; Imai, D.; Takeda, R.; Ota, A.; Kawai, E.; Hisada, T.; Emoto, M.; Suzuki, Y.; Okazaki, K. Aerobic Exercise Training with Brisk Walking Increases Intestinal Bacteroides in Healthy Elderly Women. Nutrients 2019, 11, 868. [Google Scholar] [CrossRef] [PubMed]
- Leong, C.; Haszard, J.J.; Heath, A.-L.M.; Tannock, G.W.; Lawley, B.; Cameron, S.L.; Szymlek-Gay, E.A.; Gray, A.R.; Taylor, B.J.; Galland, B.C.; et al. Using Compositional Principal Component Analysis to Describe Children’s Gut Microbiota in Relation to Diet and Body Composition. Am. J. Clin. Nutr. 2020, 111, 70–78. [Google Scholar] [CrossRef] [PubMed]
- Joller, P.; Cabaset, S.; Maurer, S. Influence of a Food Supplement on the Gut Microbiome in Healthy Overweight Women. Funct. Foods Health Dis. 2020, 10, 428. [Google Scholar] [CrossRef]
- Koliada, A.; Moseiko, V.; Romanenko, M.; Lushchak, O.; Kryzhanovska, N.; Guryanov, V.; Vaiserman, A. Sex Differences in the Phylum-level Human Gut Microbiota Composition. BMC Microbiol. 2021, 21, 131. [Google Scholar] [CrossRef] [PubMed]
- Bloemendaal, M.; Szopinska-Tokov, J.; Belzer, C.; Boverhoff, D.; Papalini, S.; Michels, F.; van Hemert, S.; Arias Vasquez, A.; Aarts, E. Probiotics-Induced Changes in Gut Microbial Composition and Its Effects on Cognitive Performance after Stress: Exploratory Analyses. Transl. Psychiatry 2021, 11, 300. [Google Scholar] [CrossRef] [PubMed]
- Gallè, F.; Valeriani, F.; Cattaruzza, M.S.; Gianfranceschi, G.; Liguori, R.; Antinozzi, M.; Mederer, B.; Liguori, G.; Romano Spica, V. Mediterranean Diet, Physical Activity and Gut Microbiome Composition: A Cross-Sectional Study among Healthy Young Italian Adults. Nutrients 2020, 12, 2164. [Google Scholar] [CrossRef]
- Kasai, C.; Sugimoto, K.; Moritani, I.; Tanaka, J.; Oya, Y.; Inoue, H.; Tameda, M.; Shiraki, K.; Ito, M.; Takei, Y.; et al. Comparison of the Gut Microbiota Composition between Obese and Non-Obese Individuals in a Japanese Population, as Analyzed by Terminal Restriction Fragment Length Polymorphism and next-Generation Sequencing. BMC Gastroenterol. 2015, 15, 100. [Google Scholar] [CrossRef]
- Zuo, H.-J. Gut Bacteria Alteration in Obese People and Its Relationship with Gene Polymorphism. World J. Gastroenterol. 2011, 17, 1076. [Google Scholar] [CrossRef]
- Bäckhed, F.; Ding, H.; Wang, T.; Hooper, L.V.; Koh, G.Y.; Nagy, A.; Semenkovich, C.F.; Gordon, J.I. The Gut Microbiota as an Environmental Factor That Regulates Fat Storage. Proc. Natl. Acad. Sci. USA 2004, 101, 15718–15723. [Google Scholar] [CrossRef]
- Allegretti, J.R.; Kassam, Z.; Mullish, B.H.; Chiang, A.; Carrellas, M.; Hurtado, J.; Marchesi, J.R.; McDonald, J.A.K.; Pechlivanis, A.; Barker, G.F.; et al. Effects of Fecal Microbiota Transplantation with Oral Capsules in Obese Patients. Clin. Gastroenterol. Hepatol. 2020, 18, 855–863.e2. [Google Scholar] [CrossRef]
- Nagpal, R.; Newman, T.M.; Wang, S.; Jain, S.; Lovato, J.F.; Yadav, H. Obesity-Linked Gut Microbiome Dysbiosis Associated with Derangements in Gut Permeability and Intestinal Cellular Homeostasis Independent of Diet. J. Diabetes Res. 2018, 2018, 3462092. [Google Scholar] [CrossRef]
- Walters, W.A.; Xu, Z.; Knight, R. Meta-Analyses of Human Gut Microbes Associated with Obesity and IBD. FEBS Lett. 2014, 588, 4223–4233. [Google Scholar] [CrossRef] [PubMed]
- Chanda, D.; Debojyoti, D. Meta-Analysis Reveals Obesity Associated Gut Microbial Alteration Patterns and Reproducible Contributors of Functional Shift. bioRxiv 2022. [Google Scholar] [CrossRef]
- Sze, M.A.; Schloss, P.D. Looking for a Signal in the Noise: Revisiting Obesity and the Microbiome. mBio 2016, 7, e01018-16. [Google Scholar] [CrossRef]
- Lozupone, C.A.; Stombaugh, J.I.; Gordon, J.I.; Jansson, J.K.; Knight, R. Diversity, Stability and Resilience of the Human Gut Microbiota. Nature 2012, 489, 220–230. [Google Scholar] [CrossRef]
- Ortiz-Alvarez, L.; Xu, H.; Martinez-Tellez, B. Influence of Exercise on the Human Gut Microbiota of Healthy Adults: A Systematic Review. Clin. Transl. Gastroenterol. 2020, 11, e00126. [Google Scholar] [CrossRef]
- Zheng, C.; Chen, X.; Tian, X.Y.; Ma, A.C.; Wong, S.H. Does the Gut Microbiota Contribute to the Antiobesity Effect of Exercise? A Systematic Review and Meta-analysis. Obesity 2022, 30, 407–423. [Google Scholar] [CrossRef] [PubMed]
- Castaner, O.; Goday, A.; Park, Y.-M.; Lee, S.-H.; Magkos, F.; Shiow, S.-A.T.E.; Schröder, H. The Gut Microbiome Profile in Obesity: A Systematic Review. Int. J. Endocrinol. 2018, 2018, 4095789. [Google Scholar] [CrossRef] [PubMed]
- Magne, F.; Gotteland, M.; Gauthier, L.; Zazueta, A.; Pesoa, S.; Navarrete, P.; Balamurugan, R. The Firmicutes/Bacteroidetes Ratio: A Relevant Marker of Gut Dysbiosis in Obese Patients? Nutrients 2020, 12, 1474. [Google Scholar] [CrossRef]
- Rinninella, E.; Raoul, P.; Cintoni, M.; Franceschi, F.; Miggiano, G.; Gasbarrini, A.; Mele, M. What Is the Healthy Gut Microbiota Composition? A Changing Ecosystem across Age, Environment, Diet, and Diseases. Microorganisms 2019, 7, 14. [Google Scholar] [CrossRef]
- Ley, R.E.; Bäckhed, F.; Turnbaugh, P.; Lozupone, C.A.; Knight, R.D.; Gordon, J.I. Obesity Alters Gut Microbial Ecology. Proc. Natl. Acad. Sci. USA 2005, 102, 11070–11075. [Google Scholar] [CrossRef]
- Canfora, E.E.; Jocken, J.W.; Blaak, E.E. Short-Chain Fatty Acids in Control of Body Weight and Insulin Sensitivity. Nat. Rev. Endocrinol. 2015, 11, 577–591. [Google Scholar] [CrossRef]
- Ibrahim, M.; Anishetty, S. A Meta-Metabolome Network of Carbohydrate Metabolism: Interactions between Gut Microbiota and Host. Biochem. Biophys. Res. Commun. 2012, 428, 278–284. [Google Scholar] [CrossRef]
- Org, E.; Blum, Y.; Kasela, S.; Mehrabian, M.; Kuusisto, J.; Kangas, A.J.; Soininen, P.; Wang, Z.; Ala-Korpela, M.; Hazen, S.L.; et al. Relationships between Gut Microbiota, Plasma Metabolites, and Metabolic Syndrome Traits in the METSIM Cohort. Genome Biol. 2017, 18, 70. [Google Scholar] [CrossRef] [PubMed]
- Rahat-Rozenbloom, S.; Fernandes, J.; Gloor, G.B.; Wolever, T.M.S. Evidence for Greater Production of Colonic Short-Chain Fatty Acids in Overweight than Lean Humans. Int. J. Obes. 2014, 38, 1525–1531. [Google Scholar] [CrossRef] [PubMed]
- Duvallet, C.; Gibbons, S.M.; Gurry, T.; Irizarry, R.A.; Alm, E.J. Meta-Analysis of Gut Microbiome Studies Identifies Disease-Specific and Shared Responses. Nat. Commun. 2017, 8, 1784. [Google Scholar] [CrossRef] [PubMed]
- Pinart, M.; Dötsch, A.; Schlicht, K.; Laudes, M.; Bouwman, J.; Forslund, S.K.; Pischon, T.; Nimptsch, K. Gut Microbiome Composition in Obese and Non-Obese Persons: A Systematic Review and Meta-Analysis. Nutrients 2021, 14, 12. [Google Scholar] [CrossRef]
- Drissi, F.; Merhej, V.; Angelakis, E.; El Kaoutari, A.; Carrière, F.; Henrissat, B.; Raoult, D. Comparative Genomics Analysis of Lactobacillus Species Associated with Weight Gain or Weight Protection. Nutr. Diabetes 2014, 4, e109. [Google Scholar] [CrossRef] [PubMed]
- Lopez-Siles, M.; Duncan, S.H.; Garcia-Gil, L.J.; Martinez-Medina, M. Faecalibacterium Prausnitzii: From Microbiology to Diagnostics and Prognostics. ISME J. 2017, 11, 841–852. [Google Scholar] [CrossRef] [PubMed]
- Derrien, M.; Belzer, C.; de Vos, W.M. Akkermansia Muciniphila and Its Role in Regulating Host Functions. Microb. Pathog. 2017, 106, 171–181. [Google Scholar] [CrossRef] [PubMed]


| Parameter | Inclusion Criteria | Exclusion Criteria |
|---|---|---|
| Population | Healthy population, including children, adults, older adults, postmenopausal women | Non-healthy population, except obese Studies that involved twins, infants, pregnancy, breastfeeding |
| Intervention | Studies that presented the gut microbiome in the large intestine Studies that performed an intervention by providing probiotic, prebiotic, and symbiotic supplements Studies that performed an intervention by modifying diet or physical activity or both | Studies that presented the gut microbiome in other areas, such as the mouth Studies that performed an intervention by providing medication |
| Comparison | - | - |
| Outcome | Studies describing the results and differences in the gut microbiome composition in terms of body composition, such as BMI, fat mass, fat free mass, muscle mass | Studies that did not describe the results of the gut microbiome composition in terms of body composition |
| Type of publication | Primary research Studies written in the English language | Non-primary research, such as reviews and case studies Studies not written in English |
| Author(s), Date | N | Sex | Age (Year) | BMI Category (kg/m2) | Body Composition | Results |
|---|---|---|---|---|---|---|
| Aguilar et al., 2020 [55] | 93 | M and F | 8.4 ± 1.6 | According to WHO criteria of BMI-for-age for children 5–19 years old. Normal-weight: −0.4 ± 0.7 Overweight: 1.5 ± 0.3 Obesity: 2.3 ± 0.3 | Normal-weight (waist circumference cm = 55.9 ± 4.8, waist to height index = 0.4 ± 0, abdominal fat % = 21 ± 5, total body fat % = 25.7 ± 4.8) Overweight (waist circumference cm = 68.9 ± 8.1, waist to height index = 0.5 ± 0, abdominal fat % = 32.8 ± 6, total body fat % = 34.8 ± 4.8) Obesity (waist circumference cm = 74.3 ± 7, waist to height index = 0.6 ± 0, abdominal fat % = 38.3 ± 5.2, total body fat % = 39 ± 3.7) | Children with obesity and waist-to-height ratio < 0.5: ↓ Bacteroidaceae, Porphyromonadaceae, Prevotellaceae and ↑ Lactobacillaceae. Children with abdominal fat above median (>24%): ↑ Lactobacillaceae |
| Balamurugan et al., 2010 [56] | 28 | M and F | 11–14 | According to WHO reference growth charts. Non-obese: 1–85 percentile Obese: 97–99 percentile | NR | Obese: ↑ Faecalibacterium prausnitzii (p = 0.0253). No significant differences in Bacteroides–Prevotella–Porphyromonas, Bifidobacterium, and Eubacterium rectale. |
| Chen et al., 2022 [23] | 412 | M and F | 6–9 | LMM: 16.77 (3.14) MMM: 14.74 (1.91) HMM: 14.23 (1.69) | 3 groups: low muscle mass (LMM), medium muscle mass (MMM), high muscle mass (HMM) LMM [TBF kg = 9.42 (5.00), TSM kg = 17.92 (5.11), TSMI kg/m2 = 10.59 (1.77), TSMR % = 63.23 (5.18), TSM/TFM % = 1.90 (0.48), ASM kg = 7.36 (2.51), ASMI kg/m2 = 4.29 (0.90), ASMR % = 25.65 (2.15), ASM/AFM % = 1.47 (0.38), ASMI Z-score = −0.49 (1.34), ASMR Z-score = −0.59 (0.70)] MMM [TBF kg = 5.87 (1.99), TSM kg = 16.70 (3.54), TSMI kg/m2 = 10.52 (1.25), TSMR % = 71.26 (3.69), TSM/TFM % = 2.85 (0.65), ASM kg = 6.78 (1.74), ASMI kg/m2 = 4.25 (0.63), ASMR % = 28.97 (1.91), ASM/AFM % = 2.31 (0.67), ASMI Z-score = −0.56 (1.17), ASMR Z-score = 0.51 (0.50)] HMM [TBF kg = 4.95 (1.63), TSM kg = 17.36 (3.36), TSMI kg/m2 = 10.80 (1.13), TSMR % = 74.91 (3.30), TSM/TFM % = 3.54 (0.72), ASM kg = 7.39 (1.88), ASMI kg/m2 = 4.57 (0.52), ASMR % = 31.96 (2.02), ASM/AFM % = 3.08 (0.80), ASMI Z-score = 0.02 (1.15), ASMR Z-score = 1.36 (0.49)] | α-diversity: statistically significant differences between 3 groups → Chao1 index: LMM-HMM (p = 0.0022), MMM-HMM (p = 0.0072), ACE: LMM-HMM (p = 0.0077), MMM-HMM (p = 0.011). β-diversity: significant difference between groups (p < 0.001). ↑ Genus: Faecalibacterium, Lacnospira, Lachnospiraceae → positively correlated ≥1 from TSMR, ASM, ASMI, ASMI Z-score, negatively correlated ≥1 from TSMR, TSM/TBF, ASMR, ASM/AFM, ASMR Z-score. No significant correlation in F/B ratio. Adjustment for TBF and BMI → Genus: statistically significant correlations only in Faecalitalea and Pyramidobacter. |
| Cho., 2021 [24] | 60 | M and F | Fat loss: 10.0 ± 2.4 Fat gain: 10.3 ± 2.7 | Fat loss pre: 26.41 ± 4.04 Fat gain pre: 25.70 (23.75–27.30) | Fat loss pre (waist circumference = 88.90 [75.00–93.20] cm, waist-to-height ratio = 0.58 [0.54–0.61] cm, total body fat = 38.30 [35.60–43.0]%, skeletal muscle mass = 17.70 [13.90–21.80] kg, total body fat = 22.80 ± 7.89 kg, visceral fat = 112.10 [74.30–144.20] cm2, abdomen fat = 0.85 ± 0.08%) Fat gain pre (waist circumference = 88.81 ± 13.26 cm, waist-to-height ratio = 0.59 [0.55–0.62] cm, total body fat = 38.79 ± 5.16%, skeletal muscle mass = 17.80 [15.70–22.70] kg, total body fat = 21.60 [18.80–26.80] kg, visceral fat = 118.76 ± 49.54 cm2, abdomen fat = 0.86 ± 0.10%) | Baseline analysis. Phylum: Dominant bacteria in both groups → Firmicutes, Bacteroidetes, Proteobacteria, Actinobacteria, Verrucomicrobia. Fat gain group → ↓ Bacteroidetes compared with control group. Genus: Both groups → ↑ Blautia, Dorea, Eubacterium hallii, Fusicatenibacter compared with control group. Fat gain group → ↓ Bacteroides, Oscillibacter, Parabacteroides. Shanon diversity index: no significant difference between both preintervention groups and control group. |
| Goffredo et al., 2016 [69] | 84 | M and F | 12.4 ± 2.9 | Non-obese: BMI < 85th Overweight: 85th < BMI < 95th Obese: 95th < BMI < 99th Severely obese: BMI > 99th | Lean (body fat % = 20.62 ± 5.69, visceral body fat cm2 = 20.17 ± 11.18, SC cm2 = 153.79 ± 87.07, hepatic fat content % = 1.26 ± 1.81) Overweight (body fat % = 31.07 ± 5.59, visceral body fat cm2 = 36.60 ± 18.12, SC cm2 = 313.90 ± 12.87, hepatic fat content % = 0.466 ± 1.09) Obese (body fat % = 41.31 ± 7.16, visceral body fat cm2 = 57.44 ± 23.79, SC cm2 = 434.86 ± 164.21, hepatic fat content % = 9.16 ± 11.36) Severely obese (body fat % = 48.48 ± 9.11, visceral body fat cm2 = 79.31 ± 30.74, SC cm2 = 648.19 ± 214.20, hepatic fat content % = 13.00 ± 14.33) | Phylum: Total bacterial load → no association with body composition. F/B (p = 0.016), Actinobacteria (p = 0.01) → positively associated with BMI. Bacteroidetes (p = 0.0003) → inversely associated with BMI. F/B (p = 0.075; p = 0.032; p = 0.002), Bacteroidetes (p = 0.031; p = 0.012; p = 0.003), Actinobacteria (p = 0.039; p = 0.053; p = 0.078) → associated with visceral fat, SC fat and hepatic fat content. Genera: Actinomyces, Bifidobacterium, Streptococcus, Blautia → positively correlated with obesity and body fat deposits. Odoribacter, Oscillospira, Bacteroides, Faecalibacterium → inversely correlated with adiposity. |
| Ignacio et al., 2016 [25] | 84 | M and F | Lean: 6.1 ± 2.4 Overweight: 8.0 ± 2.0 Obese: 8.5 ± 2.6 | Lean: BMI z-score 0.19 ± 0.72, Overweight: BMI z-score 1.68 ± 0.33, Obese: BMI z-score 3.5 ± 1.6 | NR | Obese + overweight compared with lean: ↑ Bacteroides fragilis group (p = 0.015), Lactobacillus spp. (p = 0.022), ↓ Bifidobacterium spp. (p = 0.042), no significant difference in Clostridium Cluster I, Methanobrevibacter smithii, E. coli. BMI: positive correlation with B. fragilis group (r = 0.24; p = 0.026) and Lactobacillus spp. (r = 0.44; p = 0.002), negative correlation with Bifidobacterium spp. (r = −0.22; p = 0.039). |
| Karlsson et al., 2012 [57] | 40 | M and F | OO group: 4.67 (4.17–5.17) C group: 4.70 (4.33–4.98) | OO group: 20.55 (18.78–21.90) C group: 15.54 (14.98–16.07) | NR | OO group: ↑ Enterobacteriaceae (p = 0.036), ↓ Desulfovibrio (p = 0.027), Akkermansia muciniphila (p = 0.030). No statistical differences in Lactobacillus (p = 0.947), Bifidobacterium (p = 0.821), Bacteroides fragilis group (p = 0.104). Diversity → less diverse (not statistically significant; p = 0.091) |
| Karvonen et al., 2019 [26] | 502 | M and F | 3 | Overweight/obese: >85th percentile Non-overweight/non-obese: <85th percentile | NR | Phylum: Most abundant → Firmicutes (62.4%) and Bacteroidetes (24.2%) → No statistical differences between 2 groups. F/B ratio → no statistical differences. Genus: Overweight/Obese → ↑ Dorea, ↓ Ruminococcus, Akkermansia, Parabacteroidetes. Diversity: No associations between the groups. |
| Leong et al., 2020 [75] | 319 | M and F | 5 | Normal: BMI z-score < 1.036 Overweight/obese: BMI z-score ≥ 1.036 | NR | PCs—genera: PC1 → negative loadings of Christensellaceae, Ruminococcaceae. PC2 → negative loadings of Bacteroides—positive loadings of Bifidobacterium, Fusitanetibacter. PC3 → positive loadings of Faecalibacterium, Eubacterium, Roseburia. Only PC1 and PC2 statistically correlated with BMI z-score → PC1 with ↓ BMI z-score and PC2 with ↑ BMI z-score. No statistical correlations observed between PC3 and F/B ratio and BMI z-score. |
| López-Contreras et al., 2018 [27] | 138 | M and F | 6–12 | NW: BMI percentile % = 39.27 ± 13.51 Obese: BMI percentile % = 96.92 ± 1.33 | NW: Body fat % = 24.53 ± 6.60 Obese: Body fat % = 44.6 ± 5.41 | Most abundant phylum in 2 groups (NW—Obese): Bacteroidetes (67.5%, 69.4%), Firmicutes (27.8%, 26%), Proteobacteria (3.4%, 3.5%). NW—Obese: no significant differences from phyla to genus, F/B ratio, richness, alpha diversity. Species: Obese → ↑ Bacteroides eggerthii (q = 0.004), ↓ Bacteroides plebeius (q = 0.046), unclassified species from Christensenellaceae family (q = 0.061). |
| McCann et al., 2021 [28] | 54 | M and F | Healthy weight controls (HWC): 15.0 ± 1.7 Obese (OB): 12.6 ± 2.4 | HWC: BMI percentile % = 75.6 ± 2.9 OB: BMI percentile % = 137.8 ± 48.7 | NR | α- and β-diversity → significantly different between 2 groups. Obese: ↓ Christensellaceae (family), Ruminococcaceae (family), Alistipes (species) Bacteroides family members, ↑ Lachnospiraceae (family), Lachnospira (species), Prevotellaceae members. |
| Miranda et al., 2019 [58] | 96 | F | 14–19 | G1: EUT + adequate BF% G2: EUT + high BF% G3: OW or OB + high BF% | G1 (WC: 61.0–67.2, WtHR: 0.38–0.41, NC: 28.0–30.0, Android fat %: 9.8–16.5, Gynoid fat %: 30.6–36.7) G2 (WC: 68.1–75.3, WtHR: 0.42–0.46, NC: 29.2–31.0, Android fat %: 17.9–30.5, Gynoid fat %: 37.9–46.9) G3 (WC: 78.7–88.2, WtHR: 0.48–0.53, NC: 31.0–34.0, Android fat %: 30.5–46.8, Gynoid fat %: 45.5–54.1) | Phylum: No significant differences in Firmicutes, Bacteroidetes, Proteobacteria between 3 groups Firmicutes → positively associated with WC and NC, but not with BMI and BF%. |
| Nagata et al., 2017 [59] | 34 | M and F | Obese: 10.8 ± 4.4 Control: 8.5 ± 2.9 | Control: BMI Z-score = 0.1 ± 0.7 Obese: BMI Z-score = 2.7 ± 1.7 (>2.0) | NR | Baseline analysis. Obese (compared with controls): ↓ Total bacteria (8.9 ± 1.3–10.6 ± 0.2 Log10 cells/g; p < 0.05), Bacteroides fragilis group (8.5 ± 1.1–9.8 ± 0.4 Log10 cells/g; p < 0.05), Bifidobacterium (7.9 ± 1.5–9.8 ± 0.5 Log10 cells/g; p < 0.001), Atopobium cluster (7.7 ± 0.8–9.0 ± 0.7 Log10 cells/g; p < 0.05), Lactobacillus gasseri subgroup (4.4 ± 1.8–5.0 ± 1.4 Log10 cells/g; p < 0.05). |
| Riva et al., 2017 [29] | 78 | M and F | Normal-weight (N): 11 ± 0.33 Obese (O): 11 ± 1.99 | According to WHO criteria. N: BMI z-score = 0.3 ± 0.82, O: BMI z-score = 3.0 ± 0.7 | NR | Phylum: Predominant bacteria in both groups → Bacteroides, Firmicutes, Actinobacteria, Verrucomicrobiota, Proteobacteria. Family: Most abundant in both groups → Ruminococcaceae, Lachnospiraceae, Bacteroidaceae, Veillonellaceae, Bifidobacteriaceae, Prevotellaceae, Verrucomicrobiaceae, Rikenellaceae, Christensellaceae. Genus: Most abundant in both groups → Bacteroides, Subdoligranulum, Faecalibacterium, Dialister, Bifidobacterium, Pseudobutyrivibrio, Blautia. Obese children: Phylum → ↑ Firmicutes (N: 60.9 ± 14.1, O: 72.1 ± 12.1), F/B ratio (N: 2.6 ± 1.83, O: 7.7 ± 7.1; p < 0.001), ↓ Bacteroidetes (N: 30 ± 12.6, O: 16.6 ± 11.8). Family → ↑ Ruminococcaceae (N: 33.3 ± 11.5, O: 42.5 ± 12.7), ↓ Bacteroidaceae (N: 21.4 ± 12.2, O: 10 ± 7.1). Genus → ↓ Bacteroides (N: 21.4 ± 12.2, O: 10.5 ± 7.1). No significant differences → members of Ruminococcaceae, gut microbiota richness (p = 0.59), α-diversity (p = 0.34). BMI z-score → positively correlated with Firmicutes, Ruminococcaceae, and Faecalibacterium prausnitzii and negatively correlated with Bacteroidetes, Bacteroidaceae, and Bacteroides. |
| Ruiz et al., 2017 [30] | 21 | M and F | 14.8 (13–16) | Lean: 21.8 (17.94–23.56) Obese: 32.2 (25.35–38.34) | NR | Baseline. Dominant bacteria in both groups → Firmicutes, Bacteroidetes, Proteobacteria, Actinobacteria, Verrucomicrobia. Obese → ↑ Firmicutes, F/B ratio, Actinobacteria, ↓ Bacteroidetes |
| Smith-Brown et al., 2018 [31] | 36 | M and F | 2.65 (2.24–3.13) | BMI Z-score = 0.54 ± 0.78 | FMI Z-score = 0.86 ± 1.46, FFMI Z-score = −0.54 ± 1.03, WHR Z-score = 0.49 ± 0.92 | Microbiota composition significantly associated with FFMI Z-score in boys (p = 0.027), but not girls (p = 0.553) → FFMI Z-score in boys: significantly correlated with Ruminococcaceae (family). FFMI Z-score of well-nourished boys: positively associated with Dorea formicigenerans, Faecalibacterium prausnitzii, negatively associated with Bacteroides cellulosilyticus. |
| Xu et al., 2012 [60] | 175 | M and F | 9.87 ± 1.97 | Normal group: 16.53 ± 1.69 Overweight group: 20.14 ± 1.83 Obesity group: 24.94 ± 3.11 | Normal group (waist cm = 58.27 ± 4.9, hip cm = 70.26 ± 6.65) Overweight group (waist cm = 65.08 ± 6.75, hip cm = 76.04 ± 8.7) Obesity group (waist cm = 76.72 ± 9.22, hip cm = 87.52 ± 12.41) | Phylum: Obesity group → ↓ Bacteroidetes compared with normal group (p = 0.002), F/B ratio compared to both normal and overweight group (p < 0.001)—no statistically significant difference in Firmicutes → negative correlation between BMI and Bacteroidetes (r = −0.18; p = 0.017), negative correlation between BMI and F/B ratio (r = −0.22; p = 0.003). Gender differences: Normal-weight girls → ↑ Bacteroidetes compared with normal-weight boys (p < 0.05) and compared with obese girls (p = 0.002)—no statistically significant differences between normal-weight and obese boys. |
| Yuan et al., 2020 [32] | 89 | M and F | Non-puberty: 8.36 ± 1.64 Puberty: 10.99 ± 1.15 | Non-puberty: BMI z-score = 1.92 ± 1.79 Puberty: BMI z-score = 2.01 ± 1.13 | NR | Core microbiota: Dominated by Firmicutes, Bacteroidetes, Proteobacteria in both groups. Non-puberty group: ↑ Clostridiales (order), Pasteurellales (order), Clostridiaceae (family), Coprobacillus (genus), Haemophilus (genus). Puberty group: ↑ Betaproteobacteria (class), Burkholderiales (order). Correlations with BMI z-score: positive correlations with Pasteurellales (order) (r = 0.223; p = 0.036), Haemophilus (genus) (r = 0.222; p = 0.036)—no other statistically significant correlations. |
Disclaimer/Publisher’s Note: The statements, opinions and data contained in all publications are solely those of the individual author(s) and contributor(s) and not of MDPI and/or the editor(s). MDPI and/or the editor(s) disclaim responsibility for any injury to people or property resulting from any ideas, methods, instructions or products referred to in the content. |
© 2024 by the authors. Licensee MDPI, Basel, Switzerland. This article is an open access article distributed under the terms and conditions of the Creative Commons Attribution (CC BY) license (https://creativecommons.org/licenses/by/4.0/).
Share and Cite
Komodromou, I.; Andreou, E.; Vlahoyiannis, A.; Christofidou, M.; Felekkis, K.; Pieri, M.; Giannaki, C.D. Exploring the Dynamic Relationship between the Gut Microbiome and Body Composition across the Human Lifespan: A Systematic Review. Nutrients 2024, 16, 660. https://doi.org/10.3390/nu16050660
Komodromou I, Andreou E, Vlahoyiannis A, Christofidou M, Felekkis K, Pieri M, Giannaki CD. Exploring the Dynamic Relationship between the Gut Microbiome and Body Composition across the Human Lifespan: A Systematic Review. Nutrients. 2024; 16(5):660. https://doi.org/10.3390/nu16050660
Chicago/Turabian StyleKomodromou, Ifigeneia, Eleni Andreou, Angelos Vlahoyiannis, Maria Christofidou, Kyriacos Felekkis, Myrtani Pieri, and Christoforos D. Giannaki. 2024. "Exploring the Dynamic Relationship between the Gut Microbiome and Body Composition across the Human Lifespan: A Systematic Review" Nutrients 16, no. 5: 660. https://doi.org/10.3390/nu16050660
APA StyleKomodromou, I., Andreou, E., Vlahoyiannis, A., Christofidou, M., Felekkis, K., Pieri, M., & Giannaki, C. D. (2024). Exploring the Dynamic Relationship between the Gut Microbiome and Body Composition across the Human Lifespan: A Systematic Review. Nutrients, 16(5), 660. https://doi.org/10.3390/nu16050660