
Associations between Cardiometabolic Risk Factors and Increased Consumption of Diverse Legumes: A South African Food and Nutrition Security Programme Case Study


Abstract

1. Introduction
2. Materials and Methods
2.1. Ethical Approval
2.2. Study Design
2.3. Sampling
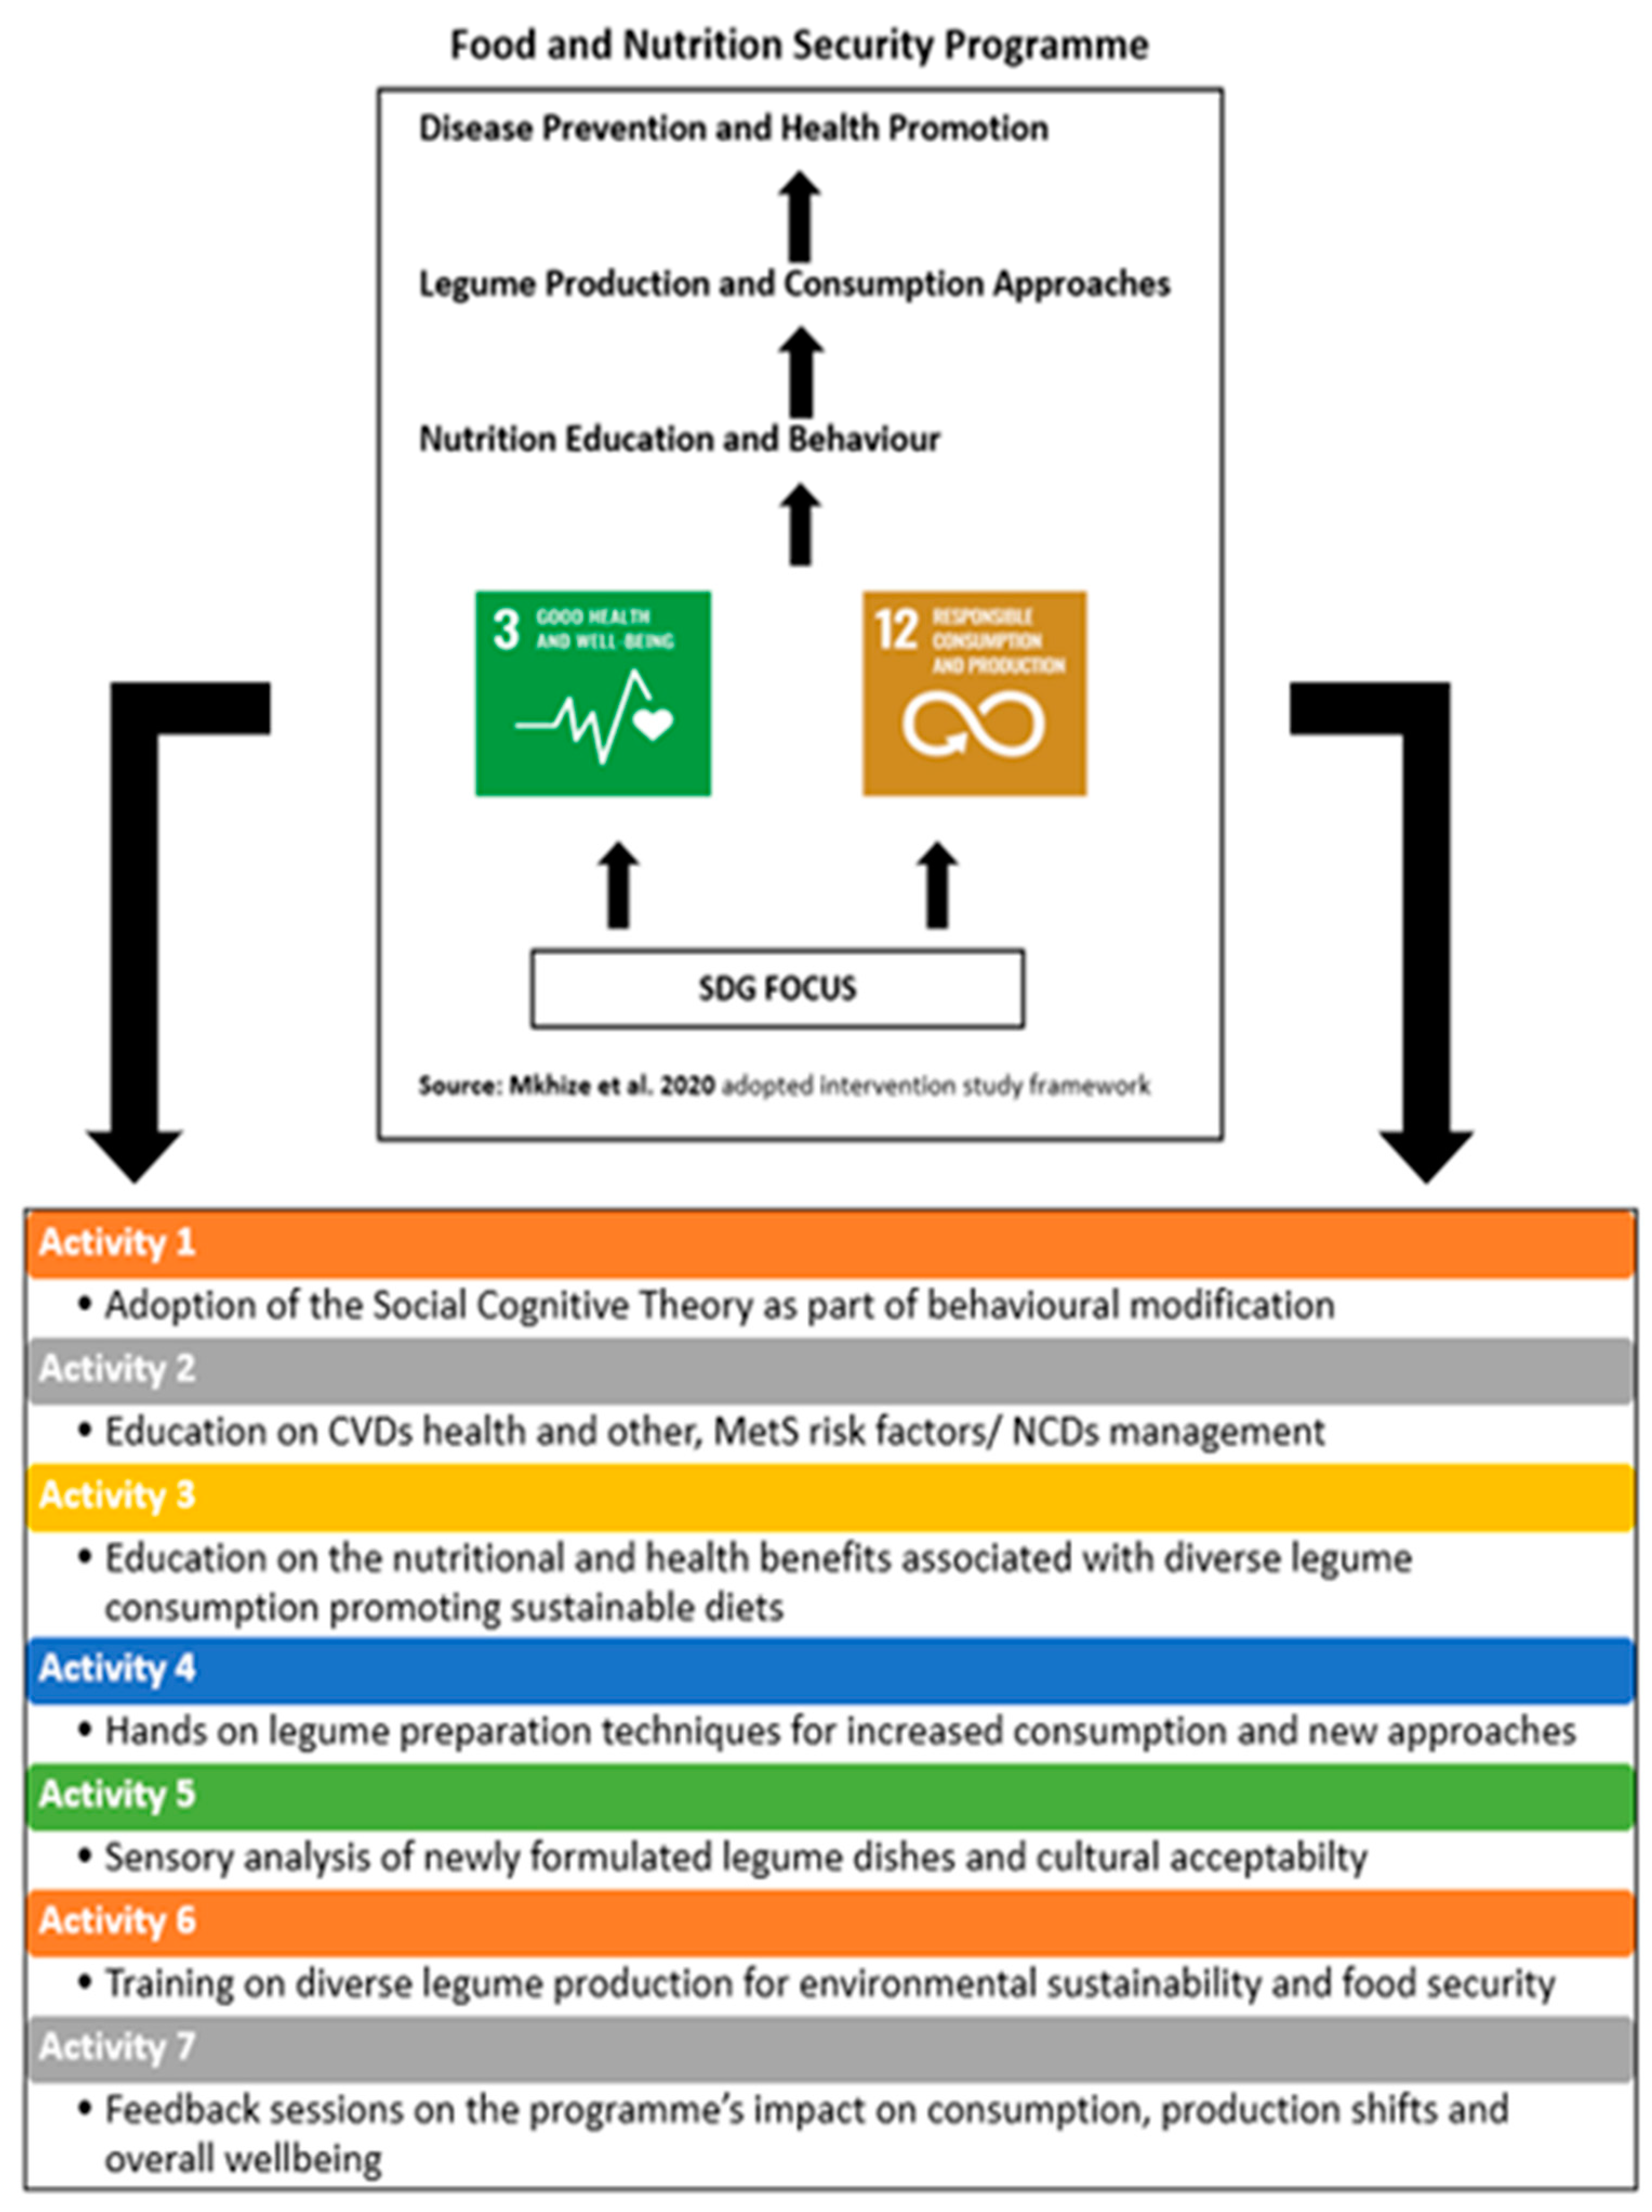
2.4. Intervention
2.5. Data Collection
2.6. Statistical Analysis
3. Results
4. Discussion
5. Conclusions
Author Contributions
Funding
Institutional Review Board Statement
Informed Consent Statement
Data Availability Statement
Acknowledgments
Conflicts of Interest
Abbreviations
| EAR | estimated adequacy ratio |
| BMI | body mass index |
| CMR | cardiometabolic risk |
| CVDs | cardiovascular diseases |
| DDS | dietary diversity score |
| DRIs | dietary reference intakes |
| FGDS | food group diversity score |
| FVS | food variety score |
| EER | estimated energy requirement |
| FNEP | food and nutrition education programme |
| MetS | metabolic syndrome risk |
| SBP | systolic blood pressure |
| TC | total cholesterol |
| WHtR | waist-to-height ratio |
References
- World Health Organization. A Global Brief on Hypertension; World Health Organization: Geneva, Switzerland, 2013; Available online: https://iris.who.int/bitstream/handle/10665/79059/WHO_DCO_WHD_2013.2_eng.pdf?sequence=1 (accessed on 15 March 2022).
- Davids, S.F.G.; Matsha, T.E.; Peer, N.; Erasmus, R.T.; Kengne, A.P. Increase in blood pressure over a 7-year period in a mixed-ancestry South African population. S. Afr. Med. J. 2019, 109, 503. [Google Scholar] [CrossRef]
- Peera, N.; Uthman, O.N.; Kengne, A.P. Rising prevalence, and improved but suboptimal management, of hypertension in South Africa: A comparison of two national surveys. Glob. Epidemiol. 2021, 3, 100063. [Google Scholar] [CrossRef]
- Tsioufis, C. The Mediterranean and the DASH dietary patterns: Insights into their role in cardiovascular disease prevention. Hell. J. Cardiol. 2018, 59, 134–135. [Google Scholar] [CrossRef]
- World Health Organization. Non-Communicable Diseases Country Profiles. 2018. Available online: https://www.who.int/publications/i/item/9789241514620 (accessed on 15 June 2019).
- Reddy, S.P.; Mbewu, A.D.; Nigel, R.W.; Sewpaul, R.; Morgan, J.W.; Sibusiso Sifunda, S.; Manyaapelo, T.; Mabaso, M. Race, geographical location and other risk factors for hypertension: South African National Health and Nutrition Examination Survey 2011/12. SSM. Popul. Health 2021, 16, 10098. [Google Scholar] [CrossRef] [PubMed]
- Mkhize, X.; Napier, C.; Oldewage-Theron, W. The nutrition situation of free-living elderly in Umlazi township, South Africa. Health SA Gesondheid. 2013, 18, 1–8. [Google Scholar] [CrossRef][Green Version]
- Oldewage-Theron, W.; Kruger, L. Food variety and dietary diversity as indicators of the dietary adequacy and health status of an elderly population in Sharpeville, South Africa. J. Nutr. Elder. 2008, 27, 101–133. [Google Scholar] [CrossRef]
- Swanepoel, B.; Malan, L.; Myburgh, P.H.; Schutte, E.A.; Steyn, K.; Wentzel-Viljoen, E. Sodium content of foodstuffs included in the sodium reduction regulation of South Africa. J. Food Compost. Anal. 2017, 63, 73–78. [Google Scholar] [CrossRef]
- Thomas, R.; Burger, R.; Hauck, K. Richer, wiser and in better health? The socioeconomic gradient in hypertension prevalence: Unawareness and control in South Africa. Soc. Sci. Med. 2018, 217, 18–30. [Google Scholar] [CrossRef]
- Riumallo-Herl, C.; Canning, D.; Kabudula, C. Health inequalities in the South African elderly: The importance of the measure of social-economic status. J. Econ. Ageing 2019, 10, 100191. [Google Scholar] [CrossRef] [PubMed]
- Amarya, S.; Singh, K.; Sabharwal, M. Changes during ageing and their association with malnutrition. J. Gerontol. Geriatr. 2015, 6, 78–84. [Google Scholar] [CrossRef]
- Ravi, S.; Bermudez, O.I.; Harivanzan, V.; Chui, K.H.K.; Vasudevan, P.; Must, A.; Thanikachalam, S.; Thanikachalam, M. Sodium intake, blood pressure, and dietary sources of sodium in an adult South Indian population. Ann. Glob. Health 2016, 82, 234–242. [Google Scholar] [CrossRef]
- Duodu, K.G.; Apea-Bah, F.B. African Legumes: Nutritional and Health-Promoting Attributes, in Gluten-Free Ancient Grains; Elsevier: Amsterdam, The Netherlands, 2017; pp. 223–269. [Google Scholar]
- Sobiecki, J.G.; Appleby, P.N.; Bradbury, K.E.; Key, T.J. High compliance with dietary recommendations in a cohort of meat eaters, fish eaters, vegetarians, and vegans: Results from the European prospective investigation into cancer and nutrition. An Oxford study. Nutr. Res. 2016, 36, 464–477. [Google Scholar] [CrossRef]
- Becerra-Tomás, N.; Babio, N.; Martínez-González, M.Á.; Corella, D.; Estruch, R.; Ros, E.; Fitó, M.; Serra-Majem, L.; Salaverria, I.; Lamuela-Raventós, R.M.; et al. Replacing red meat and processed red meat with white meat, fish, legumes or eggs is associated with lower risk of incidences of metabolic syndrome. Clin. Nutr. 2016, 35, 1442–1449. [Google Scholar] [CrossRef]
- Gutiérrez-Uribe, J.A.; Guajardo-Flores, D.; López-Barrios, L. Legumes in the diet. In Encyclopedia of Food and Health; Elsevier: Amsterdam, The Netherlands, 2016; pp. 539–543. [Google Scholar] [CrossRef]
- World Cancer Research Fund and the NCD Alliance. The Link between Food, Nutrition, Diet and Non-Communicable Diseases. 2014. Available online: https://www.wcrf.org/wp-content/uploads/2021/07/WCRF-NCD-A4-WEB.pdf (accessed on 15 June 2017).
- Shahrajabian, M.H.; Sun, W.; Cheng, Q. Survey of Biological Nitrogen Fixation in Adzuki Beans, Soybeans, and Mung Beans: Three Legumes in Traditional Chinese Medicine; Academic Press: Cambridge, MA, USA, 2021; Chapter 20; pp. 301–316. [Google Scholar] [CrossRef]
- Askari, M.; Daneshzad, E.; Jafari, A.; Bellissimo, N.; Azadbakht, L. Association of nut and legume consumption with Framingham 10-year risk of general cardiovascular disease in older adult men: A cross-sectional study. Clin. Nutr. ESPEN 2021, 42, 373–380. [Google Scholar] [CrossRef]
- Mendes, V.; Niforou, A.; Kasdagli, M.I.; Ververis, E.; Naska, A. Intake of legumes and cardiovascular disease: A systematic review and dose-response meta-analysis. Nutr. Metab. Cardiovasc. Dis. 2023, 33, 22–37. [Google Scholar] [CrossRef]
- Perera, D.; Devkota, L.; Garnier, G.; Panozzo, J.; Dhital, S. Hard-to-cook phenomenon in common legumes: Chemistry, mechanisms and utilisation. Food. Chem. 2023, 415, 135743. [Google Scholar] [CrossRef]
- Luzzani, G. The sustainability of diets: Current understanding and shortcomings. Curr. Opin. Environ. Sci. Health 2022, 30, 100398. [Google Scholar] [CrossRef]
- Kye, B.; Arenas, E.; Teruel, G.; Rubalcava, L. Education, elderly health, and differential population aging in South Korea: A demographic approach. Demogr. Res. 2014, 30, 753–794. [Google Scholar] [CrossRef]
- Daskalopoulou, S.S.; Feldman, R.D.; McAlister, F.A.; Rabi, D.M. The history of hypertension: Guidelines in Canada. Can. J. Cardiol. 2019, 35, 582–589. [Google Scholar] [CrossRef] [PubMed]
- Seedat, Y.K.; Rayner, B.L.; Veriava, Y. South African hypertension practice guideline 2014. Cardiovasc. J. Afr. 2014, 25, 288–294. [Google Scholar] [CrossRef] [PubMed]
- Kawada, T.; Andou, T.; Fukumitsu, M. Waist circumference, visceral abdominal fat thickness and three components of metabolic syndrome. Diabetes Metab. Syndr. 2016, 10, 4–6. [Google Scholar] [CrossRef] [PubMed]
- WHO. Global Database on Body Mass Index. 2004. Available online: http://www.apps.who.int/bmi/index/jsp?intropage=intro-3.html (accessed on 17 September 2020).
- Okada, R.; Yasuda, Y.; Tsushita, K.; Wakai, K.; Hamajima, N.; Matsuo, S. Upper-normal waist circumference is a risk marker for metabolic syndrome in normal-weight subjects. Nutr. Metab. Cardiovasc. Dis. 2016, 26, 67–76. [Google Scholar] [CrossRef] [PubMed]
- Mkhize, X.; Napier, C.; Oldewage-Theron, W.; Duffy, K.D. Addressing Food and Nutrition Insecurity through the Development and Implementation of an Agricultural and Nutrition Education Programme on Legumes for Older Farmers Living in Mariannhill, KwaZulu-Natal—South Africa. Ph.D. Thesis, Durban University of Technology, Durban, South Africa, 2020. [Google Scholar]
- De Almeida, G.M.; Recine, E.; Fagundes, A. Objectives and competencies in food and nutrition education in the Brazilian Undergraduate Nutrition Program. J. Nutr. Educ. Behav. 2020, 52, 385–393. [Google Scholar] [CrossRef] [PubMed]
- Moreno-Valdespinoa, C.A.; Luna-Vital, D.; Camacho-Ruizb, R.M.; Mojica, L. Bioactive proteins and phytochemicals from legumes: Mechanisms of action preventing obesity and type-2 diabetes. Food. Res. Int. 2020, 130, 108905. [Google Scholar] [CrossRef] [PubMed]
- Urban, D.; Irwin, W.; Kirk, M.; Markiewicz, M.A.; Myers, R.; Smith, M.; Weiss, H.; Grizzle, W.E.; Barnes, S. The effect of isolated soy protein on plasma biomarkers in elderly men with elevated serum prostate specific antigen. J. Urol. 2001, 165, 294–300. [Google Scholar] [CrossRef]
- Bazzano, L.A.; Thompson, A.M.; Tees, M.T.; Nguyen, C.H.; Winham, D.M. Non-soy legume consumption lowers cholesterol levels: A meta-analysis of randomized controlled trials. Nutr. Metab. Cardiovasc. Dis. 2011, 21, 94–103. [Google Scholar] [CrossRef]
- Randox Laboratories. Reagents and Control Kits: Glucose, Cholesterol, Calcium, Magnesium and Iron. 2015. Available online: http://www.randox.com/ (accessed on 18 June 2019).
- Castaneda-Gameros, D.; Redwood, S.; Thompson, J.L. Low nutrient intake and frailty among overweight and obese migrant women from ethnically diverse backgrounds ages 60 years and older: A mixed-methods study. J. Nutr. Educ. Behav. 2017, 49, 3–10. [Google Scholar] [CrossRef]
- South African Medical Research Council—SAMRC. Food and Nutrient Availability in South African Households Development of a Nationally Representative Database. Health and Development Research Group and the Burden of Disease Research Unit. 2002. Available online: https://www.samrc.ac.za/sites/default/files/attachments/2022-08/foodnutrientavail.pdf (accessed on 16 January 2022).
- Institute of Medicine. Dietary Reference Intakes: The Essential Guide to Nutrient Requirements; National Academy of Sciences: Washington, DC, USA, 2006. [Google Scholar]
- Nutrition Information Centre University of Stellenbosch. Dietary Reference Intakes. 2003. Available online: http://www.sun.ac/nicus (accessed on 20 April 2020).
- Habte, T.Y.; Krawinel, M.K. Dietary Diversity Score: A Measure of Nutritional Adequacy or an Indicator of Healthy Diet? J. Nutr. Health 2016, 3, 303. Available online: https://d-nb.info/1132995035/34 (accessed on 11 June 2023).
- Kennedy, G.B.T.; Dorp, M. Guidelines for Measuring Household and Individual Dietary Diversity; FAO: Rome, Italy, 2010; Available online: https://www.fao.org/3/i1983e/i1983e00.pdf (accessed on 20 October 2019).
- United Nations. World Aging Population Report 2015. Available online: https://www.un.org/en/development/desa/population/publications/pdf/ageing/WPA2015_Report.pdf (accessed on 21 February 2020).
- Kim, H.; Andrade, F.C.D. Diagnostic status and age at diagnosis of hypertension on adherence to lifestyle recommendations. Prev. Med. Rep. 2020, 13, 52–56. [Google Scholar] [CrossRef]
- Gadekar, T.; Cariappa, M.P. Overweight and obesity management guidelines 2016. Med. J. Armed Forces India 2017, 73, 100. [Google Scholar] [CrossRef]
- Zargarzadeh, N.; Mousavi, S.M.; Santos, H.O.; Aune, D.; Hasani-Ranjbar, S.; Larijani, B.; Esmaillzadeh, A. Legume consumption and risk of all-cause and cause-specific mortality: A systematic review and dose–response meta-analysis of prospective studies. Adv. Nutr. 2023, 14, 64–76. [Google Scholar] [CrossRef] [PubMed]
- Ronquest-Ross, L.C.; Vink, N.; Sigge, G.O. Food consumption changes in South Africa since 1994. S. Afr. Med. J. 2015, 111, 64–75. [Google Scholar] [CrossRef] [PubMed]
- Joshi, R.; Peiris, D. Task-sharing for the prevention and control of non-communicable diseases. Lancet Glob. Health 2019, 7, 686–687. [Google Scholar] [CrossRef]
- Napier, C.; Grobbelaar, H.; Oldewage-Theron, W. An introduction to the Food-Based Dietary Guidelines for the Elderly in South Africa. S. Afr. J. Clin. Nutr. 2021, 34, S1–S8. [Google Scholar] [CrossRef]
- Mkhize, X.; Mthembu, B.E.; Napier, C. Transforming a local food system to address food and nutrition insecurity in an urban informal settlement area: A study in Umlazi Township in Durban, South Africa. J. Agric. Res. 2023, 12, 100565. [Google Scholar] [CrossRef]
- Kennedy, G.; Wang, Z.; Maundu, P.; Hunter, D. The role of traditional knowledge and food biodiversity to transform modern food systems. Trends. Food Sci. Technol. 2022, 130, 32–41. [Google Scholar] [CrossRef]
- Ismail, R.; Ismail, N.H.; Isa, Z.M.; Tamil, A.M.; Ja’afar, M.H.; Nasir, N.M.; Suraya Abdul-Razak, S.A.; Abidin, N.Z.; Hafiza, N.; Razak, A.; et al. Prevalence and factors associated with pre-hypertension and hypertension among adults: Baseline findings of PURE Malaysia cohort study. AJM Open 2023, 10, 100049. [Google Scholar] [CrossRef]
- Moran, A.E.; Gupta, R. Global Hearts Initiative Collaborators. Implementation of Global Hearts Hypertension Control Programs in 32 Low- and Middle-Income Countries. J. Am. Coll. Cardiol. 2023, 7, 1868–1884. [Google Scholar] [CrossRef]


| Nutrients/Day and DRIs for ♀ Women | Pre- EG Women Mean ± SD | Pre- EG NARs Mean % of DRI | Pre- EG % Women Consuming < 100% of DRIs | Post- EG Women Mean ± SD | Post- EG NARs Mean % of DRI | Post- EG % Women Consuming <100 of DRIs | Significance p-Value |
|---|---|---|---|---|---|---|---|
| Energy (kJ) EER value for active ♀ Pre-6212.05 ± 1255.75 Post- ♀6400.80 ± 1214.64 | 4010.83 ± 1300.89 | 64.6 | 46.2% | 5939.90 ± 2313.60 | 97.8 | 41.7% | 0.001 |
| Carbohydrates (g) ♀100 EAR | 139.64 ± 55.16 | 139.6 | 33.3% | 177.78 ± 53.23 | 177.7 | 4.2% | 0.002 |
| Total protein (g) ♀46 RDA | 32.28 ± 11.52 | 70.1 | 90.9% | 59.95 ± 30.62 | 130.3 | 29.2% | 0.000 |
| Total fat (g) ♀100 EAR | 24.20 ± 11.288 | 24.2 | 63.6% | 43.68 ± 26.858 | 43.6 | 48.0% | 0.001 |
| Total dietary fibre (g) ♀21 AI | 11.36 ± 4.56 | 54.0 | 97.4% | 16.65 ± 6.46 | 79.2 | 70.8% | 0.001 |
| Nutrients/Day and DRIs for Men | Pre EG Men Mean ± SD | Pre EG NARs Mean % of DRI | EG % Men Consuming < 100% of DRI | Post- EG Men Mean ± SD | Post- EG NARs Mean % of DRI | EG % Men Consuming < 100% of DRI | Significance p-Value |
|---|---|---|---|---|---|---|---|
| Energy (kJ) EER value for active men Pre- ♂4815.55 ± 545.68 Post- ♂ 5188.34 ± 1452.19 | 4729.46 ± 1290.86 | 98.2 | 35.7% | 5255.45 ± 1954.55 | 101.2 | 45.5% | 0.408 |
| Carbohydrates (g) ♂100 EAR | 170.07 ± 53.58 | 170.7 | 0.0% | 139.64 ± 55.16 | 139.6 | 33.3% | 0.150 |
| Total protein (g) ♂56 RDA | 38.29 ± 16.78 | 68.3 | 92.9% | 48.09 ± 20.56 | 85.8 | 72.2% | 0.178 |
| Total fat (g) ♂100 EAR | 25.51 ± 12.831 | 25.5 | 85.7% | 33.67 ± 16.08 | 33.6 | 50.0% | 0.149 |
| Total dietary fibre (g) ♂ 30 AI | 14.44 ± 5.798 | 48.1 | 100.0% | 19.93 ± 8.38 | 66.4 | 36.3% | 0.054 |
| Food Groups | Mean FGDS EG Pre Intervention | ±SD | Ranges of Scores | Mean FGDS EG Post- Intervention | ±SD | Ranges of Scores | Significance p-Value |
|---|---|---|---|---|---|---|---|
| Meat Eggs Dairy Cereals Legumes Vitamin A-rich fruit and vegetables Other fruits Other vegetables Fat and oils | 6.5 1 4.3 9.6 2.4 5.0 5.3 6.6 2.1 | 3.07 0.00 2.18 3.67 1.35 1.80 4.02 2.28 0.90 | 1–4 0–1 1–9 1–5 1–7 1–8 1–19 1–16 1–5 | 6.1 1 3.3 7.3 5.7 3.8 5.0 6.1 1.8 | 2.92 0.00 2.30 4.05 2.56 1.88 2.81 3.10 0.59 | 1–4 0–1 1–9 1–5 1–7 1–8 1–19 1–16 1–5 | 0.540 1.000 0.045 0.009 0.000 0.004 0.681 0.416 0.062 |
| FVS | 42.8 | 18.90 | 23–74 | 40.1 | 20.21 | 23–74 | 0.531 |
| DDS | 8.59 | ±0.74 | 8.23 | ±1.11 | 0.097 | ||
| Food Groups | Mean FGDS CG Pre intervention | ±SD | Range of scores | Mean FGDS CG Post- intervention | ±SD | Range of scores | |
| Meat Eggs Dairy Cereals Legumes Vitamin A-rich fruit and vegetables Other fruits Other vegetables Fat and oils | 7.2 1 8.0 13.0 3.0 6.0 12.0 10.0 3.0 | 1.30 0.00 3.82 8.62 1.82 4.52 6.97 6.72 2.04 | 1–4 0–1 1–9 2–5 1–8 1–8 1–19 1–16 1–5 | 5.3 1.0 3.0 8.8 2.0 4.3 4.6 5.2 2.2 | 2.9 0.0 1.7 3.0 1.2 0.9 2.2 2.3 0.7 | 1–4 1–1 1–9 1–5 1–7 1–8 1–19 1–16 1–5 | 0.000 1.000 0.000 0.002 0.003 0.010 0.000 0.000 0.011 |
| FVS | 63.2 | ±35.81 | 23–75 | 36.4 | ±14.9 | 20–74 | 0.000 |
| DDS | 8.69 | 0.89 | 8.52 | 0.98 | 0.412 |
| Factor Variable | EG Pre-Mean ± SD | EG Post- Mean ± SD | Significance (p-Values) * Pre- and Post- for EG | CG Pre- Mean ± SD | CG Post-Mean ± SD | Significance (p-Values) * Pre and Post for CG (Wilcoxon Test-W) | Significance (p-Values) * for the Three Relevant Effects Pre and Post for EG and CG (Two-Way ANOVA) |
|---|---|---|---|---|---|---|---|
| BMI (kg/m2 18.5–24.99 (normal range) | 31.07 ± 8.62 | 32.35 ± 6.2 | 0.141 | 31.42 ± 7.13 | 31.28 ± 7.32 | 0.298 | 0.385 GE; 0.399 TE; 0.951 IE |
| WC (cm) <102 cm♂/ >88 cm♀ | 99.99 ± 12.41 | 105.02 ± 18.59 | 0.218 | 100.98 ± 13.85 | 101.26 ± 14.35 | 0.959 | 0.224 GE; 0.237 TE; 0.379 IE |
| WHtR (cm/m2) (<0.5) | 0.60 ± 0.10 | 0.65 ± 0.11 | 0.228 | 0.619 ± 0.09 | 0.61 ± 0.09 | 0.465 | 0.351 GE; 0.137 TE; 0.681 IE |
| SBP (<120 mmHg) | 138.02 ± 28.41 | 129.58 ± 32.76 | 0.228 | 155.54 ± 28.65 | 155.52 ± 29.51 | 0.975 | 0.001 GE; 0.163 TE; 0.133 IE |
| DBP (≤80 mmHg) | 84.8 ± 14.12 | 78.41 ± 11.53 | 0.020 | 85.50 ± 12.37 | 85.06 ± 12.55 | 0.643 | 0.091 GE; 0.094 TE; 0.119 IE |
| Group | Pre- Intervention Mean ± SD | Post- Intervention Mean ± SD | Significance (p-Values) * Compared per Interval Wilcoxon Test-W) | Significance (p-Values) * for the Three Relevant Effects Compared per Interval (Two-Way ANOVA) for EG and CG |
|---|---|---|---|---|
| Glucose CG 5–6 mmol/L Glucose EG 5–6 mmol/L | 6.73 ± 4.50 6.66 ± 2.84 | 6.94 ± 4.49 5.30 ± 2.86 | 0.349 0.003 | 0.225 GE; 0.447 TF; 0.406 IE |
| Cholesterol CG <5.17 mmol/L 200 mg/dL Cholesterol EG <5.17 mmol/L 200 mg/dL | 6.23 ± 2.77 4.39 ± 1.42 | 6.30 ± 2.88 2.20 ± 0.48 | 0.877 0.001 | 0.001 GE; 0.830 TF; 0.872 IE |
| CMR Variables EG Only | EG Men Mean ± SD (3 Intervals) | EG Women Mean ± SD (3 Intervals) | Significance (p-Values) * Gender Comparison |
|---|---|---|---|
| SBP < 120 mmhg DBP < 80 mmhg CHOLESTEROL < 5.17 mmol/L BMI kg/m2 (18.5–24.99) WC (cm) <102 cm♂/ > 88 cm♀ | 164.67 ± 4.04 84.00 ± 13.86 6.35 ± 1.11 32.40 ± 4.04 103.33 ± 9.80 | 134.62 ± 20.49 80.69 ± 11.50 4.51 ± 1.30 29.65 ± 6.31 98.08 ± 14.97 | 0.013 1.000 0.033 0.315 0.472 |
Disclaimer/Publisher’s Note: The statements, opinions and data contained in all publications are solely those of the individual author(s) and contributor(s) and not of MDPI and/or the editor(s). MDPI and/or the editor(s) disclaim responsibility for any injury to people or property resulting from any ideas, methods, instructions or products referred to in the content. |
© 2024 by the authors. Licensee MDPI, Basel, Switzerland. This article is an open access article distributed under the terms and conditions of the Creative Commons Attribution (CC BY) license (https://creativecommons.org/licenses/by/4.0/).
Share and Cite
Mkhize, X.; Oldewage-Theron, W.; Napier, C.; Duffy, K.J. Associations between Cardiometabolic Risk Factors and Increased Consumption of Diverse Legumes: A South African Food and Nutrition Security Programme Case Study. Nutrients 2024, 16, 354. https://doi.org/10.3390/nu16030354
Mkhize X, Oldewage-Theron W, Napier C, Duffy KJ. Associations between Cardiometabolic Risk Factors and Increased Consumption of Diverse Legumes: A South African Food and Nutrition Security Programme Case Study. Nutrients. 2024; 16(3):354. https://doi.org/10.3390/nu16030354
Chicago/Turabian StyleMkhize, Xolile, Wilna Oldewage-Theron, Carin Napier, and Kevin Jan Duffy. 2024. "Associations between Cardiometabolic Risk Factors and Increased Consumption of Diverse Legumes: A South African Food and Nutrition Security Programme Case Study" Nutrients 16, no. 3: 354. https://doi.org/10.3390/nu16030354
APA StyleMkhize, X., Oldewage-Theron, W., Napier, C., & Duffy, K. J. (2024). Associations between Cardiometabolic Risk Factors and Increased Consumption of Diverse Legumes: A South African Food and Nutrition Security Programme Case Study. Nutrients, 16(3), 354. https://doi.org/10.3390/nu16030354