
A Meal with Ultra-Processed Foods Leads to a Faster Rate of Intake and to a Lesser Decrease in the Capacity to Eat When Compared to a Similar, Matched Meal Without Ultra-Processed Foods

 , , , , , , , , , and
Abstract
1. Introduction
2. Materials and Methods
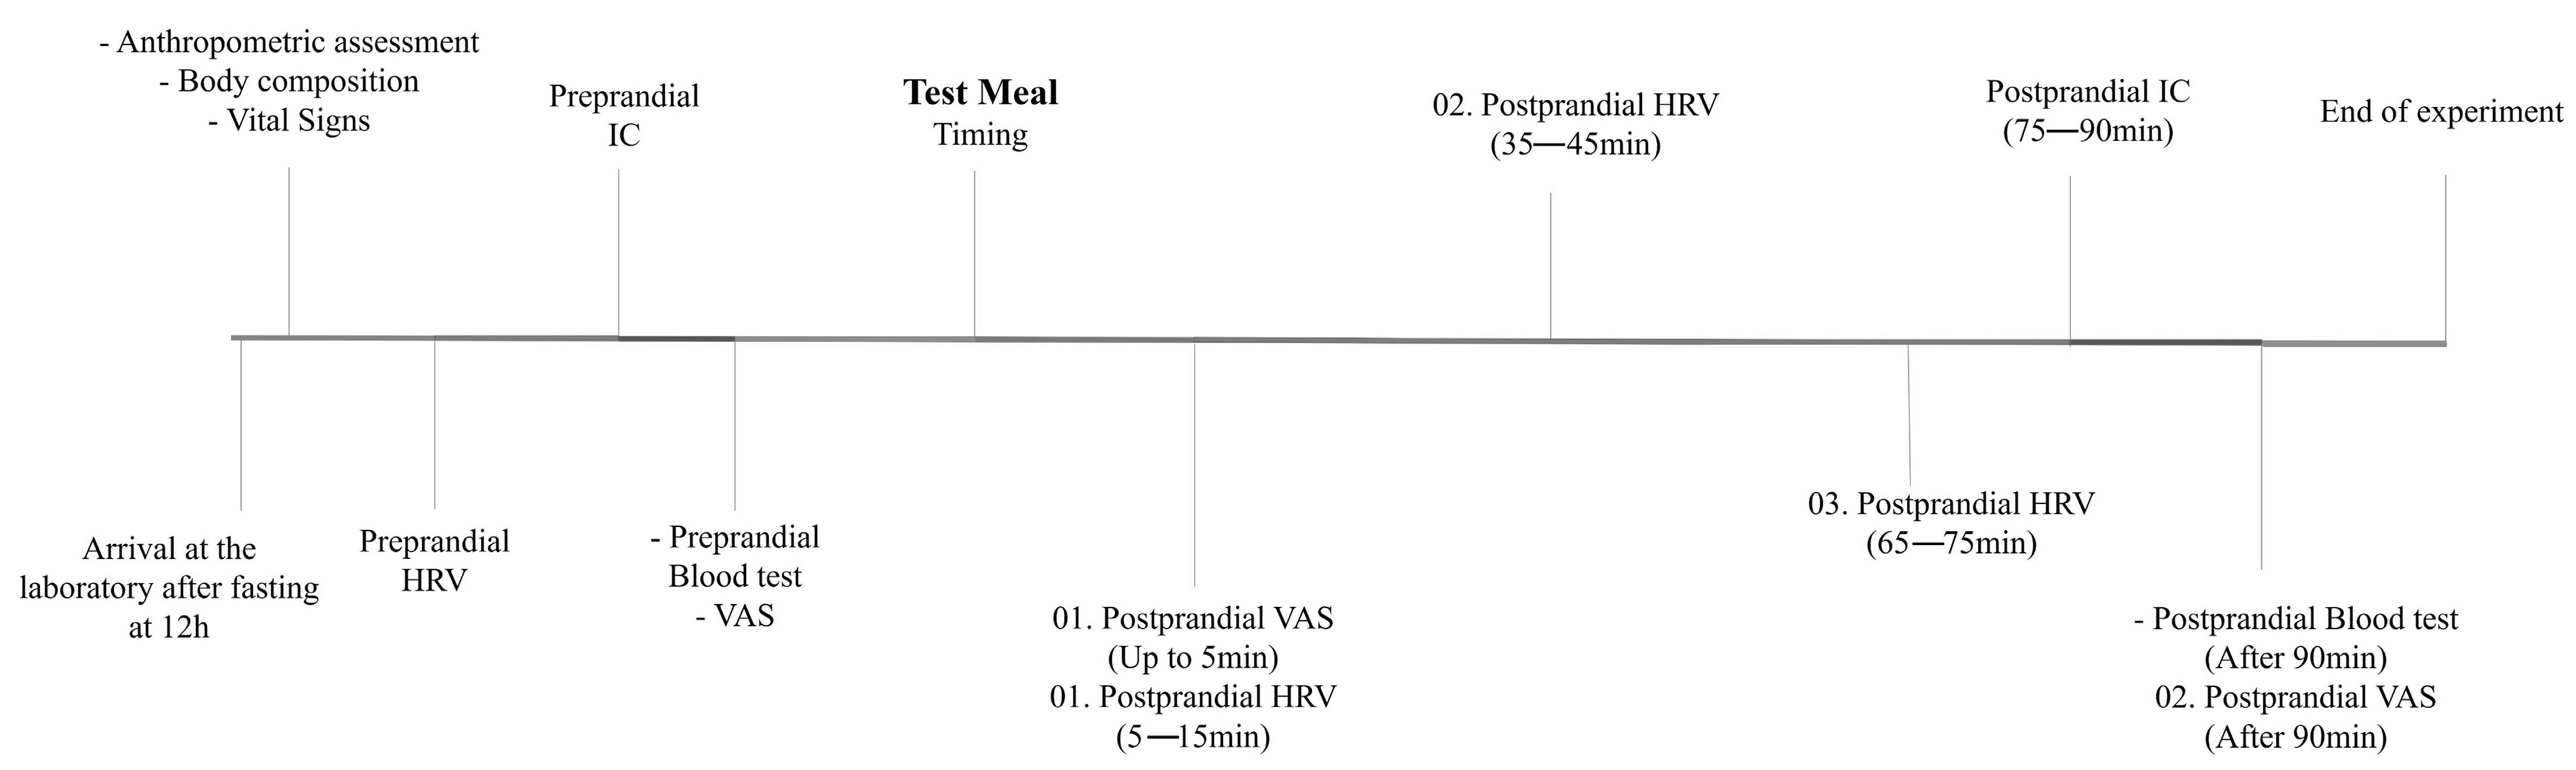
2.1. Experimental Design
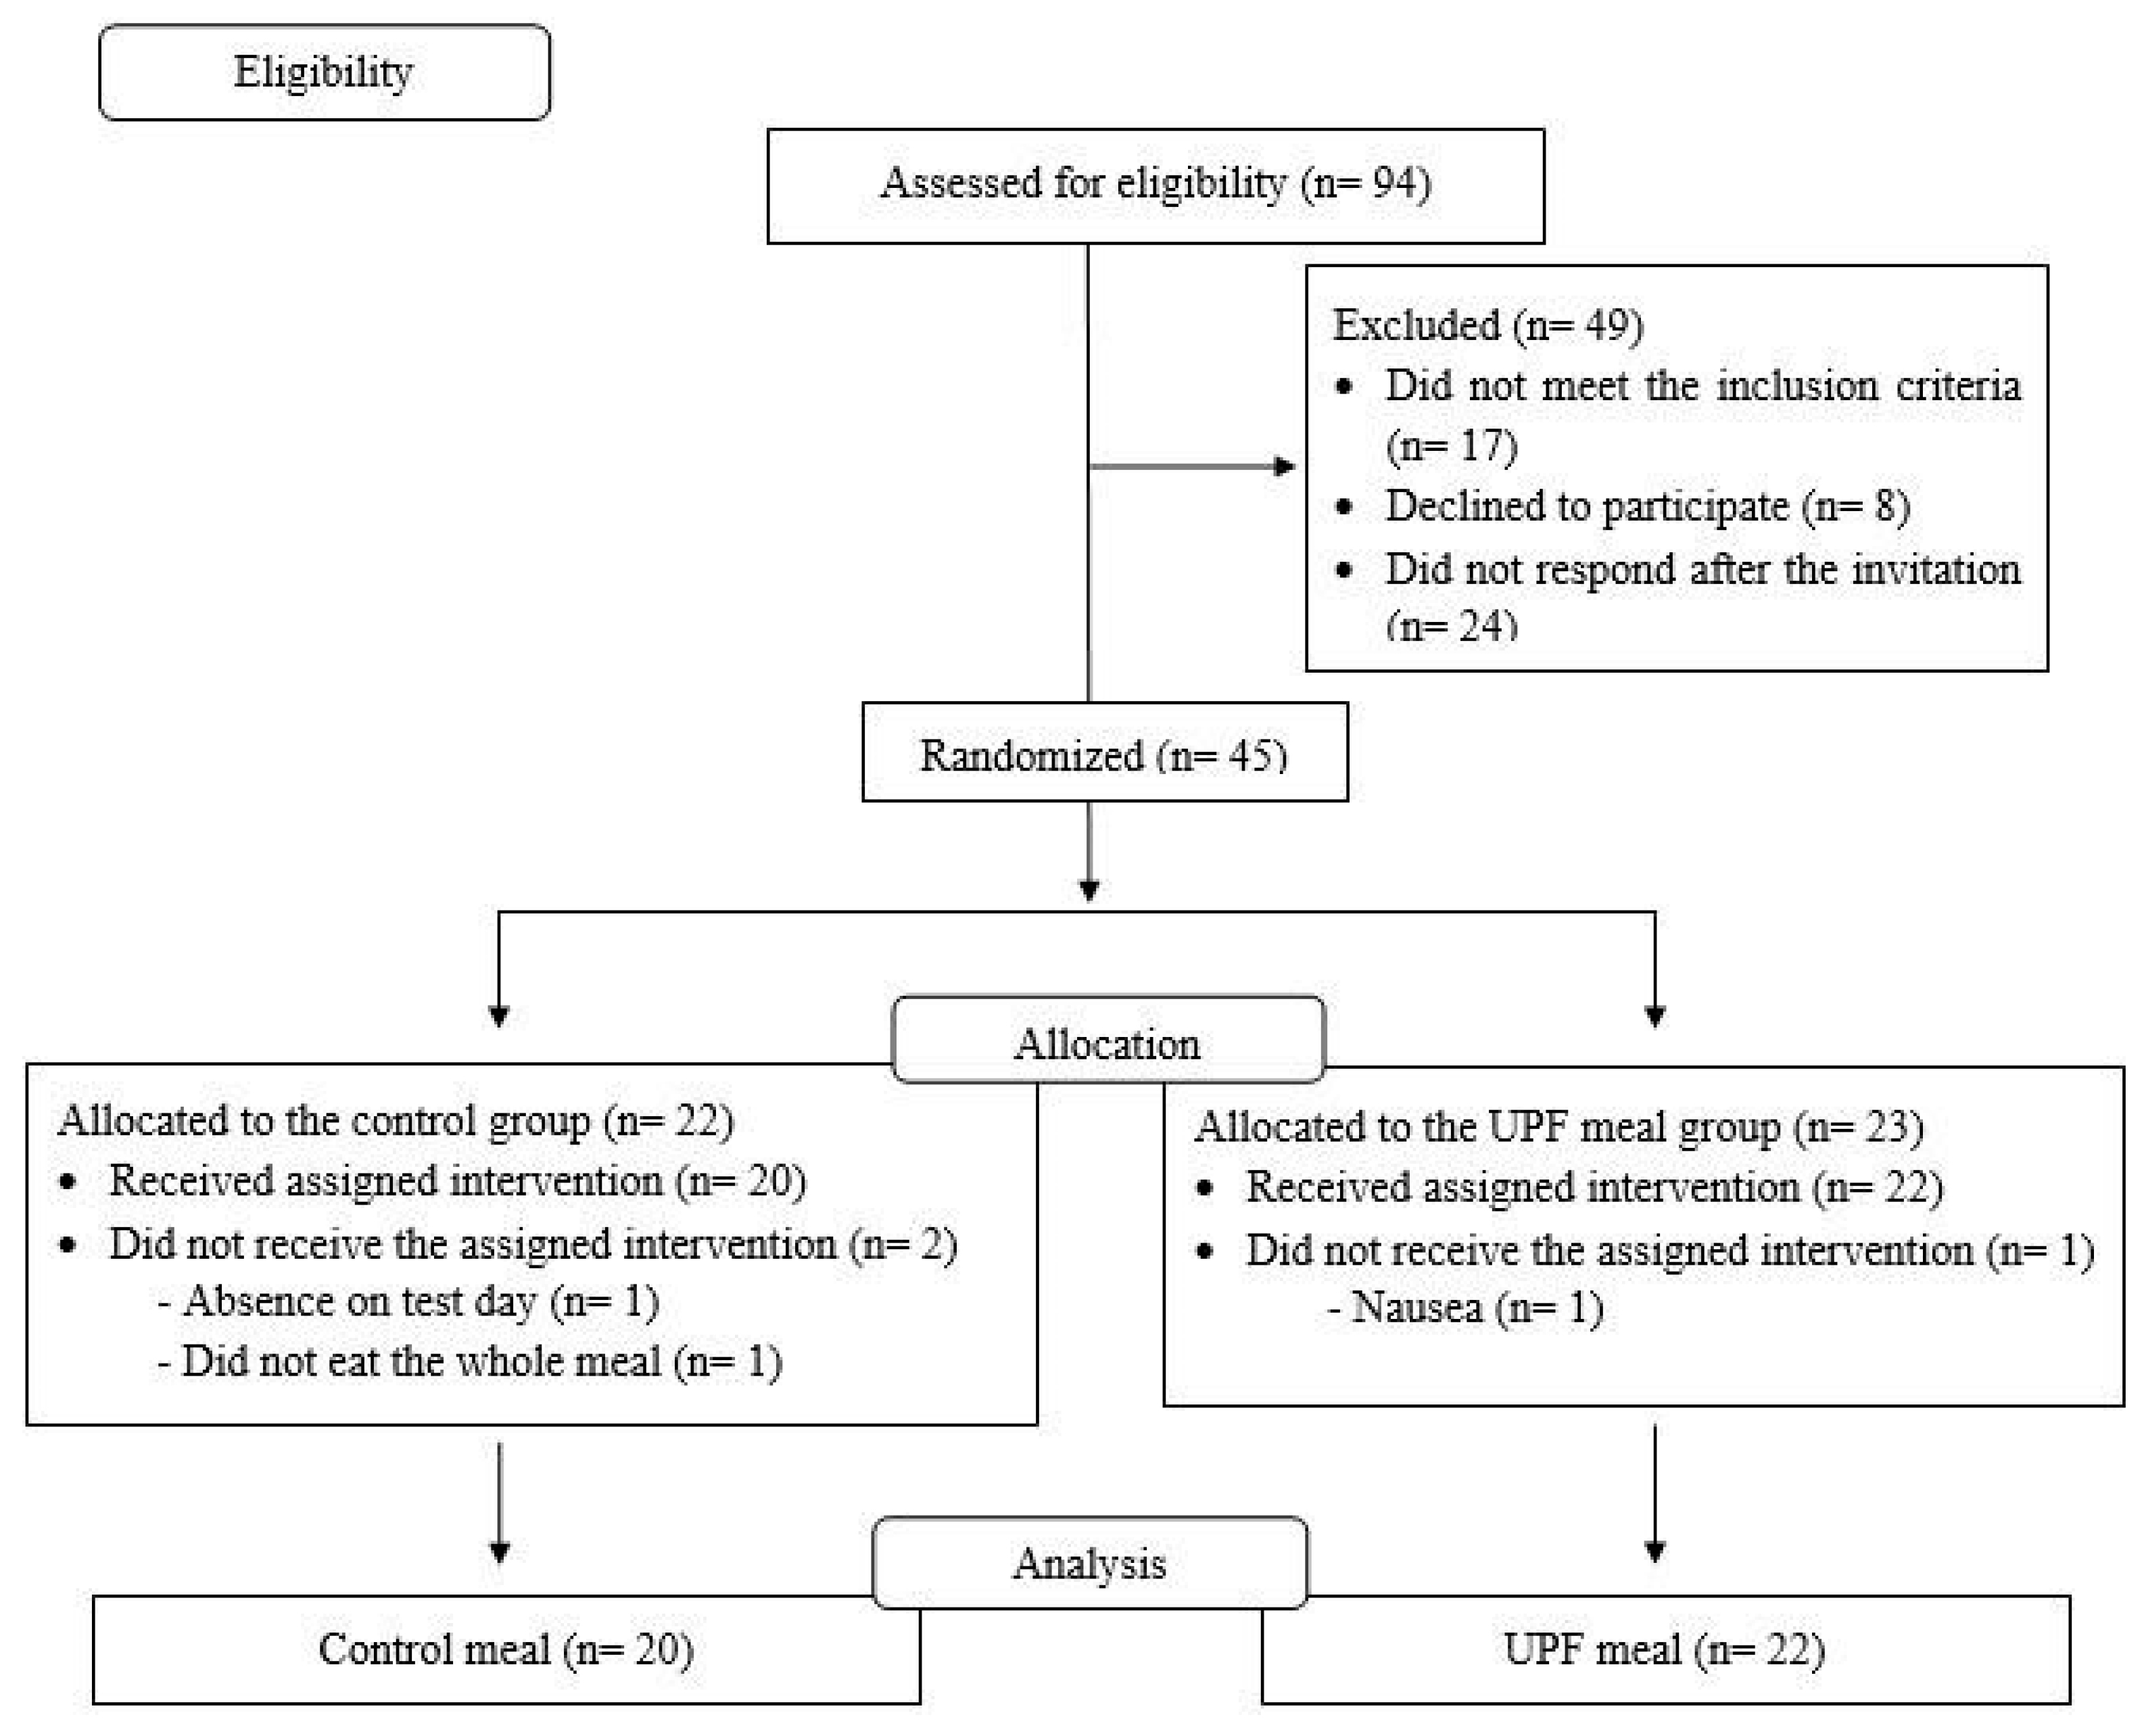
2.2. Location, Sample and Sampling
2.3. Randomization and Allocation
2.4. Procedures
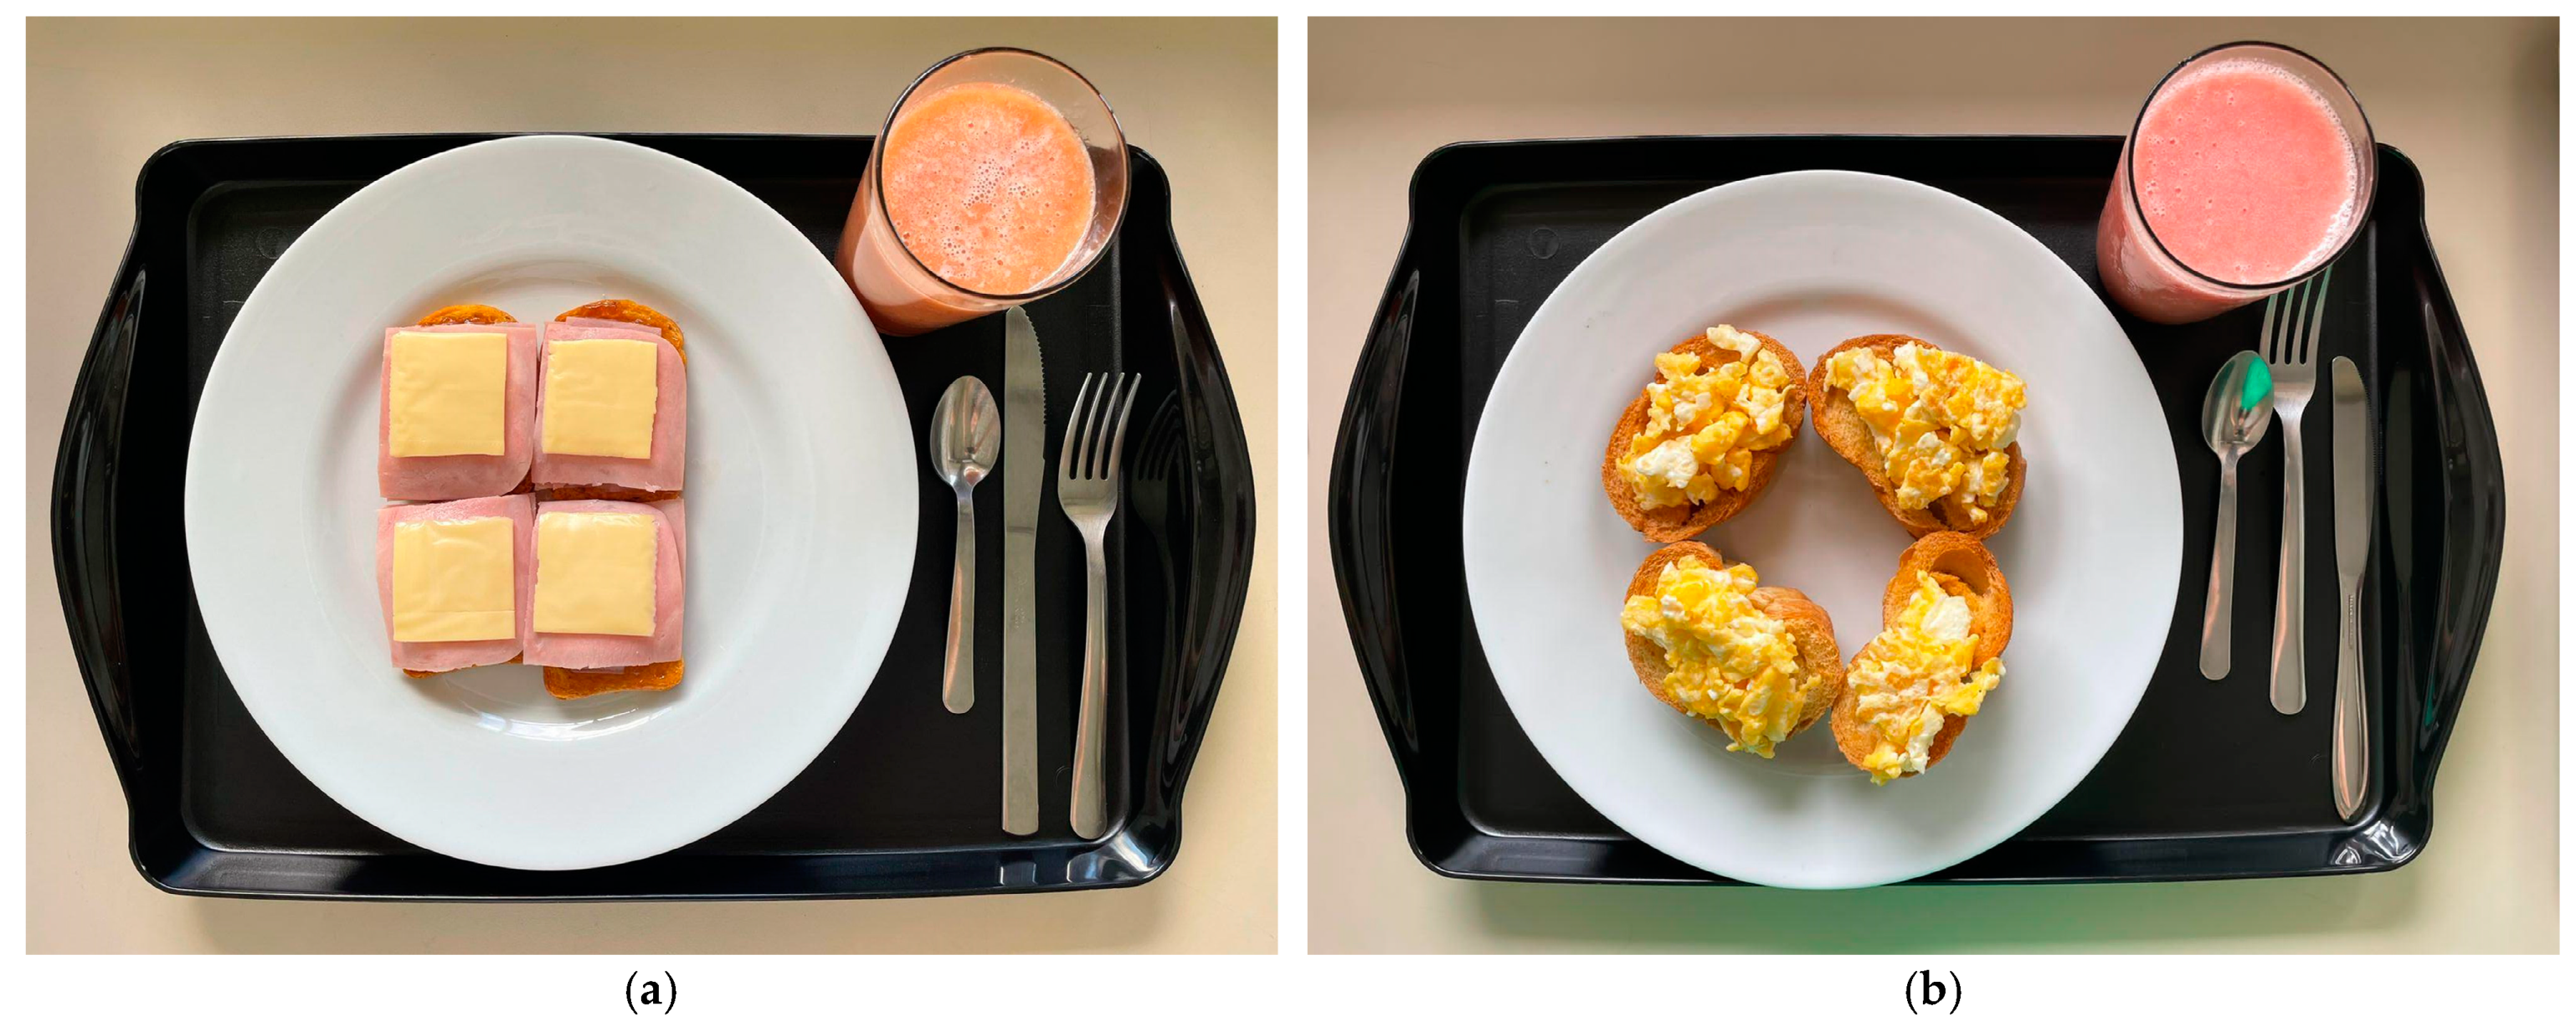
2.5. Test Meals
2.6. Ingestion Rhythm
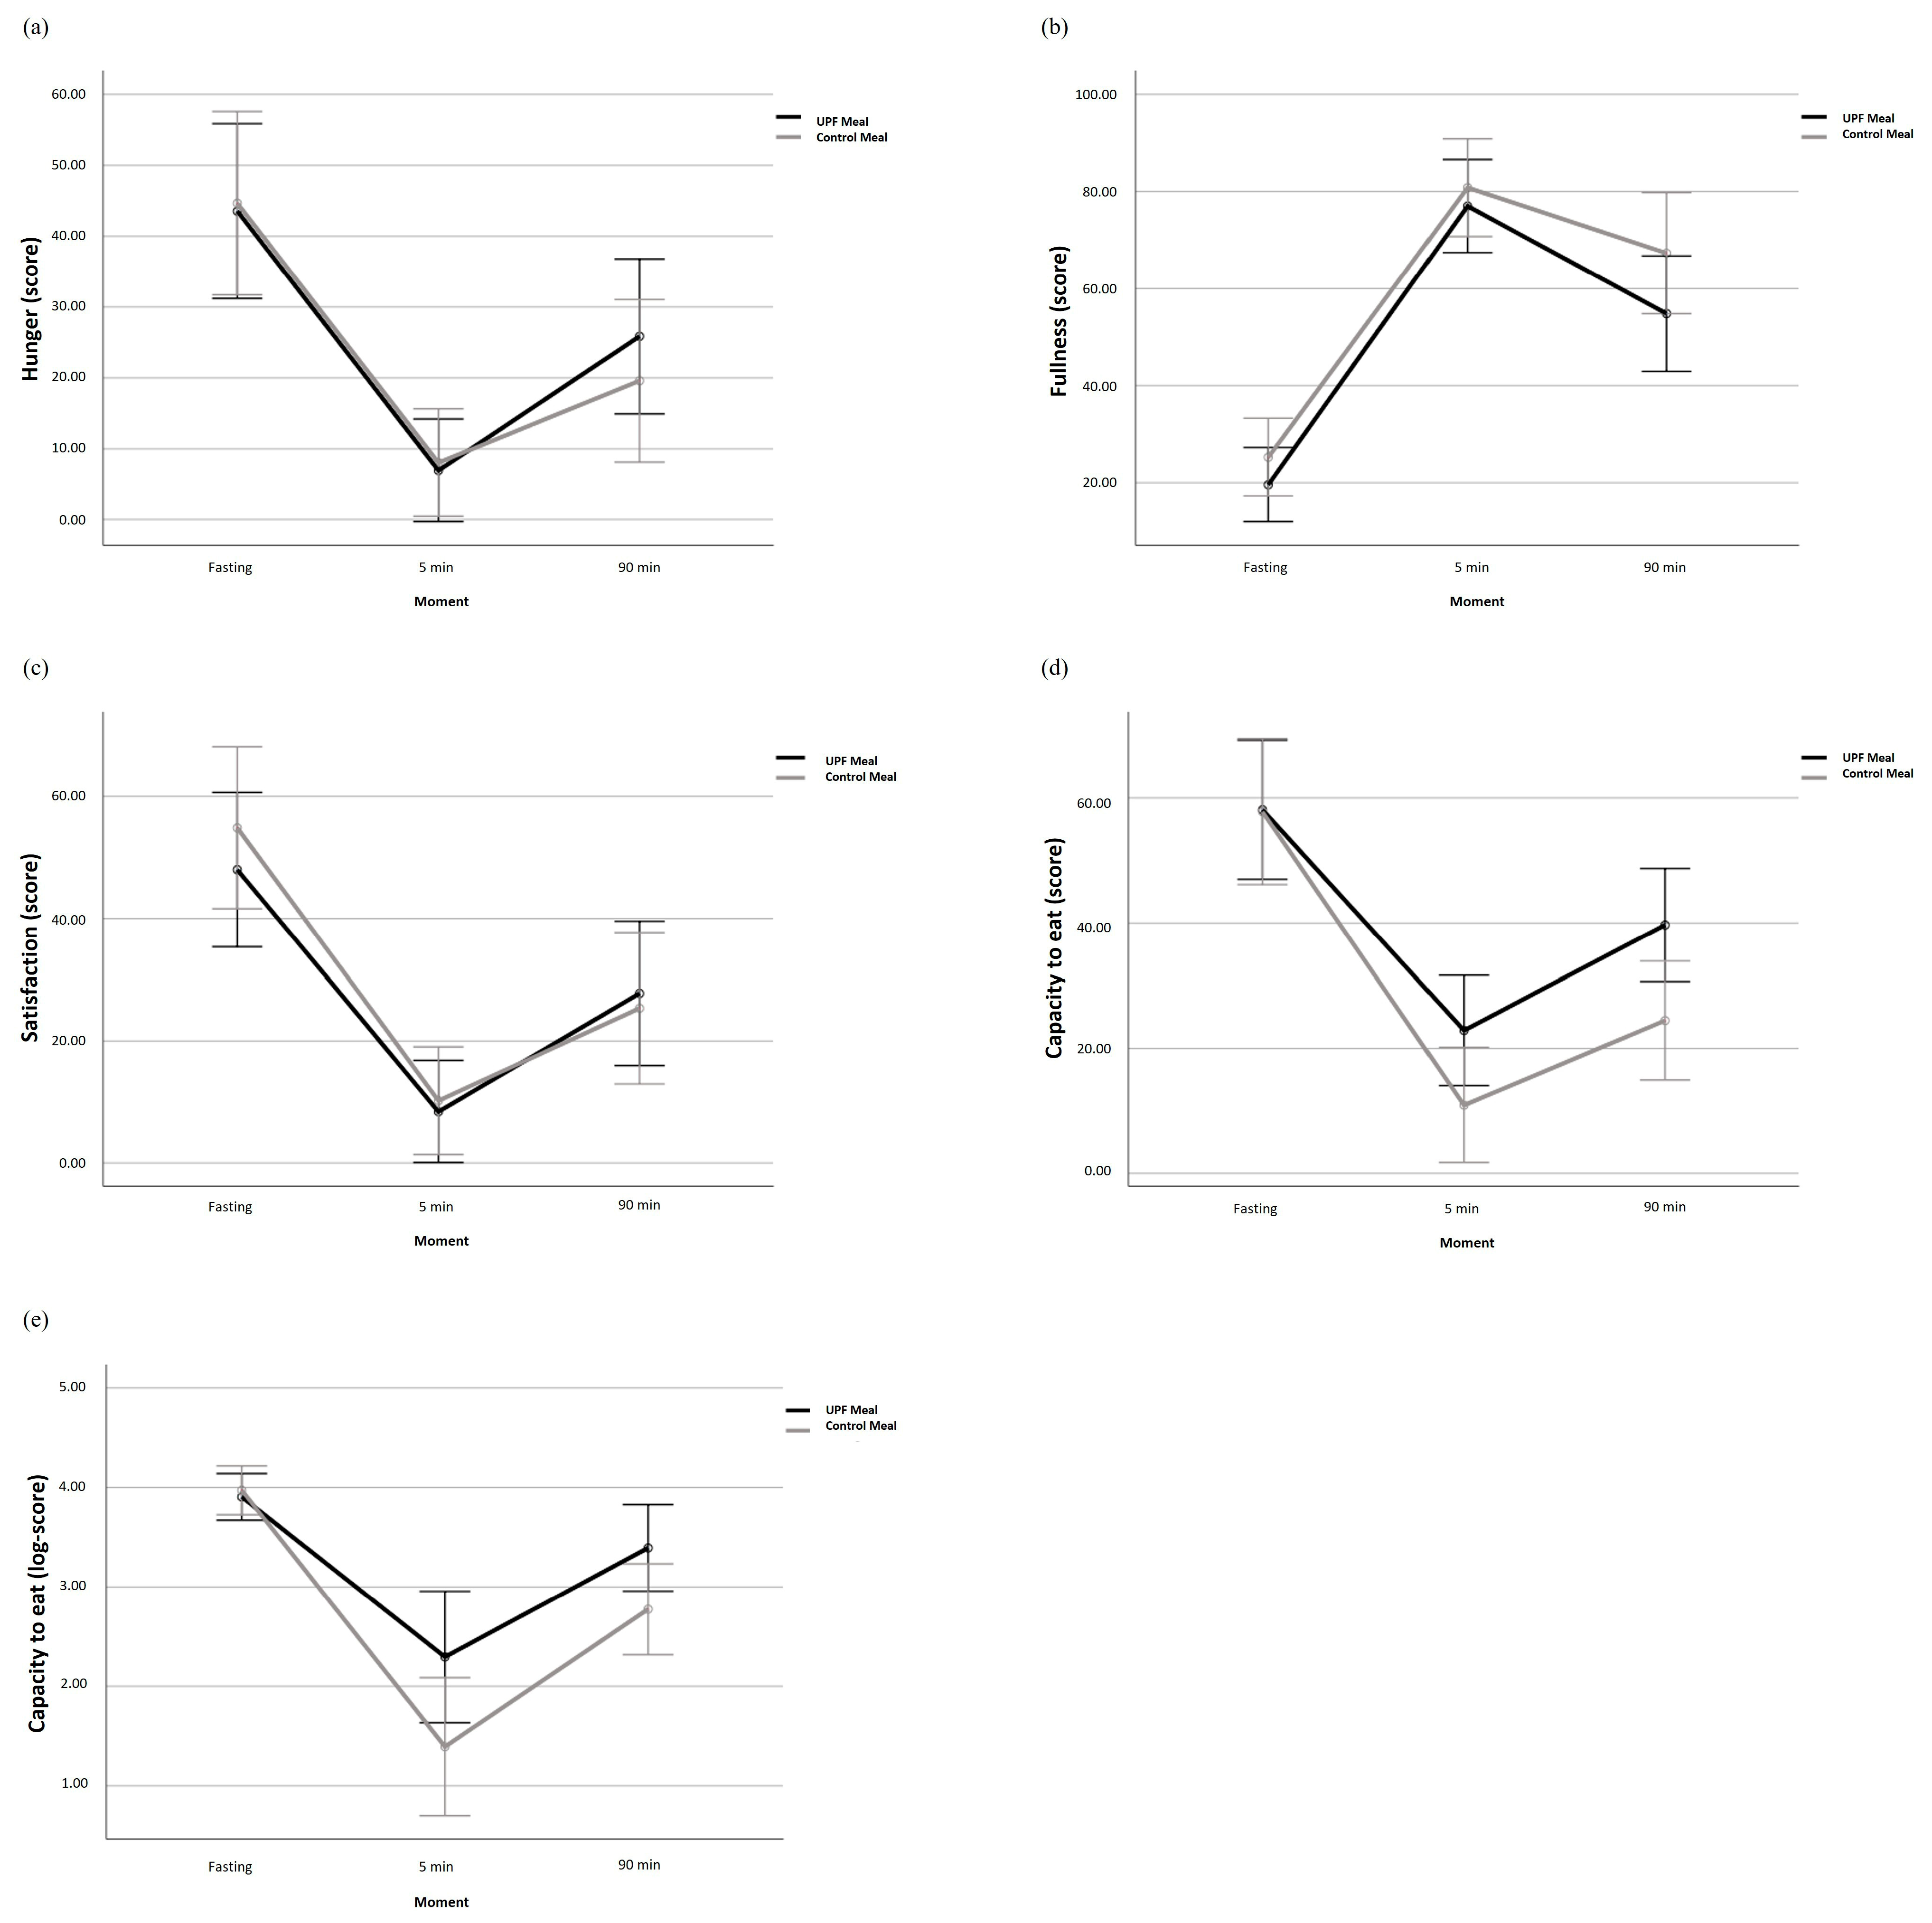
2.7. Appetitive Measures
2.8. Energy Expenditure Measurements
2.9. Autonomic Function
2.10. Hormone Analysis
2.11. Additional Data
2.12. Sample Size Calculation
2.13. Statistical Analysis
3. Results
4. Discussion
4.1. Main Findings
4.2. Methodological Considerations Regarding the Meals
4.3. Ingestion Rhythm and Appetitive Measures
4.4. Post-Prandial Energy Expenditure
4.5. Autonomic Function
4.6. Insulin Sensitivity and Satiety Hormones
4.7. Limitations
5. Conclusions
Author Contributions
Funding
Institutional Review Board Statement
Informed Consent Statement
Data Availability Statement
Conflicts of Interest
References
- Monteiro, C.A.; Cannon, G.; Levy, R.; Moubarac, J.-C.; Jaime, P.; Martins, A.P.; Canella, D.; Louzada, M.; Parra, D. NOVA. The Star Shines Bright. World Nutr. 2016, 7, 28–38. [Google Scholar]
- Pagliai, G.; Dinu, M.; Madarena, M.P.; Bonaccio, M.; Iacoviello, L.; Sofi, F. Consumption of Ultra-Processed Foods and Health Status: A Systematic Review and Meta-Analysis. Br. J. Nutr. 2020, 125, 308–318. [Google Scholar] [CrossRef]
- Lane, M.M.; Gamage, E.; Du, S.; Ashtree, D.N.; McGuinness, A.J.; Gauci, S.; Baker, P.; Lawrence, M.; Rebholz, C.M.; Srour, B.; et al. Ultra-Processed Food Exposure and Adverse Health Outcomes: Umbrella Review of Epidemiological Meta-Analyses. BMJ 2024, 384, e077310. [Google Scholar] [CrossRef]
- Poti, J.M.; Braga, B.; Qin, B. Ultra-Processed Food Intake and Obesity: What Really Matters for Health—Processing or Nutrient Content? Curr. Obes. Rep. 2017, 6, 420–431. [Google Scholar] [CrossRef] [PubMed]
- Dicken, S.J.; Batterham, R.L. The Role of Diet Quality in Mediating the Association between Ultra-Processed Food Intake, Obesity and Health-Related Outcomes: A Review of Prospective Cohort Studies. Nutrients 2021, 14, 23. [Google Scholar] [CrossRef]
- Valicente, V.M.; Peng, C.-H.; Pacheco, K.N.; Lin, L.; Kielb, E.I.; Dawoodani, E.; Abdollahi, A.; Mattes, R.D. Ultraprocessed Foods and Obesity Risk: A Critical Review of Reported Mechanisms. Adv. Nutr. 2023, 14, 718–738. [Google Scholar] [CrossRef]
- Hall, K.D.; Ayuketah, A.; Brychta, R.; Cai, H.; Cassimatis, T.; Chen, K.Y.; Chung, S.T.; Costa, E.; Courville, A.; Darcey, V.; et al. Ultra-Processed Diets Cause Excess Calorie Intake and Weight Gain: An Inpatient Randomized Controlled Trial of Ad Libitum Food Intake. Cell Metab. 2019, 30, 67–77. [Google Scholar] [CrossRef] [PubMed]
- Forde, C.G.; Mars, M.; de Graaf, K. Ultra-Processing or Oral Processing? A Role for Energy Density and Eating Rate in Moderating Energy Intake from Processed Foods. Curr. Dev. Nutr. 2020, 4, nzaa019. [Google Scholar] [CrossRef] [PubMed]
- Ferriday, D.; Bosworth, M.; Godinot, N.; Martin, N.; Forde, C.G.; Heuvel, E.V.D.; Appleton, S.; Mercer, F.J.; Rogers, P.; Brunstrom, J.M. Variation in the Oral Processing of Everyday Meals Is Associated with Fullness and Meal Size; a Potential Nudge to Reduce Energy Intake? Nutrients 2016, 8, 315. [Google Scholar] [CrossRef]
- McCrickerd, K.; Lim, C.M.; Leong, C.; Chia, E.M.; Forde, C.G. Texture-Based Differences in Eating Rate Reduce the Impact of Increased Energy Density and Large Portions on Meal Size in Adults. J. Nutr. 2017, 147, 1208–1217. [Google Scholar] [CrossRef]
- Giezenaar, C.; Lange, K.; Hausken, T.; Jones, K.L.; Horowitz, M.; Chapman, I.; Soenen, S. Acute Effects of Substitution, and Addition, of Carbohydrates and Fat to Protein on Gastric Emptying, Blood Glucose, Gut Hormones, Appetite, and Energy Intake. Nutrients 2018, 10, 1451. [Google Scholar] [CrossRef]
- Dioneda, B.; Healy, M.; Paul, M.; Sheridan, C.; Mohr, A.E.; Arciero, P.J. A Gluten-Free Meal Produces a Lower Post-prandial Thermogenic Response Compared to an Iso-Energetic/Macronutrient Whole Food or Processed Food Meal in Young Women: A Single-Blind Randomized Cross-over Trial. Nutrients 2020, 12, 2035. [Google Scholar] [CrossRef]
- Calcagno, M.; Kahleova, H.; Alwarith, J.; Burgess, N.N.; Flores, R.A.; Busta, M.L.; Barnard, N.D. The Thermic Effect of Food: A Review. J. Am. Coll. Nutr. 2019, 38, 547–551. [Google Scholar] [CrossRef] [PubMed]
- Mohr, A.E.; Ramos, C.; Tavarez, K.; Arciero, P.J. Lower Post-prandial Thermogenic Response to an Unprocessed Whole Food Meal Compared to an Iso-Energetic/Macronutrient Meal Replacement in Young Women: A Single-Blind Randomized Cross-over Trial. Nutrients 2020, 12, 2469. [Google Scholar] [CrossRef] [PubMed]
- Russo, B.; Menduni, M.; Borboni, P.; Picconi, F.; Frontoni, S. Autonomic Nervous System in Obesity and Insulin-Resistance—The Complex Interplay between Leptin and Central Nervous System. Int. J. Mol. Sci. 2021, 22, 5187. [Google Scholar] [CrossRef]
- Young, H.A.; Benton, D. Heart-Rate Variability: A Biomarker to Study the Influence of Nutrition on Physiological and Psychological Health? Behav. Pharmacol. 2018, 29, 140–151. [Google Scholar] [CrossRef]
- Hamano, S.; Sawada, M.; Aihara, M.; Sakurai, Y.; Sekine, R.; Usami, S.; Kubota, N.; Yamauchi, T. Ultra-Processed Foods Cause Weight Gain and Increased Energy Intake Associated with Reduced Chewing Frequency: A Randomized, Open-Label, Cross-over Study. Diabetes Obes. Metab. 2024, 26, 5431–5443. [Google Scholar] [CrossRef]
- Gibney, M.J.; Forde, C.G.; Mullally, D.; Gibney, E.R. Ultra-Processed Foods in Human Health: A Critical Appraisal. Am. J. Clin. Nutr. 2017, 106, ajcn160440. [Google Scholar] [CrossRef]
- Schulz, K.F.; Altman, D.G.; Moher, D. CONSORT 2010 Statement: Updated Guidelines for Reporting Parallel Group Randomised Trials. BMC Med. 2010, 8, 18. [Google Scholar] [CrossRef]
- Hamada, Y.; Kashima, H.; Hayashi, N. The Number of Chews and Meal Duration Affect Diet-Induced Thermogenesis and Splanchnic Circulation. Obesity 2014, 22, E62–E69. [Google Scholar] [CrossRef] [PubMed]
- Borges, J.H.; Langer, R.D.; Cirolini, V.X.; Páscoa, M.A.; Guerra-Júnior, G.; Gonçalves, E.M. Minimum Time to Achieve the Steady State and Optimum Abbreviated Period to Estimate the Resting Energy Expenditure by Indirect Calorimetry in Healthy Young Adults. Nutr. Clin. Pract. 2016, 31, 349–354. [Google Scholar] [CrossRef] [PubMed]
- Weir, J.B.D.V. New Methods for Calculating Metabolic Rate with Special Reference to Protein Metabolism. J. Physiol. 1949, 109, 1–9. [Google Scholar] [CrossRef] [PubMed]
- Livesey, G.; Elia, M. Estimation of Energy Expenditure, Net Carbohydrate Utilization, and Net Fat Oxidation and Synthesis by Indirect Calorimetry: Evaluation of Errors with Special Reference to the Detailed Composition of Fuels. Am. J. Clin. Nutr. 1988, 47, 608–628. [Google Scholar] [CrossRef] [PubMed]
- Pereira, R.D.A.; Alves, J.L.D.B.; Silva, J.H.D.C.; Costa, M.D.S.; Silva, A.S. Validity of a Smartphone Application and Chest Strap for Recording RR Intervals at Rest in Athletes. Int. J. Sports Physiol. Perform. 2020, 15, 896–899. [Google Scholar] [CrossRef] [PubMed]
- Vanderlei, L.C.M.; Pastre, C.M.; Hoshi, R.A.; Carvalho, T.D.D.; Godoy, M.F. de Noções Básicas de Variabilidade Da Frequência Cardíaca E Sua Aplicabilidade Clínica. Rev. Bras. Cir. Cardiovasc. 2009, 24, 205–217. [Google Scholar] [CrossRef] [PubMed]
- Shaffer, F.; Ginsberg, J.P. An Overview of Heart Rate Variability Metrics and Norms. Front. Public Health 2017, 5, 258. [Google Scholar] [CrossRef]
- Mansour, M.S.; Ni, Y.-M.; Roberts, A.L.; Kelleman, M.; RoyChoudhury, A.; St-Onge, M.-P. Ginger Consumption Enhances the Thermic Effect of Food and Promotes Feelings of Satiety without Affecting Metabolic and Hormonal Parameters in Overweight Men: A Pilot Study. Metabolism 2012, 61, 1347–1352. [Google Scholar] [CrossRef]
- Naufel, M.F.; Pedroso, A.P.; Oyama, L.M.; Telles, M.M.; Hachul, H.; Ribeiro, E. Preliminary Evidence of Acylated Ghrelin Association with Depression Severity in Postmenopausal Women. Sci. Rep. 2021, 11, 5319. [Google Scholar] [CrossRef]
- Matthews, D.R.; Hosker, J.P.; Rudenski, A.S.; Naylor, B.A.; Treacher, D.F.; Turner, R.C. Homeostasis Model Assessment: Insulin Resistance and ?-Cell Function from Fasting Plasma Glucose and Insulin Concentrations in Man. Diabetologia 1985, 28, 412–419. [Google Scholar] [CrossRef] [PubMed]
- Associação Brasileira de Empresas de Pesquisa—ABEP. Critério de Classificação Econômica Brasil—CCEB. 2022. Available online: https://www.abep.org/criterio-brasil (accessed on 1 November 2022).
- Gibney, M.J. Ultra-Processed Foods: Definitions and Policy Issues. Curr. Dev. Nutr. 2018, 3, nzy077. [Google Scholar] [CrossRef]
- Braesco, V.; Souchon, I.; Sauvant, P.; Haurogné, T.; Maillot, M.; Féart, C.; Darmon, N. Ultra-Processed Foods: How Functional Is the NOVA System? Eur. J. Clin. Nutr. 2022, 76, 1245–1253. [Google Scholar] [CrossRef] [PubMed]
- Sadler, C.R.; Grassby, T.; Hart, K.; Raats, M.; Sokolović, M.; Timotijevic, L. Processed Food Classification: Conceptualisation and Challenges. Trends Food Sci. Technol. 2021, 112, 149–162. [Google Scholar] [CrossRef]
- McRorie, J.W. Evidence-Based Approach to Fiber Supplements and Clinically Meaningful Health Benefits, Part 1. Nutr. Today 2015, 50, 82–89. [Google Scholar] [CrossRef]
- Pražnikar, Z.J.; Mohorko, N.; Gmajner, D.; Kenig, S.; Petelin, A. Effects of Four Different Dietary Fibre Supplements on Weight Loss and Lipid and Glucose Serum Profiles during Energy Restriction in Patients with Traits of Metabolic Syndrome: A Comparative, Randomized, Placebo-Controlled Study. Foods 2023, 12, 2122. [Google Scholar] [CrossRef] [PubMed]
- Teo, P.S.; Lim, A.J.; Goh, A.T.; Janani, R.; Choy, J.Y.M.; McCrickerd, K.; Forde, C.G. Texture-Based Differences in Eating Rate Influence Energy Intake for Minimally Processed and Ultra-Processed Meals. Am. J. Clin. Nutr. 2022, 116, 244–254. [Google Scholar] [CrossRef] [PubMed]
- Miquel-Kergoat, S.; Azais-Braesco, V.; Burton-Freeman, B.; Hetherington, M.M. Effects of Chewing on Appetite, Food Intake and Gut Hormones: A Systematic Review and Meta-Analysis. Physiol. Behav. 2015, 151, 88–96. [Google Scholar] [CrossRef]
- Dicken, S.J.; Batterham, R.L. Ultra-Processed Food and Obesity: What Is the Evidence? Curr. Nutr. Rep. 2024, 13, 23–38. [Google Scholar] [CrossRef] [PubMed]
- Heindel, J.J.; Lustig, R.H.; Howard, S.; Corkey, B.E. Obesogens: A Unifying Theory for the Global Rise in Obesity. Int. J. Obes. 2024, 48, 449–460. [Google Scholar] [CrossRef] [PubMed]
- Torrico, D.D.; Fuentes, S.; Viejo, C.G.; Ashman, H.; Dunshea, F.R. Cross-Cultural Effects of Food Product Familiarity on Sensory Acceptability and Non-Invasive Physiological Responses of Consumers. Food Res. Int. 2019, 115, 439–450. [Google Scholar] [CrossRef] [PubMed]
- Barr, S.; Wright, J. Post-prandial Energy Expenditure in Whole-Food and Processed-Food Meals: Implications for Daily Energy Expenditure. Food Nutr. Res. 2010, 54, 5144. [Google Scholar] [CrossRef]
- Quatela, A.; Callister, R.; Patterson, A.; MacDonald-Wicks, L. The Energy Content and Composition of Meals Consumed after an Overnight Fast and Their Effects on Diet Induced Thermogenesis: A Systematic Review, Meta-Analyses and Meta-Regressions. Nutrients 2016, 8, 670. [Google Scholar] [CrossRef] [PubMed]
- Sauder, K.A.; Johnston, E.R.; Skulas-Ray, A.C.; Campbell, T.S.; West, S.G. Effect of Meal Content on Heart Rate Variability and Cardiovascular Reactivity to Mental Stress. Psychophysiology 2012, 49, 470–477. [Google Scholar] [CrossRef]
- Tentolouris, N.; Tsigos, C.; Perea, D.; Koukou, E.; Kyriaki, D.; Kitsou, E.; Daskas, S.; Daifotis, Z.; Makrilakis, K.; Raptis, S.A.; et al. Differential Effects of High-Fat and High-Carbohydrate Isoenergetic Meals on Cardiac Autonomic Nervous System Activity in Lean and Obese Women. Metabolism 2003, 52, 1426–1432. [Google Scholar] [CrossRef] [PubMed]
- Dikariyanto, V.; Smith, L.; Chowienczyk, P.J.; Berry, S.E.; Hall, W.L. Snacking on Whole Almonds for Six Weeks Increases Heart Rate Variability during Mental Stress in Healthy Adults: A Randomized Controlled Trial. Nutrients 2020, 12, 1828. [Google Scholar] [CrossRef] [PubMed]
- Åberg, S.; Mann, J.; Neumann, S.; Ross, A.B.; Reynolds, A.N. Whole-Grain Processing and Glycemic Control in Type 2 Diabetes: A Randomized Cross-over Trial. Diabetes Care 2020, 43, 1717–1723. [Google Scholar] [CrossRef] [PubMed]
- Iglesias, M.J.; Eiras, S.; Piñeiro, R.; López-Otero, D.; Gallego, R.; Fernández, Á.L.; Lago, F.; González-Juanatey, J.R. Gender Differences in Adiponectin and Leptin Expression in Epicardial and Subcutaneous Adipose Tissue. Findings in Patients Undergoing Cardiac Surgery. Rev. Esp. Cardiol. Engl. Ed. 2006, 59, 1252–1260. [Google Scholar] [CrossRef]
- Dagogo-Jack, S.; Fanelli, C.; Paramore, D.; Brothers, J.; Landt, M. Plasma Leptin and Insulin Relationships in Obese and Nonobese Humans. Diabetes 1996, 45, 695–698. [Google Scholar] [CrossRef] [PubMed]
- Korek, E.; Krauss, H.; Gibas-Dorna, M.; Kupsz, J.; Piątek, M.; Piątek, J. Fasting and Post-prandial Levels of Ghrelin, Leptin and Insulin in Lean, Obese and Anorexic Subjects. Gastroenterol. Rev. 2013, 6, 383–389. [Google Scholar] [CrossRef]
- Larsen, M.A.; Isaksen, V.T.; Paulssen, E.J.; Goll, R.; Florholmen, J. Postprandial Leptin and Adiponectin in Response to Sugar and Fat in Obese and Normal Weight Individuals. Endocrine 2019, 66, 517–525. [Google Scholar] [CrossRef] [PubMed]

| UPF Meal | Control Meal | |||||||||||||
|---|---|---|---|---|---|---|---|---|---|---|---|---|---|---|
| Bauducco® Traditional Toast (Guarulhos, SP, Brazil) (04 units)—30 g | Regular bakery bread toast (01 unit)—50 g | |||||||||||||
| Polenghi® dish cheese (Angatuba, SP, Brazil) (03 fts)—54 g | Chicken egg (02 units)—100 g | |||||||||||||
| Perdigão® Ham (Marau, RS, Brazil) (2.5 fts)—50 g | Soybean vegetable oil (01 teaspoon)—5 mL | |||||||||||||
| Purifruti® Strawberry Jelly (Itupeva, SP, Brazil) (02 tablespoons)—40 g | Refined salt (01 coffeespoon)—2 g | |||||||||||||
| Primor® Margarine (Ipojuca, PE, Brazil) (01 dessertspoon)—15 g | Extra virgin olive oil (01 tablespoon)—8 mL | |||||||||||||
| Maratá® guava juice (Estância, SE, Brazil) (01 glass)—200 mL | Guava pulp juice (1 glass)—200 mL | |||||||||||||
| Nestlé® FiberMais fiber module (Araras, SP, Brazil) (1 tablespoon)—9 g | Bee honey (01 tablespoon)—20 g | |||||||||||||
| Meal | KCAL | ED (kcal/g) | PTN (g) | PTN (%) | CHO (g) | CHO (%) | LIP (g) | LIP (%) | Fiber (g) | Na (mg) | UPF (%) | P (%) | CI (%) | INMP (%) |
| UPF | 557 | 1.40 | 18.4 | 13.2 | 71.3 | 51.2 | 21.9 | 35.4 | 8.5 | 1493 | 100.0 | 0.0 | 0.0 | 0.0 |
| No UPF | 559 | 1.45 | 18.7 | 13.4 | 70.6 | 50.5 | 22.1 | 35.5 | 8.5 | 1267 | 0.0 | 26.8 | 31.5 | 41.7 |
| Variable | Groups | p-Value a | |||
|---|---|---|---|---|---|
| UPF Meal (n = 22) | Control Meal (n = 20) | ||||
| n | % | n | % | ||
| Women | 14 | 63.6 | 16 | 80 | 0.31 |
| Race/skin color | 0.65 | ||||
| White | 7 | 31.8 | 5 | 25 | |
| Black | 1 | 4.5 | 3 | 15 | |
| Brown | 14 | 63.6 | 12 | 60 | |
| Alcoholic | 10 | 45.5 | 9 | 45 | 0.99 |
| Education | 0.75 | ||||
| Full medium | 14 | 63.6 | 14 | 70 | |
| Graduated | 8 | 36.4 | 6 | 30 | |
| Economic class | 0.47 | ||||
| A/B1/B2 | 8 | 36.4 | 6 | 30 | |
| C1/C2 | 11 | 50 | 14 | 70 | |
| DE | 3 | 13.6 | 0 | 0 | |
| Mean | SD | Mean | SD | ||
| Age (years) | 28.6 | 6.71 | 29.9 | 7.91 | 0.55 |
| Height (m) | 1.68 | 0.09 | 1.64 | 0.11 | 0.15 |
| Weight (kg) | 89.9 | 16.36 | 82.1 | 15.42 | 0.12 |
| BMI (kg/m2) | 31.6 | 3.82 | 30.4 | 3.44 | 0.30 |
| CC (cm) | 97.2 | 10.24 | 92.9 | 12.87 | 0.23 |
| Fat mass (%) | 39.7 | 6.11 | 41.4 | 6.46 | 0.37 |
| UPF Meal (n = 22) | Control Meal (n = 20) | ||||
|---|---|---|---|---|---|
| SD | SD | p-Value a | |||
| Consumption time (min:s) | 07:52 | 3:00 | 11:07 | 03:16 | <0.01 |
| Grams consumed/min | 29.98 | 14.82 | 18.27 | 14.74 | <0.01 |
| Milliliters consumed/min | 30.08 | 5.56 | 19.58 | 6.01 | <0.01 |
| Calories consumed/min (solids) | 70.47 | 34.84 | 46.83 | 14.25 | <0.01 |
| Calories consumed/min (liquids) | 13.77 | 6.83 | 8.39 | 2.58 | <0.01 |
| Number of bites | 27.32 | 9.68 | 42.65 | 11.54 | <0.01 |
| Number of chews | 424.07 | 148.50 | 587.80 | 152.89 | <0.01 |
| Pleasure (mm) | 67.18 | 27.07 | 74.85 | 35.38 | 0.43 |
| Familiarity (mm) | 38.18 | 34.07 | 80.30 | 30.90 | <0.01 |
| Fast | 5 min | 90 min | ||||||||
|---|---|---|---|---|---|---|---|---|---|---|
| UPF Meal | Control Meal | UPF Meal | Control Meal | UPF Meal | Control Meal | |||||
| ± SD | ± SD | p-Value a | ± SD | ± SD | p-Value a | ± SD | ± SD | p-Value a | ANOVA b | |
| Hunger (mm) | 43.55 ± 30.34 | 44.45 ± 26.47 | 0.91 | 6.95 ± 8.82 | 2.85 ± 5.25 | 0.07 | 25.86 ± 25.24 | 15.00 ± 17.16 | 0.10 | 0.30 |
| Fullness (mm) | 19.55 ± 17.02 | 25.25 ± 18.64 | 0.30 | 76.77 ± 17.51 | 80.50 ± 26.36 | 0.58 | 54.82 ± 25.71 | 67.20 ± 29.53 | 0.15 | 0.59 |
| Satisfaction (mm) | 48.00 ± 30.57 | 54.85 ± 27.86 | 0.45 | 8.23 ± 14.41 | 10.25 ± 23.14 | 0.73 | 27.77 ± 24.69 | 25.35 ± 30.00 | 0.77 | 0.64 |
| Capacity to eat (mm) | 57.86 ± 28.18 | 57.80 ± 22.60 | 0.99 | 22.86 ± 24.68 | 10.95 ± 14.23 | 0.06 | 39.68 ± 22.69 | 23.95 ± 18.92 | 0.02 | 0.09 |
| Capacity to eat (log) | 3.91 ± 0.61 | 3.97 ± 0.45 | 0.69 | 2.29 ± 1.54 | 1.39 ± 1.53 | 0.06 | 3.39 ± 0.94 | 2.77 ± 1.08 | 0.05 | 0.04 |
| Fasting | Post-Prandial | p-Value | |||||
|---|---|---|---|---|---|---|---|
| Mean | CI 95% | Mean | CI 95% | Time 1 | Time × Group 2 | ||
| EE | Control | 1657 | 1437; 1877 | 1906 | 1671; 2140 | <0.01 | 0.21 |
| (kcal) | UPF | 1882 | 1662; 2101 | 2207 | 1973; 2442 | ||
| Glucose | Control | 78.6 | 75.1; 82.2 | 84.6 | 79.2; 90.1 | 0.03 | 0.26 |
| (mg/dL) | UPF | 81.0 | 77.5; 84.5 | 82.9 a | 77.4; 88.4 | ||
| Insulin | Control | 9.15 | 7.54; 10.77 | 29.68 | 20.76; 38.60 | <0.01 | 0.57 |
| (uUI/mL) | UPF | 8.37 | 6.75; 9.99 | 32.13 b | 23.21; 41.05 | ||
| HOMA-IR | Control | 0.98 | 0.81; 1.16 | 3.13 | 2.21; 4.05 | <0.01 | 0.57 |
| UPF | 0.91 | 0.73; 1.08 | 3.38 | 2.46; 4.30 | |||
| Ghrelin (pg/mL) 3 | Control | 84.6 | 59.2; 112.3 | 9.0 | 5.7; 12.9 | <0.01 | 0.67 |
| UPF | 81.1 | 57.9; 108.5 | 10.3 | 6.9; 14.5 | |||
| Leptin (pg/mL) 3 | Control | 16.1 | 11.5; 22.1 | 7.8 | 5.3; 11.3 | <0.01 | 0.21 |
| UPF | 15.4 | 11.2; 21.1 | 8.8 | 6.2; 12.6 | |||
| GIP (pg/mL) 3 | Control | 48.9 | 35.5; 66.6 | 287.1 | 223.6; 368.7 | <0.01 | 0.86 |
| UPF | 57.9 | 42.5; 78.2 | 330.2 | 259.8; 424.1 | |||
| Fasting | 5–15 min | 35–45 min | 65–75 min | ||||||||||
|---|---|---|---|---|---|---|---|---|---|---|---|---|---|
| UPF Meal | Control Meal | p-Value a | UPF Meal | Control Meal | p-Value a | UPF Meal | Control Meal | p-Value a | UPF Meal | Control Meal | p-Value a | ANOVAb | |
| ± SD | ± SD | ± SD | ± SD | ± SD | ± SD | ± SD | ± SD | ||||||
| rMSSD (ms) | 55.32 ± 33.90 | 43.06 ± 27.74 | 0.21 | 50.74 ± 32.89 | 35.47 ± 22.29 | 0.08 | 43.94 ± 24.60 | 40.89 ± 29.56 | 0.71 | 51.61 ± 40.13 | 38.21 ± 22.84 | 0.19 | 0.29 |
| LF/HF | 0.95 ± 0.91 | 1.48 ± 1.50 | 0.17 | 2.06 ± 1.97 | 2.20 ± 2.06 | 0.83 | 1.63 ± 1.34 | 2.17 ± 2.44 | 0.37 | 1.73 ± 1.47 | 1.96 ± 1.62 | 0.63 | 0.78 |
| SD2/SD1 | 1.57 ± 0.51 | 1.95 ± 0.74 | 0.05 | 1.76 ± 0.57 | 2.17 ± 0.78 | 0.06 | 1.81 ± 0.64 | 2.20 ± 0.88 | 0.10 | 1.75 ± 0.64 | 1.99 ± 0.68 | 0.23 | 0.55 |
Disclaimer/Publisher’s Note: The statements, opinions and data contained in all publications are solely those of the individual author(s) and contributor(s) and not of MDPI and/or the editor(s). MDPI and/or the editor(s) disclaim responsibility for any injury to people or property resulting from any ideas, methods, instructions or products referred to in the content. |
© 2024 by the authors. Licensee MDPI, Basel, Switzerland. This article is an open access article distributed under the terms and conditions of the Creative Commons Attribution (CC BY) license (https://creativecommons.org/licenses/by/4.0/).
Share and Cite
Galdino-Silva, M.B.; Almeida, K.M.M.; Oliveira, A.D.S.d.; Santos, J.V.L.d.; Macena, M.d.L.; Silva, D.R.; Pereira, M.R.; Silva-Júnior, A.E.; Ferro, D.C.; Paula, D.T.d.C.; et al. A Meal with Ultra-Processed Foods Leads to a Faster Rate of Intake and to a Lesser Decrease in the Capacity to Eat When Compared to a Similar, Matched Meal Without Ultra-Processed Foods. Nutrients 2024, 16, 4398. https://doi.org/10.3390/nu16244398
Galdino-Silva MB, Almeida KMM, Oliveira ADSd, Santos JVLd, Macena MdL, Silva DR, Pereira MR, Silva-Júnior AE, Ferro DC, Paula DTdC, et al. A Meal with Ultra-Processed Foods Leads to a Faster Rate of Intake and to a Lesser Decrease in the Capacity to Eat When Compared to a Similar, Matched Meal Without Ultra-Processed Foods. Nutrients. 2024; 16(24):4398. https://doi.org/10.3390/nu16244398
Chicago/Turabian StyleGaldino-Silva, Maria Bárbara, Karine Maria Moreira Almeida, Ana Debora Santos de Oliveira, João Victor Laurindo dos Santos, Mateus de Lima Macena, Dafiny Rodrigues Silva, Micnéias Roberth Pereira, André Eduardo Silva-Júnior, Débora Cavalcante Ferro, Déborah Tenório da Costa Paula, and et al. 2024. "A Meal with Ultra-Processed Foods Leads to a Faster Rate of Intake and to a Lesser Decrease in the Capacity to Eat When Compared to a Similar, Matched Meal Without Ultra-Processed Foods" Nutrients 16, no. 24: 4398. https://doi.org/10.3390/nu16244398
APA StyleGaldino-Silva, M. B., Almeida, K. M. M., Oliveira, A. D. S. d., Santos, J. V. L. d., Macena, M. d. L., Silva, D. R., Pereira, M. R., Silva-Júnior, A. E., Ferro, D. C., Paula, D. T. d. C., Carvalho, G. C. d. O., Rocha, M. V. C., Silva, J. P. d., Barreto, E. d. O., & Bueno, N. B. (2024). A Meal with Ultra-Processed Foods Leads to a Faster Rate of Intake and to a Lesser Decrease in the Capacity to Eat When Compared to a Similar, Matched Meal Without Ultra-Processed Foods. Nutrients, 16(24), 4398. https://doi.org/10.3390/nu16244398