
Diet Inflammatory Index among Regularly Physically Active Young Women and Men


Abstract
1. Introduction
2. Materials and Methods
2.1. Subjects
2.2. Anthropometric Measurements
2.3. Dietary Assessment
2.4. Dietary Inflammatory Index
2.5. Statistical Analysis
3. Results
4. Discussion
5. Conclusions
Author Contributions
Funding
Institutional Review Board Statement
Informed Consent Statement
Data Availability Statement
Conflicts of Interest
References
- Wickramasinghe, K.; Mathers, J.C.; Wopereis, S.; Marsman, D.S.; Griffiths, J.C. From lifespan to healthspan: The role of nutrition in healthy ageing. J. Nutr. Sci. 2020, 9, e33. [Google Scholar] [CrossRef] [PubMed]
- Desmond, M.A.; Sobiecki, J.G.; Jaworski, M.; Płudowski, P.; Antoniewicz, J.; Shirley, M.K.; Eaton, S.; Książyk, J.; Cortina-Borja, M.; De Stavola, B.; et al. Growth, body composition, and cardiovascular and nutritional risk of 5- to 10-y-old children consuming vegetarian, vegan, or omnivore diets. Am. J. Clin. Nutr. 2021, 113, 1565–1577. [Google Scholar] [CrossRef] [PubMed]
- GBD 2016 Causes of Death Collaborators. Global, regional, and national age-sex specific mortality for 264 causes of death, 1980–2016: A systematic analysis for the global burden of Disease Study 2016. Lancet 2017, 390, 1151–1210. [Google Scholar] [CrossRef] [PubMed]
- NCD Risk Factor Collaboration (NCD-RisC) Worldwide trends in body-mass index, underweight, overweight, and obesity from 1975 to 2016: A pooled analysis of 2416 population-based measurement studies in 128·9 million children, adolescents, and adults. Lancet 2017, 390, 2627–2642. [CrossRef] [PubMed]
- Krakauer, N.Y.; Krakauer, J.C. Diet composition, anthropometrics, and mortality risk. Int. J. Environ. Res. Public Health 2022, 19, 12885. [Google Scholar] [CrossRef] [PubMed]
- Wirth, M.D.; Shivappa, N.; Davis, L.; Hurley, T.G.; Ortaglia, A.; Drayton, R.; Blair, S.N.; Hébert, J.R. Construct validation of the Dietary Inflammatory Index among African Americans. J. Nutr. Health Aging 2017, 21, 487–491. [Google Scholar] [CrossRef] [PubMed]
- Marx, W.; Veronese, N.; Kelly, J.T.; Smith, L.; Hockey, M.; Collins, S.; Trakman, G.L.; Hoare, E.; Teasdale, S.B.; Wade, A.; et al. The Dietary Inflammatory Index and human health: An umbrella review of meta-analyses of observational studies. Adv. Nutr. 2021, 12, 1681–1690. [Google Scholar] [CrossRef]
- Shivappa, N.; Steck, S.E.; Hurley, T.; Hussey, J.R.; Hébert, J.R. Designing and developing a literature-derived, population-based dietary inflammatory index. Public Health Nutr. 2014, 17, 1689–1696. [Google Scholar] [CrossRef]
- Visseren, F.L.; Mach, F.; Smulders, Y.M.; Carballo, D.; Koskinas, K.C.; Bäck, M.; Benetos, A.; Biffi, A.; Boavida, J.M.; Capodanno, D.; et al. 2021 ESC Guidelines on cardiovascular disease prevention in clinical practice: Developed by the Task Force for cardiovascular disease prevention in clinical practice with representatives of the European Society of Cardiology and 12 medical societies With the special contribution of the European Association of Preventive Cardiology (EAPC). Eur. J. Prev. Cardiol. 2022, 29, 5–115. [Google Scholar]
- Piccand, E.; Vollenweider, P.; Guessous, I.; Marques-Vidal, P. Association between dietary intake and inflammatory markers: Results from the CoLaus study. Public Health Nutr. 2019, 22, 498–505. [Google Scholar] [CrossRef]
- Cavicchia, P.P.; Steck, S.E.; Hurley, T.G.; Hussey, J.R.; Ma, Y.; Ockene, I.S.; Hebert, J.R. A new dietary inflammatory index predicts interval changes in high-sensitivity C-reactive protein. J. Nutr. 2009, 139, 2365–2372. [Google Scholar] [CrossRef] [PubMed]
- Corley, J.; Shivappa, N.; Hébert, J.R.; Starr, J.M.; Deary, I.J. Associations between dietary inflammatory index scores and inflammatory biomarkers among older adults in the Lothian birth cohort 1936 study. J. Nutr. Health Aging 2019, 23, 628–636. [Google Scholar] [CrossRef] [PubMed]
- Li, Y.; Fan, X.; Wei, L.; Yang, K.; Jiao, M. The impact of high-risk lifestyle factors on allcause mortality in the US non-communicable disease population. BMC Public Health 2023, 23, 422. [Google Scholar]
- Haß, U.; Herpich, C.; Kochlik, B.; Weber, D.; Grune, T.; Norman, K. Dietary Inflammatory Index and cross-sectional associations with inflammation, muscle mass and function in healthy old adults. J. Nutr. Health Aging 2022, 26, 346–351. [Google Scholar] [CrossRef] [PubMed]
- Jin, M.; Bok, M.; Rho, H.; Chon, J.; Lim, H. A pro-inflammatory diet increases the risk of sarcopenia components and inflammatory biomarkers in postmenopausal women. Nutr. Res. 2022, 107, 195–205. [Google Scholar] [CrossRef]
- Phillips, C.M.; Chen, L.; Heude, B.; Bernard, J.H.; Harvey, N.C.; Duijts, L.; Mensink-Bout, S.M.; Polanska, K.; Mancano, G.; Suderman, M.; et al. Dietary Inflammatory Index and non-communicable disease risk: A narrative review. Nutrients 2019, 11, 1873. [Google Scholar] [CrossRef]
- Malara, M.; Tkaczyk, J.; Kęska, A.; Lutosławska, G.; Mazurek, K. Calcium, magnesium and phosphorus dietary intake in active and sedentary Polish students. Biomed. Human Kinet. 2017, 9, 140–145. [Google Scholar] [CrossRef][Green Version]
- Lambert, V.; Carbuhn, A.; Culp, A.; Ketterly, J.; Twombley, B.; White, D. Interassociation Consensus Statement on Sports Nutrition Models for the Provision of Nutrition Services from Registered Dietitian Nutritionists in Collegiate Athletics. J. Athl. Train. 2022, 57, 717–732. [Google Scholar] [CrossRef]
- Hector, A.J.; Phillips, S.M. Protein recommendations for weight loss in elite athletes: A focus on body composition and performance. Int. J. Sport Nutr. Exerc. Metab. 2018, 28, 170–177. [Google Scholar] [CrossRef]
- Abe, T.; Kawamoto, K.; Dankel, S.J.; Bell, Z.W.; Spitz, R.W.; Wong, V.; Loenneke, J.P. Longitudinal associations between changes in body composition and changes in sprint performance in elite female sprinters. Eur. J. Sport Sci. 2020, 20, 100–105. [Google Scholar] [CrossRef]
- ACE. What Are the Guidelines for Percentage of Body Fat Loss? American Council on Exercise (ACE). 2009. Available online: https://www.acefitness.org/education-and-resources/lifestyle/blog/112/what-are-the-guidelines-for-percentage-of-body-fat-loss (accessed on 29 April 2022).
- Durnin, J.V.; Womersley, J. Body fat assessed from total body density and its estimation from skinfold thickness: Measurements of 481 males and females aged from 16 to 72 years. Br. J. Nutr. 1974, 32, 77–97. [Google Scholar] [CrossRef] [PubMed]
- Shivappa, N.; Steck, S.E.; Hurley, T.G.; Hussey, J.R.; Ma, Y.; Ockene, I.S.; Tabung, F.; Hébert, J.R. A population-based dietary inflammatory index predicts levels of C-reactive protein in the Seasonal Variation of Blood Cholesterol Study (SEASONS). Public Health Nutr. 2013, 17, 1825–1833. [Google Scholar] [CrossRef] [PubMed]
- Turner-McGrievy, G.; Wirth, M.D.; Hill, K.L.; Dear, E.R.; Hébert, J.R. Examining commonalities and differences in food groups, nutrients, and diet quality among popular diets. Clin. Nutr. ESPEN 2021, 41, 377–385. [Google Scholar] [CrossRef] [PubMed]
- Jagielski, P.; Łuszczki, E.; Wnęk, D.; Micek, A.; Bolesławska, I.; Piórecka, B.; Kawalec, P. Associations of nutritional behavior and gut microbiota with the risk of COVID-19 in healthy young adults in Poland. Nutrients 2022, 14, 350. [Google Scholar] [CrossRef] [PubMed]
- Kopiczko, A.; Bieńko, N.; Cieplińska, J.; Stecka, A. Zawartość wapnia i witaminy D w całodziennych racjach pokarmowych studentów z uwzględnieniem suplementacji. Żyw. Człow. Metab. 2017, 1, 50–60. [Google Scholar]
- Sprake, E.F.; Russell, J.M.; Cecil, J.E.; Cooper, R.J.; Grabowski, P.; Pourshahidi, L.K.; Barker, M.E. Dietary patterns of university students in the UK: A cross-sectional study. Nutr. J. 2018, 17, 90. [Google Scholar] [CrossRef] [PubMed]
- Suwalska, J.; Kolasińska, K.; Łojko, D.; Bogdański, P. Eating behaviors, depressive symptoms and lifestyle in university students in Poland. Nutrients 2022, 14, 1106. [Google Scholar] [CrossRef] [PubMed]
- Tanaka, C.; Reilly, J.J.; Tanaka, M.; Tanaka, S. Changes in weight, sedentary behaviour and physical activity during the school year and summer vacation. Int. J. Environ. Res. Public Health 2018, 15, 915. [Google Scholar] [CrossRef]
- Zhuang, Z.; Gao, M.; Yang, R.; Li, N.; Liu, Z.; Cao, W.; Huang, T. Association of physical activity, sedentary behaviours and sleep duration with cardiovascular diseases and lipid profiles: A Mendelian randomization analysis. Lipids Health Dis. 2020, 19, 86. [Google Scholar] [CrossRef]
- Kęska, A.; Lutosławska, G.; Mazurek, K.; Czajkowska, A.; Tkaczyk, J.; Iwańska, D. Changes in anthropometry and selected metabolic parameters in young men during their first year of study at a university of physical education. Am. J. Men’s Health 2018, 12, 463–471. [Google Scholar] [CrossRef]
- Powers, S.K.; Deminice, R.; Ozdemir, M.; Yoshihara, T.; Bomkamp, M.P.; Hyatt, H. Exercise-induced oxidative stress: Friend or foe? J. Sport Health Sci. 2020, 9, 415–425. [Google Scholar] [CrossRef] [PubMed]
- Navarro-Ibarra, M.J.; Hernández, J.; Caire-Juvera, G. Diet, physical activity and telomere length in adults. Nutr. Hosp. 2019, 36, 1403–1417. [Google Scholar] [PubMed]
- Dhuli, K.; Naureen, Z.; Medori, M.C.; Fioretti, F.; Caruso, P.; Perrone, M.A.; Nodari, S.; Manganotti, P.; Xhufi, S.; Bushati, M.; et al. Physical activity for health. J. Prev. Med. Hyg. 2022, 63 (Suppl. 3), E150–E159. [Google Scholar] [PubMed]
- Papageorgiou, M.; Dolan, E.; Elliott-Sale, K.J.; Sale, C. Reduced energy availability: Implications for bone health in physically active populations. Eur. J. Nutr. 2018, 57, 847–859. [Google Scholar] [CrossRef] [PubMed]
- Popp, K.L.; Cooke, L.M.; Bouxsein, M.L.; Hughes, J.M. Impact of low energy availability on skeletal health in physically active adults. Calcif. Tissue Int. 2022, 110, 605–614. [Google Scholar] [CrossRef] [PubMed]
- Jarosz, M.; Rychlik, E.; Stoś, K.; Charzewska, J. (Eds.) Nutrition Standards for the Polish Population and Their Applied; PZH: Warszawa, Poland, 2020. (In Polish) [Google Scholar]
- Mountjoy, M.; Ackerman, K.E.; Bailey, D.M.; Burke, L.M.; Constantini, N.; Hackney, A.C.; Heikura, I.A.; Melin, A.; Pensgaard, A.M.; Stellingwerff, T.; et al. 2023 International Olympic Committee’s (IOC) consensus statement on Relative Energy Deficiency in Sport (REDs). Br. J. Sports Med. 2023, 57, 1073–1097. [Google Scholar] [CrossRef]
- Thomas, D.T.; Erdman, K.A.; Burke, L.M. Position of the Academy of Nutrition and Dietetics, Dietitians of Canada, and the American College of Sports Medicine: Nutrition and Athletic Performance. J. Acad. Nutr. Diet. 2016, 116, 501–528. [Google Scholar] [CrossRef]
- Soliman, G.A. Dietary cholesterol and the lack of evidence in cardiovascular disease. Nutrients 2018, 10, 780. [Google Scholar] [CrossRef]
- Jontony, N.; Hill, E.B.; Taylor, C.A.; Boucher, L.C.; O’Brien, V.; Weiss, R.; Spees, C.K. Diet quality, carotenoid status, and body composition in NCAA Division I athletes. Am. J. Health Behav. 2020, 44, 432–443. [Google Scholar] [CrossRef]
- Isola, V.; Hulmi, J.J.; Petäjä, P.; Helms, E.R.; Karppinen, J.E.; Ahtiainen, J.P. Weight loss induces changes in adaptive thermogenesis in female and male physique athletes. Appl. Physiol. Nutr. Metab. 2023, 48, 307–320. [Google Scholar] [CrossRef]
- Seo, Y.G.; Song, H.J.; Song, Y.R. Fat-to-muscle ratio as a predictor of insulin resistance and metabolic syndrome in Korean adults. J. Cachexia Sarcopenia Muscle 2020, 11, 710–725. [Google Scholar] [CrossRef] [PubMed]
- da Silva Rosa, S.C.; Nayak, N.; Caymo, A.M.; Gordon, J.W. Mechanisms of muscle insulin resistance and the cross-talk with liver and adipose tissue. Physiol. Rep. 2020, 8, e14607. [Google Scholar] [CrossRef] [PubMed]


| Female Students (n = 151) | Male Students (n = 141) | |
|---|---|---|
| DII (min; max) | (−2.60; 4.36) | (−3.39; 4.23) |
| Age (years) | 19.7 ± 1.12 | 22.1 ± 1.60 |
| Height (cm) | 165.5 ± 4.03 a | 181.1 ± 6.08 |
| Body mass (kg) | 57.2 ± 4.71 a | 77.8 ± 6.70 |
| BMI * | 20.9 ± 1.01 a | 23.7 ± 1.68 |
| Body fat% | 22.0 ± 1.90 a | 13.9 ± 2.05 |
| Body fat (kg) | 12.7 ± 2.01 a | 10.9 ± 2.05 |
| LBM ^ (kg) | 44.8 ± 3.90 a | 66.9 ± 5.45 |
| Q1 (n = 38) Most Anti-Inflammatory Diet | Q2–Q3 (n = 75) | Q4 (n = 38) Most Pro-Inflammatory Diet | |
|---|---|---|---|
| DII (min; max) | (−2.60; 1.02) | (1.18; 3.29) | (3.30; 4.36) |
| Energy (kcal) | 2221.0 ± 718.94 a,b | 1669.3 ± 382.08 | 1463.0 ± 417.65 |
| Protein (g) | 73.8 ± 21.91 a,b | 58.1 ± 14.19 | 51.8 ± 14.27 |
| Fat (g) | 88.9 ± 39.90 c | 66,0 ± 20.95 | 58.7 ± 21.94 |
| Carbohydrates (g) | 305.5 ± 87.77 a,b | 220.6 ± 54.04 | 190.7 ± 62.71 |
| Magnesium (mg) | 340.3 ± 218.61 a,b | 246.3 ± 278.02 d | 180.0 ± 41.78 |
| Iron (mg) | 12.2 ± 3.24 a,b | 8.8 ± 1.85 d | 7.2 ± 2.03 |
| Zinc (mg) | 10.3 ± 3.08 a,b | 7.6 ± 1.72 d | 6.6 ± 1.61 |
| Vitamin A (µg) | 1315.8 ± 650.80 a,b | 593.4 ± 251.42 d | 447.4 ± 176.11 |
| Beta carotene (µg) | 5421.9 ± 3988.44 a,b | 1686.1 ± 1333.94 d | 833.0 ± 447.35 |
| Vitamin E (mg) | 13.6 ± 6.23 e,b | 9.8 ± 3.33 b | 6.7 ± 3.28 |
| Thiamine (mg) | 1.16 ± 0.37 a,b | 0.83 ± 0.39 b | 0.58 ± 0.16 |
| Riboflavin (mg) | 1.55 ± 0.49 a,b | 1.20 ± 0.39 b | 1.05 ± 0.32 |
| Niacin (mg) | 13.4 ± 4.25 b,c | 10.5 ± 2.97 b | 8.1 ± 2.70 |
| Vitamin B6 (mg) | 1.69 ± 0.45 a,b | 1.24 ± 0.31 b | 0.87 ± 0.23 |
| Vitamin C (mg) | 70.6 ± 39.27 b,e | 46.8 ± 28.20 b | 28.1 ± 14.97 |
| Saturated fatty acids (g) | 31.3 ± 14.27 d,e | 23.7 ± 8.26 | 23.0 ± 9.65 |
| Monounsaturated fatty acids (g) | 35.1 ± 17.06 b | 26.3 ± 8.62 | 23.1 ± 8.95 |
| Polyunsaturated fatty acids (g) | 15.7 ± 8.91 b | 11.6 ± 4.54 b | 8.1 ± 4.19 |
| Cholesterol (mg) | 312.0 ± 169.06 | 250.2 ± 95.95.83 | 234.7 ± 104.11 |
| Dietary fiber (g) | 22.2 ± 5.25 a,b | 14.2 ± 3.31 b | 10.2 ± 2.54 |
| Q1 (n = 36) Most Anti-Inflammatory Diet | Q2–Q3 (n = 69) | Q4 (n = 36) Most Pro-Inflammatory Diet | |
|---|---|---|---|
| DII (min; max) | (−3.39; −1.07) | (−1.02; 1.30) | (1.36; 4.23) |
| Energy (kcal) | 3700.8 ± 781.58 A,B | 2902.9 ± 559.43 C | 2398.6 ± 429.73 |
| Protein (g) | 133.7 ± 25.35 A,B | 103.5 ± 21.33 B | 79.9 ± 14.91 |
| Fat (g) | 151.7 ± 39.56 A,B | 117.8 ± 34.21 C | 100.8 ± 21.94 |
| Carbohydrates (g) | 486.8 ± 106.61 A,B | 377.8 ± 72.78 B | 306.1 ± 71.41 |
| Magnesium (mg) | 463.5 ± 80.53 A,B | 361.4 ± 67.30 B | 255.7 ± 57.62 |
| Iron (mg) | 19.4 ± 3.01 A,B | 15.1 ± 3.86 B | 10.9 ± 2.92 |
| Zinc(mg) | 17.8 ± 3.11 A,B | 13.5 ± 2.52 B | 10.7 ± 2.07 |
| Vitamin A (µg) | 1851.8 ± 1021.96 A,B | 1027.8 ± 496.28 C | 751.5 ± 250.65 |
| Beta carotene (µg) | 6064.9 ± 5775.52 A,B | 2614.2 ± 2419.70 C | 1467.9 ± 872.58 |
| Vitamin E (mg) | 22.0 ± 7.64 A,B | 16.3 ± 5.78 B | 11.3 ± 4.21 |
| Thiamine (mg) | 1.96 ± 0.40 A,B | 1.55 ± 0.39 B | 1.08 ± 0.24 |
| Riboflavin (mg) | 2.47 ± 0.63 A,B | 1.83 ± 0.48 C | 1.47 ± 0.37 |
| Niacin (mg) | 25.8 ± 6.68 D | 21.4 ± 7.78 B | 14.0 ± 4.08 |
| Vitamin B6 (mg) | 2.95 ± 0.57 A,B | 2.22 ± 0.50 B | 1.43 ± 0.34 |
| Vitamin C (mg) | 90.9 ± 39.38 A,B | 53.2 ± 28.06 B | 34.6 ± 20.75 |
| Saturated fatty acids (g) | 51.7 ± 16.90 | 39.9 ± 14.65 | 38.6 ± 8.53 |
| Monounsaturated fatty acids (g) | 60.9 ± 16.79 A,B | 48.1 ± 15.44 C | 40.0 ± 9.48 |
| Polyunsaturated fatty acids (g) | 27.1 ± 10.08 B | 20.8 ± 7.42 B | 14.3 ± 5.54 |
| Cholesterol (g) | 620.9 ± 266.70 B | 494.7 ± 247.62 | 399.1 ± 137.61 |
| Dietary fiber (g) | 32.9 ± 8.59 A,B | 23.3 ± 5.02 B | 16.2 ± 4.60 |
| Q1 (n = 38) Most Anti-Inflammatory Diet | Q2–Q3 (n = 75) | Q4 (n = 38) Most Pro-Inflammatory Diet | |
|---|---|---|---|
| DII (min; max) | (−2.60; 1.02) | (1.18; 3.29) | (3.30; 4.36) |
| Height (cm) | 167.8 ± 5.58 a,d | 164.7 ± 2.92 | 165.0 ± 3.25 |
| Body mass (kg) | 60.3 ± 6.42 a,d | 56.0 ± 3.54 | 56.6 ± 3.30 |
| BMI * | 21.3 ± 1.30 c,f | 20.6 ± 0.90 | 20.8 ± 0.60 |
| Body fat% | 22.3 ± 2.69 e | 21.4 ± 1.40 g | 23.0 ± 1.17 |
| Body fat (kg) | 13.6 ± 3.05 a | 12.0 ± 1.33 h | 13.0 ± 1.27 |
| LBM (kg) ^ | 47.4 ± 5.87 a,b | 44.0 ± 2.49 | 43.6 ± 6.77 |
| Q1 (n = 36) Most Anti-Inflammatory Diet | Q2–Q3 (n = 69) | Q4 (n = 36) Most Pro-Inflammatory Diet | |
|---|---|---|---|
| DII (min; max) | (−3.39; −1.07) | (−1.02; 1.30) | (1.36; 4.23) |
| Height (cm) | 184.2 ± 6.32 C,D | 180.6 ± 4.84 | 179.1 ± 6.56 |
| Body mass (kg) | 82.3 ± 8.79 A,B | 76.8 ± 5.26 | 75.2 ± 4.21 |
| BMI * | 24.2 ± 2.03 | 23.6 ± 1.50 | 23.5 ± 1.57 |
| Body fat% | 13.5 ± 2.17 E,F | 13.8 ± 1.94 I | 14.7 ± 1.76 |
| Body fat (kg) | 11.2 ± 2.61 | 10.6 ± 1.95 | 11.1 ± 1.49 |
| LBM (kg) ^ | 71.1 ± 6.79 A,B | 66.2 ± 4.08 H | 64.1 ± 3.67 |
| Female Students | Male Students | |
|---|---|---|
| DII | ||
| Body mass (kg) | −0.181 | −0.338 |
| p < 0.05 | p < 0.001 | |
| BMI | −0.110 | −0.161 |
| p = 0.178 | p = 0.057 | |
| Body fat % | 0.286 | 0.178 |
| p < 0.001 | p < 0.05 | |
| Body fat (kg) | 0.081 | −0.010 |
| p = 0.324 | p = 0.902 | |
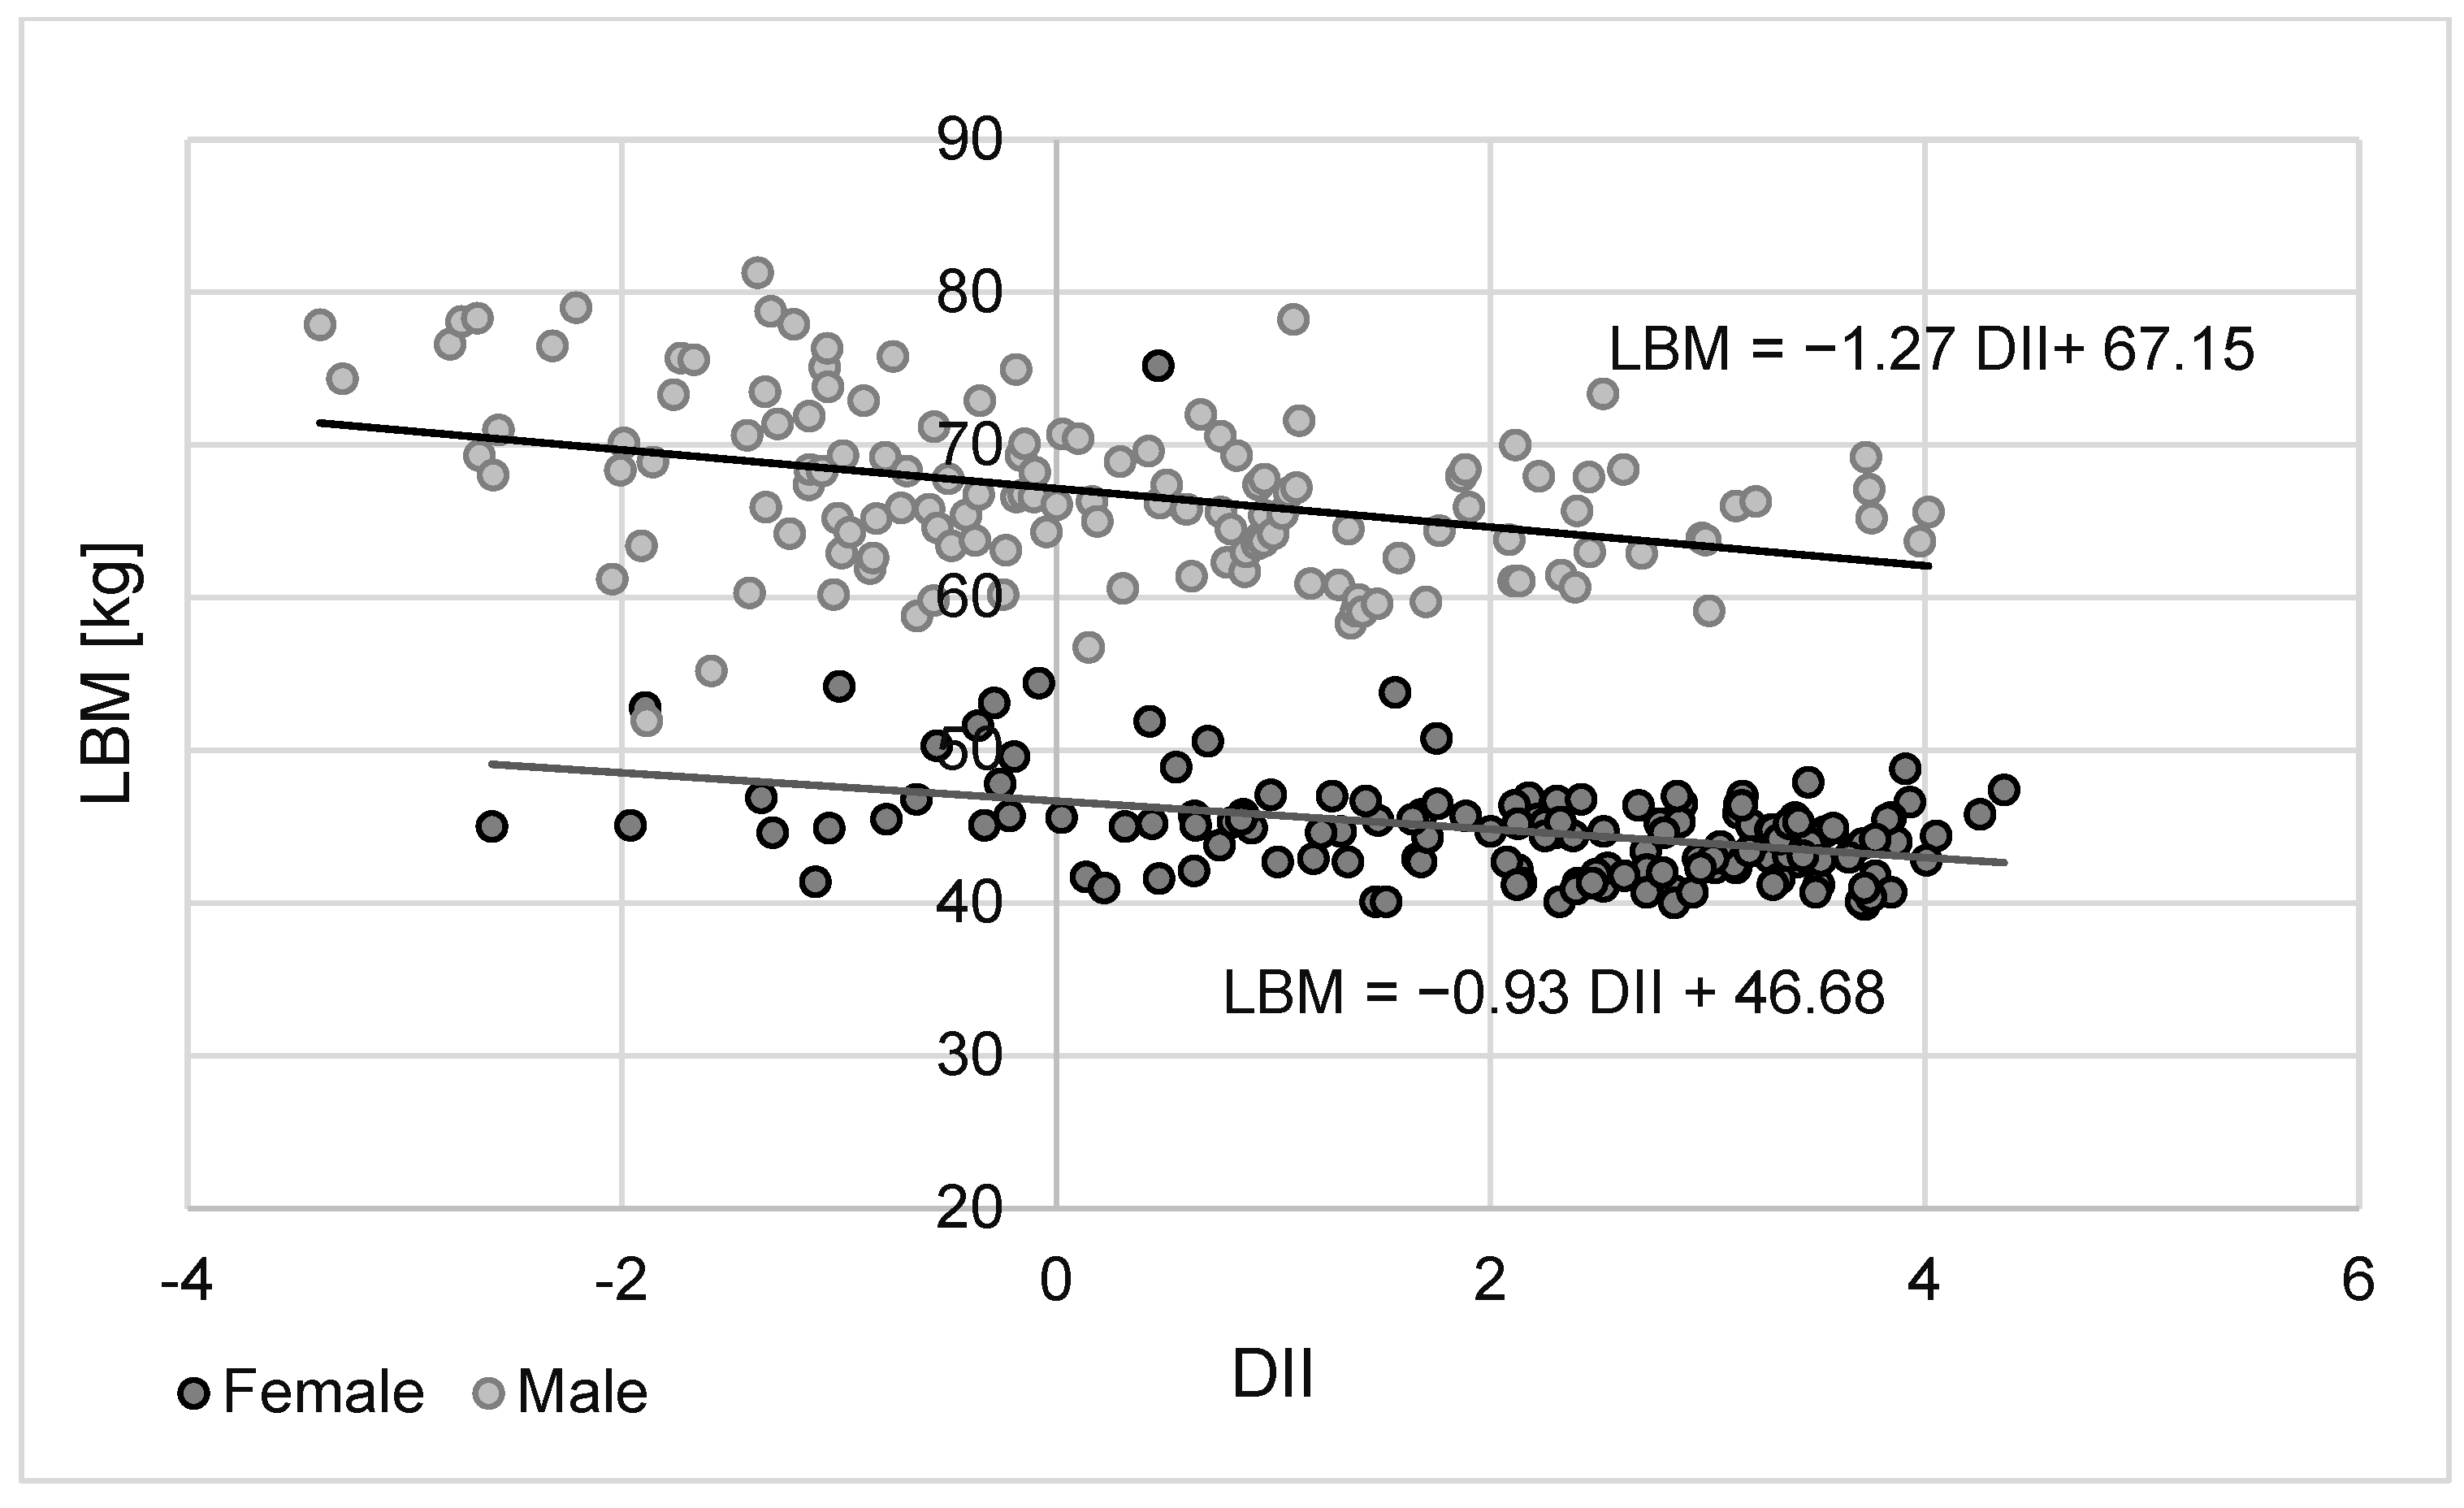
| LBM (kg) | −0.316 | −0.395 |
| p < 0.001 | p < 0.001 | |
Disclaimer/Publisher’s Note: The statements, opinions and data contained in all publications are solely those of the individual author(s) and contributor(s) and not of MDPI and/or the editor(s). MDPI and/or the editor(s) disclaim responsibility for any injury to people or property resulting from any ideas, methods, instructions or products referred to in the content. |
© 2023 by the authors. Licensee MDPI, Basel, Switzerland. This article is an open access article distributed under the terms and conditions of the Creative Commons Attribution (CC BY) license (https://creativecommons.org/licenses/by/4.0/).
Share and Cite
Pietrzak, A.; Kęska, A.; Iwańska, D. Diet Inflammatory Index among Regularly Physically Active Young Women and Men. Nutrients 2024, 16, 62. https://doi.org/10.3390/nu16010062
Pietrzak A, Kęska A, Iwańska D. Diet Inflammatory Index among Regularly Physically Active Young Women and Men. Nutrients. 2024; 16(1):62. https://doi.org/10.3390/nu16010062
Chicago/Turabian StylePietrzak, Anna, Anna Kęska, and Dagmara Iwańska. 2024. "Diet Inflammatory Index among Regularly Physically Active Young Women and Men" Nutrients 16, no. 1: 62. https://doi.org/10.3390/nu16010062
APA StylePietrzak, A., Kęska, A., & Iwańska, D. (2024). Diet Inflammatory Index among Regularly Physically Active Young Women and Men. Nutrients, 16(1), 62. https://doi.org/10.3390/nu16010062