
The Impact of Diet and Physical Activity on Fat-to-Lean Mass Ratio

 ,
,  ,
, 

 , and
, and 
Highlights
- A personalized low-calorie Mediterranean diet reduced fat mass by 5% while preserving fat-free mass over two months.
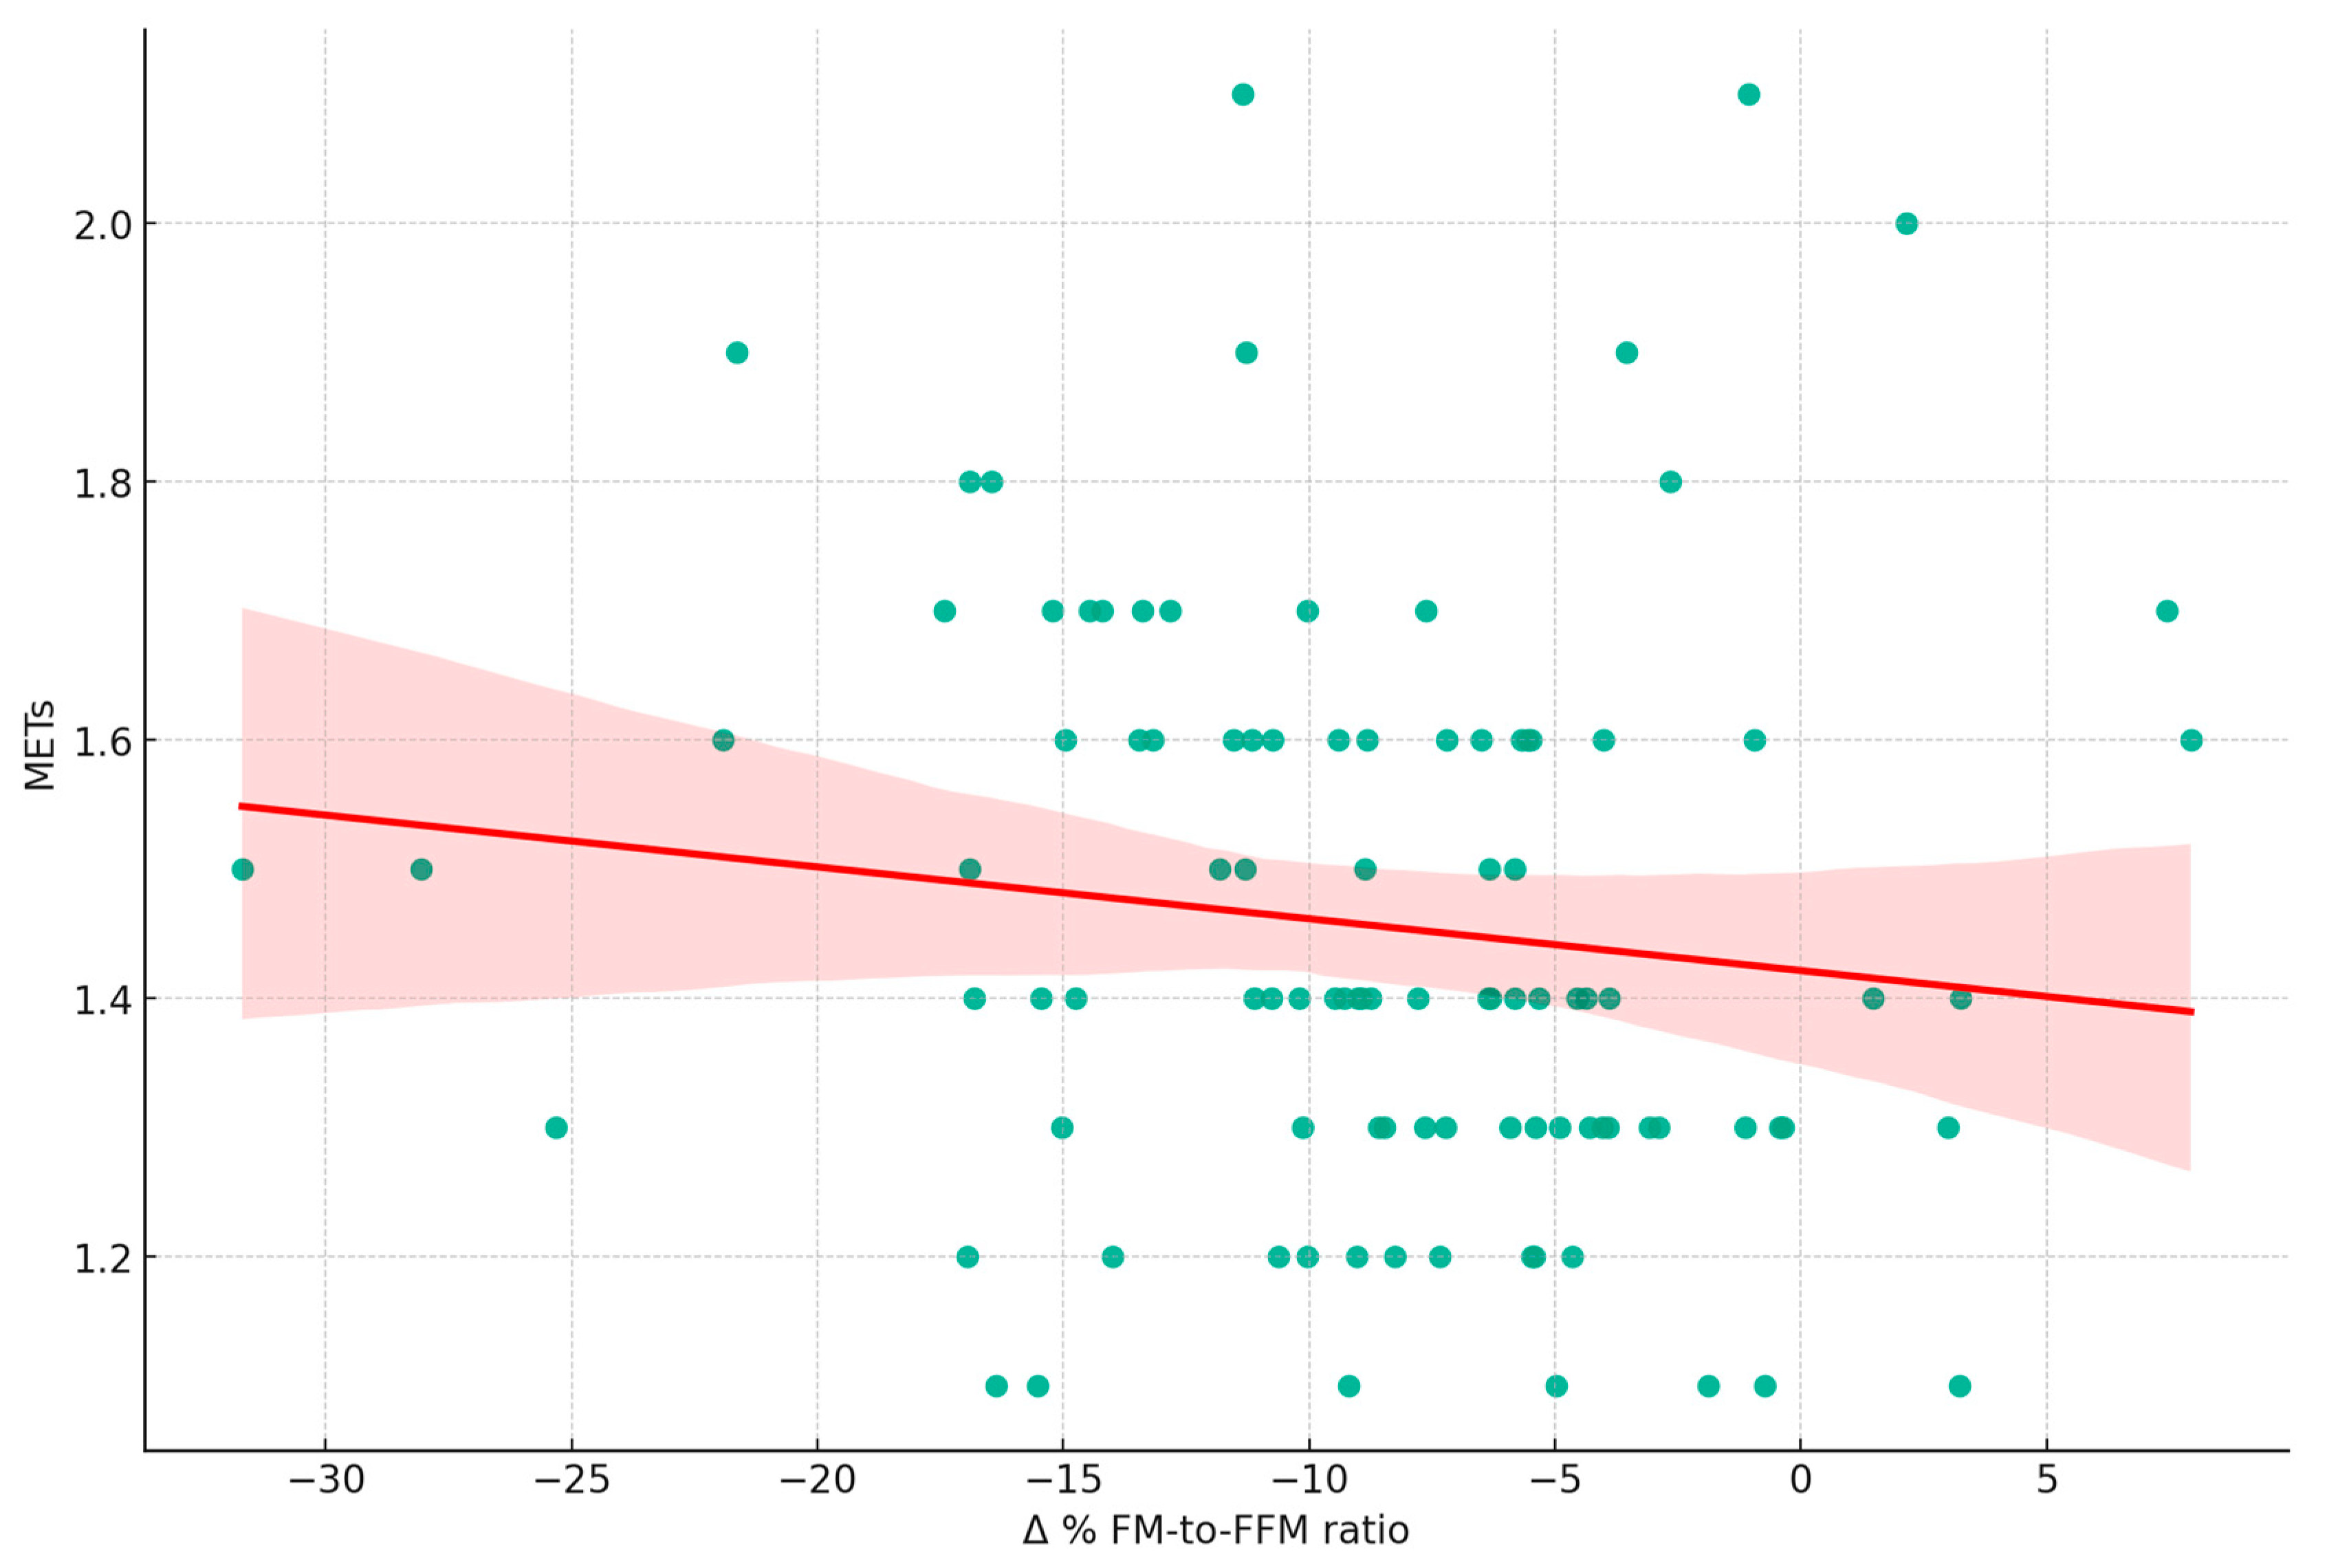
- Higher physical activity intensity (MET) directly correlated with improvements in the fat-to-lean mass ratio.
- Gender- and BMI-specific analyses revealed distinct dietary and activity patterns influencing body composition changes.
- Older adults demonstrated significant muscle mass gains, highlighting age as a key factor in body composition adjustments.
- This study underscores the interplay of caloric restriction, exercise, and individual factors in achieving desired body composition outcomes.
Abstract
:1. Introduction
2. Materials and Methods
2.1. Body Composition
2.2. Energy Expenditure
2.3. Diet
2.4. Follow-Up
2.5. Age Stratification and Participant Demographics
2.6. Statistical Analyses
3. Results
4. Discussion
5. Conclusions
Supplementary Materials
Author Contributions
Funding
Institutional Review Board Statement
Informed Consent Statement
Data Availability Statement
Conflicts of Interest
Abbreviations
References
- Willoughby, D.; Hewlings, S.; Kalman, D. Body Composition Changes in Weight Loss: Strategies and Supplementation for Maintaining Lean Body Mass, a Brief Review. Nutrients 2018, 10, 1876. [Google Scholar] [CrossRef] [PubMed]
- Piqueras, P.; Ballester, A.; Durá-Gil, J.V.; Martinez-Hervas, S.; Redón, J.; Real, J.T. Anthropometric Indicators as a Tool for Diagnosis of Obesity and Other Health Risk Factors: A Literature Review. Front. Psychol. 2021, 12, 631179. [Google Scholar] [CrossRef] [PubMed]
- Roklicer, R.; Lakicevic, N.; Stajer, V.; Trivic, T.; Bianco, A.; Mani, D.; Milosevic, Z.; Maksimovic, N.; Paoli, A.; Drid, P. The effects of rapid weight loss on skeletal muscle in judo athletes. J. Transl. Med. 2020, 18, 142. [Google Scholar] [CrossRef] [PubMed]
- van Baak, M.A.; Mariman, E.C.M. Obesity-induced and weight-loss-induced physiological factors affecting weight regain. Nat. Rev. Endocrinol. 2023, 19, 655–670. [Google Scholar] [CrossRef]
- Bonaccio, M.; Costanzo, S.; Di Castelnuovo, A.; Gialluisi, A.; Ruggiero, E.; De Curtis, A.; Persichillo, M.; Cerletti, C.; Donati, M.B.; de Gaetano, G.; et al. Increased Adherence to a Mediterranean Diet Is Associated with Reduced Low-Grade Inflammation after a 12.7-Year Period: Results From the Moli-sani Study. J. Acad. Nutr. Diet. 2023, 123, 783–795.e7. [Google Scholar] [CrossRef]
- Adeola, O.L.; Agudosi, G.M.; Akueme, N.T.; Okobi, O.E.; Akinyemi, F.B.; Ononiwu, U.O.; Akunne, H.S.; Akinboro, M.K.; Ogbeifun, O.E.; Okeaya-Inneh, M. The Effectiveness of Nutritional Strategies in the Treatment and Management of Obesity: A Systematic Review. Cureus 2023, 15, e45518. [Google Scholar] [CrossRef]
- Raiman, L.; Amarnani, R.; Abdur-Rahman, M.; Marshall, A.; Mani-Babu, S. The role of physical activity in obesity: Let’s actively manage obesity. Clin. Med. 2023, 23, 311–317. [Google Scholar] [CrossRef]
- Pileggi, C.A.; Blondin, D.P.; Hooks, B.G.; Parmar, G.; Alecu, I.; Patten, D.A.; Cuillerier, A.; O’Dwyer, C.; Thrush, A.B.; Fullerton, M.D.; et al. Exercise training enhances muscle mitochondrial metabolism in diet-resistant obesity. EBioMedicine 2022, 83, 104192. [Google Scholar] [CrossRef]
- Cava, E.; Yeat, N.C.; Mittendorfer, B. Preserving Healthy Muscle during Weight Loss. Adv. Nutr. 2017, 8, 511–519. [Google Scholar] [CrossRef]
- Most, J.; Redman, L.M. Impact of calorie restriction on energy metabolism in humans. Exp. Gerontol. 2020, 133, 110875. [Google Scholar] [CrossRef]
- Perrone, M.A.; Feola, A.; Pieri, M.; Donatucci, B.; Salimei, C.; Lombardo, M.; Perrone, A.; Parisi, A. The Effects of Reduced Physical Activity on the Lipid Profile in Patients with High Cardiovascular Risk during COVID-19 Lockdown. Int. J. Environ. Res. Public Health 2021, 18, 8858. [Google Scholar] [CrossRef] [PubMed]
- Lombardo, M.; Feraco, A.; Ottaviani, M.; Rizzo, G.; Camajani, E.; Caprio, M.; Armani, A. The Efficacy of Vitamin D Supplementation in the Treatment of Fibromyalgia Syndrome and Chronic Musculoskeletal Pain. Nutrients 2022, 14, 3010. [Google Scholar] [CrossRef] [PubMed]
- Vasold, K.L.; Parks, A.C.; Phelan, D.M.L.; Pontifex, M.B.; Pivarnik, J.M. Reliability and Validity of Commercially Available Low-Cost Bioelectrical Impedance Analysis. Int. J. Sport Nutr. Exerc. Metab. 2019, 29, 406–410. [Google Scholar] [CrossRef] [PubMed]
- Johannsen, D.L.; Calabro, M.A.; Stewart, J.; Franke, W.; Rood, J.C.; Welk, G.J. Accuracy of armband monitors for measuring daily energy expenditure in healthy adults. Med. Sci. Sports Exerc. 2010, 42, 2134–2140. [Google Scholar] [CrossRef] [PubMed]
- Jakicic, J.M.; Marcus, M.; Gallagher, K.I.; Randall, C.; Thomas, E.; Goss, F.L.; Robertson, R.J. Evaluation of the SenseWear Pro Armband to assess energy expenditure during exercise. Med. Sci. Sports Exerc. 2004, 36, 897–904. [Google Scholar] [CrossRef] [PubMed]
- Di Renzo, L.; Cinelli, G.; Dri, M.; Gualtieri, P.; Attinà, A.; Leggeri, C.; Cenname, G.; Esposito, E.; Pujia, A.; Chiricolo, G.; et al. Mediterranean Personalized Diet Combined with Physical Activity Therapy for the Prevention of Cardiovascular Diseases in Italian Women. Nutrients 2020, 12, 3456. [Google Scholar] [CrossRef] [PubMed]
- Konieczna, J.; Ruiz-Canela, M.; Galmes-Panades, A.M.; Abete, I.; Babio, N.; Fiol, M.; Martín-Sánchez, V.; Estruch, R.; Vidal, J.; Buil-Cosiales, P.; et al. An Energy-Reduced Mediterranean Diet, Physical Activity, and Body Composition: An Interim Subgroup Analysis of the PREDIMED-Plus Randomized Clinical Trial. JAMA Netw. Open. 2023, 6, e2337994. [Google Scholar] [CrossRef] [PubMed]
- Lazzer, S.; D’Alleva, M.; Vaccari, F.; Tringali, G.; De Micheli, R.; Sartorio, A. Effects of a 3-Week Inpatient Multidisciplinary Body Weight Reduction Program on Body Composition and Physical Capabilities in Adolescents and Adults With Obesity. Front. Nutr. 2022, 9, 840018, Erratum in: Front. Nutr. 2022, 9, 1003940. [Google Scholar] [CrossRef]
- López-Olivares, M.; Sapp, P.; Riley, T.M.; Kris-Etherton, P.M.; Enrique-Mirón, C.; Nestares, T.; Davis, K.M. A Mediterranean Dietary Pattern Is Associated with Greater Participation in Physical Activity and Better Health-Related Quality of Life among Students and Professors at the Melilla Campus (University of Granada). Nutrients 2023, 15, 3971. [Google Scholar] [CrossRef]
- Suchacki, K.J.; Thomas, B.J.; Ikushima, Y.M.; Chen, K.C.; Fyfe, C.; Tavares, A.A.S.; Sulston, R.J.; Lovdel, A.; Woodward, H.J.; Han, X.; et al. The effects of caloric restriction on adipose tissue and metabolic health are sex- and age-dependent. Elife 2023, 12, e88080. [Google Scholar] [CrossRef]
- Ashtary-Larky, D.; Bagheri, R.; Abbasnezhad, A.; Tinsley, G.M.; Alipour, M.; Wong, A. Effects of gradual weight loss v. rapid weight loss on body composition and RMR: A systematic review and meta-analysis. Br. J. Nutr. 2020, 124, 1121–1132. [Google Scholar] [CrossRef] [PubMed]
- Stubbs, R.J.; Hopkins, M.; Finlayson, G.S.; Duarte, C.; Gibbons, C.; Blundell, J.E. Potential effects of fat mass and fat-free mass on energy intake in different states of energy balance. Eur. J. Clin. Nutr. 2018, 72, 698–709. [Google Scholar] [CrossRef] [PubMed]
- Cacciatore, S.; Calvani, R.; Marzetti, E.; Picca, A.; Coelho-Júnior, H.J.; Martone, A.M.; Massaro, C.; Tosato, M.; Landi, F. Low Adherence to Mediterranean Diet Is Associated with Probable Sarcopenia in Community-Dwelling Older Adults: Results from the Longevity Check-Up (Lookup) 7+ Project. Nutrients 2023, 15, 1026. [Google Scholar] [CrossRef] [PubMed]
- Bray, G.A.; Krauss, R.M.; Sacks, F.M.; Qi, L. Lessons Learned from the POUNDS Lost Study: Genetic, Metabolic, and Behavioral Factors Affecting Changes in Body Weight, Body Composition, and Cardiometabolic Risk. Curr. Obes. Rep. 2019, 8, 262–283. [Google Scholar] [CrossRef] [PubMed]
- Stoodley, I.L.; Williams, L.M.; Wood, L.G. Effects of Plant-Based Protein Interventions, with and without an Exercise Component, on Body Composition, Strength and Physical Function in Older Adults: A Systematic Review and Meta-Analysis of Randomized Controlled Trials. Nutrients 2023, 15, 4060. [Google Scholar] [CrossRef] [PubMed]
- Lombardo, M.; Aulisa, G.; Marcon, D.; Rizzo, G. The Influence of Animal- or Plant-Based Diets on Blood and Urine Trimethylamine-N-Oxide (TMAO) Levels in Humans. Curr. Nutr. Rep. 2022, 11, 56–68. [Google Scholar] [CrossRef] [PubMed]
- Hadrévi, J.; Søgaard, K.; Christensen, J.R. Dietary Fiber Intake among Normal-Weight and Overweight Female Health Care Workers: An Exploratory Nested Case-Control Study within FINALE-Health. J. Nutr. Metab. 2017, 2017, 1096015. [Google Scholar] [CrossRef]
- Albar, S.A. Dietary Omega-6/Omega-3 Polyunsaturated Fatty Acid (PUFA) and Omega-3 Are Associated With General and Abdominal Obesity in Adults: UK National Diet and Nutritional Survey. Cureus 2022, 14, e30209. [Google Scholar] [CrossRef]
- Ozen, E.; Mihaylova, R.; Weech, M.; Kinsella, S.; Lovegrove, J.A.; Jackson, K.G. Association between dietary saturated fat with cardiovascular disease risk markers and body composition in healthy adults: Findings from the cross-sectional BODYCON study. Nutr. Metab. 2022, 19, 15. [Google Scholar] [CrossRef]
- Sun, Y.; Liu, B.; Snetselaar, L.G.; Robinson, J.G.; Wallace, R.B.; Peterson, L.L.; Bao, W. Association of fried food consumption with all cause, cardiovascular, and cancer mortality: Prospective cohort study. BMJ 2019, 364, k5420. [Google Scholar] [CrossRef]
- Ponti, F.; Santoro, A.; Mercatelli, D.; Gasperini, C.; Conte, M.; Martucci, M.; Sangiorgi, L.; Franceschi, C.; Bazzocchi, A. Aging and Imaging Assessment of Body Composition: From Fat to Facts. Front. Endocrinol. 2020, 10, 861. [Google Scholar] [CrossRef] [PubMed]
- Pappas, L.E.; Nagy, T.R. The translation of age-related body composition findings from rodents to humans. Eur. J. Clin. Nutr. 2019, 73, 172–178. [Google Scholar] [CrossRef] [PubMed]
- Serrano-Sánchez, J.A.; Fernández-Rodríguez, M.J.; Sanchis-Moysi, J.; Rodríguez-Pérez, M.D.C.; Marcelino-Rodríguez, I.; Cabrera de León, A. Domain and intensity of physical activity are associated with metabolic syndrome: A population-based study. PLoS ONE 2019, 14, e0219798. [Google Scholar] [CrossRef] [PubMed]
- Savikangas, T.; Tirkkonen, A.; Alen, M.; Rantanen, T.; Fielding, R.A.; Rantalainen, T.; Sipilä, S. Associations of physical activity in detailed intensity ranges with body composition and physical function a cross-sectional study among sedentary older adults. Eur. Rev. Aging Phys. Act. 2020, 17, 4. [Google Scholar] [CrossRef]
- Rallidis, L.S.; Lekakis, J.; Kolomvotsou, A.; Zampelas, A.; Vamvakou, G.; Efstathiou, S.; Dimitriadis, G.; Raptis, S.A.; Kremastinos, D.T. Close adherence to a Mediterranean diet improves endothelial function in subjects with abdominal obesity. Am. J. Clin. Nutr. 2009, 90, 263–268. [Google Scholar] [CrossRef]
- Lombardo, M.; Guseva, E.; Perrone, M.A.; Müller, A.; Rizzo, G.; Storz, M.A. Changes in Eating Habits and Physical Activity after COVID-19 Pandemic Lockdowns in Italy. Nutrients 2021, 13, 4522. [Google Scholar] [CrossRef]
- Sofi, F.; Dinu, M.; Pagliai, G.; Cesari, F.; Marcucci, R.; Casini, A. Mediterranean versus vegetarian diet for cardiovascular disease prevention (the CARDIVEG study): Study protocol for a randomized controlled trial. Trials 2016, 17, 233. [Google Scholar] [CrossRef]


| Variable | Total (100) | Females (60) | Males (40) | Age 18–29 (30) | Age 30–49 (59) | Age 50–65 (11) |
|---|---|---|---|---|---|---|
| Age | 34.5 ± 10.6 | 34.7 ± 11.2 | 34.3 ± 9.9 | 22.9 ± 3.9 | 37.1 ± 5.4 | 53.6 ± 2.9 |
| Smokers | 15 | 10 | 5 | 5 | 8 | 2 |
| Anthropometric Data | ||||||
| Height (cm) | 168.9 ± 8.9 | 163.9 ± 5.8 | 176.6 ± 7.0 | 170.1 ± 8.5 | 169.6 ± 8.8 | 162.1 ± 8.4 |
| Weight (kg) | 82.7 ± 20.0 | 73.1 ± 14.5 | 97.0 ± 18.6 | 77.6 ± 13.4 | 84.5 ± 29 | 86.7 ± 20.1 |
| BMI (Kg/m2) | 28.7 ± 5.4 | 27.2 ± 5.1 | 31.0 ± 5.2 | 26.1 ± 2.4 | 29 ± 5.7 | 32.8 ± 6.3 |
| FM (Kg) | 25.9 ± 10.5 | 25.4 ± 10.4 | 26.5 ± 10.8 | 21.9 ± 7.7 | 26.3 ± 10.4 | 33.9 ± 13.1 |
| FM (%) | 30.7 ± 7.8 | 33.6 ± 6.9 | 26.3 ± 7.1 | 28.1 ± 8.2 | 30.6 ± 6.9 | 38.1 ± 7.2 |
| FFM (Kg) | 54 ± 12.9 | 45.3 ± 5.3 | 67.1 ± 9.5 | 53.0 ± 10.9 | 55.3 ± 14.4 | 50.1 ± 9.3 |
| FM-to-FFM ratio | 0.49 ± 0.18 | 0.55± 0.18 | 0.39 ± 0.14 | 0.43 ± 0.17 | 0.48 ± 0.16 | 0.67 ± 0.22 |
| Body Water (Kg) | 40.4 ± 9.7 | 33.8 ± 4.4 | 50.2 ± 6.8 | 39.6 ± 7.6 | 41.2 ± 10.9 | 37.9 ± 8 |
| Body Proteins | 13.4 ± 3.6 | 11.1 ± 1.4 | 16.9 ± 3.2 | 13.2 ± 3.4 | 13.9 ± 3.9 | 11.4 ± 2.3 |
| Metabolic and Activity Data | ||||||
| BEE (Kcal) | 1773 ± 458 | 1437 ± 164 | 2173 ± 361 | 1731 ± 442 | 1806 ± 493 | 1692 ± 358 |
| TEE | 2624 ± 566 | 2263 ± 270 | 3166 ± 449 | 2643 ± 489 | 2656 ± 611 | 2405 ± 509 |
| LAF | 1.5 ± 0.2 | 1.4 ± 0.2 | 1.5 ± 0.2 | 1.5 ± 0.2 | 1.4 ± 0.2 | 1.3 ± 0.2 |
| Energy > 3 METS (kcal) | 432 ± 292 | 315 ± 205 | 607 ± 318 | 502 ± 281 | 430 ± 312 | 280 ± 204 |
| Weekly Sport Days (days/week) | 2.6 ± 1.6 | 2.6 ± 1.5 | 2.7 ± 1.8 | 2.9 ± 1.4 | 2.5 ± 1.7 | 2.3 ± 1.9 |
| Daily Steps (n) | 9574 ± 3875 | 8828 ± 3221 | 10,693 ± 4503 | 10,351 ± 4735 | 9499 ± 3705 | 8800 ± 2763 |
| Average Sports Duration (h:mm) | 1.21 ± 0.55 | 1.08 ± 51.0 | 1.40 ± 0.56 | 1.36 ± 0.52 | 1.20 ± 0.59 | 0.51 ± 0.31 |
| Lying Down (h:mm) | 7.47 ± 1.12 | 7.55 ± 1.12 | 7.37 ± 1.13 | 7.58 ± 1.17 | 7.39 ± 1.12 | 8.18 ± 1.07 |
| Sleep (h:mm) | 6.21 ± 0.55 | 6.33 ± 0.52 | 6.01 ± 0.55 | 6.23 ± 1.08 | 6.16 ± 0.50 | 6.28 ± 0.56 |
| Biochemical Data | ||||||
| Glycemia | 86.8 ± 12.2 | 83.8 ± 9.8 | 91.2 ± 14.1 | 82.9 ± 10.9 | 87.4 ± 12.3 | 92.8 ± 12.6 |
| TC | 194.3 ± 49.4 | 202.2 ± 49.8 | 183.5 ± 47.6 | 180.9 ± 62.6 | 192.1 ± 33.1 | 225.4 ± 54.6 |
| HDL | 56.5 ± 16.0 | 61.7 ± 15.2 | 49.7 ± 14.9 | 60.0 ± 14.6 | 54.0 ± 16.2 | 57.0 ± 18.2 |
| TG | 108.2 ± 65.3 | 89.8 ± 39.9 | 132.3 ± 83.1 | 93.9 ± 46.3 | 104.5 ± 51.4 | 142.0 ± 89.3 |
| SBP | 123.3 ± 14.1 | 119.5 ± 12.4 | 129.1 ± 14.8 | 121.6 ± 14.7 | 123.1 ± 14.0 | 128.7 ± 13.4 |
| DBP | 77.0 ± 9.1 | 74.9 ± 9.2 | 80.1 ± 8.2 | 74.7 ± 8.1 | 77.1 ± 9.6 | 81.9 ± 7.1 |
| Variable | Total (100) | Females (60) | Males (40) | p-Value |
|---|---|---|---|---|
| Energy kcal | 1792.24 ± 401.53 | 2142.85 ± 360.98 | 1558.50 ± 213.31 | <0.001 |
| % Protein | 20.12 ± 2.30 | 19.97 ± 2.90 | 20.22 ± 1.82 | 0.44 |
| % Fats | 28.90 ± 2.49 | 29.71 ± 2.80 | 28.37 ± 2.13 | 0.01 |
| % Carbs | 50.74 ± 2.98 | 50.02 ± 3.51 | 51.22 ± 2.50 | 0.05 |
| Protein g | 90.20 ± 20.49 | 106.53 ± 19.50 | 79.21 ± 12.17 | <0.001 |
| Protein g/kg weight | 1.11 ± 0.22 | 1.13 ± 0.27 | 1.10 ± 0.19 | 0.45 |
| Fiber g | 33.98 ± 7.05 | 37.87 ± 6.57 | 31.36 ± 6.12 | <0.001 |
| SFA g | 12.08 ± 4.32 | 15.42 ± 4.41 | 9.83 ± 2.38 | <0.001 |
| PUFA g | 7.07 ± 4.08 | 8.67 ± 4.70 | 5.99 ± 3.21 | 0.00 |
| MUFA g | 29.50 ± 8.00 | 36.21 ± 6.93 | 24.99 ± 4.94 | <0.001 |
| % Breakfast | 16.70 ± 3.42 | 16.29 ± 3.45 | 16.97 ± 3.40 | 0.25 |
| % Mid-Morning | 7.52 ± 6.93 | 7.84 ± 6.90 | 7.30 ± 7.00 | 0.50 |
| % Lunch | 33.09 ± 6.80 | 32.98 ± 6.71 | 33.16 ± 6.92 | 0.63 |
| % Afternoon | 9.67 ± 6.61 | 10.28 ± 6.74 | 9.27 ± 6.54 | 0.33 |
| % Dinner | 31.97 ± 7.21 | 31.19 ± 7.80 | 32.48 ± 6.82 | 0.29 |
| % After Dinner | 1.04 ± 2.24 | 1.39 ± 2.29 | 0.81 ± 2.19 | 0.16 |
| Δ Kcal% | Δ% FM-to-FFM Ratio | |
|---|---|---|
| Total | 31.0 ± 10.2 | −8.6 ± 6.8 |
| Female | 30.5 ± 10.2 | −7.9 ± 6.7 |
| Male | 31.7 ± 10,2 | −9.7 ± 6.8 |
| BMI 18.5–24.9 | 29.0 ± 9.1 | −10.3 ± 7.6 |
| BMI 25–29.9 | 31.0 ± 11.1 | −7.5 ± 5.3 |
| BMI 30–34.9 | 32.8 ± 9.4 | −8.7 ± 8.1 |
| Age 18–29 | 30.2 ± 10.3 | −8.9 ± 5.4 |
| Age 30–49 | 31.3 ± 10.0 | −9.6 ± 6.9 |
| Age 50–65 | 32.1 ± 11.1 | −2.2 ± 6.2 |
| BMI | Age Groups | ||||||||||||
|---|---|---|---|---|---|---|---|---|---|---|---|---|---|
| Variable | Whole Sample | p-Value | Females | Males | p-Value (M vs. F) | 18.5–24.9 | 25–29.9 | 30–34.9 | p-Value (BMI) | 18–29 | 30–49 | 50–65 | p-Value (Age Groups) |
| WEIGHT (kg) | −2.9 ± 1.8 | <0.0001 | −2.5 ± 1.8 | −3.5 ± 1.7 | 0.003 | −2.1 ± 1.5 | −2.5 ± 1.2 | −3.6 ± 1.6 | <0.001 | −2.9 ± 1.3 | −3.0 ± 2.0 | −2.6 ± 1.9 | 0.895 |
| BMI (Kg/m2) | −1.0 ± 0.6 | <0.0001 | −0.9 ± 0.6 | −1.1 ± 0.5 | 0.076 | −0.8 ± 0.6 | −0.9 ± 0.4 | −1.2 ± 0.6 | <0.001 | −1 ± 0.4 | −1.0 ± 0.7 | −1.0 ± 0.7 | 0.747 |
| FM (kg) | −2.4 ± 1.7 | <0.0001 | −2.1 ± 1.4 | −2.8 ± 2.0 | 0.022 | −1.7 ± 1.1 | −2.0 ± 0.9 | −2.9 ± 2.0 | <0.001 | −2.1 ± 1.0 | −2.6 ± 1.9 | −1.6 ± 1.7 | 0.440 |
| FM (%) | −1.8 ± 1.5 | <0.0001 | −1.7 ± 1.4 | −1.9 ± 1.6 | 0.494 | −2.0 ± 1.5 | −1.6 ± 1.0 | −1.9 ± 2.0 | <0.001 | −1.8 ± 1.1 | −2.1 ± 1.6 | −0.7 ± 1.3 * | 0.110 |
| FFM (kg) | −0.5 ± 1.4 | 0.0012 | −0.4 ± 1.2 | −0.7 ± 1.7 | 0.320 | −0.4 ± 1.0 * | −0.5 ± 1.1 | −0.6 ± 1.8 * | <0.001 | −0.7 ± 1.0 | −0.3 ± 1.6 * | −1.2 ± 1.6 | 0.091 |
| FM-to-FFM ratio | −0.04 ± 0.03 | <0.0001 | −0.04 ± 0.03 | −0.04 ± 0.04 | 0.865 | −0.04 ± 0.03 | −0.04 ± 0.03 | −0.05 ± 0.05 | <0.001 | −0.04 ± 0.02 | −0.05 ± 0.03 | −0.02 ± 0.04 * | 0.130 |
| TBW (kg) | −0.6 ± 1.0 | <0.0001 | −0.4 ± 1.0 | −0.8 ± 0.9 | 0.014 | −0.4 ± 0.8 | −0.4 ± 0.8 | −0.9 ± 1.1 | <0.001 | −0.5 ± 1.0 | −0.5 ± 1.0 | −1.0 ± 1.0 | 0.161 |
| Body Protein (Kg) | 0.3 ± 1.0 | 0.0049 | 0.4 ± 1.0 | 0.2 ± 1.0 * | 0.395 | 0.1 ± 0.7 * | 0.2 ± 0.8 * | 0.3 ± 1.1 * | 0.007 | −0.01 ± 0.6 * | 0.4 ± 1.1 | 0.6 ± 1.0 * | 0.036 |
| Beta | p-Value | 95% CI | |
|---|---|---|---|
| Constant | −13.23 | <0.001 | (−17.73, −8.73) |
| Age | 0.13 | 0.036 | (0.01, 0.26) |
| Beta | p-Value | 95% CI | |
|---|---|---|---|
| Constant | −7.48 | <0.001 | (−9.50, −5.46) |
| Energy Expenditure > 3 METs | −0.0046 | 0.019 | (−0.009, −0.001) |
Disclaimer/Publisher’s Note: The statements, opinions and data contained in all publications are solely those of the individual author(s) and contributor(s) and not of MDPI and/or the editor(s). MDPI and/or the editor(s) disclaim responsibility for any injury to people or property resulting from any ideas, methods, instructions or products referred to in the content. |
© 2023 by the authors. Licensee MDPI, Basel, Switzerland. This article is an open access article distributed under the terms and conditions of the Creative Commons Attribution (CC BY) license (https://creativecommons.org/licenses/by/4.0/).
Share and Cite
Padua, E.; Caprio, M.; Feraco, A.; Camajani, E.; Gorini, S.; Armani, A.; Ruscello, B.; Bellia, A.; Strollo, R.; Lombardo, M. The Impact of Diet and Physical Activity on Fat-to-Lean Mass Ratio. Nutrients 2024, 16, 19. https://doi.org/10.3390/nu16010019
Padua E, Caprio M, Feraco A, Camajani E, Gorini S, Armani A, Ruscello B, Bellia A, Strollo R, Lombardo M. The Impact of Diet and Physical Activity on Fat-to-Lean Mass Ratio. Nutrients. 2024; 16(1):19. https://doi.org/10.3390/nu16010019
Chicago/Turabian StylePadua, Elvira, Massimiliano Caprio, Alessandra Feraco, Elisabetta Camajani, Stefania Gorini, Andrea Armani, Bruno Ruscello, Alfonso Bellia, Rocky Strollo, and Mauro Lombardo. 2024. "The Impact of Diet and Physical Activity on Fat-to-Lean Mass Ratio" Nutrients 16, no. 1: 19. https://doi.org/10.3390/nu16010019
APA StylePadua, E., Caprio, M., Feraco, A., Camajani, E., Gorini, S., Armani, A., Ruscello, B., Bellia, A., Strollo, R., & Lombardo, M. (2024). The Impact of Diet and Physical Activity on Fat-to-Lean Mass Ratio. Nutrients, 16(1), 19. https://doi.org/10.3390/nu16010019