
Low Dietary Variety Is Associated with Incident Frailty in Older Adults during the Coronavirus Disease 2019 Pandemic: A Prospective Cohort Study in Japan
 ,
,
Abstract
1. Introduction
2. Methods
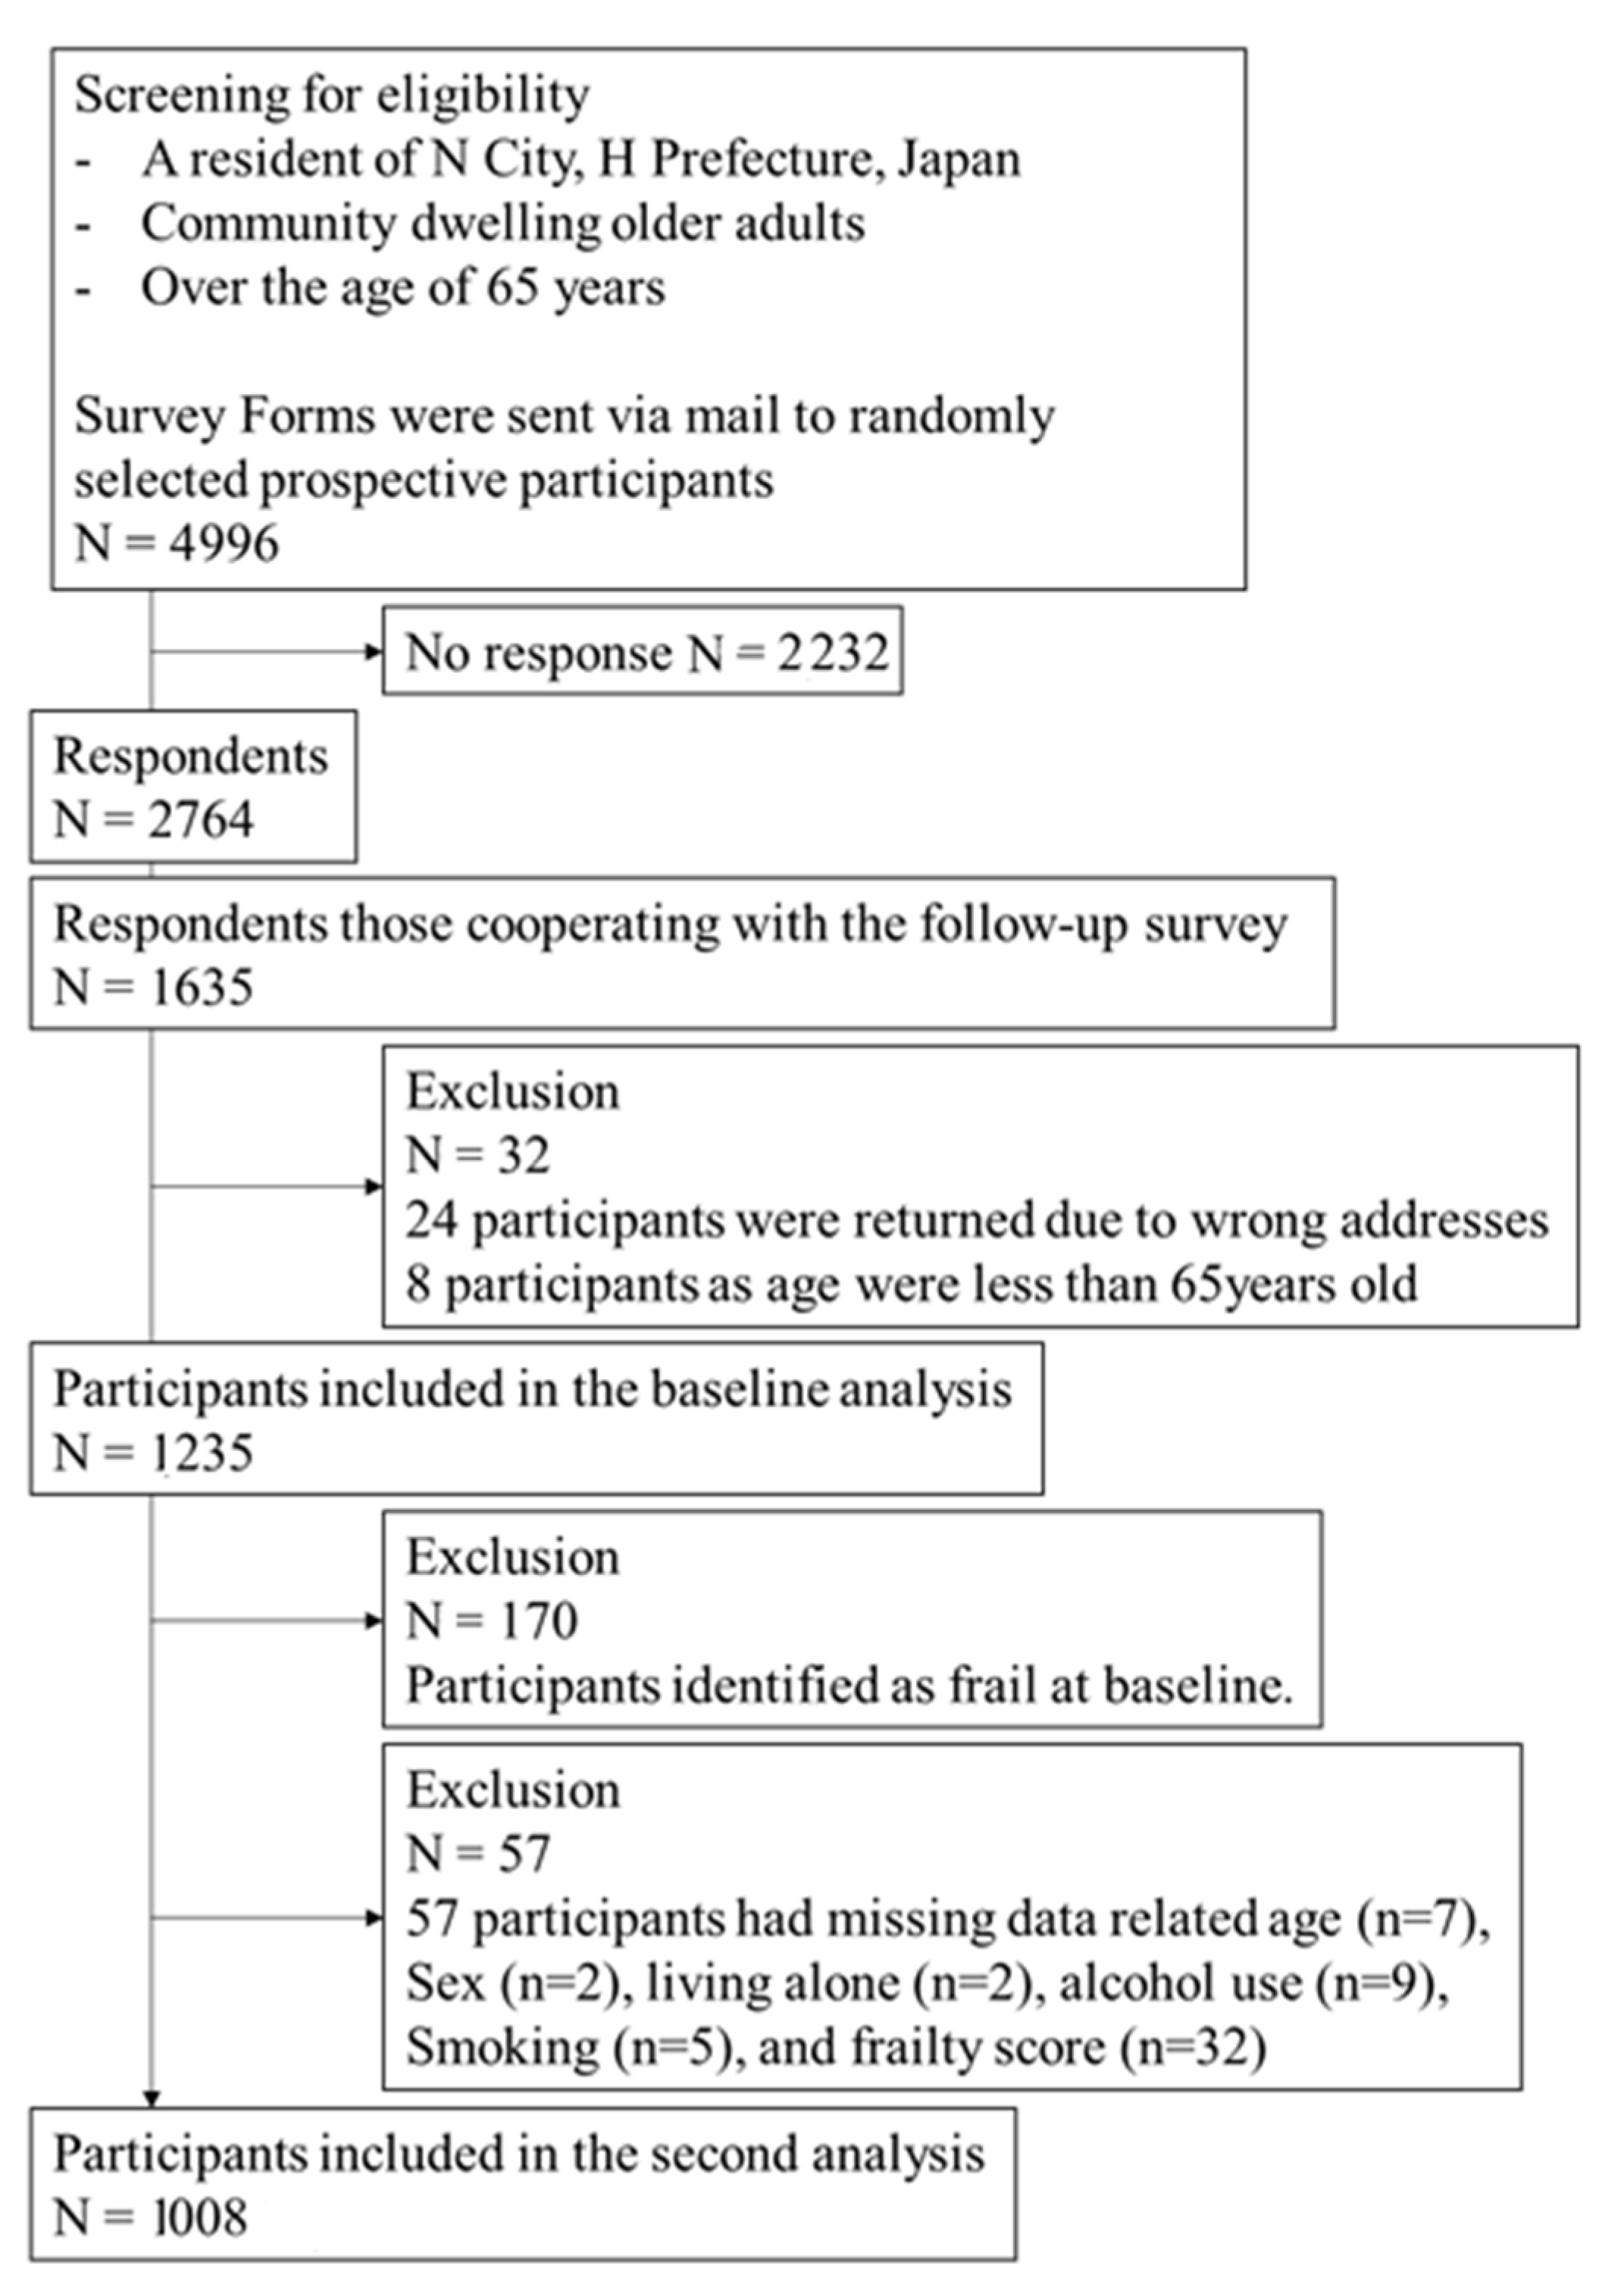
2.1. Study Subjects and Study Period
2.2. Ethical Approval
2.3. Survey Content
2.4. Dietary Variety Score
2.5. Frailty Score
2.6. Statistical Analysis
3. Results
4. Discussion
5. Conclusions
Author Contributions
Funding
Institutional Review Board Statement
Informed Consent Statement
Data Availability Statement
Acknowledgments
Conflicts of Interest
References
- WHO Coronavirus (COVID-19) Dashboard. who.int. Available online: https://covid19.who.int/ (accessed on 16 February 2023).
- Cabinet Office, Japan. Available online: https://www.mhlw.go.jp/stf/covid-19/seifunotorikumi.html (accessed on 7 September 2022).
- Ministry of Health, Labour and Welfare. Available online: https://www.mhlw.go.jp/content/10900000/000892287.pdf (accessed on 7 September 2022).
- Machida, M.; Nakamura, I.; Kojima, T.; Saito, R.; Nakaya, T.; Hanibuchi, T.; Takamiya, T.; Odagiri, Y.; Fukushima, N.; Kikuchi, H.; et al. Acceptance of a COVID-19 vaccine in Japan during the COVID-19 pandemic. Vaccines 2021, 9, 210. [Google Scholar] [CrossRef]
- Cabinet Office, Japan. Available online: https://corona.go.jp/news/ (accessed on 7 September 2022).
- Humphreys, G. In this month’s bulletin. Bull. World Health Organ. 2022, 100, 525. [Google Scholar] [CrossRef]
- Singhal, S.; Kumar, P.; Singh, S.; Saha, S.; Dey, A.B. Clinical features and outcomes of COVID-19 in older adults: A systematic review and meta-analysis. BMC Geriatr. 2021, 21, 321. [Google Scholar] [CrossRef]
- Guerrero, L.R.; Wallace, S.P. The impact of COVID-19 on diverse older adults and health equity in the United States. Front. Public Health 2021, 9, 661592. [Google Scholar] [CrossRef]
- Terada, M.; Ohtsu, H.; Saito, S.; Hayakawa, K.; Tsuzuki, S.; Asai, Y.; Matsunaga, N.; Kutsuna, S.; Sugiura, W.; Ohmagari, N. Risk factors for severity on admission and the disease progression during hospitalisation in a large cohort of patients with COVID-19 in Japan. BMJ Open 2021, 11, e047007. [Google Scholar] [CrossRef]
- Ministry of Health, Labour and Welfare, Japan. Available online: https://www.mhlw.go.jp/content/000788485.pdf (accessed on 7 September 2022).
- United Nations—Population Division. World Population Prospects 2017. Available online: https://population.un.org/wpp/ (accessed on 17 February 2019).
- Kojima, G.; Iliffe, S.; Walters, K. Frailty index as a predictor of mortality: A systematic review and meta-analysis. Age Ageing 2017, 47, 193–200. [Google Scholar] [CrossRef]
- Cheng, M.-H.; Chang, S.-F. Frailty as a risk factor for falls among community dwelling people: Evidence from a meta-analysis: Falls with frailty. J. Nurs. Sch. 2017, 49, 529–536. [Google Scholar] [CrossRef]
- Kojima, G. Frailty as a predictor of nursing home placement among community-dwelling older adults: A systematic review and meta-analysis. J. Geriatr. Phys. Ther. 2018, 41, 42–48. [Google Scholar] [CrossRef]
- Kojima, G. Frailty as a predictor of disabilities among community-dwelling older people: A systematic review and meta-analysis. Disabil. Rehabil. 2017, 39, 1897–1908. [Google Scholar] [CrossRef]
- O’Caoimh, R.; Sezgin, D.; O’Donovan, M.R.; Molloy, D.W.; Clegg, A.; Rockwood, K.; Liew, A. Prevalence of frailty in 62 countries across the world: A systematic review and meta-analysis of population-level studies. Age Ageing 2020, 50, 96–104. [Google Scholar] [CrossRef]
- Murayama, H.; Kobayashi, E.; Okamoto, S.; Fukaya, T.; Ishizaki, T.; Liang, J.; Shinkai, S. National prevalence of frailty in the older Japanese population: Findings from a nationally representative survey. Arch. Gerontol. Geriatr. 2020, 91, 104220. [Google Scholar] [CrossRef]
- Turner, J.; Hodgson, L.E.; Leckie, T.; Eade, L.; Ford-Dunn, S. A dual-center observational review of hospital-based palliative care in patients dying with COVID-19. J. Pain Symptom Manag. 2020, 60, e75–e78. [Google Scholar] [CrossRef]
- Miles, A.; Webb, T.E.; Mcloughlin, B.C.; Mannan, I.; Rather, A.; Knopp, P.; Davis, D. Outcomes from COVID-19 across the range of frailty: Excess mortality in fitter older people. Eur. Geriatr. Med. 2020, 11, 851–855. [Google Scholar] [CrossRef]
- Maltese, G.; Corsonello, A.; Di Rosa, M.; Soraci, L.; Vitale, C.; Corica, F.; Lattanzio, F. Frailty and COVID-19: A systematic scoping review. J. Clin. Med. 2020, 9, 2106. [Google Scholar] [CrossRef]
- Petermann-Rocha, F.; Hanlon, P.; Gray, S.R.; Welsh, P.; Gill, J.M.R.; Foster, H.; Katikireddi, S.V.; Lyall, D.; Mackay, D.F.; O’Donnell, C.A.; et al. Comparison of two different frailty measurements and risk of hospitalisation or death from COVID-19: Findings from UK biobank. BMC Med. 2020, 18, 355. [Google Scholar] [CrossRef]
- Mignogna, C.; Costanzo, S.; Ghulam, A.; Cerletti, C.; Donati, M.B.; de Gaetano, G.; Iacoviello, L.; Bonaccio, M. Impact of nationwide lockdowns resulting from the first wave of the COVID-19 pandemic on food intake, eating behaviors, and diet quality: A systematic review. Adv. Nutr. Int. Rev. J. 2021, 13, 388–423. [Google Scholar] [CrossRef]
- Lombardo, M.; Guseva, E.; Perrone, M.A.; Müller, A.; Rizzo, G.; Storz, M.A. Changes in eating habits and physical activity after COVID-19 pandemic lockdowns in Italy. Nutrients 2021, 13, 4522. [Google Scholar] [CrossRef]
- Jontez, N.B.; Novak, K.; Kenig, S.; Petelin, A.; Pražnikar, Z.J.; Mohorko, N. The impact of COVID-19-related lockdown on diet and serum markers in healthy adults. Nutrients 2021, 13, 1082. [Google Scholar] [CrossRef]
- Lamarche, B.; Brassard, D.; Lapointe, A.; Laramée, C.; Kearney, M.; Côté, M.; Bélanger-Gravel, A.; Desroches, S.; Lemieux, S.; Plante, C. Changes in diet quality and food security among adults during the COVID-19-related early lockdown: Results from NutriQuébec. Am. J. Clin. Nutr. 2021, 113, 984–992. [Google Scholar] [CrossRef]
- Weaver, R.H.; Jackson, A.; Lanigan, J.; Power, T.G.; Anderson, A.; Cox, A.E.; Eddy, L.; Parker, L.; Sano, Y.; Weybright, E. Health behaviors at the onset of the COVID-19 pandemic. Am. J. Health Behav. 2021, 45, 44–61. [Google Scholar] [CrossRef]
- Nicklett, E.J.; Johnson, K.E.; Troy, L.M.; Vartak, M.; Reiter, A. Food access, diet quality, and nutritional status of older adults during COVID-19: A scoping review. Front. Public Health 2021, 9, 763994. [Google Scholar] [CrossRef]
- Dicken, S.J.; Mitchell, J.J.; Le Vay, J.N.; Beard, E.; Kale, D.; Herbec, A.; Shahab, L. Impact of the COVID-19 pandemic on diet behaviour among UK adults: A longitudinal analysis of the HEBECO study. Front. Nutr. 2022, 8, 788043. [Google Scholar] [CrossRef]
- Struijk, E.A.; Hagan, K.A.; Fung, T.T.; Hu, F.B.; Rodríguez-Artalejo, F.; Lopez-Garcia, E. Diet quality and risk of frailty among older women in the nurses’ health study. Am. J. Clin. Nutr. 2020, 111, 877–883. [Google Scholar] [CrossRef]
- Zaslavsky, O.; Zelber-Sagi, S.; Hebert, J.R. Biomarker-calibrated nutrient intake and healthy diet index associations with mortality risks among older and frail women from the women’s health initiative. Am. J. Clin. Nutr. 2017, 105, 1399–1407. [Google Scholar] [CrossRef]
- Bernstein, M.A.; Tucker, K.L.; Ryan, N.D.; Oneill, E.; Clements, K.M.; Nelson, M.E.; Evans, W.J.; Fiataronesingh, M. Higher dietary variety is associated with better nutritional status in frail elderly people. J. Am. Diet. Assoc. 2002, 102, 1096–1104. [Google Scholar] [CrossRef]
- Foote, J.A.; Murphy, S.P.; Wilkens, L.R.; Basiotis, P.P.; Carlson, A. Dietary variety increases the probability of nutrient adequacy among adults. J. Nutr. 2004, 134, 1779–1785. [Google Scholar] [CrossRef]
- Yokoyama, Y.; Nishi, M.; Murayama, H.; Amano, H.; Taniguchi, Y.; Nofuji, Y.; Narita, M.; Matsuo, E.; Seino, S.; Kawano, Y.; et al. Association of dietary variety with body composition and physical function in community-dwelling elderly Japanese. J. Nutr. Health Aging 2016, 20, 691–696. [Google Scholar] [CrossRef]
- Yokoyama, Y.; Nishi, M.; Murayama, H.; Amano, H.; Taniguchi, Y.; Nofuji, Y.; Narita, M.; Matsuo, E.; Seino, S.; Kawano, Y.; et al. Dietary variety and decline in lean mass and physical performance in community-dwelling older Japanese: A 4-year follow-up study. J. Nutr. Health Aging 2017, 21, 11–16. [Google Scholar] [CrossRef]
- Tsuji, T.; Yamamoto, K.; Yamasaki, K.; Hayashi, F.; Momoki, C.; Yasui, Y.; Ohfuji, S.; Fukushima, W.; Habu, D. Lower dietary variety is a relevant factor for malnutrition in older Japanese home-care recipients: A cross-sectional study. BMC Geriatr. 2019, 19, 197. [Google Scholar] [CrossRef]
- Fukuhara, S.; Bito, S.; Green, J.; Hsiao, A.; Kurokawa, K. Translation, adaptation, and validation of the SF-36 health survey for use in Japan. J. Clin. Epidemiol. 1998, 51, 1037–1044. [Google Scholar] [CrossRef]
- Kumagai, S.; Watanabe, S.; Shibata, H.; Amano, H.; Fujiwara, Y.; Shinkai, S.; Yoshida, H.; Suzuki, T.; Yukawa, H.; Yasumura, S.; et al. Effects of dietary variety on declines in high-level functional capacity in elderly people living in a community. Nihon Koshu Eisei Zasshi 2003, 50, 1117–1124. [Google Scholar] [PubMed]
- Hu, F.B.; Stampfer, M.J.; Rimm, E.; Ascherio, A.; Rosner, B.A.; Spiegelman, D.; Willett, W.C. Dietary fat and coronary heart disease: A comparison of approaches for adjusting for total energy intake and modeling repeated dietary measurements. Am. J. Epidemiol. 1999, 149, 531–540. [Google Scholar] [CrossRef]
- Yamada, M.; Arai, H. Predictive value of frailty scores for healthy life expectancy in community-dwelling older Japanese adults. J. Am. Med. Dir. Assoc. 2015, 16, 1002.e7–1002.e11. [Google Scholar] [CrossRef] [PubMed]
- Hanlon, P.; Nicholl, B.I.; Jani, B.D.; Lee, D.; McQueenie, R.; Mair, F.S. Frailty and pre-frailty in middle-aged and older adults and its association with multimorbidity and mortality: A prospective analysis of 493 737 UK Biobank participants. Lancet Public Health 2018, 3, e323–e332. [Google Scholar] [CrossRef]
- Theou, O.; Blodgett, J.M.; Godin, J.; Rockwood, K. Association between sedentary time and mortality across levels of frailty. CMAJ 2017, 189, E1056–E1064. [Google Scholar] [CrossRef]
- Ofori-Asenso, R.; Chin, K.L.; Mazidi, M.; Zomer, E.; Ilomaki, J.; Zullo, A.R.; Gasevic, D.; Ademi, Z.; Korhonen, M.J.; LoGiudice, D.; et al. Global incidence of frailty and prefrailty among community-dwelling older adults. JAMA Netw. Open 2019, 2, e198398. [Google Scholar] [CrossRef]
- Otaki, N.; Yano, M.; Yokoro, M.; Tanino, N.; Fukuo, K. Relationship between dietary variety and frailty in older Japanese women during the period of restriction on outings due to COVID-19. J Gerontol. B Psychol. Sci. Soc. Sci. 2020, 76, e256–e262. [Google Scholar] [CrossRef]
- Shinohara, T.; Saida, K.; Tanaka, S.; Murayama, A. Association between frailty and changes in lifestyle and physical or psychological conditions among older adults affected by the coronavirus disease 2019 countermeasures in Japan. Geriatr. Gerontol. Int. 2021, 21, 39–42. [Google Scholar] [CrossRef]
- Visser, M.; Schaap, L.A.; Wijnhoven, H.A.H. Self-reported impact of the COVID-19 pandemic on nutrition and physical activity behaviour in dutch older adults living independently. Nutrients 2020, 12, 3708. [Google Scholar] [CrossRef]
- Mattioli, A.V.; Ballerini, P.M.; Nasi, M.; Farinetti, A. COVID-19 pandemic: The effects of quarantine on cardiovascular risk. Eur J. Clin. Nutr. 2020, 74, 852–855. [Google Scholar] [CrossRef]
- McEvoy, C.T.; Moore, S.E.; Appleton, K.M.; Cupples, M.E.; Erwin, C.; Kee, F.; Prior, L.; Young, I.S.; McKinley, M.C.; Woodside, J.V. Development of a peer support intervention to encourage dietary behaviour change towards a Mediterranean diet in adults at high cardiovascular risk. BMC Public Health 2018, 18, 1194. [Google Scholar] [CrossRef]
- Barrera, M., Jr.; Toobert, D.J.; Angell, K.L.; Glasgow, R.E.; MacKinnon, D.P. Social support and social-ecological resources as mediators of lifestyle intervention effects for type 2 diabetes. J. Health Psychol. 2006, 11, 483–495. [Google Scholar] [CrossRef]
- Barrera, M.; Strycker, L.A.; MacKinnon, D.P.; Toobert, D.J. Social-ecological resources as mediators of two-year diet and physical activity outcomes in type 2 diabetes patients. Health Psychol. 2008, 27, S118–S125. [Google Scholar] [CrossRef]
- PPieroth, R.; Rigassio Radler, D.; Guenther, P.M.; Brewster, P.J.; Marcus, A. The relationship between social support and diet quality in middle-aged and older adults in the United States. J. Acad. Nutr. Diet. 2017, 117, 1272–1278. [Google Scholar] [CrossRef]
- Ceravolo, M.G.; Arienti, C.; de Sire, A. Rehabilitation and COVID-19: The Cochrane Rehabilitation 2020 rapid living systematic review. Eur. J. Phys. Rehabil. Med. 2020, 56, 642–651. [Google Scholar] [CrossRef] [PubMed]
- Ceravolo, M.G.; De Sire, A.; Andrenelli, E.; Negrini, F.; Negrini, S. Systematic rapid "living" review on rehabilitation needs due to COVID-19: Update to 31 March 2020. Eur. J. Phys. Rehabil. Med. 2020, 56, 347–353. [Google Scholar] [CrossRef] [PubMed]
- Conklin, A.I.; Forouhi, N.G.; Surtees, P.; Khaw, K.-T.; Wareham, N.J.; Monsivais, P. Social relationships and healthful dietary behaviour: Evidence from over-50s in the EPIC cohort, UK. Soc. Sci. Med. 2014, 100, 167–175. [Google Scholar] [CrossRef]


| All Subject n = 1008 | Non-Frail Subject n = 895 | Frailty Subject + n = 113 | p Value | |||||
|---|---|---|---|---|---|---|---|---|
| n or Mean | Percent or SD | n or Mean | Percent or SD | n or Mean | Percent or SD | |||
| Sex | Men | 476 | 47.2 | 421 | 47.0 | 55 | 48.7 | 0.829 |
| Female | 532 | 52.8 | 474 | 53.0 | 58 | 51.3 | ||
| Age | (years) | 73.8 | (5.7) | 73.6 | (5.7) | 75.4 | (6.0) | 0.002 |
| Height | (m) | 1.60 | (0.08) | 1.60 | (0.08) | 1.60 | (0.08) | 0.771 |
| Body weight | (kg) | 58.2 | (10.4) | 58.0 | (10.3) | 59.0 | (11.3) | 0.364 |
| Body mass index | (kg/m2) | 22.5 | (2.9) | 22.5 | (2.9) | 22.9 | (3.0) | 0.244 |
| Living alone | Others | 815 | 80.9 | 719 | 80.3 | 96 | 85.0 | 0.257 |
| Living alone | 193 | 19.1 | 176 | 19.7 | 17 | 15.0 | ||
| Alcohol intake | Not drinking | 491 | 48.8 | 429 | 47.9 | 62 | 54.9 | 0.327 |
| Drinking | 517 | 51.2 | 466 | 52.1 | 51 | 45.1 | ||
| Smoking status | Non-smokers | 625 | 62.0 | 558 | 62.3 | 67 | 59.3 | 0.821 |
| Past smokers | 318 | 31.5 | 280 | 31.3 | 38 | 33.6 | ||
| Current Smokers | 65 | 6.4 | 57 | 6.4 | 8 | 7.1 | ||
| History of disorders | Cancer | 53 | 5.3 | 45 | 5.0 | 8 | 7.1 | 0.368 |
| Cardiovascular diseases | 110 | 10.9 | 94 | 10.5 | 16 | 14.2 | 0.261 | |
| Cerebrovascular diseases | 14 | 1.4 | 10 | 1.1 | 4 | 3.5 | 0.062 | |
| Hypertension | 356 | 35.3 | 314 | 35.1 | 42 | 37.2 | 0.677 | |
| Diabetes | 125 | 12.4 | 102 | 11.4 | 23 | 20.4 | 0.010 | |
| Hyperlipidemia | 112 | 11.1 | 107 | 12.0 | 5 | 4.4 | 0.016 | |
| Dietary Variety Score | 4.35 | 1.93 | 4.39 | 1.94 | 4.01 | 1.86 | 0.048 | |
| Frailty score | baseline | 1.05 | 0.77 | 0.99 | 0.77 | 1.57 | 0.57 | Time × group |
| One-year follow-up | 1.04 | 0.77 | 1.03 | 0.77 | 3.12 | 0.32 | p < 0.001 | |
| All Subjects | Non-Frailty Subjects | Frailty Subjects + | ||||||||||||||
|---|---|---|---|---|---|---|---|---|---|---|---|---|---|---|---|---|
| n = 1008 | n = 895 | n = 113 | ||||||||||||||
| Baseline | One-Year After | p Value * | Baseline | One-Year After | p Value | Baseline | One-Year After | p Value | ||||||||
| n | (%) | n | (%) | n | (%) | n | (%) | n | (%) | n | (%) | |||||
| Meat | Less than 3 times per week | 577 | 57.2 | 586 | 58.1 | 0.616 | 519 | 58.0 | 516 | 57.7 | 0.895 | 58 | 51.3 | 70 | 61.9 | 0.031 |
| Everyday | 431 | 42.8 | 422 | 41.9 | 376 | 42.0 | 379 | 42.8 | 55 | 48.7 | 43 | 38.1 | ||||
| Fish | Less than 3 times per week | 825 | 81.8 | 840 | 83.3 | 0.258 | 733 | 81.9 | 743 | 83.0 | 0.440 | 92 | 81.4 | 97 | 85.8 | 0.332 |
| Everyday | 183 | 18.2 | 168 | 16.7 | 162 | 18.1 | 152 | 17.0 | 21 | 18.6 | 16 | 14.2 | ||||
| Egg | Less than 3 times per week | 517 | 51.3 | 501 | 49.7 | 0.314 | 444 | 49.6 | 437 | 48.8 | 0.703 | 73 | 64.6 | 64 | 56.6 | 0.078 |
| Everyday | 491 | 48.7 | 507 | 50.3 | 451 | 50.4 | 458 | 51.2 | 40 | 35.4 | 49 | 43.4 | ||||
| Soy and Soy products | Less than 3 times per week | 535 | 53.1 | 560 | 55.6 | 0.119 | 470 | 52.5 | 484 | 54.1 | 0.370 | 65 | 57.5 | 76 | 67.3 | 0.054 |
| Everyday | 473 | 46.9 | 448 | 44.4 | 425 | 47.5 | 411 | 45.9 | 48 | 42.5 | 37 | 32.7 | ||||
| Milk and daily products | Less than 3 times per week | 215 | 21.3 | 242 | 24.0 | 0.032 | 189 | 21.1 | 210 | 23.5 | 0.076 | 26 | 23.0 | 32 | 28.3 | 0.263 |
| Everyday | 793 | 78.7 | 766 | 76.0 | 706 | 78.9 | 685 | 76.5 | 87 | 77.0 | 81 | 71.7 | ||||
| Seaweeds | Less than 3 times per week | 838 | 83.1 | 856 | 84.9 | 0.086 | 744 | 83.1 | 763 | 85.3 | 0.054 | 94 | 83.2 | 93 | 82.3 | 1.000 |
| Everyday | 170 | 16.9 | 152 | 15.1 | 151 | 16.9 | 132 | 14.7 | 19 | 16.8 | 20 | 17.7 | ||||
| Colored vegetables | Less than 3 times per week | 329 | 32.6 | 339 | 33.6 | 0.536 | 282 | 31.5 | 297 | 33.2 | 0.306 | 47 | 41.6 | 42 | 37.2 | 0.424 |
| Everyday | 616 | 67.4 | 669 | 66.4 | 613 | 68.5 | 598 | 66.8 | 66 | 58.4 | 71 | 62.8 | ||||
| Fruits | Less than 3 times per week | 392 | 38.9 | 384 | 38.1 | 656 | 346 | 38.7 | 334 | 37.3 | 0.425 | 46 | 40.7 | 50 | 44.2 | 0.541 |
| Everyday | 616 | 61.1 | 624 | 61.9 | 549 | 61.3 | 561 | 62.7 | 67 | 59.3 | 63 | 55.8 | ||||
| Potatoes | Less than 3 times per week | 908 | 90.1 | 918 | 91.1 | 0.395 | 805 | 89.9 | 814 | 90.9 | 0.426 | 103 | 91.2 | 104 | 92.0 | 1.000 |
| Everyday | 100 | 9.9 | 90 | 8.9 | 90 | 10.1 | 81 | 9.1 | 10 | 8.8 | 9 | 8.0 | ||||
| Oils | Less than 3 times per week | 538 | 53.4 | 558 | 55.4 | 0.182 | 475 | 53.1 | 496 | 55.4 | 0.136 | 63 | 55.8 | 62 | 54.9 | 1.000 |
| Everyday | 470 | 46.6 | 450 | 44.6 | 420 | 46.9 | 399 | 44.6 | 50 | 44.2 | 51 | 45.1 | ||||
| B | 95% CI | p Value | |||
|---|---|---|---|---|---|
| Lower | Upper | ||||
| Men | |||||
| Crude | −0.047 | −0.093 | −0.002 | 0.042 | |
| Model 1a | −0.068 | −0.114 | −0.023 | 0.003 | |
| Model 2b | −0.059 | −0.104 | −0.013 | 0.012 | |
| Female | |||||
| Crude | −0.022 | −0.068 | 0.023 | 0.338 | |
| Model 1a | −0.034 | −0.080 | 0.012 | 0.143 | |
| Model 2b | −0.027 | −0.075 | 0.020 | 0.258 | |
| High, 6 Points or More | Mid, 3 Points or More and Less than 6 Points | Low, Less than 3 Points | ptrend | |||||
|---|---|---|---|---|---|---|---|---|
| n or Mean | Percent or SD | n or Mean | Percent or SD | n or Mean | Percent or SD | |||
| Sex | Men | 80 | 33.1 | 213 | 44.6 | 183 | 63.5 | p < 0.001 |
| Female | 162 | 66.9 | 265 | 55.4 | 105 | 36.5 | ||
| Age | (years) | 74.5 | (6.0) | 74.2 | (5.7) | 72.6 | (5.4) | p < 0.001 |
| Height | (m) | 158.5 | (8.0) | 159.9 | (8.6) | 162.3 | (8.2) | p < 0.001 |
| Body weight | (kg) | 54.8 | (9.6) | 57.9 | (9.8) | 61.4 | (11.0) | p < 0.001 |
| Body mass index | (kg/m2) | 21.7 | (2.7) | 22.5 | (2.7) | 23.2 | (3.3) | p < 0.001 |
| Living alone | Others | 193 | 79.8 | 384 | 80.3 | 238 | 82.6 | 0.388 |
| Living alone | 49 | 20.2 | 94 | 19.7 | 50 | 17.4 | ||
| Alcohol intake | Not drinking | 129 | 53.3 | 241 | 50.4 | 121 | 42.0 | p < 0.001 |
| Drinking | 113 | 46.7 | 237 | 49.6 | 167 | 58.0 | ||
| Smoking status | Non-smokers | 182 | 75.2 | 308 | 64.4 | 135 | 46.9 | p < 0.001 |
| Past smokers | 52 | 21.5 | 150 | 31.4 | 116 | 40.3 | ||
| Current Smokers | 8 | 3.3 | 20 | 4.2 | 37 | 12.8 | ||
| History of disorders | Cancer | 10.0 | 4.1 | 27.0 | 5.6 | 16.0 | 5.6 | 0.485 |
| Cardiovascular diseases | 21 | 8.7 | 49 | 10.3 | 40 | 13.9 | 0.051 | |
| Cerebrovascular diseases | 2 | 0.8 | 7 | 1.5 | 5 | 1.7 | 0.380 | |
| Hypertension | 56 | 23.1 | 189 | 39.5 | 111 | 38.5 | p < 0.001 | |
| Diabetes | 22 | 9.1 | 70 | 14.6 | 33 | 11.5 | 0.485 | |
| Hyperlipidemia | 32 | 13.2 | 52 | 10.9 | 28 | 9.7 | 0.207 | |
| Frailty score | One-year follow-up | 1.2 | (1.0) | 1.3 | (1.0) | 1.4 | (1.0) | 0.036 |
| High, 6 Points or More | Mid, 3 Points or More and Less than 6 Points | Low, Less than 3 Points | |||||||
|---|---|---|---|---|---|---|---|---|---|
| Ref | OR | 95% CI | p Value | OR | 95% CI | p Value | |||
| Lower | Upper | Lower | Upper | ||||||
| Case subjects/subjects (%) | 21/221 (8.7%) | 53/478 (11.1%) | 31/249 (13.5%) | ||||||
| Crude Odds ratio | 1.000 | 1.312 | 0.772 | 2.232 | 0.316 | 1.648 | 0.941 | 2.887 | 0.081 |
| Model A | 1.000 | 1.355 | 0.793 | 2.316 | 0.267 | 1.911 | 1.066 | 3.426 | 0.030 |
| Model B | 1.000 | 1.294 | 0.749 | 2.236 | 0.356 | 1.877 | 1.034 | 3.409 | 0.039 |
| All Subjects | Non-Frailty | Frailty | p Value | |||||
|---|---|---|---|---|---|---|---|---|
| n = 1008 | n = 895 | n = 113 | ||||||
| n | (%) | n | (%) | n | (%) | |||
| Hindered frequency of participation in social organizations | 0.024 | |||||||
| Not at all | 40 | 4.3 | 40 | 4.5 | 40 | 2.7 | ||
| Very little or somewhat | 262 | 26.0 | 244 | 27.3 | 18 | 15.9 | ||
| Quite a bit or extremely | 394 | 39.1 | 350 | 39.1 | 44 | 38.9 | ||
| Could not do social activity | 105 | 10.4 | 92 | 10.3 | 13 | 11.5 | ||
| No participation in social activities | 197 | 19.5 | 162 | 18.1 | 35 | 31.0 | ||
| Missing value | 7 | 0.7 | 7 | 0.8 | ||||
| Hindered frequency of interaction | ||||||||
| With family | 0.477 | |||||||
| Not at all | 84 | 8.3 | 73 | 8.2 | 11 | 9.7 | ||
| Very little or somewhat | 371 | 36.8 | 336 | 37.5 | 35 | 31.0 | ||
| Quite a bit or extremely | 532 | 52.8 | 469 | 52.4 | 63 | 55.8 | ||
| No separated family or relatives. | 20 | 2.0 | 16 | 1.8 | 4 | 3.5 | ||
| Missing value | 1 | 0.1 | 1 | 0.1 | ||||
| With friends | 0.605 | |||||||
| Not at all | 53 | 5.3 | 48 | 5.4 | 5 | 4.4 | ||
| Very little or somewhat | 308 | 30.6 | 275 | 30.7 | 33 | 29.2 | ||
| Quite a bit or extremely | 593 | 58.8 | 528 | 59.0 | 65 | 57.5 | ||
| No friends | 53 | 5.3 | 43 | 4.8 | 10 | 4.8 | ||
| Missing value | 1 | 0.1 | 1 | |||||
| Hindered frequency of contact | ||||||||
| With family | 0.142 | |||||||
| Not at all | 503 | 49.9 | 459 | 51.3 | 44 | 38.9 | ||
| Very little or somewhat | 374 | 37.1 | 328 | 36.6 | 46 | 40.7 | ||
| Quite a bit or extremely | 109 | 10.8 | 91 | 10.2 | 18 | 15.9 | ||
| No separated family or relatives. | 21 | 2.1 | 17 | 1.9 | 4 | 3.5 | ||
| Missing value | 1 | 0.1 | 1 | 0.9 | ||||
| With friends | 0.357 | |||||||
| Not at all | 349 | 34.6 | 316 | 35.3 | 33 | 29.2 | ||
| Very little or somewhat | 406 | 40.3 | 359 | 40.1 | 47 | 41.6 | ||
| Quite a bit or extremely | 200 | 19.8 | 176 | 19.7 | 24 | 21.2 | ||
| No friends | 51 | 5.1 | 42 | 4.7 | 9 | 8.0 | ||
| Missing value | 2 | 0.2 | 2 | 0.2 | ||||
Disclaimer/Publisher’s Note: The statements, opinions and data contained in all publications are solely those of the individual author(s) and contributor(s) and not of MDPI and/or the editor(s). MDPI and/or the editor(s) disclaim responsibility for any injury to people or property resulting from any ideas, methods, instructions or products referred to in the content. |
© 2023 by the authors. Licensee MDPI, Basel, Switzerland. This article is an open access article distributed under the terms and conditions of the Creative Commons Attribution (CC BY) license (https://creativecommons.org/licenses/by/4.0/).
Share and Cite
Yokoro, M.; Otaki, N.; Yano, M.; Imamura, T.; Tanino, N.; Fukuo, K. Low Dietary Variety Is Associated with Incident Frailty in Older Adults during the Coronavirus Disease 2019 Pandemic: A Prospective Cohort Study in Japan. Nutrients 2023, 15, 1145. https://doi.org/10.3390/nu15051145
Yokoro M, Otaki N, Yano M, Imamura T, Tanino N, Fukuo K. Low Dietary Variety Is Associated with Incident Frailty in Older Adults during the Coronavirus Disease 2019 Pandemic: A Prospective Cohort Study in Japan. Nutrients. 2023; 15(5):1145. https://doi.org/10.3390/nu15051145
Chicago/Turabian StyleYokoro, Miyuki, Naoto Otaki, Megumu Yano, Tomomi Imamura, Norikazu Tanino, and Keisuke Fukuo. 2023. "Low Dietary Variety Is Associated with Incident Frailty in Older Adults during the Coronavirus Disease 2019 Pandemic: A Prospective Cohort Study in Japan" Nutrients 15, no. 5: 1145. https://doi.org/10.3390/nu15051145
APA StyleYokoro, M., Otaki, N., Yano, M., Imamura, T., Tanino, N., & Fukuo, K. (2023). Low Dietary Variety Is Associated with Incident Frailty in Older Adults during the Coronavirus Disease 2019 Pandemic: A Prospective Cohort Study in Japan. Nutrients, 15(5), 1145. https://doi.org/10.3390/nu15051145