
Association between Vitamin D and Short-Term Functional Outcomes in Acute Ischemic Stroke


Abstract
:1. Introduction
2. Materials and Methods
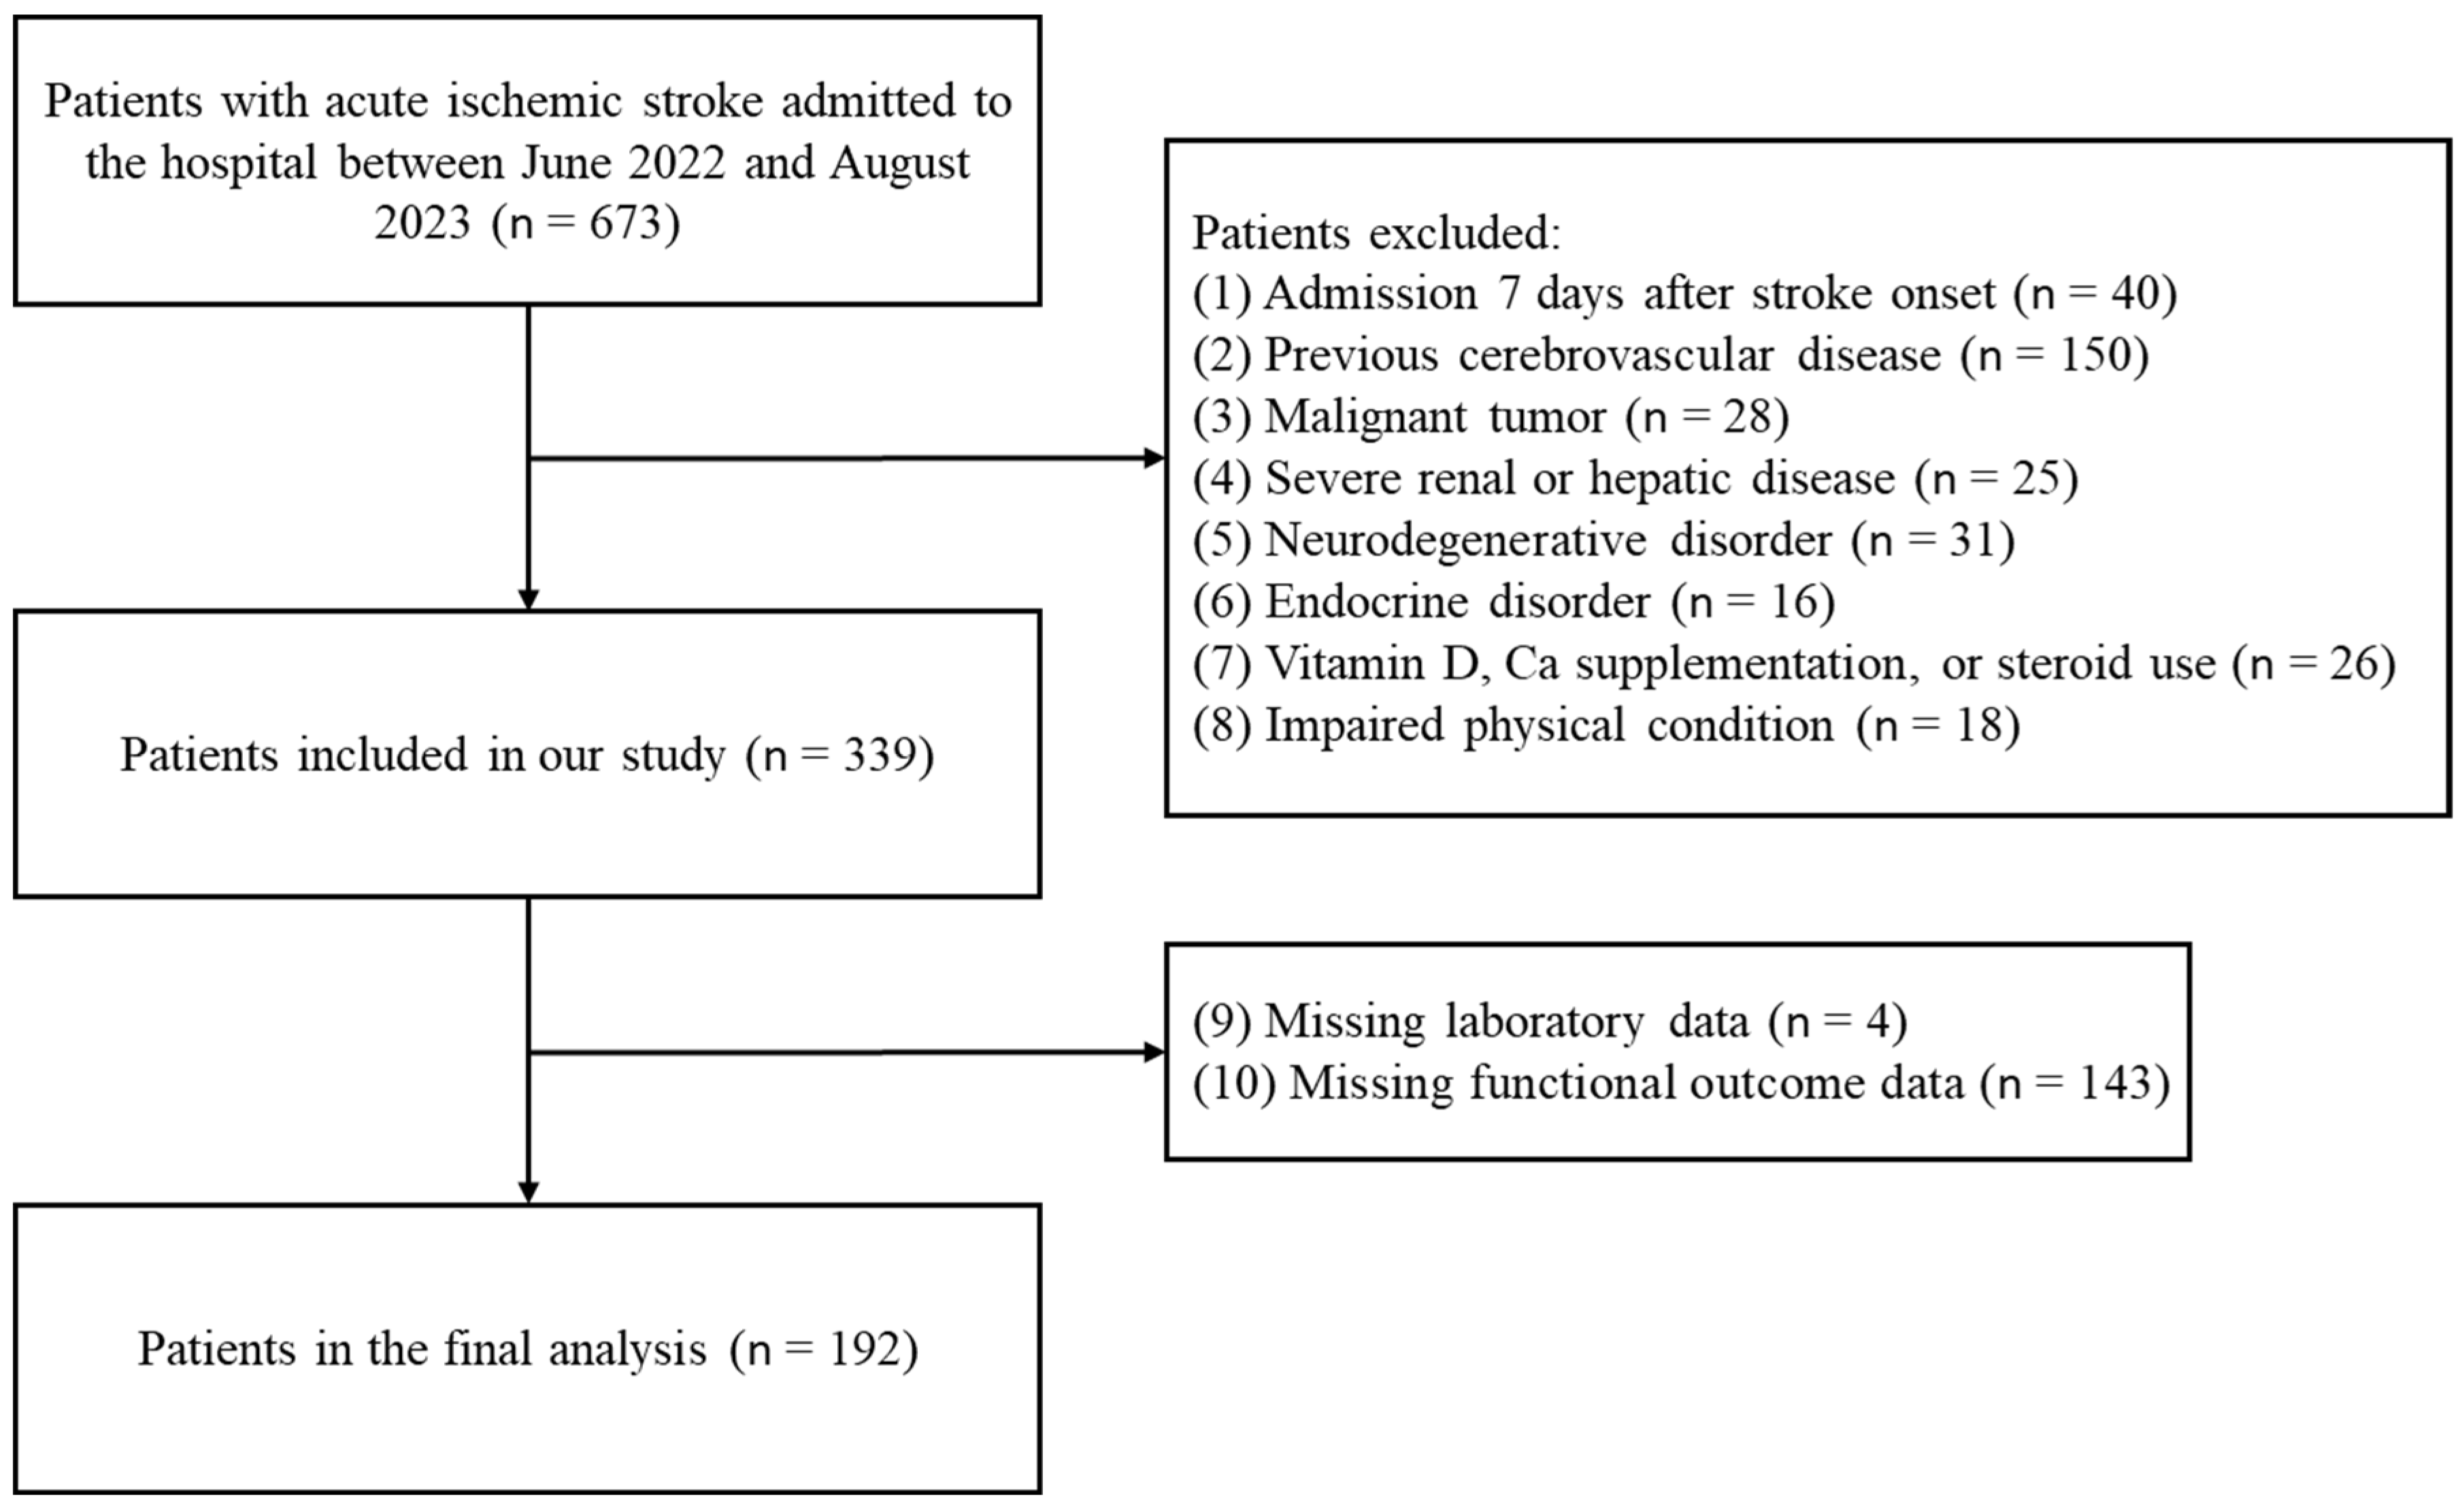
2.1. Study Population and Design
2.2. Outcome Measurements
2.3. Statistical Analysis
3. Results
4. Discussion
5. Conclusions
Author Contributions
Funding
Institutional Review Board Statement
Informed Consent Statement
Data Availability Statement
Conflicts of Interest
References
- Gorelick, P.B. The global burden of stroke: Persistent and disabling. Lancet Neurol. 2019, 18, 417–418. [Google Scholar] [CrossRef] [PubMed]
- Pu, L.; Wang, L.; Zhang, R.; Zhao, T.; Jiang, Y.; Han, L. Projected Global Trends in Ischemic Stroke Incidence, Deaths and Disability-Adjusted Life Years from 2020 to 2030. Stroke 2023, 54, 1330–1339. [Google Scholar] [CrossRef] [PubMed]
- Edwardson, M.A.; Dromerick, A.; Kasner, S.; Dashe, J. Ischemic Stroke Prognosis in Adults. 2017. Available online: https://www.uptodate.com/contents/ischemic-stroke-prognosis-in-adults (accessed on 15 December 2016).
- Montellano, F.A.; Ungethüm, K.; Ramiro, L.; Nacu, A.; Hellwig, S.; Fluri, F.; Whiteley, W.N.; Bustamante, A.; Montaner, J.; Heuschmann, P.U. Role of blood-based biomarkers in ischemic stroke prognosis: A systematic review. Stroke 2021, 52, 543–551. [Google Scholar] [CrossRef] [PubMed]
- Oh, B.-M. A path to precision medicine: Incorporating blood-based biomarkers in stroke rehabilitation. Ann. Rehabil. Med. 2021, 45, 341–344. [Google Scholar] [CrossRef]
- Voulgaridou, G.; Papadopoulou, S.K.; Detopoulou, P.; Tsoumana, D.; Giaginis, C.; Kondyli, F.S.; Lymperaki, E.; Pritsa, A. Vitamin D and calcium in osteoporosis, and the role of bone turnover markers: A narrative review of recent data from RCTs. Diseases 2023, 11, 29. [Google Scholar] [CrossRef]
- Gezen-Ak, D.; Alaylıoğlu, M.; Yurttaş, Z.; Çamoğlu, T.; Şengül, B.; İşler, C.; Kına, Ü.Y.; Keskin, E.; Atasoy, İ.L.; Kafardar, A.M. Vitamin D receptor regulates transcription of mitochondrial DNA and directly interacts with mitochondrial DNA and TFAM. J. Nutr. Biochem. 2023, 116, 109322. [Google Scholar] [CrossRef]
- Wiciński, M.; Adamkiewicz, D.; Adamkiewicz, M.; Śniegocki, M.; Podhorecka, M.; Szychta, P.; Malinowski, B. Impact of vitamin D on physical efficiency and exercise performance—A review. Nutrients 2019, 11, 2826. [Google Scholar] [CrossRef]
- Cui, X.; Eyles, D.W. Vitamin D and the central nervous system: Causative and preventative mechanisms in brain disorders. Nutrients 2022, 14, 4353. [Google Scholar] [CrossRef]
- Marek, K.; Cichoń, N.; Saluk-Bijak, J.; Bijak, M.; Miller, E. The role of vitamin D in stroke prevention and the effects of its supplementation for post-stroke rehabilitation: A narrative review. Nutrients 2022, 14, 2761. [Google Scholar] [CrossRef]
- Wajda, J.; Świat, M.; Owczarek, A.J.; Brzozowska, A.; Olszanecka-Glinianowicz, M.; Chudek, J. Severity of vitamin D deficiency predicts mortality in ischemic stroke patients. Dis. Markers 2019, 2019, 3652894. [Google Scholar] [CrossRef]
- Hung, K.-C.; Wu, J.-Y.; Illias, A.M.; Chiu, C.-C.; Chang, Y.-J.; Liao, S.-W.; Wang, K.-F.; Chen, I.-W.; Sun, C.-K. Association of a low vitamin D status with risk of post-stroke depression: A meta-analysis and systematic review. Front. Nutr. 2023, 10, 1142035. [Google Scholar] [CrossRef] [PubMed]
- Huang, G.-Q.; Cheng, H.-R.; Wu, Y.-M.; Cheng, Q.-Q.; Wang, Y.-M.; Fu, J.-L.; Zhou, H.-X.; Wang, Z. Reduced vitamin D levels are associated with stroke-associated pneumonia in patients with acute ischemic stroke. Clin. Interv. Aging 2019, 14, 2305–2314. [Google Scholar] [CrossRef] [PubMed]
- Lasoń, W.; Jantas, D.; Leśkiewicz, M.; Regulska, M.; Basta-Kaim, A. Vitamin D3 and Ischemic Stroke: A Narrative Review. Antioxidants 2022, 11, 2120. [Google Scholar] [CrossRef] [PubMed]
- Chen, H.; Liu, Y.; Huang, G.; Zhu, J.; Feng, W.; He, J. Association between vitamin D status and cognitive impairment in acute ischemic stroke patients: A prospective cohort study. Clin. Interv. Aging 2018, 13, 2503–2509. [Google Scholar] [CrossRef]
- Yalbuzdag, S.A.; Sarifakioglu, B.; Afsar, S.I.; Celik, C.; Can, A.; Yegin, T.; Senturk, B.; Guzelant, A.Y. Is 25 (OH) D associated with cognitive impairment and functional improvement in stroke? A retrospective clinical study. J. Stroke Cerebrovasc. Dis. 2015, 24, 1479–1486. [Google Scholar] [CrossRef] [PubMed]
- Yew, K.S.; Cheng, E.J.A.f.p. Acute stroke diagnosis. Am. Fam. Physician 2009, 80, 33. [Google Scholar]
- Chen, W.-C.; Hsiao, M.-Y.; Wang, T.-G.J.J.o.t.F.M.A. Prognostic factors of functional outcome in post-acute stroke in the rehabilitation unit. J. Formos. Med Assoc. 2022, 121, 670–678. [Google Scholar] [CrossRef]
- Trollfors, B. Ethnicity, gender and seasonal variations all play a role in vitamin D deficiency. Acta Paediatr. 2022, 111, 1596–1602. [Google Scholar] [CrossRef]
- Herrmann, M.; Farrell, C.-J.L.; Pusceddu, I.; Fabregat-Cabello, N.; Cavalier, E. Assessment of vitamin D status—A changing landscape. Clin. Chem. Lab. Med. 2017, 55, 3–26. [Google Scholar] [CrossRef]
- Holick, M.F. Vitamin D status: Measurement, interpretation, and clinical application. Ann. Epidemiol. 2009, 19, 73–78. [Google Scholar] [CrossRef]
- Sempos, C.T.; Heijboer, A.C.; Bikle, D.D.; Bollerslev, J.; Bouillon, R.; Brannon, P.M.; DeLuca, H.F.; Jones, G.; Munns, C.F.; Bilezikian, J.P. Vitamin D assays and the definition of hypovitaminosis D: Results from the First International Conference on Controversies in Vitamin D. Br. J. Clin. Pharmacol. 2018, 84, 2194–2207. [Google Scholar] [CrossRef] [PubMed]
- Topçuoğlu, C.; Sezer, S.; Yılmaz, F.M.; Kösem, A.; Ercan, M.; Turhan, T. Evaluation of the analytical performance of the Beckman Coulter Unicel DXI 800 Access Total 25 (OH) Vitamin D immunoassay. J. Lab. Med. 2018, 42, 205–211. [Google Scholar] [CrossRef]
- Amrein, K.; Scherkl, M.; Hoffmann, M.; Neuwersch-Sommeregger, S.; Köstenberger, M.; Tmava Berisha, A.; Martucci, G.; Pilz, S.; Malle, O. Vitamin D deficiency 2.0: An update on the current status worldwide. Med. J. Clin. Endocrinol. Metab. 2020, 74, 1498–1513. [Google Scholar] [CrossRef] [PubMed]
- Holick, M.F.; Binkley, N.C.; Bischoff-Ferrari, H.A.; Gordon, C.M.; Hanley, D.A.; Heaney, R.P.; Murad, M.H.; Weaver, C.M. Evaluation, treatment, and prevention of vitamin D deficiency: An Endocrine Society clinical practice guideline. Med. J. Clin. Endocrinol. Metab. 2011, 96, 1911–1930. [Google Scholar] [CrossRef] [PubMed]
- Lyden, P. Using the national institutes of health stroke scale: A cautionary tale. Stroke 2017, 48, 513–519. [Google Scholar] [CrossRef] [PubMed]
- Kogan, E.; Twyman, K.; Heap, J.; Milentijevic, D.; Lin, J.H.; Alberts, M. Assessing stroke severity using electronic health record data: A machine learning approach. BMC Med. Inform. Decis. Mak. 2020, 20, 8. [Google Scholar] [CrossRef]
- Miranda-Cantellops, N.; Tiu, T.K. Berg Balance Testing; StatPearls Publishing: Treasure Island, FL, USA, 2021. [Google Scholar]
- Miyamoto, S.; Kondo, T.; Suzukamo, Y.; Michimata, A.; Izumi, S.-I. Reliability and validity of the Manual Function Test in patients with stroke. Am. J. Phys. Med. Rehabil. 2009, 88, 247–255. [Google Scholar] [CrossRef]
- Kang, I.-W.; Beom, I.-G.; Cho, J.-Y.; Son, H.-R. Accuracy of Korean-mini-mental status examination based on Seoul neuro-psychological screening battery II results. Korean J. Fam. Med. 2016, 37, 177. [Google Scholar] [CrossRef]
- Jung, H.Y.; Park, B.K.; Shin, H.S.; Kang, Y.K.; Pyun, S.B.; Paik, N.J.; Kim, S.H.; Kim, T.H.; Han, T.R. Development of the Korean version of Modified Barthel Index (K-MBI): Multi-center study for subjects with stroke. J. Korean Acad. Rehabil. Med. 2007, 31, 283–297. [Google Scholar]
- Banks, J.L.; Marotta, C.A. Outcomes validity and reliability of the modified Rankin scale: Implications for stroke clinical trials: A literature review and synthesis. Stroke 2007, 38, 1091–1096. [Google Scholar] [CrossRef]
- Iadecola, C.; Buckwalter, M.S.; Anrather, J. Immune responses to stroke: Mechanisms, modulation, and therapeutic potential. J. Clin. Investig. 2020, 130, 2777–2788. [Google Scholar] [CrossRef]
- Simats, A.; Liesz, A. Systemic inflammation after stroke: Implications for post-stroke comorbidities. EMBO Mol. Med. 2022, 14, e16269. [Google Scholar] [CrossRef]
- Song, K.; Li, Y.; Zhang, H.; An, N.; Wei, Y.; Wang, L.; Tian, C.; Yuan, M.; Sun, Y.; Xing, Y. Oxidative stress-mediated blood-brain barrier (BBB) disruption in neurological diseases. Oxidative Med. Cell. Longev. 2020, 2020, 4356386. [Google Scholar] [CrossRef]
- Gonzalez–Curiel, I.; Marin-Luevano, P.; Trujillo, V.; Enciso-Moreno, J.A.; Gonzalez-Castillo, C.; Rivas-Santiago, B. Calcitriol prevents inflammatory gene expression in macrovascular endothelial cells. Br. J. Biomed. Sci. 2016, 73, 74–78. [Google Scholar] [CrossRef] [PubMed]
- Lopez, D.V.; Al-Jaberi, F.A.; Woetmann, A.; Ødum, N.; Bonefeld, C.M.; Kongsbak-Wismann, M.; Geisler, C. Macrophages control the bioavailability of vitamin D and vitamin D-Regulated T cell responses. Front. Immunol. 2021, 12, 3899. [Google Scholar] [CrossRef] [PubMed]
- Pál, É.; Ungvári, Z.; Benyó, Z.; Várbíró, S. Role of vitamin d deficiency in the pathogenesis of cardiovascular and cerebrovascular diseases. Nutrients 2023, 15, 334. [Google Scholar] [CrossRef] [PubMed]
- Yarlagadda, K.; Ma, N.; Doré, S. Vitamin D and stroke: Effects on incidence, severity, and outcome and the potential benefits of supplementation. Front. Neurol. 2020, 11, 384. [Google Scholar] [CrossRef] [PubMed]
- Hadjadj, L.; Pál, É.; Monori-Kiss, A.; Sziva, R.E.; Korsós-Novák, Á.; Mária Horváth, E.; Benkő, R.; Magyar, A.; Magyar, P.; Benyó, Z. Vitamin D deficiency and androgen excess result eutrophic remodeling and reduced myogenic adaptation in small cerebral arterioles in female rats. Gynecol. Endocrinol. 2019, 35, 529–534. [Google Scholar] [CrossRef]
- Kim, D.-H.; Meza, C.A.; Clarke, H.; Kim, J.-S.; Hickner, R.C. Vitamin D and endothelial function. Nutrients 2020, 12, 575. [Google Scholar] [CrossRef] [PubMed]
- Hou, Y.-C.; Lu, C.-L.; Zheng, C.-M.; Liu, W.-C.; Yen, T.-H.; Chen, R.-M.; Lin, Y.-F.; Chao, C.-T.; Lu, K.-C. The role of vitamin D in modulating mesenchymal stem cells and endothelial progenitor cells for vascular calcification. Int. J. Mol. Sci. 2020, 21, 2466. [Google Scholar] [CrossRef]
- Sayeed, I.; Turan, N.; Stein, D.G.; Wali, B. Vitamin D deficiency increases blood-brain barrier dysfunction after ischemic stroke in male rats. Exp. Neurol. 2019, 312, 63–71. [Google Scholar] [CrossRef]
- Bollen, S.E.; Bass, J.J.; Fujita, S.; Wilkinson, D.; Hewison, M.; Atherton, P.J. The Vitamin D/Vitamin D receptor (VDR) axis in muscle atrophy and sarcopenia. Cell. Signal. 2022, 96, 110355. [Google Scholar] [CrossRef] [PubMed]
- Iolascon, G.; Moretti, A.; Paoletta, M.; Liguori, S.; Di Munno, O. Muscle regeneration and function in sports: A focus on vitamin D. Medicina 2021, 57, 1015. [Google Scholar] [CrossRef] [PubMed]
- Boersma, D.; Demontiero, O.; Amiri, Z.M.; Hassan, S.; Suarez, H.; Geisinger, D.; Suriyaarachchi, P.; Sharma, A.; Duque, G. Vitamin D status in relation to postural stability in the elderly. J. Nutr. Health Aging 2012, 16, 270–275. [Google Scholar] [CrossRef] [PubMed]
- Selim, F.O.; Fahmi, R.M.; Ali, A.E.; Raafat, N.; Elsaid, A.F. Serum vitamin D levels in acute stroke patients. Egypt. J. Neurol. Psychiatry Neurosurg. 2019, 55, 80. [Google Scholar] [CrossRef]
- Ji, W.; Zhou, H.; Wang, S.; Cheng, L.; Fang, Y. Low serum levels of 25-hydroxyvitamin D are associated with stroke recurrence and poor functional outcomes in patients with ischemic stroke. J. Nutr. Health Aging 2017, 21, 892–896. [Google Scholar] [CrossRef] [PubMed]
- Narasimhan, S.; Balasubramanian, P.J. Role of vitamin D in the outcome of ischemic stroke-a randomized controlled trial. J. Clin. Diagn. Res. 2017, 11, CC06. [Google Scholar] [CrossRef] [PubMed]
- Momosaki, R.; Abo, M.; Urashima, M. Vitamin D supplementation and post-stroke rehabilitation: A randomized, double-blind, placebo-controlled trial. Nutrients 2019, 11, 1295. [Google Scholar] [CrossRef]
- Torrisi, M.; Bonanno, L.; Formica, C.; Arcadi, F.A.; Cardile, D.; Cimino, V.; Bramanti, P.; Morini, E. The role of rehabilitation and vitamin D supplementation on motor and psychological outcomes in poststroke patients. Medicine 2021, 100, e27747. [Google Scholar] [CrossRef]
- Karasu, A.U.; Karataş, G.K. Effect of vitamin D supplementation on lower extremity motor function and ambulationin stroke patients. Turk. J. Med. Sci. 2021, 51, 1413–1419. [Google Scholar] [CrossRef]
- Gupta, A.; Prabhakar, S.; Modi, M.; Bhadada, S.K.; Kalaivani, M.; Lal, V.; Khurana, D. Effect of Vitamin D and calcium supplementation on ischaemic stroke outcome: A randomised controlled open-label trial. Int. J. Clin. Pr. 2016, 70, 764–770. [Google Scholar] [CrossRef] [PubMed]
- Sari, A.; Durmus, B.; Karaman, C.A.; Ogut, E.; Aktas, I. A randomized, double-blind study to assess if vitamin D treatment affects the outcomes of rehabilitation and balance in hemiplegic patients. J. Phys. Ther. Sci. 2018, 30, 874–878. [Google Scholar] [CrossRef] [PubMed]


| Total | Vit D Sufficient Group (25-OHD > 30 ng/mL) | Vit D insufficient Group (30 ng/mL ≥ 25-OHD ≥ 20 ng/mL) | Vit D Deficient Group (25-OHD < 20 ng/mL) | ||
|---|---|---|---|---|---|
| (n = 192) | (n = 28) | (n = 49) | (n = 115) | p-Value | |
| Demographics | |||||
| Age (years) | 74.0 (64.0–83.0) | 73.5 (66.8–83.3) | 74.0 (66.0–82.0) | 73.0 (63.0–83.0) | 0.957 |
| Female sex, n (%) | 78 (40.6) | 16 (57.1) | 17 (34.7) | 45 (39.1) | 0.136 |
| BMI (kg/m2) | 24.0 ± 3.3 | 24.3 ± 2.9 | 23.9 ± 3.3 | 24.0 ± 3.5 | 0.876 |
| Season | 0.017 * | ||||
| Spring, n (%) | 33 (17.2) | 6 (21.4) | 8 (16.3) | 19 (16.5) | |
| Summer, n (%) | 72 (37.5) | 12 (42.9) | 25 (51.0) | 35 (30.4) | |
| Autumn, n (%) | 39 (20.3) | 7 (25.0) | 9 (18.4) | 23 (20.0) | |
| Winter, n (%) | 48 (25.0) | 3 (10.7) | 7 (12.3) | 38 (33.0) | |
| Medical history | |||||
| Hypertension, n (%) | 114 (59.4) | 20 (71.4) | 29 (59.2) | 65 (56.5) | 0.354 |
| Diabetes mellitus, n (%) | 69 (35.9) | 13 (46.4) | 18 (36.7) | 38 (33.0) | 0.413 |
| Dyslipidemia, n (%) | 71 (37.0) | 16 (57.1) | 15 (30.6) | 40 (34.8) | 0.050 |
| Coronary artery disease, n (%) | 24 (12.5) | 4 (14.3) | 6 (12.2) | 14 (12.2) | 0.953 |
| Smoking, n (%) | 65 (33.9) | 7 (25.0) | 17 (34.7) | 41 (35.7) | 0.559 |
| Alcohol consumption, n (%) | 67 (34.9) | 8 (28.6) | 19 (38.8) | 40 (34.8) | 0.664 |
| Intravenous thrombolysis, n (%) | 20 (10.4) | 3 (10.7) | 6 (12.2) | 11 (9.6) | 0.875 |
| Endovascular therapy, n (%) | 34 (17.7) | 3 (10.7) | 7 (14.3) | 24 (20.9) | 0.346 |
| Onset to admission time (days) | 2 (1–3) | 2 (1–2) | 2 (1–3) | 2 (1–3) | 0.979 |
| Length of hospital stay (days) | 24 (19–35) | 23 (20–35) | 25 (20–34) | 24 (19–37) | 0.954 |
| Laboratory findings | |||||
| 25-OHD (ng/mL) | 17.1 (12.2–24.2) | 40.1 (35.7–43.0) | 23.4 (21.5–27.3) | 13.1 (9.3–16.6) | <0.001 *** |
| Hemoglobin (g/dL) | 13.7 ± 1.8 | 13.2 ± 2.0 | 13.9 ± 1.5 | 13.7 ± 1.9 | 0.253 |
| Platelet (109/L) | 224 (174–256) | 221 (173–253) | 215 (171–250) | 228 (183–261) | 0.581 |
| WBC (109/L) | 6.9 (5.6–8.7) | 6.6 (5.0–7.7) | 6.9 (6.1–8.2) | 7.3 (5.6–9.0) | 0.156 |
| hsCRP (mg/L) | 0.2 (0.1–0.5) | 0.1 (0.0–0.3) | 0.1 (0.1–0.3) | 0.2 (0.1–0.6) | 0.194 |
| HbA1c (%) | 5.8 (5.4–6.5) | 6.0 (5.5–7.2) | 5.8 (5.4–6.6) | 5.8 (5.4–6.4) | 0.359 |
| TC (mg/dL) | 178 (150–203) | 163 (125–206) | 176 (154–196) | 183 (152–204) | 0.403 |
| TG (mg/dL) | 115 (84–175) | 115 (87–152) | 106 (80–145) | 120 (86–190) | 0.429 |
| HDL (mg/dL) | 45 (38–52) | 45 (37–52) | 49 (40–54) | 45 (37–52) | 0.224 |
| LDL (mg/dL) | 104 (82–123) | 93 (69–123) | 103 (89–119) | 106 (82–126) | 0.508 |
| Vit D Sufficient Group (25-OHD > 30) | Vit D Insufficient Group (30 ≥ 25-OHD ≥ 20) | Vit D Deficient Group (25-OHD < 20) | |
|---|---|---|---|
| (n = 28) | (n = 49) | (n = 115) | |
| Moderate-to-severe stroke severity (NIHSS ≥ 5) | |||
| Unadjusted OR (95% CI) | ref | 0.77 (0.22–2.69), p = 0.609 | 4.07 (1.45–11.45), p = 0.008 ** |
| Adjusted OR (95% CI) | ref | 0.66 (0.13–3.28), p = 0.609 | 4.98 (1.22–20.33), p = 0.025 * |
| Poor BBS score (BBS ≤ 20) | |||
| Unadjusted OR (95% CI) | ref | 2.17 (0.63–7.44), p = 0.219 | 4.00 (1.30–12.29), p = 0.015 * |
| Adjusted OR (95% CI) | ref | 2.33 (0.57–9.62), p = 0.242 | 3.83 (1.01–4.51), p = 0.048 * |
| Poor MFT score (MFT ≤ 19) | |||
| Unadjusted OR (95% CI) | ref | 2.70 (0.69–10.56), p = 0.153 | 5.36 (1.53–18.79), p = 0.009 ** |
| Adjusted OR (95% CI) | ref | 3.09 (0.69–13.89), p = 0.141 | 5.69 (1.36–23.83), p = 0.017 * |
| Poor K-MMSE score (MMSE ≤ 23) | |||
| Unadjusted OR (95% CI) | ref | 2.44 (0.79–7.58), p = 0.122 | 5.57 (1.98–15.68), p = 0.001 ** |
| Adjusted OR (95% CI) | ref | 3.93 (0.90–17.14), p = 0.068 | 9.80 (2.40–39.93), p = 0.001 ** |
| Poor K-MBI score (MBI ≤ 50) | |||
| Unadjusted OR (95% CI) | ref | 2.44 (0.79–7.58), p = 0.122 | 5.38 (1.91–15.14), p = 0.001 ** |
| Adjusted OR (95% CI) | ref | 3.11 (0.81–11.93), p = 0.099 | 7.13 (1.98–25.59), p = 0.003 ** |
| Poor mRS score (mRS ≥ 3) | |||
| Unadjusted OR (95% CI) | ref | 1.79 (0.60–5.23), p = 0.297 | 3.60 (1.36–9.54), p = 0.010 * |
| Adjusted OR (95% CI) | ref | 2.07 (0.58–7.35), p = 0.261 | 3.58 (1.12–11.49), p = 0.032 * |
| Vit D Non-Deficient Group (25-OHD ≥ 20 ng/mL) | Vit D Deficient Group (25-OHD < 20 ng/mL) | |
|---|---|---|
| (n = 77) | (n = 115) | |
| Moderate-to-severe stroke severity (NIHSS ≥ 5) | ||
| Unadjusted OR (95% CI) | ref | 4.80 (2.34–9.82), p < 0.001 *** |
| Adjusted OR (95% CI) | ref | 6.52 (2.40–17.73), p < 0.001 *** |
| Poor BBS score (BBS ≤ 20) | ||
| Unadjusted OR (95% CI) | ref | 2.35 (1.22–4.53), p = 0.010 * |
| Adjusted OR (95% CI) | ref | 2.11 (0.94–4.73), p = 0.069 |
| Poor MFT score (MFT ≤ 19) | ||
| Unadjusted OR (95% CI) | ref | 2.66 (1.35–5.23), p = 0.005 ** |
| Adjusted OR (95% CI) | ref | 2.55 (1.10–5.89), p = 0.029 * |
| Poor K-MMSE score (MMSE ≤ 23) | ||
| Unadjusted OR (95% CI) | ref | 3.03 (1.64–5.61), p < 0.001 *** |
| Adjusted OR (95% CI) | ref | 3.94 (1.58–9.83), p = 0.003 ** |
| Poor K-MBI score (MBI ≤ 50) | ||
| Unadjusted OR (95% CI) | ref | 2.93 (1.58–5.41), p = 0.001 ** |
| Adjusted OR (95% CI) | ref | 3.31 (1.45–7.56), p = 0.004 ** |
| Poor mRS score (mRS ≥ 3) | ||
| Unadjusted OR (95% CI) | ref | 2.46 (1.33–4.54), p = 0.004 ** |
| Adjusted OR (95% CI) | ref | 2.24 (1.02–4.92), p = 0.045 * |
| Variables | Spearman’s Correlation Coefficient (ρ) | p-Value |
|---|---|---|
| Vit D-NIHSS | −0.402 | <0.001 *** |
| Vit D-BBS | 0.200 | 0.006 ** |
| Vit D-MFT | 0.334 | <0.001 *** |
| Vit D-K-MMSE | 0.297 | <0.001 *** |
| Vit D-K-MBI | 0.311 | <0.001 *** |
| Vit D-mRS | −0.274 | <0.001 *** |
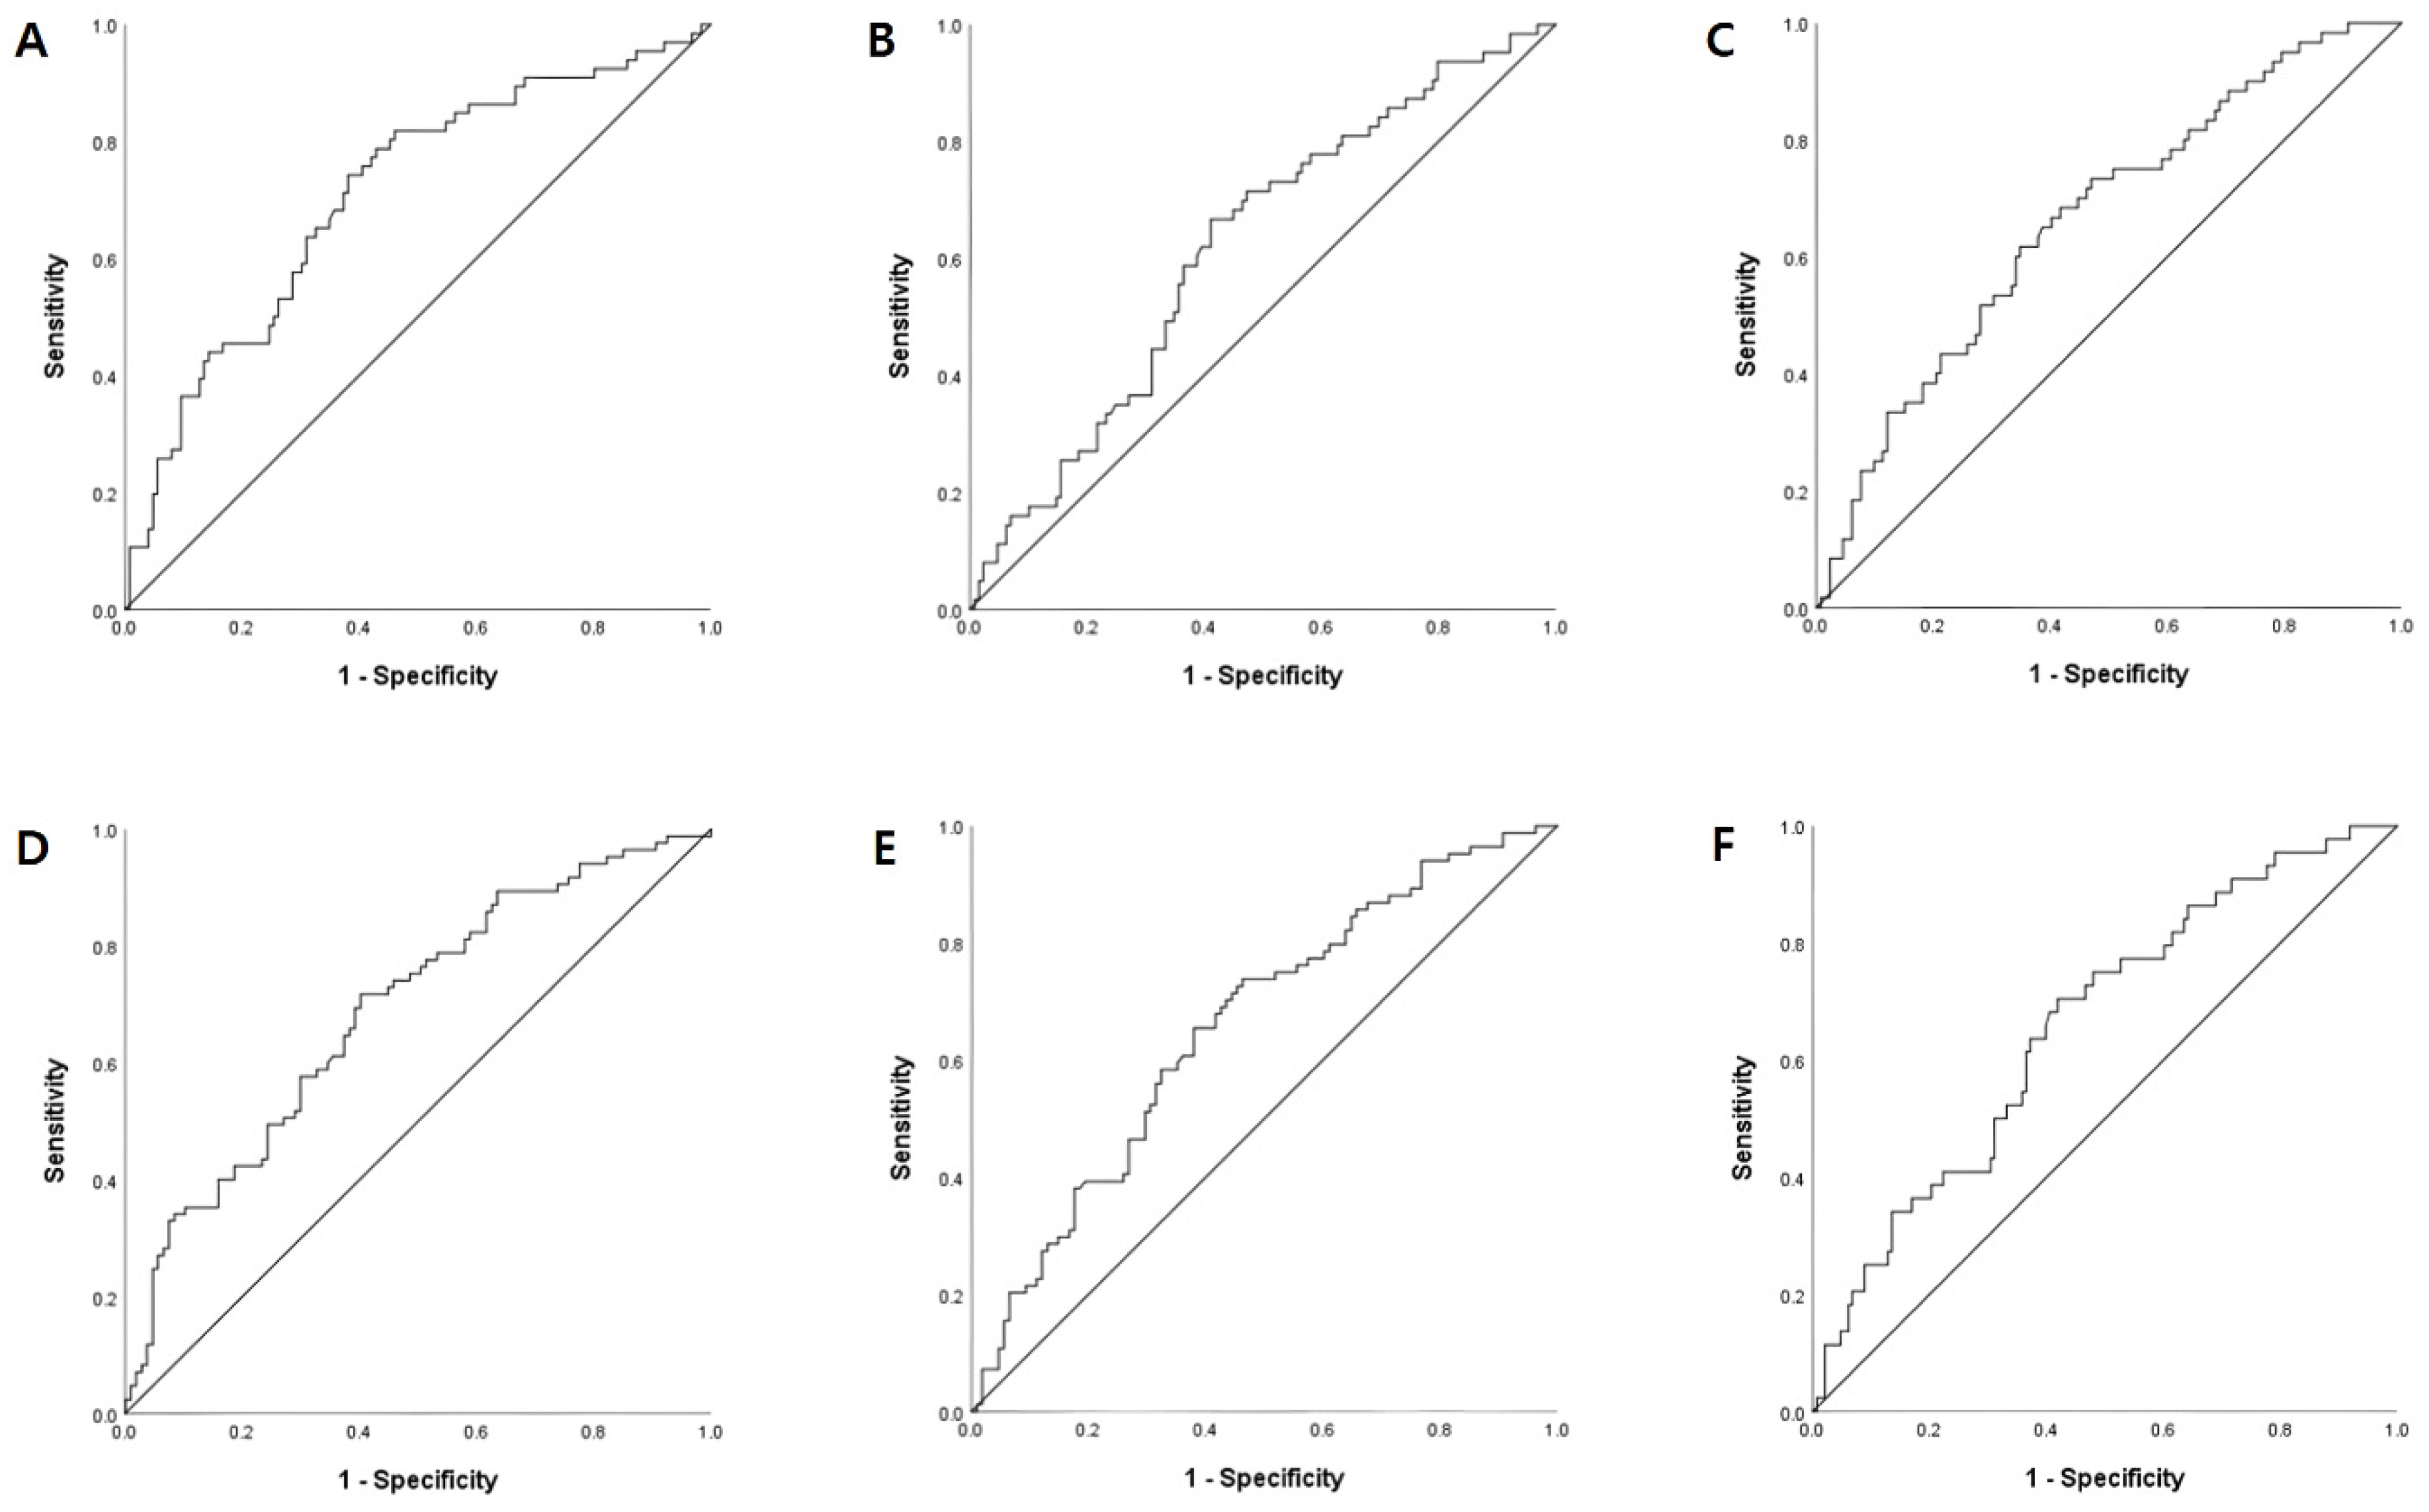
| Variables | AUC (95% CI) | Cut-off Value (ng/mL) | Sensitivity | Specificity | Unadjusted OR (95% CI) | Adjusted OR (95% CI) |
|---|---|---|---|---|---|---|
| NIHSS | 0.71 (0.63–0.79), p < 0.001 *** | 17.22 | 0.74 | 0.38 | 4.68 (2.42–9.05), p < 0.001 *** | 6.02 (2.34–15.50), p < 0.001 *** |
| BBS | 0.62 (0.54–0.70), p = 0.008 ** | 17.05 | 0.67 | 0.41 | 2.87 (1.53–5.39), p = 0.001 ** | 2.47 (1.12–5.44), p = 0.025 * |
| MFT | 0.67 (0.58–0.74), p < 0.001 *** | 16.06 | 0.62 | 0.35 | 3.01 (1.60–5.66), p = 0.001 ** | 2.33 (1.07–5.10), p = 0.033 * |
| K-MMSE | 0.69 (0.62–0.76), p < 0.001 *** | 18.27 | 0.72 | 0.40 | 3.78 (2.06–6.96), p < 0.001 *** | 4.83 (1.92–12.18), p = 0.001 ** |
| K-MBI | 0.66 (0.58–0.73), p < 0.001 *** | 17.14 | 0.66 | 0.38 | 3.10 (1.71–5.62), p < 0.001 *** | 3.17 (1.41–7.17), p = 0.005 ** |
| mRS | 0.65 (0.57–0.73), p = 0.001 ** | 17.14 | 0.66 | 0.39 | 3.02 (1.66–5.50), p < 0.001 *** | 2.71 (1.24–5.94), p = 0.013 * |
Disclaimer/Publisher’s Note: The statements, opinions and data contained in all publications are solely those of the individual author(s) and contributor(s) and not of MDPI and/or the editor(s). MDPI and/or the editor(s) disclaim responsibility for any injury to people or property resulting from any ideas, methods, instructions or products referred to in the content. |
© 2023 by the authors. Licensee MDPI, Basel, Switzerland. This article is an open access article distributed under the terms and conditions of the Creative Commons Attribution (CC BY) license (https://creativecommons.org/licenses/by/4.0/).
Share and Cite
Kim, M.-S.; Lee, J.S.; Chung, S.J.; Soh, Y. Association between Vitamin D and Short-Term Functional Outcomes in Acute Ischemic Stroke. Nutrients 2023, 15, 4957. https://doi.org/10.3390/nu15234957
Kim M-S, Lee JS, Chung SJ, Soh Y. Association between Vitamin D and Short-Term Functional Outcomes in Acute Ischemic Stroke. Nutrients. 2023; 15(23):4957. https://doi.org/10.3390/nu15234957
Chicago/Turabian StyleKim, Min-Su, Jin San Lee, Sung Joon Chung, and Yunsoo Soh. 2023. "Association between Vitamin D and Short-Term Functional Outcomes in Acute Ischemic Stroke" Nutrients 15, no. 23: 4957. https://doi.org/10.3390/nu15234957
APA StyleKim, M.-S., Lee, J. S., Chung, S. J., & Soh, Y. (2023). Association between Vitamin D and Short-Term Functional Outcomes in Acute Ischemic Stroke. Nutrients, 15(23), 4957. https://doi.org/10.3390/nu15234957