
Analysis of Fish-Consumption Benefits and Safety Knowledge in a Population-Based Sample of Polish Adolescents


Abstract
:
1. Introduction
2. Materials and Methods
2.1. Ethical Statement
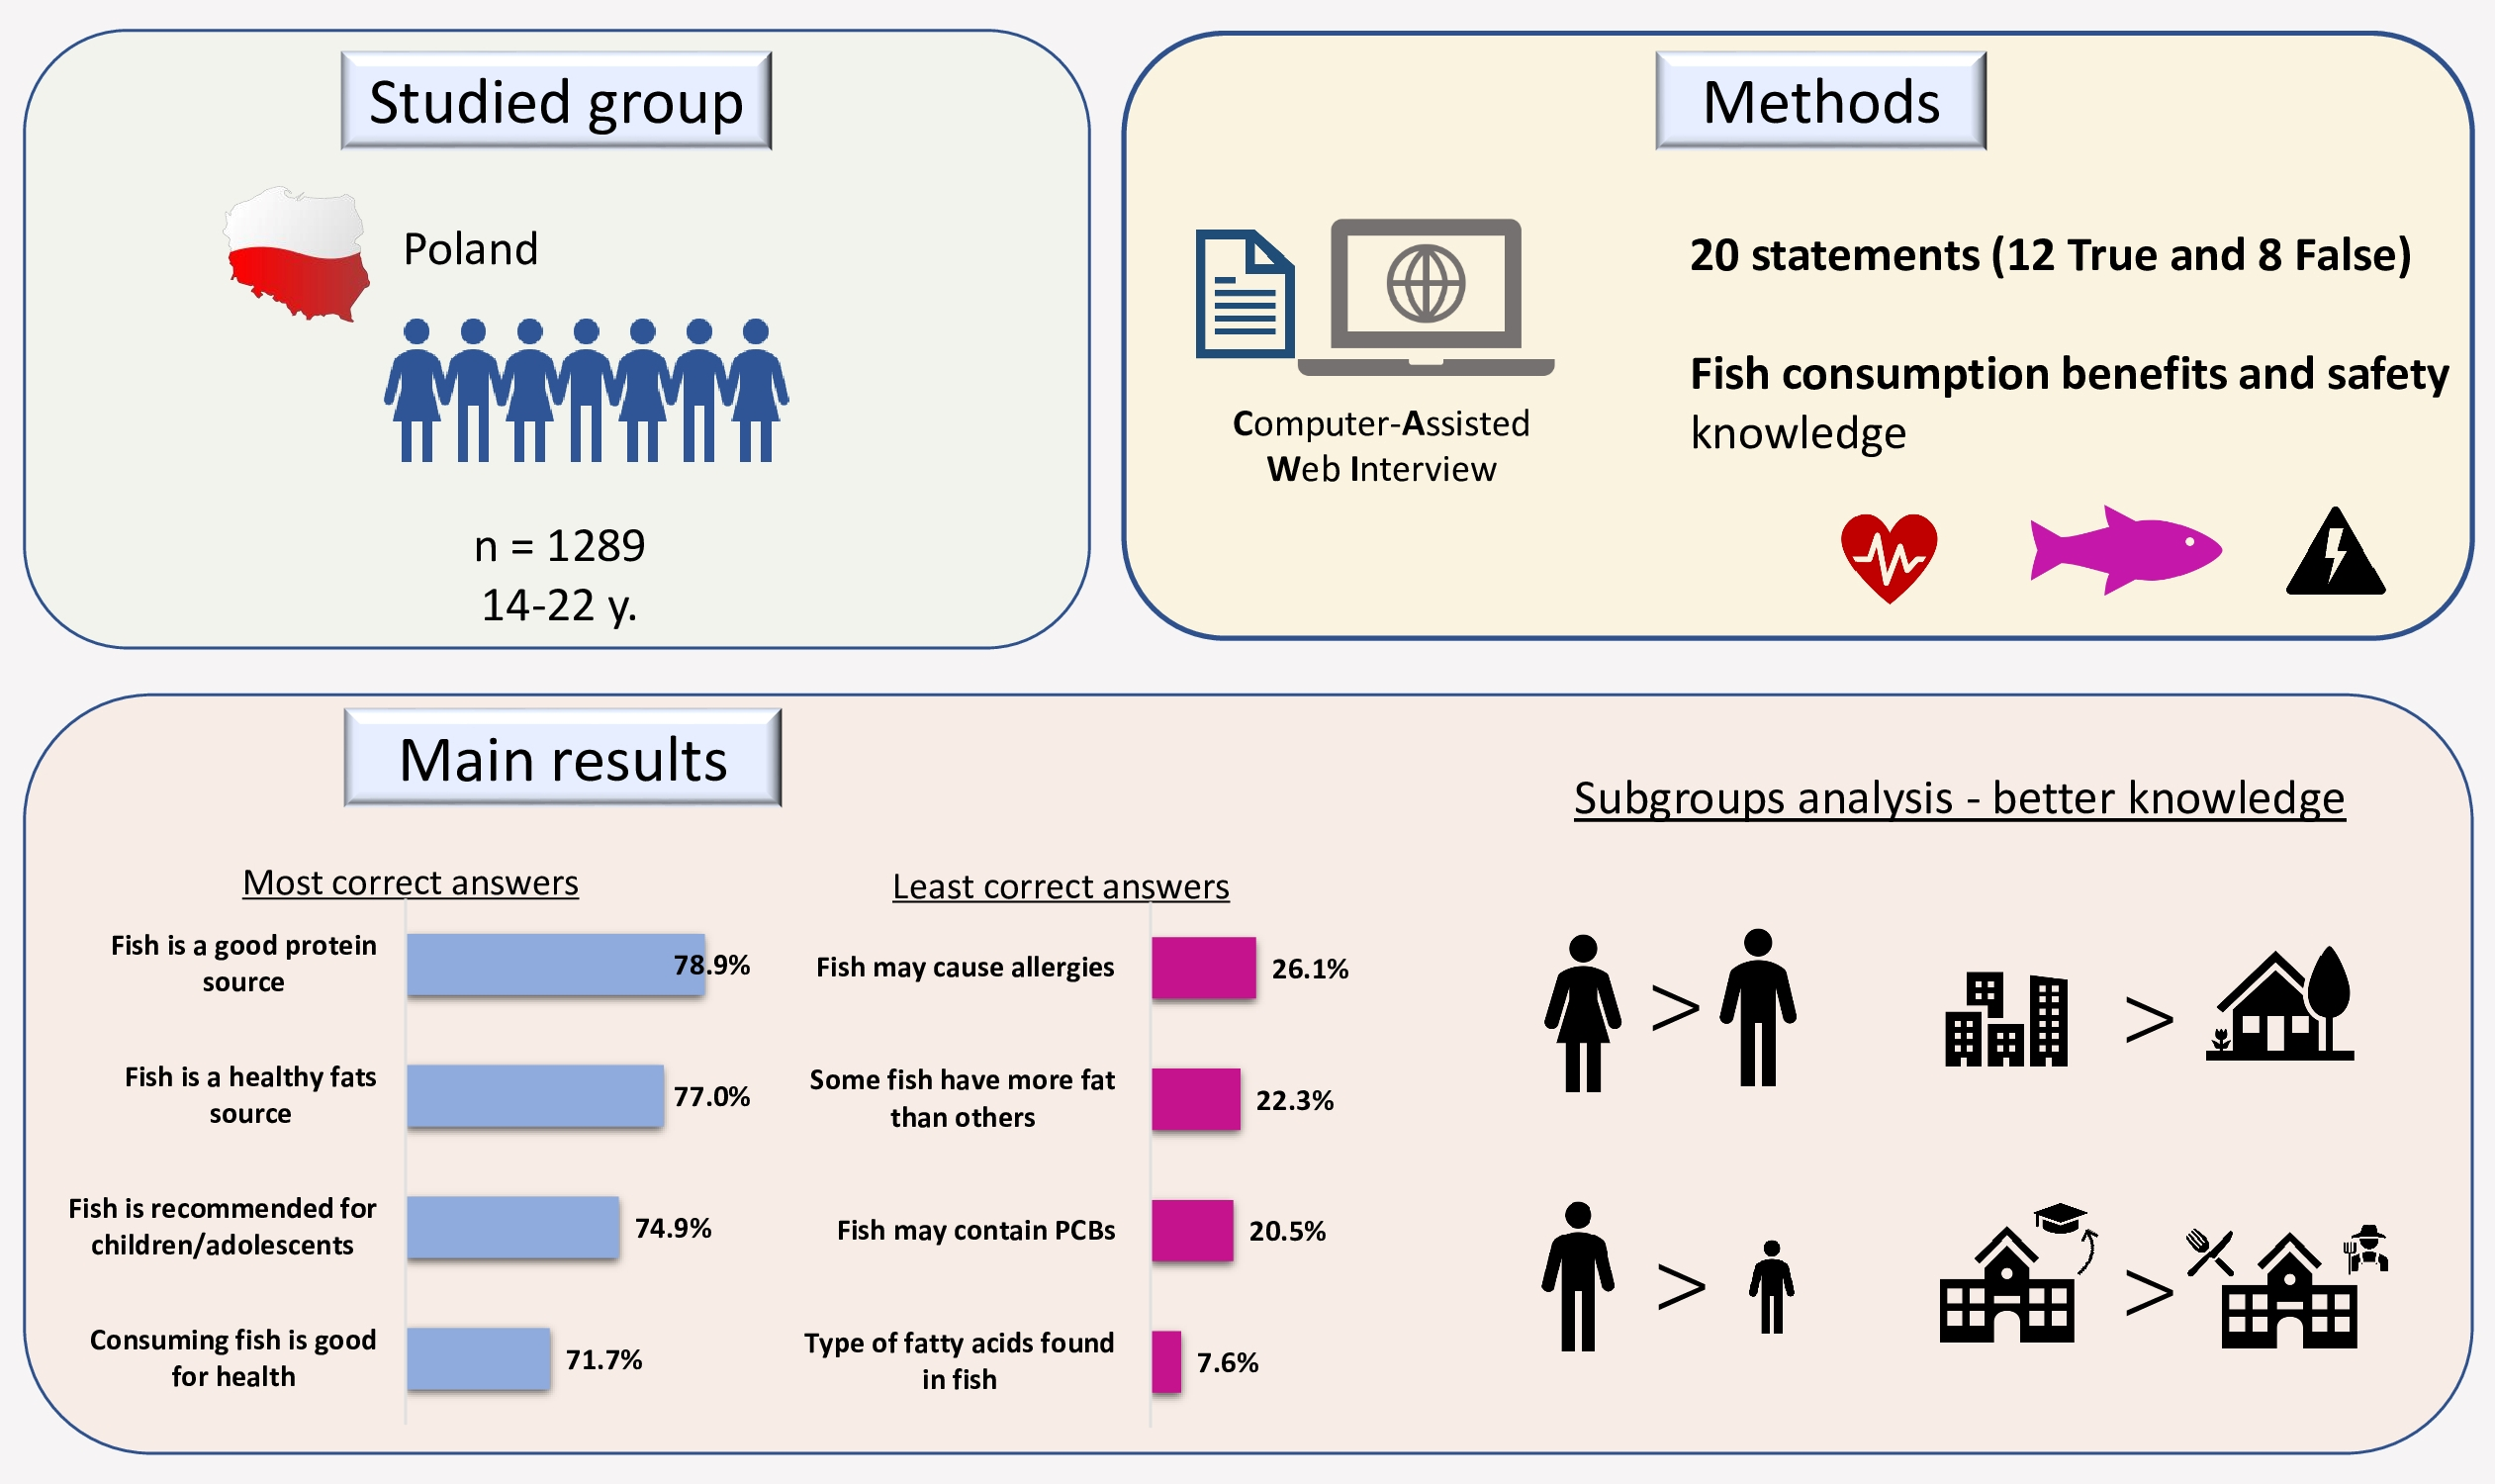
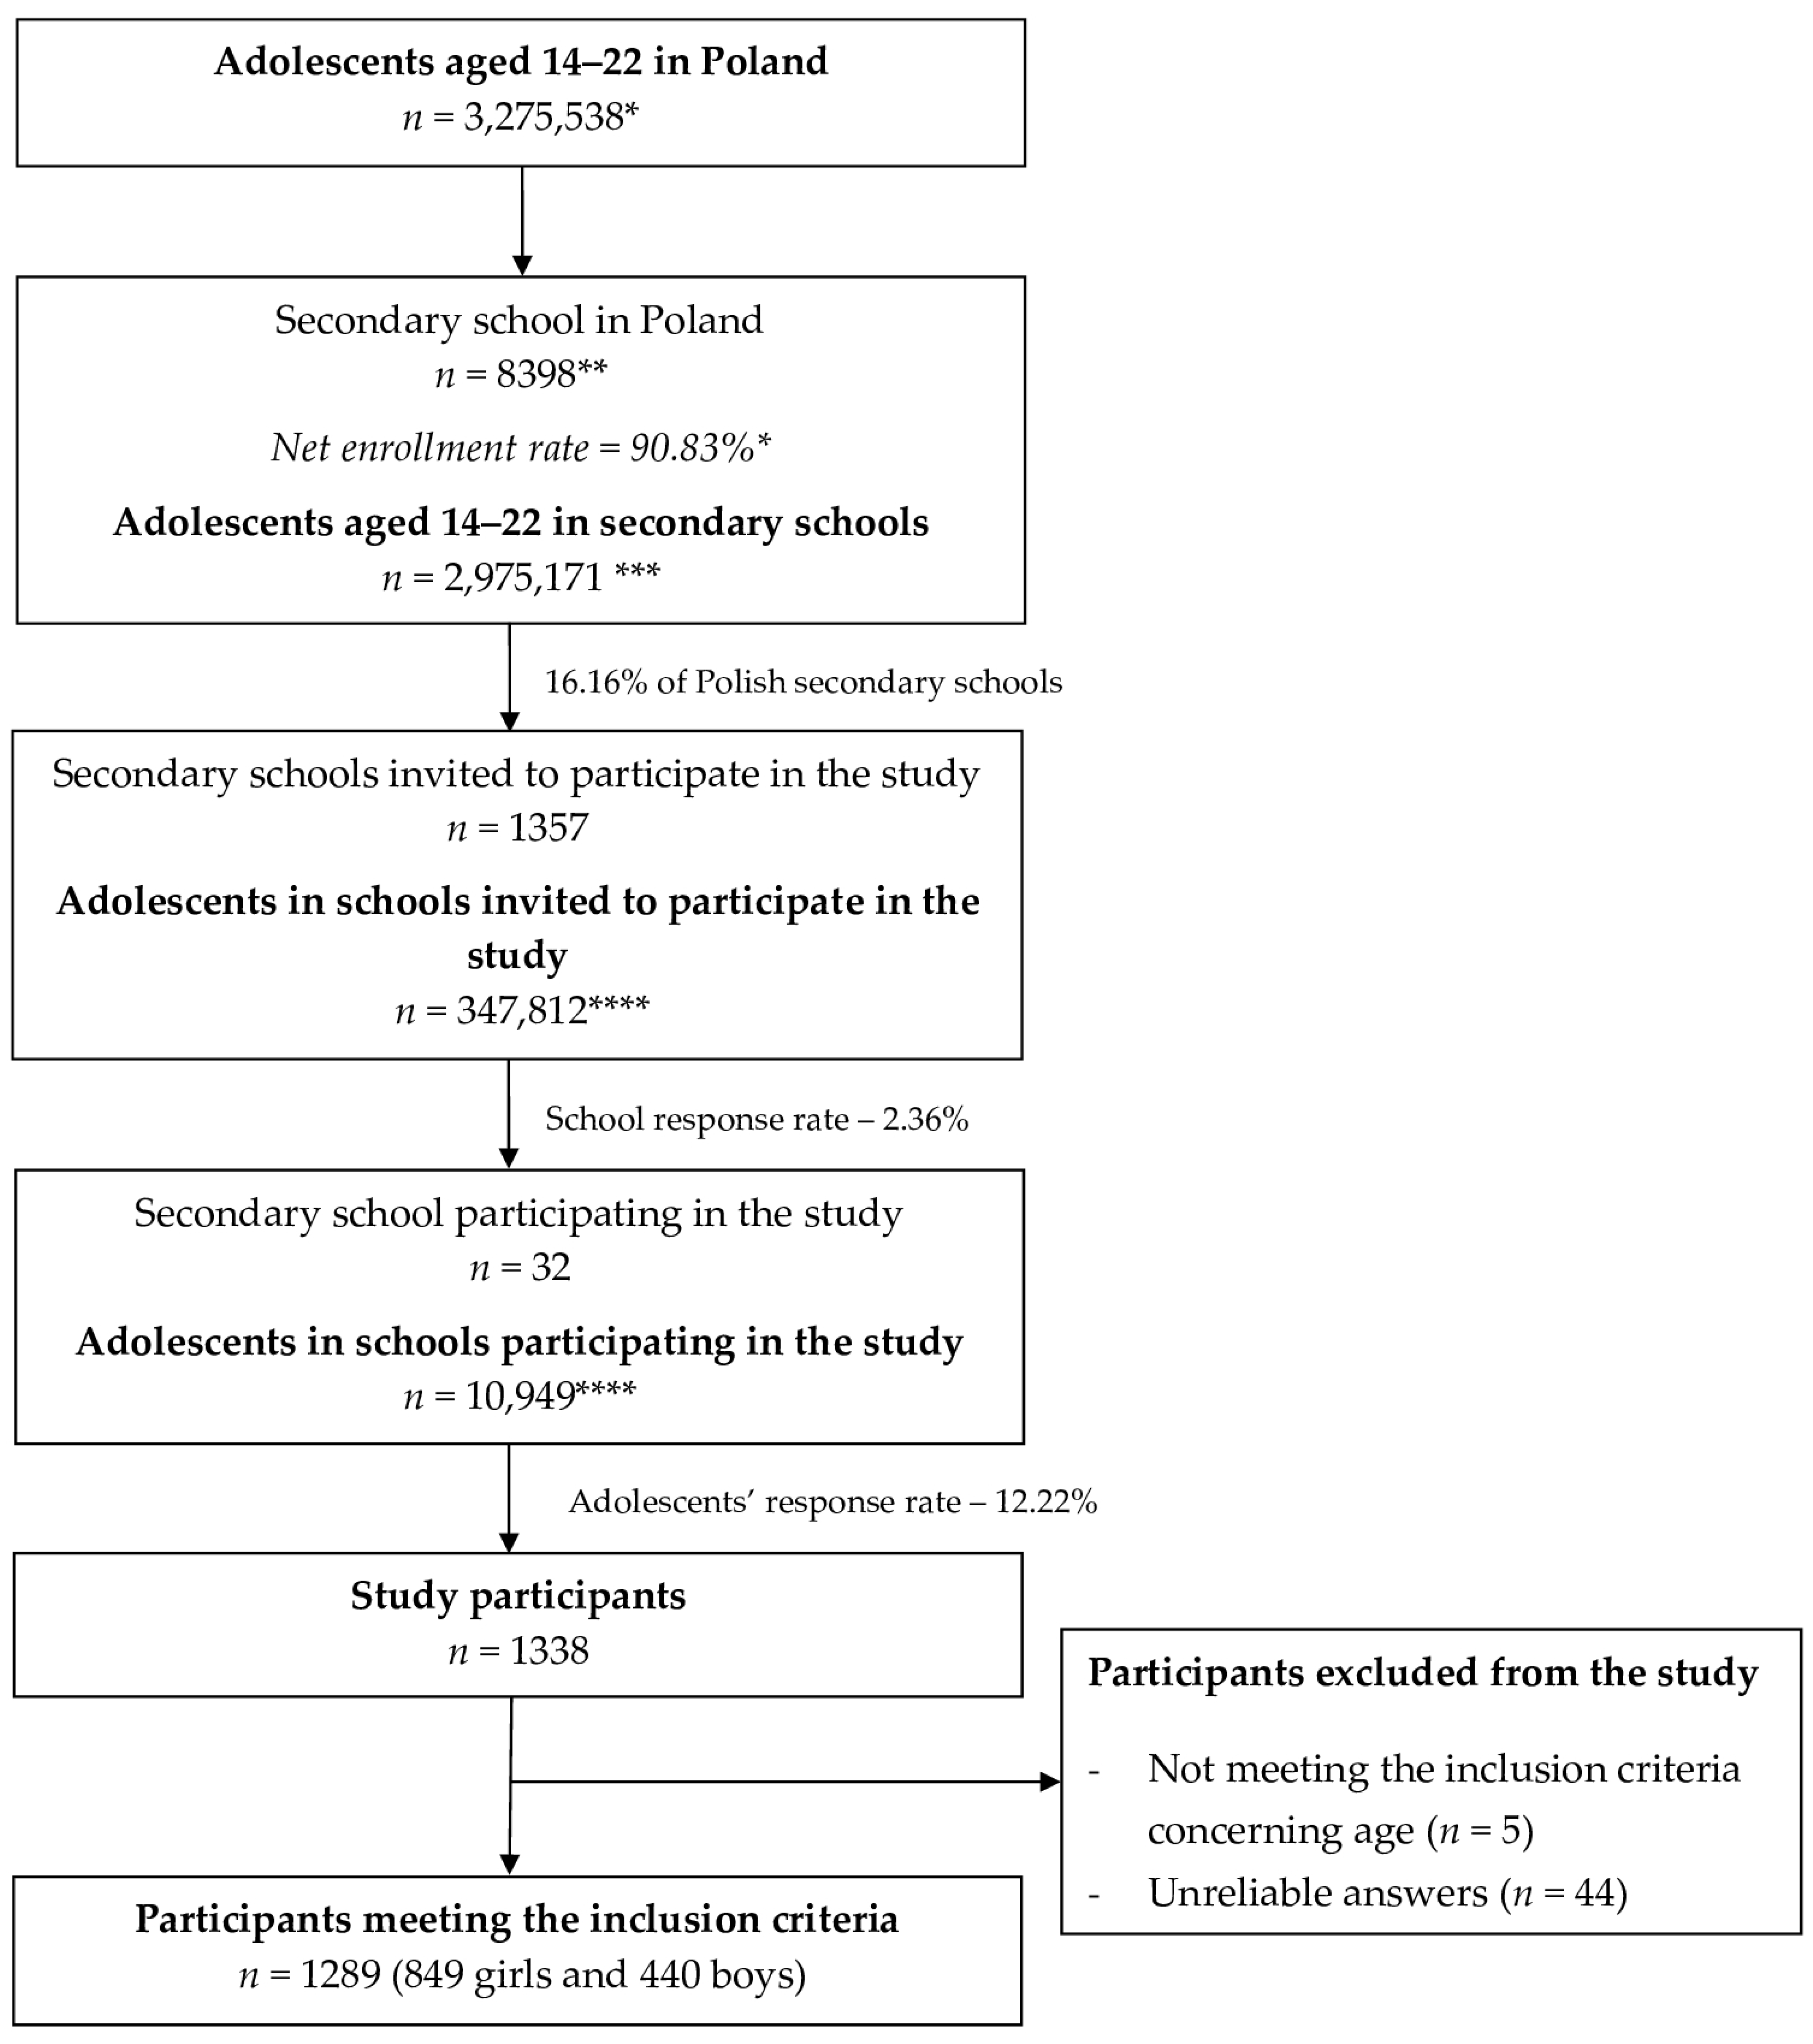
2.2. Studied Group
- -
- Adolescents aged 14–22 years;
- -
- Attending one of the five given types of secondary school in Poland: comprehensive high school, specialized high school, vocational, technical or visual arts high school;
- -
- Attending a secondary school sampled within the study;
- -
- Informed consent to participate (verified by the headteacher);
- -
- Informed consent of parent/legal guardian for participation (verified by the headteacher).
- -
- Any missing data within the questionnaire once completed;
- -
- Any unreliable answers within the questionnaire once completed.
2.3. Applied Questionnaire and Data Collection
2.4. Statistical Analysis
- -
- Gender: Female and male.
- -
- Age: Minors (less than 18 years of age) and adults (18 years of age or more).
- -
- Body mass: Underweight, proper body mass and excessive body mass; it was defined based on the Body Mass Index (BMI), while for adults the standard cut-offs by the WHO were applied (18.5–25 kg/m2 as proper body mass) [42]. For minors, the Polish growth-reference cut-offs were applied [43] (5th–85th percentile as proper body mass) [44].
- -
- Place of residence: Rural environment (village as a place of residence) and urban environment (city as place of residence).
- -
- Location of the region of residence in relation to the Baltic Sea (being the only sea in Poland, as fish availability is commonly related to the seaside proximity [45]): regions situated by the sea (north and north-west macroregions of Poland) and away from the sea (central, Masovian, south-west, south and east macroregions of Poland)—it was defined based on the macroregion categories assumed by the Central Statistical Office in Poland [46].
- -
- Type of school: Comprehensive school (comprehensive high schools and specialized high schools) and vocational school (vocational schools, technical schools and visual arts high schools).
3. Results
4. Discussion
4.1. General Knowledge
4.2. Determinants of Knowledge
5. Conclusions
Author Contributions
Funding
Institutional Review Board Statement
Informed Consent Statement
Data Availability Statement
Conflicts of Interest
References
- Swanson, D.; Block, R.; Mousa, S.A. Omega-3 fatty acids EPA and DHA: Health benefits throughout life. Adv. Nutr. 2012, 3, 1–7. [Google Scholar] [CrossRef]
- Saini, R.K.; Keum, Y.S. Omega-3 and omega-6 polyunsaturated fatty acids: Dietary sources, metabolism, and significance—A review. Life Sci. 2018, 203, 255–267. [Google Scholar] [CrossRef] [PubMed]
- Khalili Tilami, S.; Sampels, S. Nutritional value of fish: Lipids, proteins, vitamins, and minerals. Rev. Fish. Sci. Aquac. 2017, 26, 243–253. [Google Scholar] [CrossRef]
- Jayedi, A.; Zargar, M.S.; Shab-Bidar, S. Fish consumption and risk of myocardial infarction: A systematic review and dose-response meta-analysis suggests a regional difference. Nutr. Res. 2019, 62, 1–12. [Google Scholar] [CrossRef] [PubMed]
- Zhao, W.; Tang, H.; Yang, X.; Luo, X.; Wang, X.; Shao, C.; He, J. Fish consumption and stroke risk: A meta-analysis of prospective cohort studies. J. Stroke Cerebrovasc. Dis. 2019, 28, 604–611. [Google Scholar] [CrossRef]
- Karimi, G.; Heidari, Z.; Firouzi, S.; Haghighatdoost, F. A systematic review and meta-analysis of the association between fish consumption and risk of metabolic syndrome. Nutr. Metab. Cardiovasc. Dis. 2020, 30, 717–729. [Google Scholar] [CrossRef] [PubMed]
- Kim, E.; Je, Y. Fish consumption and the risk of dementia: Systematic review and meta-analysis of prospective studies. Psychiatry Res. 2022, 317, 114889. [Google Scholar] [CrossRef]
- Li, F.; Liu, X.; Zhang, D. Fish consumption and risk of depression: A meta-analysis. J. Epidemiol. Community Health 2016, 70, 299–304. [Google Scholar] [CrossRef]
- Zhao, L.G.; Sun, J.W.; Yang, Y.; Ma, X.; Wang, Y.Y.; Xiang, Y.B. Fish consumption and all-cause mortality: A meta-analysis of cohort studies. Eur. J. Clin. Nutr. 2016, 70, 155–161. [Google Scholar] [CrossRef]
- Gajski, G.; Matković, K.; Delić, L.; Gerić, M. Evaluation of primary DNA damage in young healthy females based on their dietary preferences. Nutrients 2023, 15, 2218. [Google Scholar] [CrossRef]
- Hicks, C.C.; Cohen, P.J.; Graham, N.A.J.; Nash, K.L.; Allison, E.H.; D’Lima, C.; Mills, D.J.; Roscher, M.; Thilsted, S.H.; Thorne-Lyman, A.L.; et al. Harnessing global fisheries to tackle micronutrient deficiencies. Nature 2019, 574, 95–98. [Google Scholar] [CrossRef] [PubMed]
- Food and Agriculture Organization of the United Nations (FAO)—Department of Economic and Social Affairs. Food from the Oceans. Available online: https://sdgs.un.org/statements/food-and-agriculture-organization-united-nations-fao-15957 (accessed on 15 June 2023).
- WHO/FAO. Report of a Joint WHO/FAO Expert Consultation on Diet, Nutrition and the Prevention of Chronic Diseases: Geneva, 28 January–1 February 2002; World Health Organization: Geneva, Switzerland, 2003. [Google Scholar]
- Visseren, F.L.J.; MacH, F.; Smulders, Y.M.; Carballo, D.; Koskinas, K.C.; Bäck, M.; Benetos, A.; Biffi, A.; Boavida, J.M.; Capodanno, D.; et al. 2021 ESC Guidelines on cardiovascular disease prevention in clinical practice. Eur. Heart J. 2021, 42, 3227–3337. [Google Scholar] [CrossRef] [PubMed]
- Fish and Omega-3 Fatty Acids. American Heart Association. Available online: https://www.heart.org/en/healthy-living/healthy-eating/eat-smart/fats/fish-and-omega-3-fatty-acids (accessed on 18 January 2023).
- Lofstedt, A.; de Roos, B.; Fernandes, P.G. Less than half of the European dietary recommendations for fish consumption are satisfied by national seafood supplies. Eur. J. Nutr. 2021, 60, 4219–4228. [Google Scholar] [CrossRef] [PubMed]
- Plate of Healthy Eating—Polish National Center for Nutrition Education (In Polish). Available online: https://ncez.pzh.gov.pl/abc-zywienia/talerz-zdrowego-zywienia/ (accessed on 18 January 2023).
- Marí, J.T.; Alías, M.S.; de la Cruz, J.N.; Ibáñez, M.V. Healthy Diet for All—A Guide of the Spanish Agency for Food Safety and Nutrition. 2010. Available online: https://www.aesan.gob.es/AECOSAN/docs/documentos/nutricion/alimentacion_sana_para_todos.pdf (accessed on 2 March 2023). (In Spanish).
- Sofi, F.; Abbate, R.; Gensini, G.F.; Casini, A. Accruing evidence on benefits of adherence to the Mediterranean diet on health: An updated systematic review and meta-analysis. Am. J. Clin. Nutr. 2010, 92, 1189–1196. [Google Scholar] [CrossRef]
- Davis, C.; Bryan, J.; Hodgson, J.; Murphy, K. Definition of the Mediterranean diet; a literature review. Nutrients 2015, 7, 9139–9153. [Google Scholar] [CrossRef] [PubMed]
- Tlusty, M.F. Food-based dietary guidelines for seafood do not translate into increased long-chain omega-3 levels in the diet for U.S. consumers. Foods 2021, 10, 1816. [Google Scholar] [CrossRef] [PubMed]
- European Market Observatory for Fisheries and Aquaculture Products. The EU Fish Market—2022 Edition; Publications Office of the European Union: Luxembourg, Luxemburg, 2022; pp. 37–59. [Google Scholar] [CrossRef]
- Micha, R.; Khatibzadeh, S.; Shi, P.; Fahimi, S.; Lim, S.; Andrews, K.G.; Engell, R.E.; Powles, J.; Ezzati, M.; Mozaffarian, D. Global, regional, and national consumption levels of dietary fats and oils in 1990 and 2010: A systematic analysis including 266 country-specific nutrition surveys. BMJ 2014, 348, g2272, Erratum in: BMJ 2015, 350, h1702. [Google Scholar]
- Jahns, L.; Raatz, S.K.; Johnson, L.A.K.; Kranz, S.; Silverstein, J.T.; Picklo, M.J. Intake of seafood in the US varies by age, income, and education level but not by race-ethnicity. Nutrients 2014, 6, 6060–6075. [Google Scholar] [CrossRef]
- Dymkowska-Malesa, M.; Walczak, Z.; Zakrzewski, J. Evaluation of the level of fish consumption among students in grades 4–6 of primary schools in Koszalin. Probl. Hig. Epidemiol. 2014, 95, 182–185. [Google Scholar]
- Przysławski, J.; Stelmach, M.; Grygiel-Górniak, B.; Mardas, M.; Walkowiak, J. Dietary habits and nutritional status of female adolescents from the Great Poland region. Pol. J. Food Nutr. Sci. 2011, 61, 73–78. [Google Scholar] [CrossRef]
- Derbyshire, E. Oily fish and omega-3s across the life stages: A focus on intakes and future directions. Front. Nutr. 2019, 6, 165. [Google Scholar] [CrossRef] [PubMed]
- Skibniewska, K.; Radzymińska, M.; Jaworska, M.; Babicz-Zielińska, E. A study of the dietary habits of Polish and Belgian students. Żywn. Nauka Technol. Jakość 2009, 16, 250–258. (In Polish) [Google Scholar]
- Tkaczewska, J.; Migdał, W.; Kulawik, P. Consumer preferences for fish consumption. Komunikaty Rybackie 2014, 138, 10–14. (In Polish) [Google Scholar]
- Bortnowska, G.; Grotowska, L.; Goluch-Koniuszy, Z. Consumption of fish dishes and/or snacks by school children from the Miedzychodzsko-Sierakowskie Lake District. Roczn. PZH 2011, 62, 325–333. (In Polish) [Google Scholar]
- Verbeke, W.; Sioen, I.; Pieniak, Z.; Van Camp, J.; De Henauw, S. Consumer perception versus scientific evidence about health benefits and safety risks from fish consumption. Public Health Nutr. 2005, 8, 422–429. [Google Scholar] [CrossRef] [PubMed]
- Wahyuni, H.C.; Saidi, I.A.; Sumarmi, W. Indonesian consumer perception of food safety system in fish supply chain. IOP Conf. Ser. Mater. Sci. Eng. 2018, 434, 012249. [Google Scholar] [CrossRef]
- Response from the Undersecretary of the Ministry of Agriculture and Rural Development to Interpellation no. 25918 on the Cost of Media Campaigns of the Ministry of Agriculture and Rural Development (In Polish). Available online: https://www.sejm.gov.pl/Sejm7.nsf/InterpelacjaTresc.xsp?key=4210420B (accessed on 19 May 2023).
- Pérez-Cueto, F.J.A.; Pieniak, Z.; Verbeke, W. Attitudinal determinants of fish consumption in Spain and Poland. Nutr. Hosp. 2011, 26, 1412–1419. [Google Scholar] [CrossRef]
- Pieniak, Z.; Verbeke, W.; Scholderer, J. Health-related Beliefs and Consumer Knowledge as Determinants of Fish Consumption. J. Hum. Nutr. Diet. 2010, 23, 480–488. [Google Scholar] [CrossRef] [PubMed]
- Register of Schools and Educational Institutions in Poland (In Polish). Available online: https://rspo.gov.pl/ (accessed on 19 January 2021).
- Education—Enrollment—Statistics Poland. Available online: https://bdl.stat.gov.pl/bdl/dane/podgrup/tablica (accessed on 19 January 2023).
- Statistics Poland—The NUTS Classification in Poland. Available online: https://stat.gov.pl/en/regional-statistics/classification-of-territorial-units/classification-of-territorial-units-for-statistics-nuts/the-nuts-classification-in-poland/ (accessed on 2 March 2023).
- Statistics Poland—Population by Singular Age and Sex. Available online: https://bdl.stat.gov.pl/bdl/dane/podgrup/temat (accessed on 17 April 2023).
- Burger, J.; Gochfeld, M. Knowledge about fish consumption advisories: A risk communication failure within a university population. Sci. Total Environ. 2008, 390, 346–354. [Google Scholar] [CrossRef] [PubMed]
- WHO—Process of Translation and Adaptation of Instruments. Available online: https://www.coursehero.com/file/30372721/WHO-Process-of-translation-and-adaptation-of-instrumentspdf/ (accessed on 24 November 2020).
- WHO—A Healthy Lifestyle—WHO Recommendations. Available online: https://www.who.int/europe/news-room/fact-sheets/item/a-healthy-lifestyle---who-recommendations (accessed on 24 April 2023).
- OLAF—Percentile Calculator for Polish Children and Adolescents. Available online: http://olaf.czd.pl/index.php?option=com_content&view=article&id=103:kalkulator (accessed on 11 May 2022).
- de Onis, M.; Onyango, A.W.; Borghi, E.; Siyam, A.; Nishida, C.; Siekmann, J. Development of a WHO growth reference for school-aged children and adolescents. Bull. World Health Organ. 2007, 85, 660–667. [Google Scholar] [CrossRef] [PubMed]
- Saidi, A.; Sacchi, G.; Cavallo, C.; Cicia, G.; Di Monaco, R.; Puleo, S.; Del Giudice, T. Drivers of fish choice: An exploratory analysis in Mediterranean countries. Agric. Food Econ. 2022, 10, 29. [Google Scholar] [CrossRef]
- Statistics Poland—Regions of Poland 2022. Available online: https://stat.gov.pl/en/topics/other-studies/cities-voivodship/regions-of-poland-2022,5,16.html (accessed on 24 May 2022).
- Bloomingdale, A.; Guthrie, L.B.; Price, S.; Wright, R.O.; Platek, D.; Haines, J.; Oken, E. A qualitative study of fish consumption during pregnancy. Am. J. Clin. Nutr. 2010, 92, 1234–1240. [Google Scholar] [CrossRef] [PubMed]
- Sinikovic, D.S.; Yeatman, H.R.; Cameron, D.; Meyer, B.J. Women’s awareness of the importance of long-chain omega-3 polyunsaturated fatty acid consumption during pregnancy: Knowledge of risks, benefits and information accessibility. Public Health Nutr. 2009, 12, 562–569. [Google Scholar] [CrossRef]
- Ługowska, K.; Kolanowski, W. The nutritional behaviour of pregnant women in Poland. Int. J. Environ. Res. Public Health 2019, 16, 4357. [Google Scholar] [CrossRef] [PubMed]
- Książek, P.; Kozłowiec, J.; Kozłowiec, M. The nutritional knowledge of pregnant women. Pol. J. Publ. Health 2015, 124, 191–194. [Google Scholar] [CrossRef]
- Alexy, U.; Fischer, M.; Weder, S.; Längler, A.; Michalsen, A.; Keller, M. Food group intake of children and adolescents (6–18 years) on a vegetarian, vegan or omnivore diet: Results of the VeChi Youth Study. Br. J. Nutr. 2022, 128, 851–862. [Google Scholar] [CrossRef]
- Brettschneider, A.K.; Lage Barbosa, C.; Haftenberger, M.; Lehmann, F.; Mensink, G.B. Adherence to food-based dietary guidelines among adolescents in Germany according to socio-economic status and region: Results from Eating Study as a KiGGS Module (EsKiMo) II. Public Health Nutr. 2021, 24, 1216–1228. [Google Scholar] [CrossRef]
- Terry, A.L.; Herrick, K.A.; Afful, J.; Ahluwalia, N. Seafood Consumption in the United States, 2013–2016. NCHS Data Brief, no 321; National Center for Health Statistics: Hyattsville, MD, USA, 2018.
- Hinz, A.; Michalski, D.; Schwarz, R.; Herzberg, P.Y. The acquiescence effect in responding to a questionnaire. Psychosoc. Med. 2007, 4, Doc07. [Google Scholar] [PubMed]
- Benedik, E. Sources of vitamin D for humans. Int. J. Vitam. Nutr. Res. 2022, 92, 118–125. [Google Scholar] [CrossRef]
- Utri, Z.; Głąbska, D. Vitamin D intake in a population-based sample of young Polish women, its major sources and the possibility of meeting the recommendations. Foods 2020, 9, 1482. [Google Scholar] [CrossRef]
- Lachowicz, K.; Stachoń, M. Determinants of dietary vitamin D Intake in population-based cohort sample of Polish female adolescents. Int. J. Environ. Res. Public Health 2022, 19, 12184. [Google Scholar] [CrossRef] [PubMed]
- Naeeni, M.; Jafari, S.; Fouladgar, M.; Heidari, K.; Farajzadegan, Z.; Fakhri, M.; Karami, P.; Omidi, R. Nutritional knowledge, practice, and dietary habits among school children and adolescents. Int. J. Prev. Med. 2014, 5, 171–178. [Google Scholar] [CrossRef] [PubMed]
- Parmenter, K.; Waller, J.; Wardle, J. Demographic variation in nutrition knowledge in England. Health Educ. Res. 2000, 15, 163–174. [Google Scholar] [CrossRef]
- Carbonneau, E.; Lamarche, B.; Provencher, V.; Desroches, S.; Robitaille, J.; Vohl, M.C.; Bégin, C.; Bélanger, M.; Couillard, C.; Pelletier, L.; et al. Associations between nutrition knowledge and overall diet quality: The moderating role of sociodemographic characteristics—Results from the PREDISE study. Am. J. Health Promot. 2021, 35, 38–47. [Google Scholar] [CrossRef]
- Ministry of Education and Science—Career Monitoring of Graduates of Public and Non-Public Secondary Schools Edition 2021. Available online: https://www.gov.pl/web/edukacja-i-nauka/monitoring-karier-absolwentow-publicznych-i-niepublicznych-szkol-ponadpodstawowych-edycja-2022 (accessed on 9 May 2023). (In Polish)
- Grosso, G.; Mistretta, A.; Turconi, G.; Cena, H.; Roggi, C.; Galvano, F. Nutrition knowledge and other determinants of food intake and lifestyle habits in children and young adolescents living in a rural area of Sicily, South Italy. Public Health Nutr. 2013, 16, 1827–1836. [Google Scholar] [CrossRef] [PubMed]
- Akkartal, Ş.; Gezer, C. Is nutrition knowledge related to diet quality and obesity? Ecol. Food Nutr. 2020, 59, 119–129. [Google Scholar] [CrossRef]
- Milosavljević, D.; Mandić, M.L.; Banjari, I. Nutritional knowledge and dietary habits survey in high school population. Coll. Antropol. 2015, 39, 101–107. [Google Scholar]
- Akpene Amenya, P.C.; Annan, R.A.; Apprey, C.; Agbley, E.N. The relationship between nutrition and physical activity knowledge and body mass index-for-age of school-aged children in selected schools in Ghana. Heliyon 2021, 7, e08298. [Google Scholar] [CrossRef]
- Egg, S.; Wakolbinger, M.; Reisser, A.; Schätzer, M.; Wild, B.; Rust, P. Relationship between nutrition knowledge, education and other determinants of food intake and lifestyle habits among adolescents from urban and rural secondary schools in Tyrol, Western Austria. Public Health Nutr. 2020, 23, 3136–3147. [Google Scholar] [CrossRef]
- Klatka, M.; Zienkiewicz, E.; Kołłątaj, W.; Zienkiewicz, T.; Kołłątaj, B. Socio-economic development, level of urbanization and consumption of selected food products as factors in the prevalence of overweight and obesity among youths and young adults in Poland. Ann. Agric. Environ. Med. 2020, 27, 139–145. [Google Scholar] [CrossRef] [PubMed]
- Petrenya, N.; Dobrodeeva, L.; Brustad, M.; Bichkaeva, F.; Menshikova, E.; Lutfalieva, G.; Poletaeva, A.; Repina, V.; Cooper, M.; Odland, J.Ø. Fish consumption and socio-economic factors among residents of Arkhangelsk city and the rural Nenets autonomous area. Int. J. Circumpolar Health 2011, 70, 46–58. [Google Scholar] [CrossRef] [PubMed]
- Welch, A.; Lund, E.; Amiano, P.; Dorronsoro, M.; Brustad, M.; Kumle, M.; Rodriguez, M.; Lasheras, C.; Janzon, L.; Jansson, J.; et al. Variability of fish consumption within the 10 European countries participating in the European Investigation into Cancer and Nutrition (EPIC) study. Public Health Nutr. 2002, 5, 1273–1285. [Google Scholar] [CrossRef] [PubMed]
- Jakobsen, M.U.; Dethlefsen, C.; Due, K.M.; May, A.M.; Romaguera, D.; Vergnaud, A.C.; Norat, T.; Sørensen, T.I.A.; Halkjær, J.; Tjønneland, A.; et al. Fish consumption and subsequent change in body weight in European women and men. Br. J. Nutr. 2013, 109, 353–362. [Google Scholar] [CrossRef] [PubMed]
- Jakobsen, M.U.; Due, K.M.; Dethlefsen, C.; Halkjaer, J.; Holst, C.; Forouhi, N.G.; Tjønneland, A.; Boeing, H.; Buijsse, B.; Palli, D.; et al. Fish consumption does not prevent increase in waist circumference in European women and men. Br. J. Nutr. 2012, 108, 924–931. [Google Scholar] [CrossRef] [PubMed]
- Gibson, R.; Lau, C.H.E.; Loo, R.L.; Ebbels, T.M.; Chekmeneva, E.; Dyer, A.R.; Miura, K.; Ueshima, H.; Zhao, L.; Daviglus, M.L.; et al. The association of fish consumption and its urinary metabolites with cardiovascular risk factors: The International Study of Macro-/Micronutrients and Blood Pressure (INTERMAP). Am. J. Clin. Nutr. 2020, 111, 280–290. [Google Scholar] [CrossRef] [PubMed]
- Konishi, K. Associations between healthy Japanese dietary patterns and depression in Japanese women. Public Health Nutr. 2021, 24, 1753–1765. [Google Scholar] [CrossRef]
- Rogalińska, D.; Brzostowska, M.; Hausman-Czerwińska, J.; Jelińska-Hrynkiewicz, J.; Król, K.; Moskalewicz, M.; Piórkowska, I.; Poświata, J. Households. Dwellings. In Statistical Yearbook of the Regions—Poland; Statistics Poland: Warsaw, Poland, 2022; p. 64. [Google Scholar]
- Zakes, Z.; National Aquaculture Sector Overview. Poland. National Aquaculture Sector Overview Fact Sheets. Available online: https://firms.fao.org/fi/website/FIRetrieveAction.do?dom=countrysector&xml=naso_poland.xml&lang=en (accessed on 23 May 2023).
- Food Standards Agency—Food and You—Wave Four. Research Project. Available online: https://www.food.gov.uk/research/food-and-you/food-and-you-wave-four (accessed on 23 May 2023).
- Govzman, S.; Looby, S.; Wang, X.; Butler, F.; Gibney, E.R.; Timon, C.M. A systematic review of the determinants of seafood consumption. Br. J. Nutr. 2021, 126, 66–80. [Google Scholar] [CrossRef]
- Yousefian, A.; Ziller, E.; Swartz, J.; Hartley, D. Active living for rural youth: Addressing physical inactivity in rural communities. J. Public Health Manag. Pract. 2009, 15, 223–231. [Google Scholar] [CrossRef]
- Patterson, P.D.; Moore, C.G.; Probst, J.C.; Shinogle, J.A. Obesity and physical inactivity in rural America. J. Rural Health 2004, 20, 151–159. [Google Scholar] [CrossRef]
- Suliburska, J.; Bogdański, P.; Pupek-Musialik, D.; Głód-Nawrocka, M.; Krauss, H.; Piątek, J. Analysis of lifestyle of young adults in the rural and urban areas. Ann. Agric. Environ. Med. 2012, 19, 135–139. [Google Scholar] [PubMed]


| No. | Statement | Correct Answer |
|---|---|---|
| 1 | Fish are a good source of protein. | True |
| 2 | Fish contain a lot of fiber. | False |
| 3 | Fish are a good source of vitamin D. | True |
| 4 | Fish contain a lot of unhealthy fats. | False |
| 5 | Fish have good fat. | True |
| 6 | Eating fish is good for the heart. | True |
| 7 | Eating fish is not good for the brain. | False |
| 8 | Eating fish is good for you. | True |
| 9 | Fish contain a lot of healthy ‘trans’ fats. | False |
| 10 | Eating fish lowers cholesterol. | True |
| 11 | Fish are a good source of vitamin C. | False |
| 12 | Eating fish may cause allergies. | True |
| 13 | Fish may contain bacteria or parasites. | True |
| 14 | Children and adolescents should not eat fish. | False |
| 15 | Eating fish is recommended for pregnant women. | True |
| 16 | Fish may contain contaminants. | True |
| 17 | Fish should be eaten once a week at the most. | False |
| 18 | Fish may contain polychlorinated biphenyls (PCBs). | True |
| 19 | Cod is a fatty fish. | False |
| 20 | Fish may contain mercury. | True |
| All | Females | Males | ||||
|---|---|---|---|---|---|---|
| Variable | Mean ± SD | Median (Min–Max) | Mean ± SD | Median (Min–Max) | Mean ± SD | Median (Min–Max) |
| Age, years | 16.7 ± 1.2 | 17 (14–22) | 16.8 ± 1.2 | 17 (14–22) | 16.5 ± 1.3 | 16 (14–21) |
| Height, cm | 170.3 ± 8.9 | 170.0 (150.0–200.0) | 166.0 ± 6.2 | 166.0 (150.0–185.0) | 178.7 ± 7.3 | 179.0 (150.0–200.0) |
| Weight, kg | 63.7 ± 13.8 | 60.0 (35.0–120.0) | 59.1 ± 10.9 | 57.0 (35.0–115.0) | 72.6 ± 14.5 | 70.0 (40.0–120.0) |
| Studied Knowledge | Studied Statement | Answers Provided by Studied Adolescents (n = 1289) | |
|---|---|---|---|
| Correct | Incorrect | ||
| Content of nutrients in fish | Source of protein (statement 1) | 1017 (78.9%) | 272 (21.1%) |
| Not a source of fiber (statement 2) | 386 (29.9%) | 903 (70.1%) | |
| Some fish have more fat than others (statement 19) | 287 (22.3%) | 1002 (77.7%) | |
| Not a source of ‘trans’ fatty acids (statement 9) | 98 (7.6%) | 1191 (92.4%) | |
| Source of vitamin D (statement 3) | 714 (55.4%) | 575 (44.6%) | |
| Not a source of vitamin C (statement 11) | 383 (29.7%) | 906 (70.3%) | |
| General health influence of fish consumption | Good for health (statement 8) | 917 (71.1%) | 372 (28.9%) |
| Good for the heart (statement 6) | 829 (64.3%) | 460 (35.7%) | |
| Good for the brain (statement 7) | 845 (65.6%) | 444 (34.4%) | |
| Recommended to be consumed by children/adolescents (statement 14) | 966 (74.9%) | 323 (25.1%) | |
| Recommended to be consumed by pregnant women (statement 15) | 463 (35.9%) | 826 (64.1%) | |
| Recommended to be consumed at least twice a week (statement 17) | 430 (33.4%) | 859 (66.6%) | |
| Health influence of fish-derived fats | Health-promoting fatty acids (statement 5) | 992 (77.0%) | 297 (23.0%) |
| Fish-derived fatty acids good for health (statement 4) | 856 (66.4%) | 433 (33.6%) | |
| Fish-derived fatty acids lower blood cholesterol (statement 10) | 532 (41.3%) | 757 (58.7%) | |
| Safety concerns | Risk of allergies (statement 12) | 336 (26.1%) | 953 (73.9%) |
| Risk of bacteria and parasites in fish (statement 13) | 632 (49.0%) | 657 (51.0%) | |
| Risk of contaminants in fish (statement 16) | 776 (60.2%) | 513 (39.8%) | |
| Risk of polychlorinated biphenyls (PCBs) in fish (statement 18) | 264 (20.5%) | 1025 (79.5%) | |
| Risk of mercury in fish (statement 20) | 412 (32.0%) | 877 (68.0%) | |
| Studied Knowledge | Studied Statement | Answers Provided by Studied Adolescents (n = 1289) | p | |||
|---|---|---|---|---|---|---|
| Female (n = 849) | Male (n = 440) | |||||
| Correct | Incorrect | Correct | Incorrect | |||
| Content of nutrients in fish | Source of protein (statement 1) | 690 (81.3%) | 159 (18.7%) | 327 (74.3%) | 113 (25.7%) | 0.0047 |
| Not a source of fiber (statement 2) | 256 (30.2%) | 593 (69.8%) | 130 (29.5%) | 310 (70.5%) | 0.8715 | |
| Some fish have more fat than others (statement 19) | 196 (23.1%) | 653 (76.9%) | 91 (20.7%) | 349 (79.3%) | 0.3611 | |
| Not a source of ‘trans’ fatty acids (statement 9) | 69 (8.1%) | 780 (91.9%) | 29 (6.6%) | 411 (93.4%) | 0.3811 | |
| Source of vitamin D (statement 3) | 471 (55.5%) | 378 (44.5%) | 243 (55.2%) | 197 (44.8%) | 0.9789 | |
| Not a source of vitamin C (statement 11) | 265 (31.2%) | 584 (68.8%) | 118 (26.8%) | 322 (73.2%) | 0.1157 | |
| General health influence of fish consumption | Good for health (statement 8) | 627 (73.9%) | 222 (26.1%) | 290 (65.9%) | 150 (34.1%) | 0.0035 |
| Good for the heart (statement 6) | 563 (66.3%) | 286 (33.7%) | 266 (60.5%) | 174 (39.5%) | 0.0433 | |
| Good for the brain (statement 7) | 562 (66.2%) | 287 (33.8%) | 283 (64.3%) | 157 (35.7%) | 0.5414 | |
| Recommended to be consumed by children/adolescents (statement 14) | 673 (79.3%) | 176 (20.7%) | 293 (66.6%) | 147 (33.4%) | <0.0001 | |
| Recommended to be consumed by pregnant women (statement 15) | 335 (39.5%) | 514 (60.5%) | 128 (29.1%) | 312 (70.9%) | 0.0003 | |
| Recommended to be consumed at least twice a week (statement 17) | 273 (32.2%) | 576 (67.8%) | 157 (35.7%) | 283 (64.3%) | 0.2259 | |
| Health influence of fish-derived fats | Health-promoting fatty acids (statement 5) | 667 (78.6%) | 182 (21.4%) | 325 (73.9%) | 115 (26.1%) | 0.0672 |
| Fish-derived fatty acids good for health (statement 4) | 571 (67.3%) | 278 (32.7%) | 285 (64.8%) | 155 (35.2%) | 0.4050 | |
| Fish-derived fatty acids lower blood cholesterol (statement 10) | 351 (41.3%) | 498 (58.7%) | 181 (41.1%) | 259 (58.9%) | 0.9907 | |
| Safety concerns | Risk of allergies (statement 12) | 230 (27.1%) | 619 (72.9%) | 106 (24.1%) | 334 (75.9%) | 0.2729 |
| Risk of bacteria and parasites in fish (statement 13) | 427 (50.3%) | 422 (49.7%) | 205 (46.6%) | 235 (53.4%) | 0.2292 | |
| Risk of contaminants in fish (statement 16) | 513 (60.4%) | 336 (39.6%) | 263 (59.8%) | 177 (40.2%) | 0.8678 | |
| Risk of polychlorinated biphenyls (PCBs) in fish (statement 18) | 155 (18.3%) | 694 (81.7%) | 109 (24.8%) | 331 (75.2%) | 0.0075 | |
| Risk of mercury in fish (statement 20) | 286 (33.7%) | 563 (66.3%) | 126 (28.6%) | 314 (71.4%) | 0.0750 | |
| Studied Knowledge | Studied Statement | Answers Provided by Studied Adolescents (n = 1289) | p | |||
|---|---|---|---|---|---|---|
| Minors (n = 992) | Adults (n = 297) | |||||
| Correct | Incorrect | Correct | Incorrect | |||
| Content of nutrients in fish | Source of protein (statement 1) | 766 (77.2%) | 226 (22.8%) | 251 (84.5%) | 46 (15.5%) | 0.0088 |
| Not a source of fiber (statement 2) | 289 (29.1%) | 703 (70.9%) | 97 (32.7%) | 200 (67.3%) | 0.2749 | |
| Some fish have more fat than others (statement 19) | 208 (21.0%) | 784 (79.0%) | 79 (26.6%) | 218 (73.4%) | 0.0492 | |
| Not a source of ‘trans’ fatty acids (statement 9) | 70 (7.1%) | 922 (92.9%) | 28 (9.4%) | 269 (90.6%) | 0.2195 | |
| Source of vitamin D (statement 3) | 537 (54.1%) | 455 (45.9%) | 177 (59.6%) | 120 (40.4%) | 0.1107 | |
| Not a source of vitamin C (statement 11) | 283 (28.5%) | 709 (71.5%) | 100 (33.7%) | 197 (66.3%) | 0.1034 | |
| General health influence of fish consumption | Good for health (statement 8) | 683 (68.9%) | 309 (31.1%) | 234 (78.8%) | 63 (21.2%) | 0.0012 |
| Good for the heart (statement 6) | 619 (62.4%) | 373 (37.6%) | 210 (70.7%) | 87 (29.3%) | 0.0107 | |
| Good for the brain (statement 7) | 635 (64.0%) | 357 (36.0%) | 210 (70.7%) | 87 (29.3%) | 0.0394 | |
| Recommended to be consumed by children/adolescents (statement 14) | 733 (73.9%) | 259 (26.1%) | 233 (78.5%) | 64 (21.5%) | 0.1299 | |
| Recommended to be consumed by pregnant women (statement 15) | 345 (34.8%) | 647 (65.2%) | 118 (39.7%) | 179 (60.3%) | 0.1358 | |
| Recommended to be consumed at least twice a week (statement 17) | 311 (31.4%) | 681 (68.6%) | 119 (40.1%) | 178 (59.9%) | 0.0064 | |
| Health influence of fish-derived fats | Health-promoting fatty acids (statement 5) | 753 (75.9%) | 239 (24.1%) | 239 (80.5%) | 58 (19.5%) | 0.1187 |
| Fish-derived fatty acids good for health (statement 4) | 647 (65.2%) | 345 (34.8%) | 209 (70.4%) | 88 (29.6%) | 0.1146 | |
| Fish-derived fatty acids lower blood cholesterol (statement 10) | 396 (39.9%) | 596 (60.1%) | 136 (45.8%) | 161 (54.2%) | 0.0826 | |
| Safety concerns | Risk of allergies (statement 12) | 270 (27.2%) | 722 (72.8%) | 66 (22.2%) | 231 (77.8%) | 0.1000 |
| Risk of bacteria and parasites in fish (statement 13) | 491 (49.5%) | 501 (50.5%) | 141 (47.5%) | 156 (52.5%) | 0.5857 | |
| Risk of contaminants in fish (statement 16) | 587 (59.2%) | 405 (40.8%) | 189 (63.6%) | 108 (36.4%) | 0.1899 | |
| Risk of polychlorinated biphenyls (PCBs) in fish (statement 18) | 195 (19.7%) | 797 (80.3%) | 69 (23.2%) | 228 (76.8%) | 0.2086 | |
| Risk of mercury in fish (statement 20) | 316 (31.9%) | 676 (68.1%) | 96 (32.3%) | 201 (67.7%) | 0.9355 | |
| Studied Knowledge | Studied Statement | Answers Provided by Studied Adolescents (n = 1289) | p | |||||
|---|---|---|---|---|---|---|---|---|
| Underweight (n = 90) | Proper Body Mass (n = 899) | Excessive Body Mass (n = 300) | ||||||
| Correct | Incorrect | Correct | Incorrect | Correct | Incorrect | |||
| Content of nutrients in fish | Source of protein (statement 1) | 77 (85.6%) | 13 (14.4%) | 695 (77.3%) | 204 (22.7%) | 245 (81.7%) | 55 (18.3%) | 0.0765 |
| Not a source of fiber (statement 2) | 30 (33.3%) | 60 (66.7%) | 278 (30.9%) | 621 (69.1%) | 78 (26.0%) | 222 (74.0%) | 0.2093 | |
| Some fish have more fat than others (statement 19) | 25 (27.8%) | 65 (72.2%) | 210 (23.4%) | 689 (76.6%) | 52 (17.3%) | 248 (82.7%) | 0.0404 | |
| Not a source of ‘trans’ fatty acids (statement 9) | 8 (8.9%) | 82 (91.1%) | 75 (8.3%) | 824 (91.7%) | 15 (5.0%) | 285 (95.0%) | 0.1492 | |
| Source of vitamin D (statement 3) | 51 (56.7%) | 39 (43.3%) | 492 (54.7%) | 407 (45.3%) | 171 (57.0%) | 129 (43.0%) | 0.7658 | |
| Not a source of vitamin C (statement 11) | 32 (35.6%) | 58 (64.4%) | 286 (31.8%) | 613 (68.2%) | 65 (21.7%) | 235 (78.3%) | 0.0018 | |
| General health influence of fish consumption | Good for health (statement 8) | 63 (70.0%) | 27 (30.0%) | 644 (71.6%) | 255 (28.4%) | 210 (70.0%) | 90 (30.0%) | 0.8377 |
| Good for the heart (statement 6) | 58 (64.4%) | 32 (35.6%) | 588 (65.4%) | 311 (34.6%) | 183 (61.0%) | 117 (39.0%) | 0.3861 | |
| Good for the brain (statement 7) | 54 (60.0%) | 36 (40.0%) | 606 (67.4%) | 293 (32.6%) | 185 (61.7%) | 115 (38.3%) | 0.1000 | |
| Recommended to be consumed by children/adolescents (statement 14) | 68 (75.6%) | 22 (24.4%) | 682 (75.9%) | 217 (24.1%) | 216 (72.0%) | 84 (28.0%) | 0.4053 | |
| Recommended to be consumed by pregnant women (statement 15) | 31 (34.4%) | 59 (65.6%) | 318 (35.4%) | 581 (64.6%) | 114 (38.0%) | 186 (62.0%) | 0.6818 | |
| Recommended to be consumed at least twice a week (statement 17) | 25 (27.8%) | 65 (72.2%) | 313 (34.8%) | 586 (65.2%) | 92 (30.7%) | 208 (69.3%) | 0.2124 | |
| Health influence of fish-derived fats | Health-promoting fatty acids (statement 5) | 66 (73.3%) | 24 (26.7%) | 701 (78.0%) | 198 (22.0%) | 225 (75.0%) | 75 (25.0%) | 0.3984 |
| Fish-derived fatty acids good for health (statement 4) | 59 (65.6%) | 31 (34.4%) | 603 (67.1%) | 296 (32.9%) | 194 (64.7%) | 106 (35.3%) | 0.7349 | |
| Fish-derived fatty acids lower blood cholesterol (statement 10) | 36 (40.0%) | 54 (60.0%) | 373 (41.5%) | 526 (58.5%) | 123 (41.0%) | 177 (59.0%) | 0.9575 | |
| Safety concerns | Risk of allergies (statement 12) | 20 (22.2%) | 70 (77.8%) | 234 (26.0%) | 665 (74.0%) | 82 (27.3%) | 218 (72.7%) | 0.6248 |
| Risk of bacteria and parasites in fish (statement 13) | 41 (45.6%) | 49 (54.4%) | 446 (49.6%) | 453 (50.4%) | 145 (48.3%) | 155 (51.7%) | 0.7355 | |
| Risk of contaminants in fish (statement 16) | 49 (54.4%) | 41 (45.6%) | 558 (62.1%) | 341 (37.9%) | 169 (56.3%) | 131 (43.7%) | 0.1093 | |
| Risk of polychlorinated biphenyls (PCBs) in fish (statement 18) | 19 (21.1%) | 71 (78.9%) | 188 (20.9%) | 711 (79.1%) | 57 (19.0%) | 243 (81.0%) | 0.7678 | |
| Risk of mercury in fish (statement 20) | 29 (32.2%) | 61 (67.8%) | 293 (32.6%) | 606 (67.4%) | 90 (30.0%) | 210 (70.0%) | 0.7055 | |
| Studied Knowledge | Studied Statement | Answers Provided by Studied Adolescents (n = 1289) | p | |||
|---|---|---|---|---|---|---|
| Rural Environment (n = 678) | Urban Environment (n = 611) | |||||
| Correct | Incorrect | Correct | Incorrect | |||
| Content of nutrients in fish | Source of protein (statement 1) | 540 (79.6%) | 138 (20.4%) | 477 (78.1%) | 134 (21.9%) | 0.5322 |
| Not a source of fiber (statement 2) | 196 (28.9%) | 482 (71.1%) | 190 (31.1%) | 421 (68.9%) | 0.4263 | |
| Some fish have more fat than others (statement 19) | 134 (19.8%) | 544 (80.2%) | 153 (25.0%) | 458 (75.0%) | 0.0273 | |
| Not a source of ‘trans’ fatty acids (statement 9) | 49 (7.2%) | 629 (92.8%) | 49 (8.0%) | 562 (92.0%) | 0.6667 | |
| Source of vitamin D (statement 3) | 367 (54.1%) | 311 (45.9%) | 347 (56.8%) | 264 (43.2%) | 0.3660 | |
| Not a source of vitamin C (statement 11) | 187 (27.6%) | 491 (72.4%) | 196 (32.1%) | 415 (67.9%) | 0.0885 | |
| General health influence of fish consumption | Good for health (statement 8) | 472 (69.6%) | 206 (30.4%) | 445 (72.8%) | 166 (27.2%) | 0.2261 |
| Good for the heart (statement 6) | 423 (62.4%) | 255 (37.6%) | 406 (66.4%) | 205 (33.6%) | 0.1441 | |
| Good for the brain (statement 7) | 417 (61.5%) | 261 (38.5%) | 428 (70.0%) | 183 (30.0%) | 0.0016 | |
| Recommended to be consumed by children/adolescents (statement 14) | 495 (73.0%) | 183 (27.0%) | 471 (77.1%) | 140 (22.9%) | 0.1047 | |
| Recommended to be consumed by pregnant women (statement 15) | 236 (34.8%) | 442 (65.2%) | 227 (37.2%) | 384 (62.8%) | 0.4135 | |
| Recommended to be consumed at least twice a week (statement 17) | 218 (32.2%) | 460 (67.8%) | 212 (34.7%) | 399 (65.3%) | 0.3638 | |
| Health influence of fish-derived fats | Health-promoting fatty acids (statement 5) | 507 (74.8%) | 171 (25.2%) | 485 (79.4%) | 126 (20.6%) | 0.0585 |
| Fish-derived fatty acids good for health (statement 4) | 427 (63.0%) | 251 (37.0%) | 429 (70.2%) | 182 (29.8%) | 0.0072 | |
| Fish-derived fatty acids lower blood cholesterol (statement 10) | 276 (40.7%) | 402 (59.3%) | 256 (41.9%) | 355 (58.1%) | 0.7063 | |
| Safety concerns | Risk of allergies (statement 12) | 173 (25.5%) | 505 (74.5%) | 163 (26.7%) | 448 (73.3%) | 0.6813 |
| Risk of bacteria and parasites in fish (statement 13) | 321 (47.3%) | 357 (52.7%) | 311 (50.9%) | 300 (49.1%) | 0.2228 | |
| Risk of contaminants in fish (statement 16) | 380 (56.0%) | 298 (44.0%) | 396 (64.8%) | 215 (35.2%) | 0.0016 | |
| Risk of polychlorinated biphenyls (PCBs) in fish (statement 18) | 133 (19.6%) | 545 (80.4%) | 131 (21.4%) | 480 (78.6%) | 0.4587 | |
| Risk of mercury in fish (statement 20) | 206 (30.4%) | 472 (69.6%) | 206 (33.7%) | 405 (66.3%) | 0.2221 | |
| Studied Knowledge | Studied Statement | Answers Provided by Studied Adolescents (n = 1289) | p | |||
|---|---|---|---|---|---|---|
| Region Situated by the Sea (n = 384) | Region Situated Far away from the Sea (n = 905) | |||||
| Correct | Incorrect | Correct | Incorrect | |||
| Content of nutrients in fish | Source of protein (statement 1) | 310 (80.7%) | 74 (19.3%) | 707 (78.1%) | 198 (21.9%) | 0.3297 |
| Not a source of fiber (statement 2) | 85 (22.1%) | 299 (77.9%) | 301 (33.3%) | 604 (66.7%) | 0.0001 | |
| Some fish have more fat than others (statement 19) | 62 (16.1%) | 322 (83.9%) | 225 (24.9%) | 680 (75.1%) | 0.0008 | |
| Not a source of ‘trans’ fatty acids (statement 9) | 29 (7.6%) | 355 (92.4%) | 69 (7.6%) | 836 (92.4%) | 1.0000 | |
| Source of vitamin D (statement 3) | 218 (56.8%) | 166 (43.2%) | 496 (54.8%) | 409 (45.2%) | 0.5568 | |
| Not a source of vitamin C (statement 11) | 85 (22.1%) | 299 (77.9%) | 298 (32.9%) | 607 (67.1%) | 0.0001 | |
| General health influence of fish consumption | Good for health (statement 8) | 270 (70.3%) | 114 (29.7%) | 647 (71.5%) | 258 (28.5%) | 0.7188 |
| Good for the heart (statement 6) | 247 (64.3%) | 137 (35.7%) | 582 (64.3%) | 323 (35.7%) | 1.0000 | |
| Good for the brain (statement 7) | 236 (61.5%) | 148 (38.5%) | 609 (67.3%) | 296 (32.7%) | 0.0509 | |
| Recommended to be consumed by children/adolescents (statement 14) | 264 (68.8%) | 120 (31.3%) | 702 (77.6%) | 203 (22.4%) | 0.0011 | |
| Recommended to be consumed by pregnant women (statement 15) | 141 (36.7%) | 243 (63.3%) | 322 (35.6%) | 583 (64.4%) | 0.7443 | |
| Recommended to be consumed at least twice a week (statement 17) | 118 (30.7%) | 266 (69.3%) | 312 (34.5%) | 593 (65.5%) | 0.2150 | |
| Health influence of fish-derived fats | Health-promoting fatty acids (statement 5) | 287 (74.7%) | 97 (25.3%) | 705 (77.9%) | 200 (22.1%) | 0.2460 |
| Fish-derived fatty acids good for health (statement 4) | 243 (63.3%) | 141 (36.7%) | 613 (67.7%) | 292 (32.3%) | 0.1379 | |
| Fish-derived fatty acids lower blood cholesterol (statement 10) | 148 (38.5%) | 236 (61.5%) | 384 (42.4%) | 521 (57.6%) | 0.2167 | |
| Safety concerns | Risk of allergies (statement 12) | 96 (25.0%) | 288 (75.0%) | 240 (26.5%) | 665 (73.5%) | 0.6178 |
| Risk of bacteria and parasites in fish (statement 13) | 179 (46.6%) | 205 (53.4%) | 453 (50.1%) | 452 (49.9%) | 0.2850 | |
| Risk of contaminants in fish (statement 16) | 224 (58.3%) | 160 (41.7%) | 552 (61.0%) | 353 (39.0%) | 0.4063 | |
| Risk of polychlorinated biphenyls (PCBs) in fish (statement 18) | 70 (18.2%) | 314 (81.8%) | 194 (21.4%) | 711 (78.6%) | 0.2189 | |
| Risk of mercury in fish (statement 20) | 92 (24.0%) | 292 (76.0%) | 320 (35.4%) | 585 (64.6%) | 0.0001 | |
| Studied Knowledge | Studied Statement | Answers Provided by Studied Adolescents (n = 1289) | p | |||
|---|---|---|---|---|---|---|
| Comprehensive School (n = 449) | Vocational School (n = 840) | |||||
| Correct | Incorrect | Correct | Incorrect | |||
| Content of nutrients in fish | Source of protein (statement 1) | 362 (80.6%) | 87 (19.4%) | 655 (78.0%) | 185 (22.0%) | 0.2992 |
| Not a source of fiber (statement 2) | 170 (37.9%) | 279 (62.1%) | 216 (25.7%) | 624 (74.3%) | <0.0001 | |
| Some fish have more fat than others (statement 19) | 152 (33.9%) | 297 (66.1%) | 135 (16.1%) | 705 (83.9%) | <0.0001 | |
| Not a source of ‘trans’ fatty acids (statement 9) | 34 (7.6%) | 415 (92.4%) | 64 (7.6%) | 776 (92.4%) | 1.0000 | |
| Source of vitamin D (statement 3) | 265 (59.0%) | 184 (41.0%) | 449 (53.5%) | 391 (46.5%) | 0.0633 | |
| Not a source of vitamin C (statement 11) | 171 (38.1%) | 278 (61.9%) | 212 (25.2%) | 628 (74.8%) | <0.0001 | |
| General health influence of fish consumption | Good for health (statement 8) | 330 (73.5%) | 119 (26.5%) | 587 (69.9%) | 253 (30.1%) | 0.1934 |
| Good for the heart (statement 6) | 307 (68.4%) | 142 (31.6%) | 522 (62.1%) | 318 (37.9%) | 0.0305 | |
| Good for the brain (statement 7) | 321 (71.5%) | 128 (28.5%) | 524 (62.4%) | 316 (37.6%) | 0.0013 | |
| Recommended to be consumed by children/adolescents (statement 14) | 380 (84.6%) | 69 (15.4%) | 586 (69.8%) | 254 (30.2%) | <0.0001 | |
| Recommended to be consumed by pregnant women (statement 15) | 164 (36.5%) | 285 (63.5%) | 299 (35.6%) | 541 (64.4%) | 0.7866 | |
| Recommended to be consumed at least twice a week (statement 17) | 175 (39.0%) | 274 (61.0%) | 255 (30.4%) | 585 (69.6%) | 0.0022 | |
| Health influence of fish-derived fats | Health-promoting fatty acids (statement 5) | 377 (84.0%) | 72 (16.0%) | 615 (73.2%) | 225 (26.8%) | <0.0001 |
| Fish-derived fatty acids good for health (statement 4) | 337 (75.1%) | 112 (24.9%) | 519 (61.8%) | 321 (38.2%) | <0.0001 | |
| Fish-derived fatty acids lower blood cholesterol (statement 10) | 206 (45.9%) | 243 (54.1%) | 326 (38.8%) | 514 (61.2%) | 0.0165 | |
| Safety concerns | Risk of allergies (statement 12) | 135 (30.1%) | 314 (69.9%) | 201 (23.9%) | 639 (76.1%) | 0.0201 |
| Risk of bacteria and parasites in fish (statement 13) | 258 (57.5%) | 191 (42.5%) | 374 (44.5%) | 466 (55.5%) | <0.0001 | |
| Risk of contaminants in fish (statement 16) | 317 (70.6%) | 132 (29.4%) | 459 (54.6%) | 381 (45.4%) | <0.0001 | |
| Risk of polychlorinated biphenyls (PCBs) in fish (statement 18) | 104 (23.2%) | 345 (76.8%) | 160 (19.0%) | 680 (81.0%) | 0.0946 | |
| Risk of mercury in fish (statement 20) | 191 (42.5%) | 258 (57.5%) | 221 (26.3%) | 619 (73.7%) | <0.0001 | |
| Studied Knowledge | Studied Statement | Gender | Age | Body Mass | Environment | Region | Type of School |
|---|---|---|---|---|---|---|---|
| Content of nutrients in fish | Source of protein (statement 1) | Female > Male | Minors < Adults | ||||
| Not a source of fiber (statement 2) | By the sea < Far away from | Comprehensive > Vocational school | |||||
| Some fish have more fat than others (statement 19) | Minors < Adults | Underweight > Proper body mass > Excessive body mass | Rural < Urban | By the sea < Far away from | Comprehensive > Vocational school | ||
| Not a source of ‘trans’ fatty acids (statement 9) | |||||||
| Source of vitamin D (statement 3) | |||||||
| Not a source of vitamin C (statement 11) | Underweight > Proper body mass > Excessive body mass | By the sea < Far away from | Comprehensive > Vocational school | ||||
| General health influence of fish consumption | Good for health (statement 8) | Female > Male | Minors < Adults | ||||
| Good for the heart (statement 6) | Female > Male | Minors < Adults | Comprehensive > Vocational school | ||||
| Good for the brain (statement 7) | Minors < Adults | Rural < Urban | Comprehensive > Vocational school | ||||
| Recommended to be consumed by children/adolescents (statement 14) | Female > Male | By the sea < Far away from | Comprehensive > Vocational school | ||||
| Recommended to be consumed by pregnant women (statement 15) | Female > Male | ||||||
| Recommended to be consumed at least twice a week (statement 17) | Minors < Adults | Comprehensive > Vocational school | |||||
| Health influence of fish-derived fats | Health-promoting fatty acids (statement 5) | Comprehensive > Vocational school | |||||
| Fish-derived fatty acids good for health (statement 4) | Rural < Urban | Comprehensive > Vocational school | |||||
| Fish-derived fatty acids lower blood cholesterol (statement 10) | Comprehensive > Vocational school | ||||||
| Safety concerns | Risk of allergies (statement 12) | Comprehensive > Vocational school | |||||
| Risk of bacteria and parasites in fish (statement 13) | Comprehensive > Vocational school | ||||||
| Risk of contaminants in fish (statement 16) | Rural < Urban | Comprehensive > Vocational school | |||||
| Risk of polychlorinated biphenyls (PCBs) in fish (statement 18) | Female < Male | ||||||
| Risk of mercury in fish (statement 20) | By the sea < Far away from | Comprehensive > Vocational school |
Disclaimer/Publisher’s Note: The statements, opinions and data contained in all publications are solely those of the individual author(s) and contributor(s) and not of MDPI and/or the editor(s). MDPI and/or the editor(s) disclaim responsibility for any injury to people or property resulting from any ideas, methods, instructions or products referred to in the content. |
© 2023 by the authors. Licensee MDPI, Basel, Switzerland. This article is an open access article distributed under the terms and conditions of the Creative Commons Attribution (CC BY) license (https://creativecommons.org/licenses/by/4.0/).
Share and Cite
Utri-Khodadady, Z.; Głąbska, D. Analysis of Fish-Consumption Benefits and Safety Knowledge in a Population-Based Sample of Polish Adolescents. Nutrients 2023, 15, 4902. https://doi.org/10.3390/nu15234902
Utri-Khodadady Z, Głąbska D. Analysis of Fish-Consumption Benefits and Safety Knowledge in a Population-Based Sample of Polish Adolescents. Nutrients. 2023; 15(23):4902. https://doi.org/10.3390/nu15234902
Chicago/Turabian StyleUtri-Khodadady, Zofia, and Dominika Głąbska. 2023. "Analysis of Fish-Consumption Benefits and Safety Knowledge in a Population-Based Sample of Polish Adolescents" Nutrients 15, no. 23: 4902. https://doi.org/10.3390/nu15234902
APA StyleUtri-Khodadady, Z., & Głąbska, D. (2023). Analysis of Fish-Consumption Benefits and Safety Knowledge in a Population-Based Sample of Polish Adolescents. Nutrients, 15(23), 4902. https://doi.org/10.3390/nu15234902