Article

Wheat Grains as a Sustainable Source of Protein for Health

by
Dalia Z. Alomari
1,*,
Matías Schierenbeck
2,3,*,
Ahmad M. Alqudah
4,
Mashael Daghash Alqahtani
5,
Steffen Wagner
2,
Hardy Rolletschek
2,
Ljudmilla Borisjuk
2 and
Marion S. Röder
2
1
Department of Clinical Nutrition and Dietetics, Faculty of Applied Medical Sciences, The Hashemite University, P.O. Box 330127, Zarqa 13133, Jordan
2
Leibniz Institute of Plant Genetics and Crop Plant Research (IPK), Corrensstraße 3, OT Gatersleben, D-06466 Seeland, Germany
3
CONICET CCT La Plata, La Plata 1900, Buenos Aires, Argentina
4
Biological Science Program, Department of Biological and Environmental Sciences, College of Art and Science, Qatar University, Doha P.O. Box 2713, Qatar
5
Department of Biology, College of Science, Princess Nourah bint Abdulrahman University, P.O. Box 84428, Riyadh 11671, Saudi Arabia
*
Authors to whom correspondence should be addressed.
Nutrients 2023, 15(20), 4398; https://doi.org/10.3390/nu15204398
Submission received: 10 September 2023 / Revised: 9 October 2023 / Accepted: 11 October 2023 / Published: 17 October 2023
(This article belongs to the Section Nutrigenetics and Nutrigenomics)

Abstract

:
Protein deficiency is recognized among the major global health issues with an underestimation of its importance. Genetic biofortification is a cost-effective and sustainable strategy to overcome global protein malnutrition. This study was designed to focus on protein-dense grains of wheat (Triticum aestivum L.) and identify the genes governing grain protein content (GPC) that improve end-use quality and in turn human health. Genome-wide association was applied using the 90k iSELECT Infinium and 35k Affymetrix arrays with GPC quantified by using a proteomic-based technique in 369 wheat genotypes over three field-year trials. The results showed significant natural variation among bread wheat genotypes that led to detecting 54 significant quantitative trait nucleotides (QTNs) surpassing the false discovery rate (FDR) threshold. These QTNs showed contrasting effects on GPC ranging from −0.50 to +0.54% that can be used for protein content improvement. Further bioinformatics analyses reported that these QTNs are genomically linked with 35 candidate genes showing high expression during grain development. The putative candidate genes have functions in the binding, remobilization, or transport of protein. For instance, the promising QTN AX-94727470 on chromosome 6B increases GPC by +0.47% and is physically located inside the gene TraesCS6B02G384500 annotated as Trehalose 6-phosphate phosphatase (T6P), which can be employed to improve grain protein quality. Our findings are valuable for the enhancement of protein content and end-use quality in one of the major daily food resources that ultimately improve human nutrition.

1. Introduction

Cereal grains are a major source of energy, carbohydrates, and dietary proteins. Notably, 41% of grains are used for human consumption, and up to 35% are used for animal feed. Increasing the use of plant-based foods to replace animal-based foods is one feasible strategy for reaching the goal of replacing plant protein with animal protein [1].
Bread wheat (Triticum aestivum L.) is a staple crop for an estimated 35% of the world’s human population providing a fifth of global food calories. By 2022, wheat was cultivated on an estimated 221 million hectares, making it the most widely grown crop worldwide. In the last year, the global production reach 781 million tones, and together with rice and maize, wheat is considered one of the big global staple cereals [2]. Wheat grain protein content (GPC) is considered the main source of vegetable protein in human diets, particularly in regions where animal protein is scarce or expensive [3,4,5]. Wheat has two textural classes: soft and hard. The two classes of wheat are used for different purposes as hard wheat is mainly used for making bread and pasta, while soft wheat is utilized for making biscuits and cakes [6].
One of the major causes of infection in humans is a lack of secondary immunity caused by protein-energy malnutrition (PEM). Marasmus (chronic wasting) or kwashiorkor (edema and anemia) are the two symptoms of acute PEM in infants [7]. In children with chronic PEM, cognitive growth is hampered [8]. In developing countries, protein-energy malnutrition is one of the leading causes of death, with pregnant women and young children being the most vulnerable [9].
Overall, wheat grain’s chemical composition makes it a staple crop with versatile uses in various food products worldwide. Wheat grain consists primarily of carbohydrates (70–75%), mainly in the form of starch, followed by protein (10–15%), fats (1–2%), vitamins (such as B-vitamins), minerals (like iron and magnesium), fiber (2–3%), and water (10–15%) [10,11]. On the food processing side, the GPC and starch content of wheat grains constitute a crucial factor determining the baking quality of flour [12,13,14]. Wheat proteins, particularly gluten, play a significant role in determining the dough’s strength, elasticity, and extensibility, which ultimately determine the quality of baked products [15]. The gluten proteins contribute to the structure of bread by forming a strong and elastic network that traps gases produced by yeast during fermentation, leading to a well-risen and airy bread. Wheat varieties with high GPC are generally preferred for bread-making because they produce doughs that are easier to handle and result in bread with better volume, texture, and crumb structure [16]. Since the positive association between GPC and baking quality is critical for producing high-quality flour and baked products, more genetic studies are necessary to deepen knowledge of how to improve protein contents [10,17], taking into consideration the fact that selecting varieties with higher GPC was indicated as one of the priorities among breeders [18,19].
Exploration of genetic resources is a valuable approach for identifying novel sources of variation for traits, quantitative trait loci (QTLs), and candidate genes for improving grain quality and grain yield-related characters [20,21]. At present, genetic regions controlling GPC in bread wheat have been recognized by performing a QTLs approach using biparental as well as diverse collections [22,23,24,25]. Some reviews have listed significant marker-trait associations (MTAs) in several chromosomes [26]. As an example, a GWAS analysis performed by [24] reported two QTLs related to GPC on 2B and 6A. Recent reports by [17] documented some multi-environment genetic markers associated with GPC on 3A and 3B, while [27], studying a diverse panel of 184 accessions, reported 23 significant QTLs distributed over the wheat genome. Moreover, [28] analyzed 394 multiparent advanced generation intercross population lines (MAGIC) and documented 12 QTLs explaining only a small amount of phenotypic variance (≤10%) on many chromosomes. Nonetheless, and due to wheat’s importance as a source of vegetable protein worldwide and the association of GPC with baking and milling quality, novel attempts are necessary to explore the genetic basis of GPC in bread wheat helping human health.
In the current study, a GWAS was implemented to analyze 369 European wheat genotypes for GPC over three years. Our objective was to detect candidate genes linked to GPC and, subsequently, elucidate how the genetic mechanism controls GPC variations and how it can be implemented to improve GPC and end-use quality. Here, we present many significant markers which are physically co-located inside candidate genes. The identified genes are mostly involved in protein synthesis and accumulation mechanisms in wheat grains that improve grain nutrient and end-use quality which are crucial for human health.

2. Materials and Methods

2.1. Plant Material

The hexaploid wheat germplasm used comprised 369 elite European registered varieties including 355 winter genotypes and 14 spring accessions described in [29,30]. The genotypes were mostly from Germany and France in addition to other European countries. Field experiments were conducted at the Leibniz Institute of Plant Genetics and Crop Plant Research (IPK, Gatersleben, Germany) during the years 2014–2017 (2014/2015, 2015/2016, and 2016/2017) where the whole set of the germplasm was sown at each year. A plot with a size of 2 × 2 m was used for each genotype with six rows spaced 0.20 m apart. More details were described in a previous study [31]. Standard agronomic wheat management practices were applied to the soil and plots.

2.2. Determination of Total Seed Protein

Seed protein was determined from dry mature seeds that were finely ground before analysis (Retsch mill MM200). Analysis was done using near infrared (NIR) spectroscopy (MPA, Multi Purpose Analyzer, Bruker GmbH, Bremen, Germany) [32], applying multivariate calibration algorithms (software OPUS, Bruker GmbH) and the reference material library B-FING-S (Bruker GmbH).

2.3. Statistical Analysis

The variance (ANOVA) analysis for protein was calculated, and the significant differences among genotypes and years were determined at a probability level of p ≤ 0.05. The Pearson correlation coefficient was used to evaluate the relationships among the measured parameters of data (p-value ≤ 0.05). ANOVA and Pearson’s correlation coefficient were calculated using GenStat v19 software [33]. Using GenStat v19, the best linear unbiased estimates (BLUEs) over three years were calculated from restricted maximum likelihood (REML) analysis with a mixed linear model and considering genotype as a fixed effect and the environment as a random effect. BLUEs were calculated for each genotype of each trait across the years (2015, 2016, and 2017).
Broad-sense heritability (H2) was calculated for each trait using the formula:
VG/(VG + ((Ge/ nE))
where VG is the variance of the genotype, Ge represents the variance of the residual, and nE is the number of years [34].

2.4. Genotyping and Marker Quality Control

Our wheat population was genotyped using two marker arrays: a 90K iSELECT Infinium array including 7761 markers and a 35K Affymetrix SNP array (Axiom® Wheat Breeder’s Genotyping Array) including 7762 markers [35,36] (https://www.cerealsdb.uk.net/cerealgenomics/). These two arrays were genotyped by using the SGS-TraitGenetics GmbH, Gatersleben, Germany (www.traitgenetics.com) described for this germplasm by [29,30]. The ITMI-DH population was used as a reference map [37,38] to anchor the SNP markers of the 90 K and 35 K arrays. To obtain high-quality makers, the SNPs in chips underwent a quality control and filtration process by removing the markers with ≥3% missing values, a minor allele frequency (MAF) of ≤3%, and markers with unknown chromosomal positions. Then, we used the physical position of the wheat genome sequence RefSeq v1.1 for the SNPs.

2.5. GWAS Analysis

GWAS analysis was calculated by using the Genomic Association and Prediction Integrated Tool (GAPIT 3) in R software [39,40]. First, GWAS analysis was computed by using the mixed linear model (MLM), which took into account the variance–covariance kinship matrix and PCA and was accomplished by incorporating the phenotypic and genotypic datasets. Moreover, the kinship matrix was calculated using the VanRaden method [41] to determine the relative kinship among the sampled individuals. Both PCA and the kinship matrix were used for population correction and stratification.
Another recent powerful GAPIT model known as the Fixed and random model Circulating Probability Unification (FarmCPU) was applied to our data analysis. The FarmCPU model was applied by considering the incorporation of multiple markers simultaneously as a covariate in a fixed effect model and optimization on the associated covariate markers in a random effect model separately, which empowered us to avoid any false negative and control the false positive associations by preventing model overfitting [42]. Thus, FarmCPU is a powerful tool with less false positives than MLM. The selection of an appropriate model and threshold are important steps in identifying markers that are truly associated with specific traits and which could be located within or very close to genes that control the trait variation, while controlling both false-positive and false-negative associations. To determine which of the tested models best fit the data, we plotted the quantile-quantile (Q-Q) plot which was drawn based on the observed and expected −log10 (p) values. Then, based on the GWAS output of the three models (GLM, MLM, and FarmCPU), the number of significant associations, and the resulted QQ-plot, we selected the FarmCPU. A threshold p-value ≤0.0001 equal to −log10 (p) ≥ 4 was considered to indicate significant associated quantitative trait nucleotides (QTNs) and used for further analysis. Marker effects (positive/negative on %GPC) and phenotypic variance explained by the associated markers (R2) were removed from the GWAS results.

2.6. Genes’ Identification, Annotation, and Expression Analysis

Significant markers and the markers located within the LD region (r2 ≥ 0.2) were considered for BLAST. The sequence of the identified makers was obtained from the wheat 90k [35] and 35k database [36]. Marker sequences were BLASTed against the recently released IWGSC RefSeq v1.1 genome by Ensemble Plants (http://plants.ensembl.org/Triticum_aestivum) to obtain their gene annotation. The expression profile of all the putative candidate genes associated with the identified SNPs was checked using the published RNA-seq expression database of wheat in the WheatGmap web tool (https://www.wheatgmap.org) [43].

3. Results

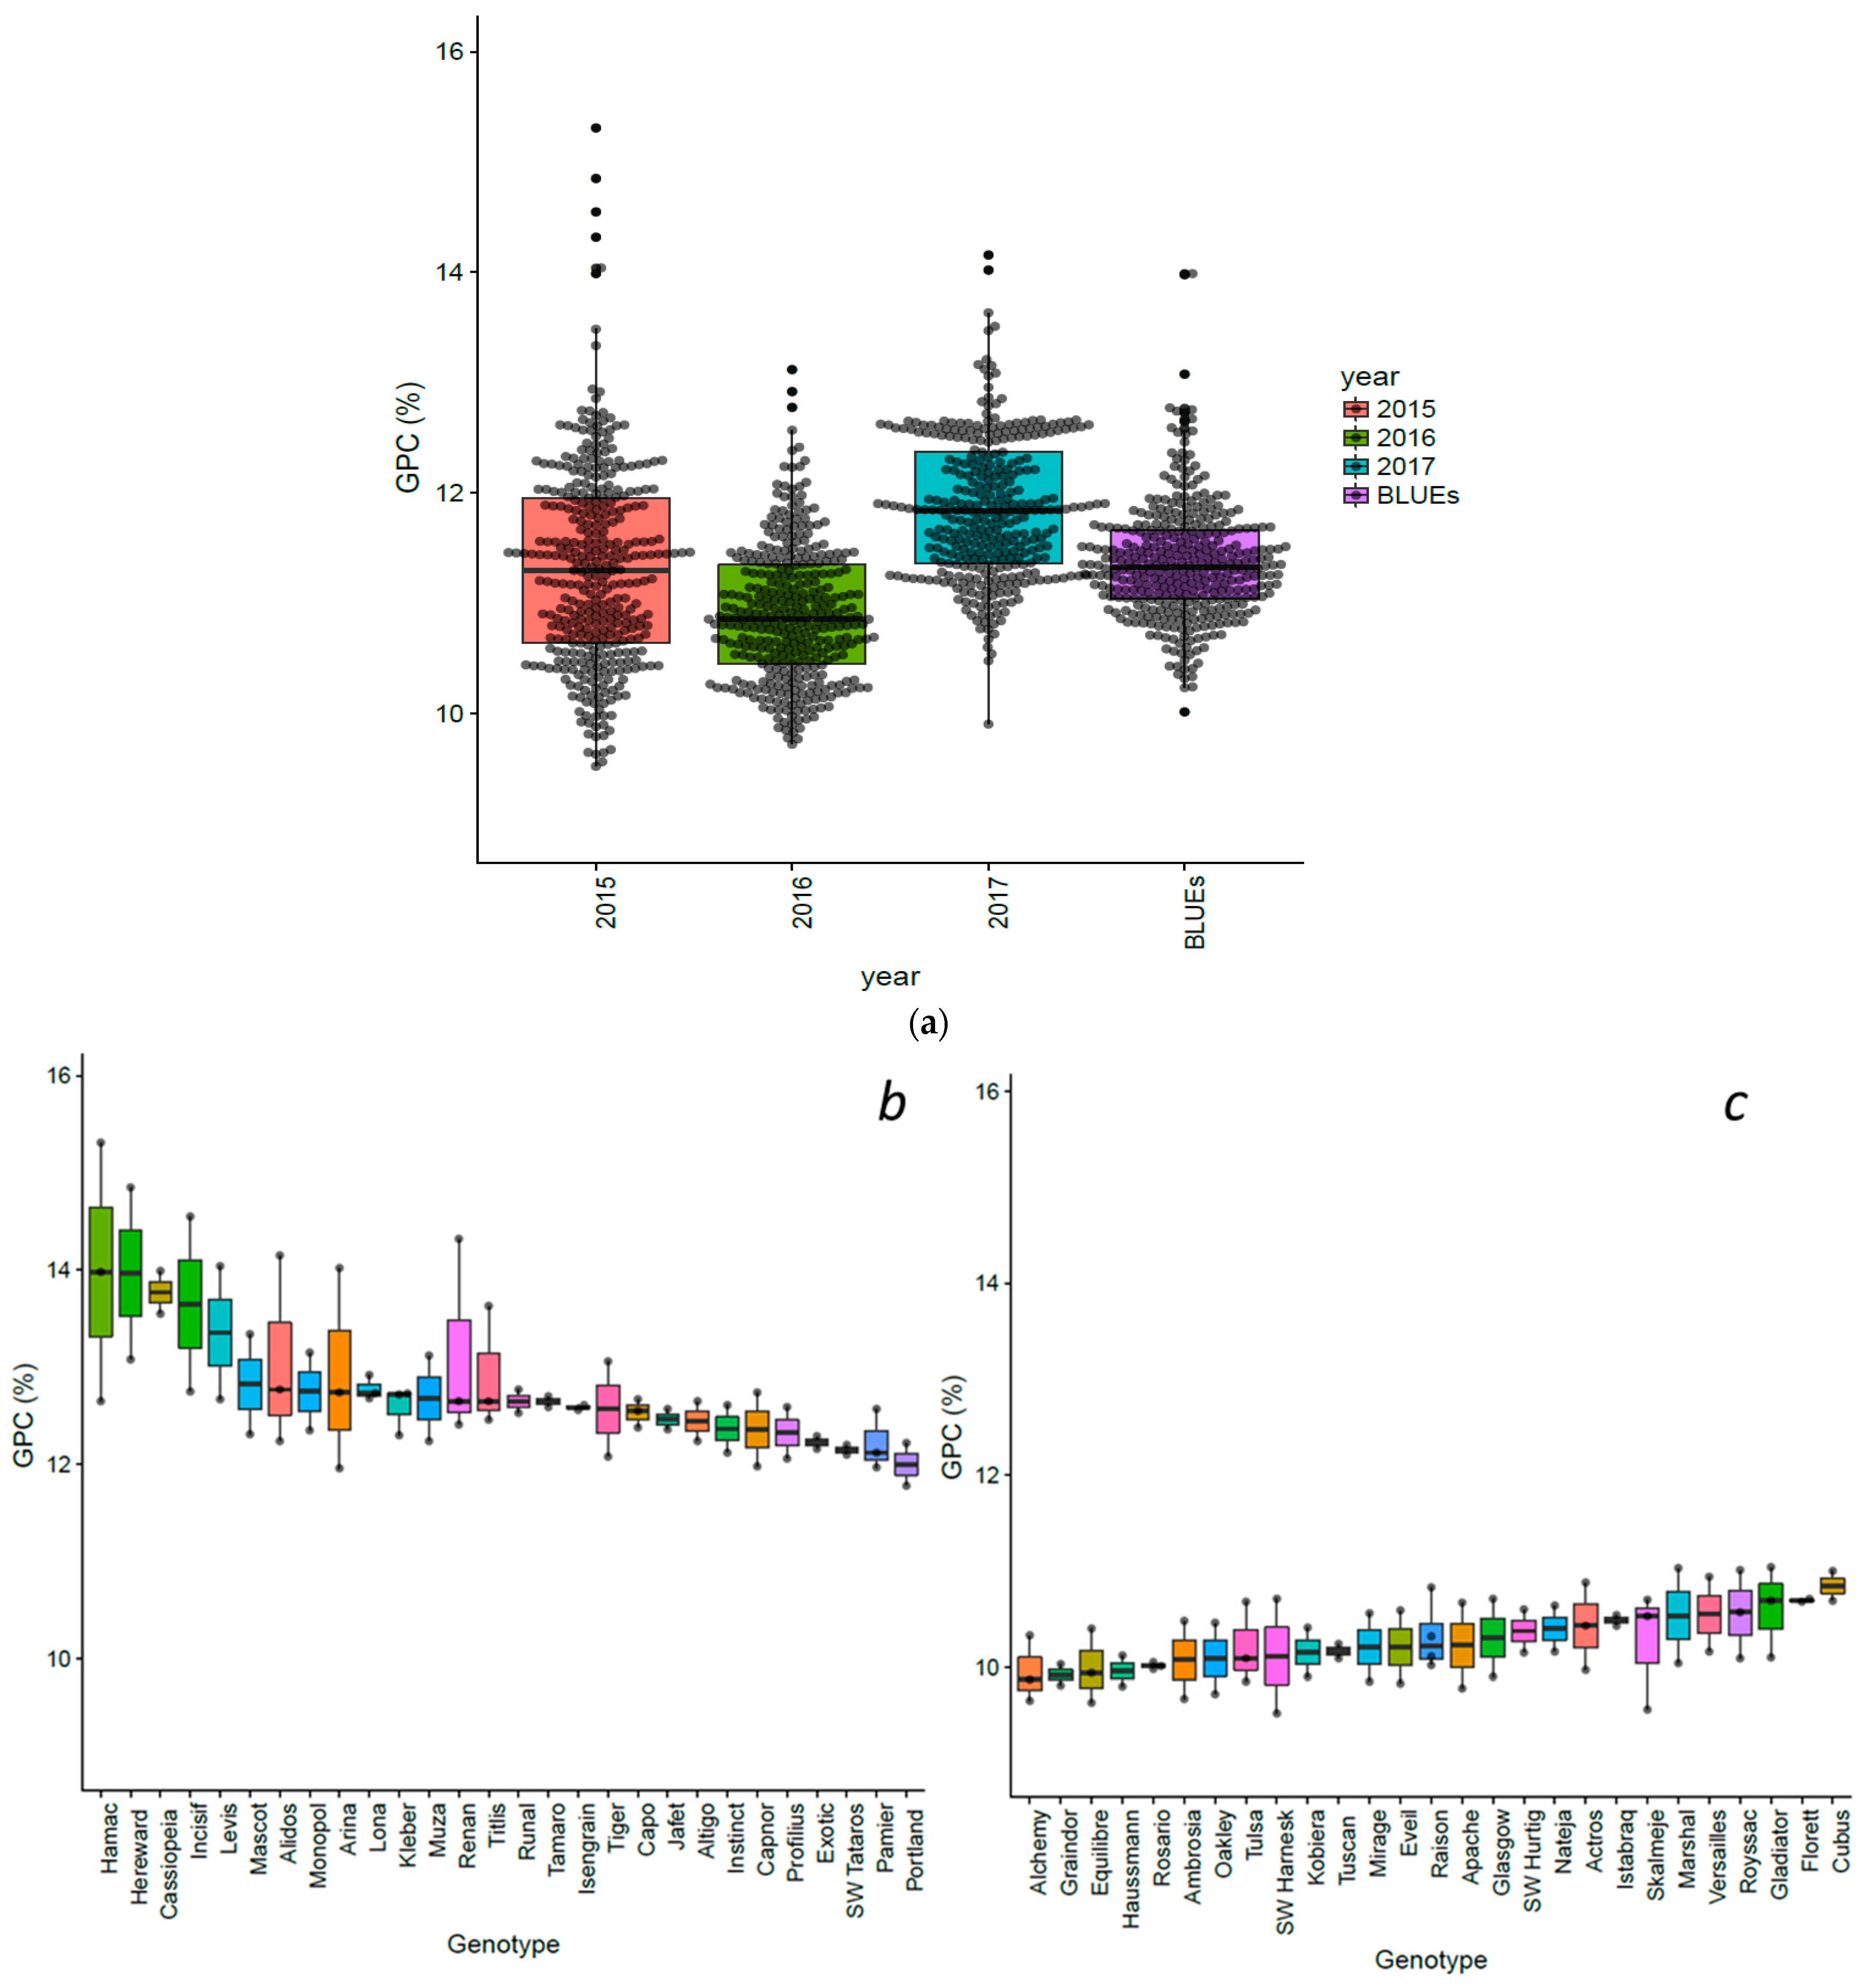
3.1. Variations of Grain Protein Content in a Worldwide Winter Wheat Panel

Grain protein content was significantly influenced by the years, genotypes, and Year × Genotypes interactions (p < 0.001). Data analysis revealed extensive phenotypic variation in all studied traits. Broad-sense heritability for GPC equaled 0.8. GPC among different years, and genotypes showing higher and lower GPC across the environments, summary statics, and correlations are exhibited in Figure 1 and Figure 2 and Supplementary Table S1.
Grain protein values ranged between 9.9–14.15% (2015), 9.7–13.12% (2016), 9.5–15.31% (2017), and 10.0 to 13.99% for BLUEs (Figure 1a; Table S1). The genotypes showing the higher and lower GPC across the years are plotted in Figure 1b,c. Accessions such as Hamac (13.98%), Hereward (13.96%), Cassiopeia (13.77%), Incisic (13.65%), Levis (13.35%), Renan (13.13%), and Alidos (13.05%) stood out for their high GPC values (Figure 1b). For their part, accessions showing the lower GPC values were Graindor (9.92), Alchemy (9.95), Haussmann (9.96), Equilibre (9.99), Rosario (10.01), and Ambrossia (10.08) (Figure 1c). Low to high positive Pearson’s correlation coefficients were detected among environments and BLUEs, showing variation in GPC among genotypes and environments (Figure 2).

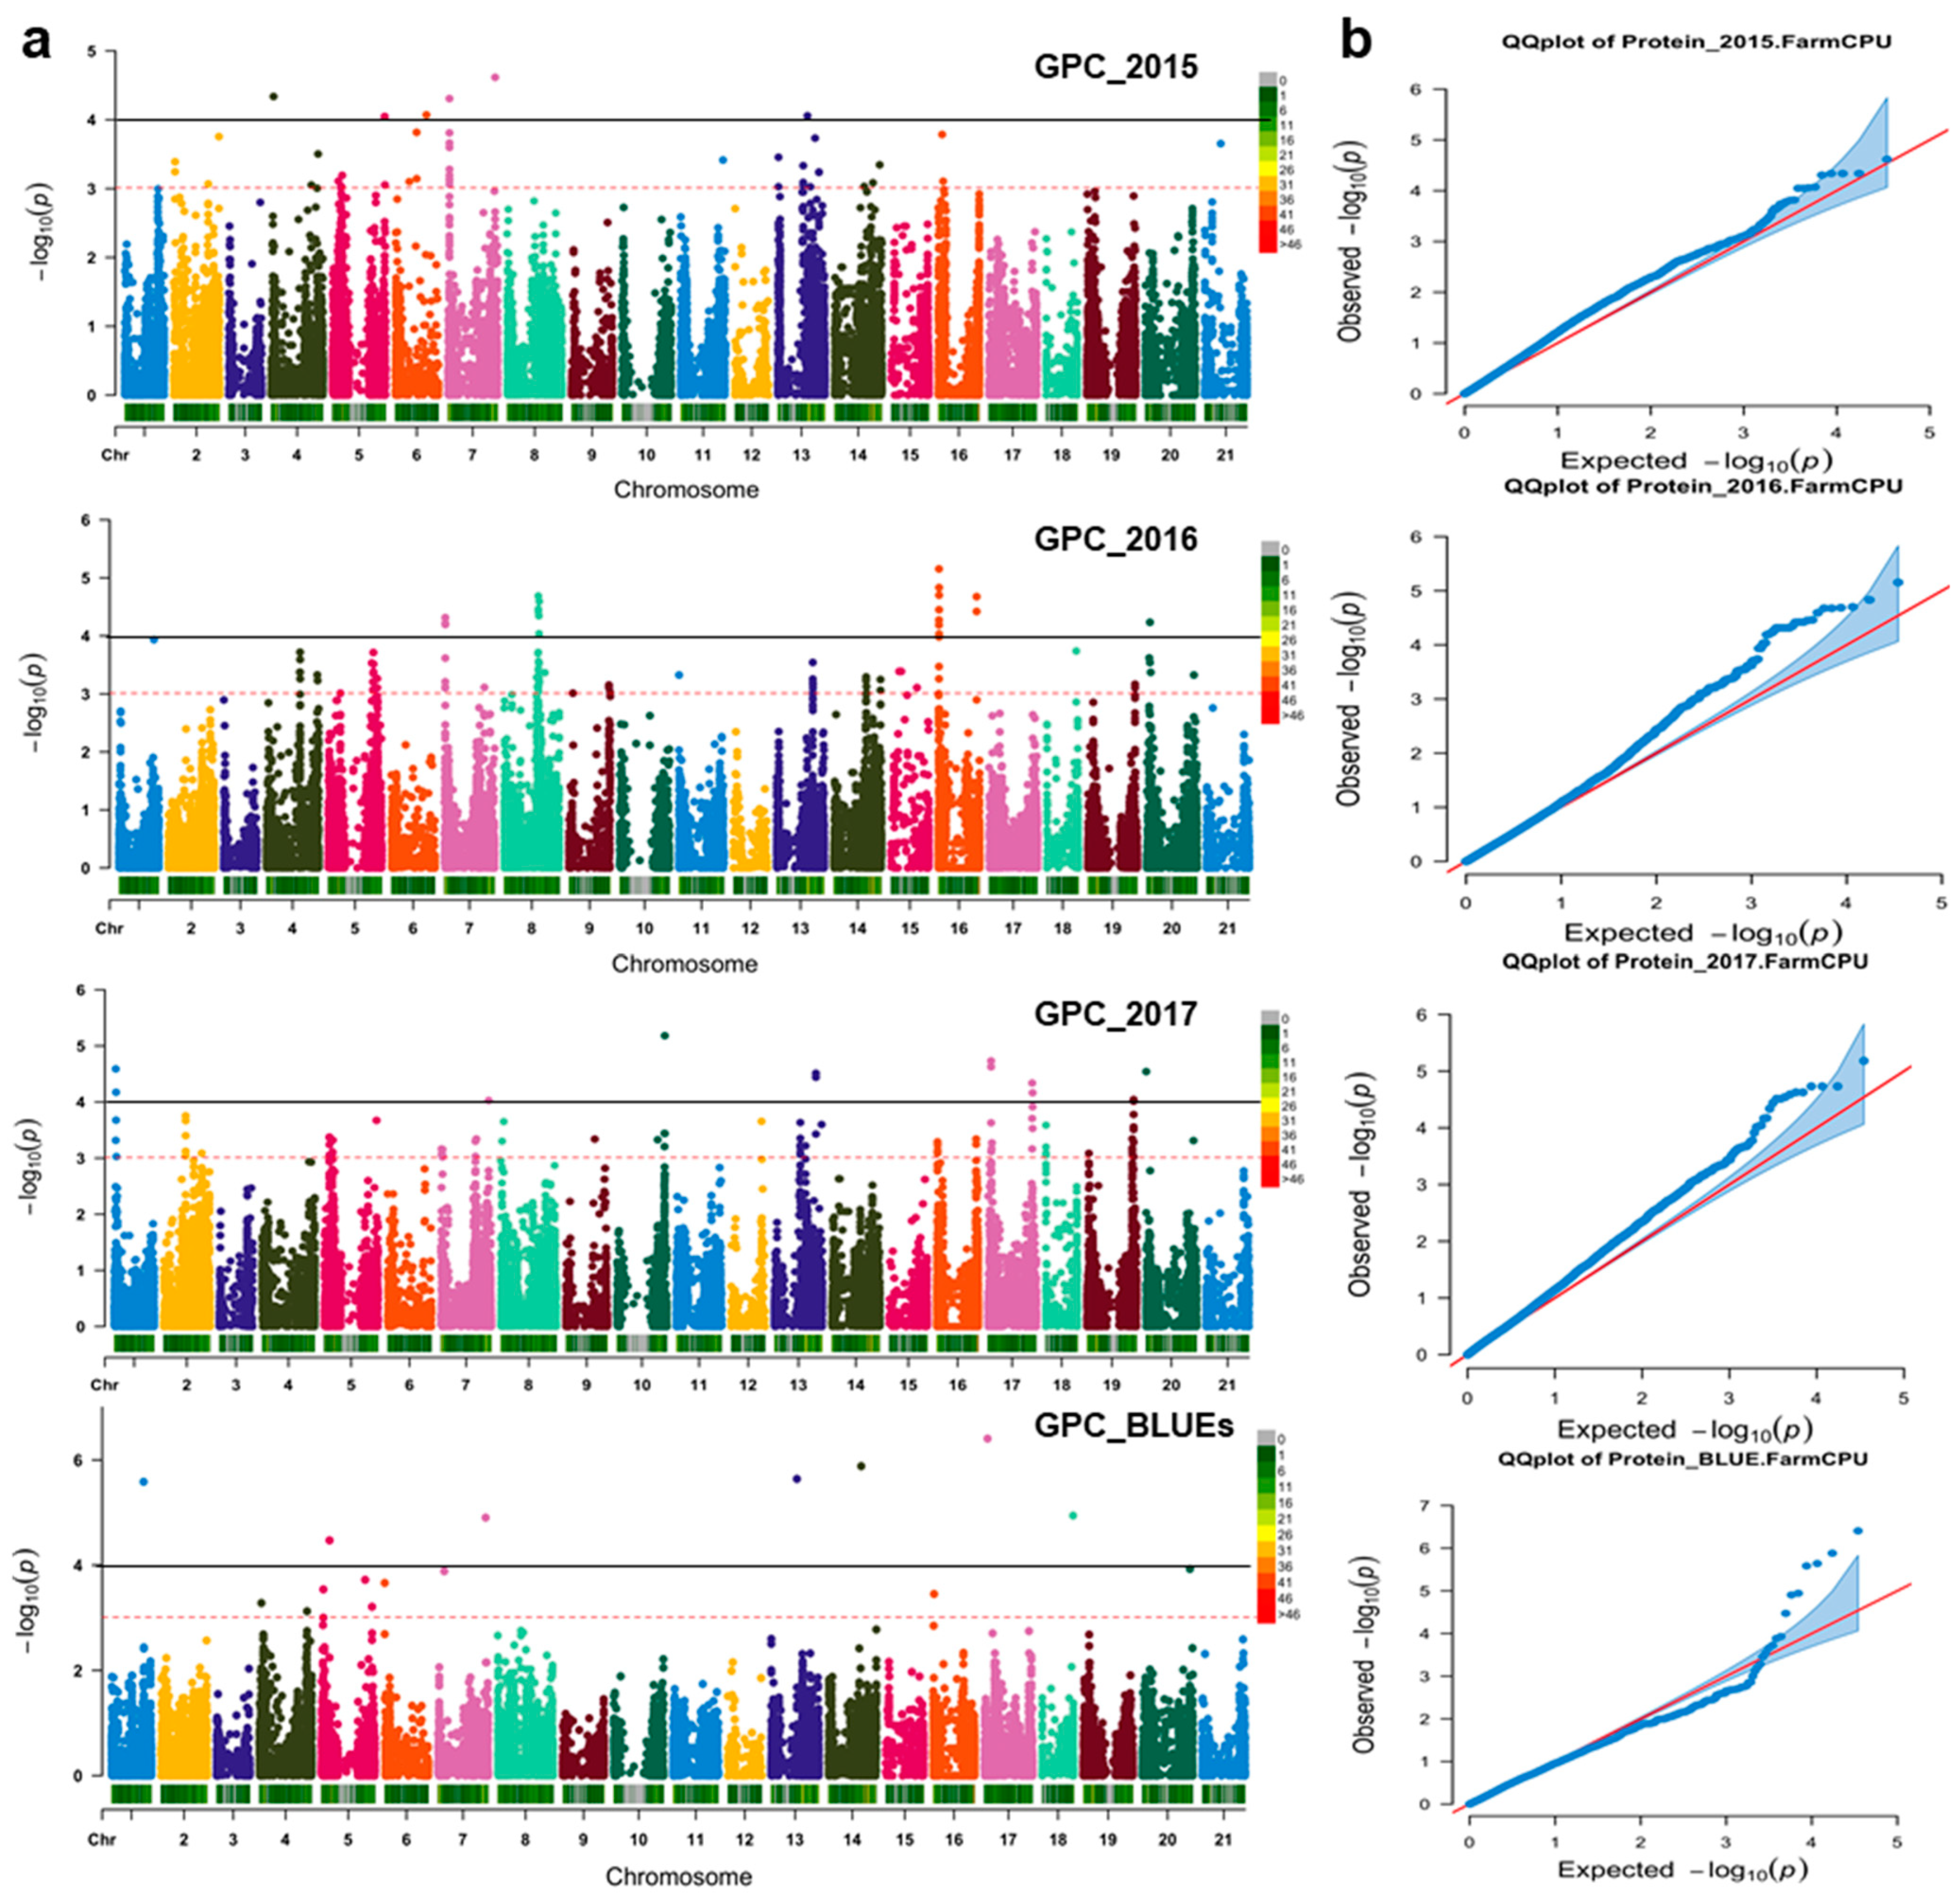
3.2. QTNs Underlying GPC Variations

Using the Farm-CPU method, 54 significant QTNs distributed over 12 chromosomes related to grain protein content were detected (−log10 > FDR; p < 0.0001) in three environments and BLUEs. These QTNs were reported in chromosomes 1A (5), 2B (1), 3A (10), 3B (6), 4A (1), 5A (4), 5B (1), 6A (12), 6B (8), 6D (1), 7A (4), and 7B (1) (Figure 3). Overall, 4 significant QTNs were reported in 2015, 26 in 2016, and 17 in 2017, along with 7 for BLUEs. Grain protein content effects ranged from −0.50 to +0.54% (Table 1). More details about the QTNs detected such as chromosome, marker position, effect on %GPC, −log10, target allele, related candidate gene, and candidate gene annotation are shown in Table 1.

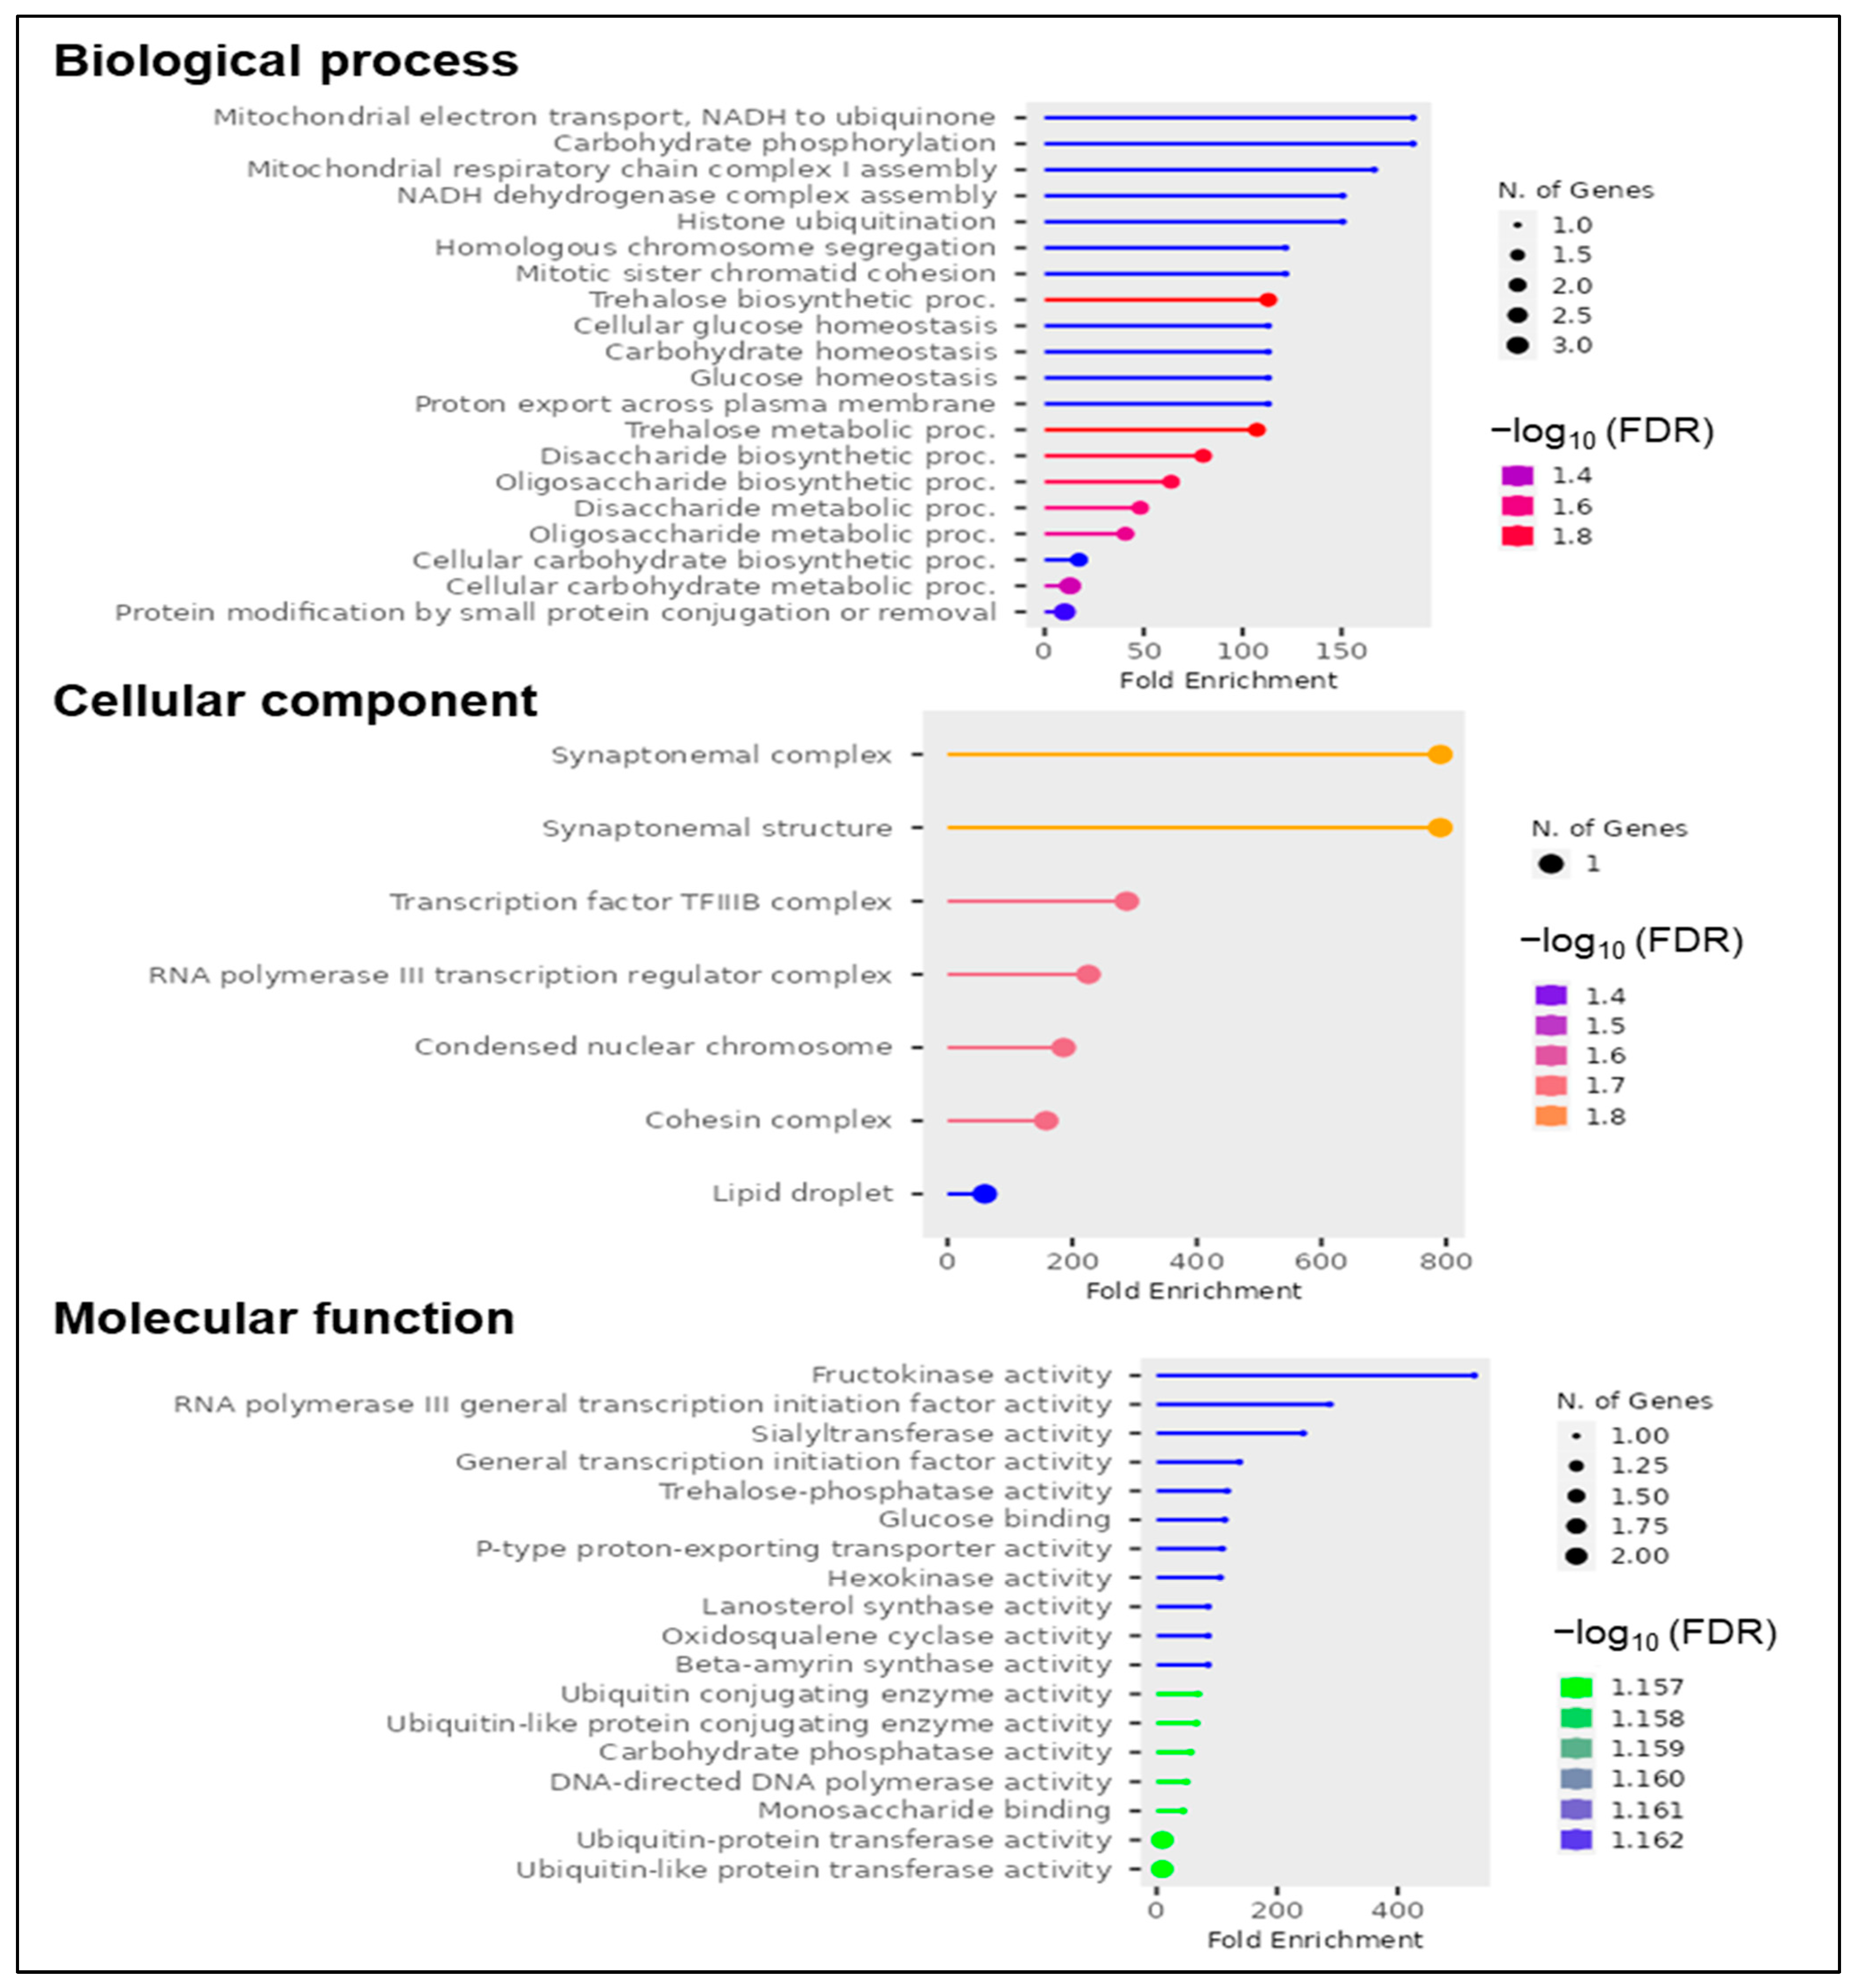
3.3. High-Confidence Candidate Genes Related to GPC

Further analysis revealed 35 high-confidence candidate genes based on the QTNs’ positions (Table 1). These CGs are located in Chr. 1A (4), 2B (1), 3A (4), 3B (4), 4A 5A (1), 5B (1), 6A (9), 6B (5), 6D (1), 7A (4), and 7B (1).
In Figure 4, the biological functions, cellular components, and molecular functions associated with the reported candidate genes are indicated (GO enrichment analysis). In total, 32 of the analyzed CGs showed biological functions; 7 of them are involved in cellular components, and 20 have some molecular functions. Interestingly, the most important biological processes and molecular functions involved were related to disaccharide and oligosaccharide biosynthesis and metabolism.
Based on the GWAS results, the most reliable candidate genes were mined and selected due to QTNs showing positive effects on GPC, related gene networks, and high Ref-Seq expression level during grain development (Table 1, Figure 5, Supplementary Materials Figures S1, S3 and S4). Three QTNs (AX-94552678, BobWhite_rep_c64315_180 and AX-109292583) showing −log10 values ranging from 4.44 to 4.51 and positive effects on %GPC between 0.501 and 0.515% are inside TraesCS5A02G429000, located in chromosome 5A at 613543346-613547572 bp and annotated as Ubiquitin-conjugating enzyme/RWD-like (Table 1, Supplementary Material Figures S2, S3a and S4d).
Several other important QTNs were reported on chromosome 6B. Four QTNs (RAC875_c18659_651, wsnp_Ku_c8343_14190318, wsnp_Ex_c8011_13584847 and wsnp_Ex_c13352_21044607) presented GPC effects ranging from 0.281% to 0.286% and −log10: 4.63–4.73. These markers were collocated within TraesCS6B02G071500 at 48347795-48354269 bp, a gene encoding a TFIIS central domain-containing protein (Table 1, Supplementary Material Figures S2, S3b and S4c).
The QTN AX_95155979 showing a −log10:4.73 and increases of 0.286% on GPC was reported inside TraesCS6B02G071700 (48411470-48415030 bp), which encodes Sialyltransferase-like protein 2 (Supplementary Material Figures S3c and S4b). Another QTN (AX-94727470) (−log10: 4.34 and effect +0.472%) is located within TraesCS6B02G384500 (659232852-659237118 bp), annotated as Trehalose 6-phosphate phosphatase (Supplementary Material Figures S3d and S4e). For its part, AX-158588655 (−log10: 4.16 and effect +0.54%) was collocated with TraesCS6B02G391200, a gene encoding ATP-dependent RNA Helicase DDX51, located at 665512071-665516262 bp (Table 1, Supplementary Material Figures S2, S3e and S4f).
On Chromosome 7B, the QTN AX-94830265 showing LOD: 4.23 and a positive effect on %GPC (0.525%) was located inside TraesCS7B02G047600 at 47000524-47004008 bp, a gene annotated as Plasma membrane ATPase (Table 1, Supplementary Material Figures S2, S3f and S4a).
The expression analysis of some of the CGs reported showed a wide range of gene expression. High expression was reported during grain development and interestingly also in flag leaf development during the grain filling period (Figure 5 and Supplementary Material Figure S3). The highest transcription values in grain tissues were detected for TraesCS5A02G429000, TraesCS5B02G303800, TraesCS6B02G071700, TraesCS1A02G314400, and TraesCS6B02G073600. For flag leaf tissues, high expression was reported for TraesCS6B02G073600, TraesCS5A02G429000, and TraesCS3B02G317300. The rest of the CGs reported showed lower expression values ranging from 0.1 to 5 TPM (Supplementary Figure S2).

4. Discussion

4.1. The Importance of GPC on Bread Wheat, the Main Source of Vegetable Protein Worldwide

Due to the importance of grain protein content for flour quality and the sub-products derived, this study focused on studying the variability of GPC in a European elite panel comprising 369 genotypes in three environments and the further detection of QTNs and candidate genes using 15523 valid markers through the Farm-CPU model.
Our results indicate a wide variability in GPC in European genotypes (9.52–15.31%). Protein content in grains is largely influenced by genetics, water and nitrogen availability, biotic and abiotic stresses, and grain-filling duration [10,28,44]. These multiple factors explain the intermediate correlation with GPC reported for the years evaluated (0.17–0.72). Moreover, the high heritability reported for GPC was documented by [24] (0.88–0.91), [27] (0.56–0.82), [17] (0.68–0.79) and indicates the usefulness of this set for GWAS studies.
In a recent study, [17], evaluating a 255 worldwide winter panel, documented that GPC fluctuated from 8.6 to 16.4%. For their part, [27], evaluating 184 diverse genotypes under Indian conditions, reported GPC variations ranging from 8.6 to 15.81%. In this sense, our work has documented the variation in GPC in one of the largest European winter wheat sets analyzed so far. Geyer et al. [28] reported a GPC variability of 11.8–16.2% on a MAGIC population of 394 lines. Our results indicate that some accessions such as Hamac, Hereward, Cassiopeia, Incisic, Levis, Renan, and Alidos showed high and stable GPC among the environments (13–14%), while others showed low GPC values (9.9–10%) (Graindor, Alchemy, Haussmann, Equilibre, Rosario, and Ambrossia). In this sense, [28,45] suggest that genotypes with moderate to high GPC (>12%) are required for the production of bread, while those with low GPC are desirable for other purposes such as cookies, noodles, and animal feed. However, there are important variations in quality standards between countries.

4.2. Novel Candidates’ Genes with High Effect on GPC and High Expression during Grain Filling

In the analysis performed in the current work, 54 significant QTNs related to grain protein content were detected using −log10 > FDR (p < 0.0001) in three environments and BLUEs. These QTNs were reported in chromosomes 1A (5), 2B (1), 3A (10), 3B (6), 4A (1), 5A (4), 5B (1), 6A (12), 6B (8), 6D (1), 7A (4), and 7B (1). Further analysis revealed 35 high-confidence candidates’ genes collocated with most of the QTNs reported.
As was previously reported, GPC is quantitative trait influenced by numerous environmental factors and controlled by several genes [17,22,23,24,25,26,27,28]. Previous reports related to QTLs involved in GPC in all wheat chromosomes used a GWAS approach, although reports for CPG in European genotypes have not been studied in depth, highlighting the importance of our study as indicated previously. Even though other studies have documented markers associated with GPC in chromosomes 1A, 2B, 3A, 3B, 4A, 5A, 5B, 6A, 6B, 6D, 7A, and 7B, only some of the QTNs here documented have been previously reported in the literature. Coinciding with our results, [24] report some QTLs affecting grain starch content (QGsc.ipk-3A, QGsc.ipk-6A) and GPC (QGpc.ipk-6A) that are located with CAP11_c6193_232, AX-94973054 and Tdurum_contig46828_730 QTNs, respectively. These novel results would indicate their potential use for the improvement of these physiological characteristics.
Our results exhibited some QTNs (AX-94552678, BobWhite_rep_c64315_180, and AX-109292583) located inside TraesCS5A02G429000 on 613543528–613544399 bp, a gene annotated as Ubiquitin-conjugating enzyme/RWD-like. According to different authors, Ubiquitination regulates varied plant growth and developmental processes related to protein translocation within cells, cell cycle control, photomorphogenesis responses to abiotic/biotic stress, floral development, hormone signaling, proteome homeostasis regulation, and signaling [46,47]. Interestingly, Refs. [48,49] reported the effect of ubiquitin pathways controlling seed size and weight in wheat and other species (Supplementary Material Figure S4d). Recent reports documented that the here-reported TraesCS5A02G429000 gene also plays a role in the chlorophyll content of flag leaves at different grain filling stages under different phosphorus supplies on two double haploid populations (Jinmai 47 × Jinmai 84) and (Jinmai 919 × Jinmai 84) [50]. These results are in line with the high expression levels in flag leaf and grain tissues during post-anthesis (>45 TPM) and the positive effects of this candidate gene on GPC (+0.5%), suggesting its potential utility in breeding programs (Table 1, Figure 5 and Supplementary Material Figures S3a and S4d).
We reported several QTNs and candidate genes in chromosome 6B. For instance, four QTNs (RAC875_c18659_651, wsnp_Ku_c8343_14190318, wsnp_Ex_c8011_13584847, and wsnp_Ex_c13352_21044607) presented medium effects on GPC (ca. +0.29%). These markers were collocated within TraesCS6B02G071500 at 48347795-48354269 bp. A transcription elongation factor S-II (TFIIS) has been related to this candidate gene, and no previous reports have delved into the effect of TFIIS on wheat GPC. In Arabidopsis, a deficient TFIIS mutant showed normal growth but deficient seed dormancy, suggesting its role in seed development [51]. Other recent studies suggest that the Arabidopsis TFIIS mutant proved highly sensitive to heat stress [52]. Moreover, the absence of the ET1 protein (similar to TFIIS) in mutants affects the starch synthesis and consequently endosperm development in maize seeds [53]. In view of these results, further studies should investigate the role of TFIIS in protein accumulation in wheat grains.
The QTN AX-95155979 (48414777 bp) increased GPC up to 0.29% and was collocated with the gene TraesCS6B02G071700, which encodes for Sialyltransferase-like protein 2 (SIA2) in the position 48411470-48415030 bp. Although the effect of this gene has not been previously documented in wheat, the functions associated with SIA2 have been reported. In Arabidopsis, the effect of the SIA2 protein has been associated with the stability of the pollen tube cell wall [54]. Moreover, mutations on SIA2 such as MALE GAMETOPHYTE DEFECTIVE 2 lead to abnormal pollen tube phenotypes [55].
Another QTN (AX-94727470) (effect +0.472%) is located within TraesCS6B02G384500 (659234876 bp), annotated as Trehalose 6-phosphate phosphatase (T6P) (Table 1, Supplementary Material Figures S2, S3d and S4e). As an intermediate of the trehalose metabolic pathway, T6P plays a key role for plant sugar signaling as well as the regulation of plant growth and development [56,57]. Moreover, [58] indicated that this signaling system is a key mechanism of resource allocation related to assimilating partitioning and grain yield improvement in several crops. The relationship with the T6P/SnRK1 regulatory system plays a role in controlling whole-plant resource allocation and source-sink interactions in crops. A recent report described several functions of Trehalose-6-phosphate phosphatase genes (TPPs) in wheat development and stresses response using a GWAS approach [59]. Interestingly, exogenous applications of different T6P precursors from 5 to 20 after anthesis on wheat under control and drought conditions showed a delay in plant senescence, increased crop resilience, higher chlorophyll content, and increases in grain size as well as grain starch and protein concentration [57]. Under Mizus persicae (green peach aphid) infections in Arabidopsis, Trehalose phosphate synthase 11 (TPS11) promotes the re-allocation of carbon into starch at the expense of sucrose, the primary plant-derived carbon and energy source of this pest, reducing the severity produced by this aphid infestation [60]. These previous reports highlighting the functionality of this gene in source/destination relationships would suggest the importance of this CG as a key factor in increasing the genetic gain on GPC.
On Chromosome 7B, the QTN AX-94830265 (47000619 bp) showing effects on GPC up to 0.525% is located inside TraesCS7B02G047600 at 47000524-47004008 bp. This gene is annotated as Cation transporting Plasma membrane ATPase (P-Type ATPase). Although no previous reports of this QTN and CG were found in wheat, various authors have documented that P-Type ATPase superfamily genes play various roles in plant growth and development, biotic and abiotic responses, and hormonal signaling in rice, Arabidopsis [61,62], and soybean [63] (Supplementary Material Figure S4a). In wheat, 42 P-type II Ca2+ATPase genes were reported by [64]. A further analysis developed by these authors suggests their role in diverse functions related to growth and development, cell division, pollen tube growth, and biotic/abiotic tolerance. Coinciding with our results, high expression of these genes was reported during grain filling in grains and leaves in wheat (Supplementary Material Figure S3f), suggesting its utility as a candidate gene explaining GPC in this crop.
The QTN AX_158588655 (showing increases of +0.55% on GPC) is collocated with TraesCS6B02G391200, a gene encoding ATP-dependent RNA Helicase DDX51 at 665512071-665516262 bp (Supplementary Material Figures S3e and S4f, Table 1; Supplementary Figure S2). The role of TraesCS6B02G391200 as a source of resistance to Septoria tritici blotch at seedling and adult stages on 377 advanced spring wheat breeding lines from ICARDA has been reported [65]. A review by Liu and Imai [66] highlights the pleotropic role of RHs ATPases in Arabidopsis, maize, and rice due to their role in pre-rDNA processing. Knockdown mutants of different RHs (OsBIRH1 and OsSUV3) showed differential effects on biotic and abiotic tolerance in rice [67,68]. In Arabidopsis, the genes HEN2 and AtMTR4 exhibited effects on plant and flower development [69,70]. Other important functions were reported for AtRH57 (Glucose and ABA response), AtRH3 (Chloroplast development), and AtRH22 (seed oil biosynthesis) [66]. In wheat, an ATP-dependent DNA helicase (TaDHL-7B) was reported and related to a novel reduced-height (Rht) gene reducing plant height without a grain yield penalty using QTL and GWAS analysis [71]. These previous reports suggest the need to deepen the studies of this candidate gene as a source to modify the GPC in wheat.

5. Conclusions

Grain protein content has been indicated as a crucial trait for grain end-use quality for food scientists and nutritionists. In our study, a wide range of GPC in bread wheat was measured, and candidate genes which subsequently elucidate the genetic mechanism underlying the high nutritional value of grains were reported using a 90k iSELECT Infinium and 35k Affymetrix arrays with the FarmCPU method. These CGs showed a wide range of expression in grain during the filling period. Moreover, from the human nutritional perspective, our results can improve the recommended protein intake. Our results provide new insight into the genetic control of GPC and would be of interest for enhancing wheat end-use quality and nutritional value.

Supplementary Materials

The following supporting information can be downloaded at: https://www.mdpi.com/article/10.3390/nu15204398/s1, Table S1. Summary statistics of grain protein concentration in an experiment with 369 European elite wheat genotypes evaluated during 3 years. Figure S1. Expression value TPM (Transcripts Per Kilobase Million) of candidate genes in flag leaf (during milk grain stage) and grain development (Milk grain stage, dough stage, endosperm in dough stage, embryo proper in dough stage and grain hard dough). Figure S2. Gene structure and significant QTNs reported (TraesCS5A02G429000 (a), TraesCS6B02G071500 (b), TraesCS6B02G071700 (c), TraesCS6B02G384500 (d), TraesCS6B02G391200 (e), TraesCS7B02G047600 (f) associated with grain protein content in European winter wheat accessions. Figure S3. Expression map of the identified gene models (TraesCS5A02G429000 (a), TraesCS6B02G071500 (b), TraesCS6B02G071700 (c), TraesCS6B02G384500 (d), TraesCS6B02G391200 (e), TraesCS7B02G047600 (f) associated with grain protein content in European winter wheat accessions. Adapted from Waese et al. [72]. Figure S4. Gene network of the identified gene models TraesCS7B02G047600 (a), TraesCS6B02G071700 (b), TraesCS6B02G071500 (c), TraesCS5A02G429000 (d), TraesCS6B02G384500 (e), TraesCS6B02G391200 (f) associated with grain protein content in European winter wheat accessions.

Author Contributions

Conceptualization, D.Z.A., L.B. and M.S.R.; Methodology, D.Z.A., S.W., H.R., L.B. and M.S.R.; Software, D.Z.A. and M.S.; Validation, D.Z.A., M.S. and A.M.A.; Formal analysis, D.Z.A. and A.M.A.; Investigation, D.Z.A., M.S., A.M.A. and M.S.R.; Resources, M.S.R.; Data curation, D.Z.A.; Writing—original draft, D.Z.A.; Writing—review & editing, M.S. and A.M.A.; Visualization, M.D.A. and M.S.R.; Supervision, L.B. and M.S.R.; Project administration, M.S.R. All authors have read and agreed to the published version of the manuscript.

Funding

IPK Gatersleben core funding supported this study. Costs for open access publishing were partially funded by the Deutsche Forschungsgemeinschaft (DFG, German Research Foundation, grant 491250510). M.S. (Matías Schierenbeck) appreciates the support received from the Alexander von Humboldt Foundation (Georg Forster Fellowship). We also acknowledge the Princess Nourah bint Abdulrahman University Researchers Supporting Project number (PNURSP2023R355), Princess Nourah bint Abdulrahman University, Riyadh, Saudi Arabia.

Data Availability Statement

The original contributions presented in the study are included in the article/Supplementary Material. The genotypic data of 90K and 35K gene-associated SNPs used in this study were published in [35] (90K chip) and [36] (35K chip). Further inquiries can be directed to the corresponding authors.

Conflicts of Interest

The authors declare that the research was conducted in the absence of any commercial or financial relationships that could be construed as a potential conflict of interest.

References

  1. Willett, W.; Rockström, J.; Loken, B.; Springmann, M.; Lang, T.; Vermeulen, S.; Murray, C.J. Food in the Anthropocene: The Eat–lancet Commission on Healthy Diets from Sustainable Food Systems. Lancet 2019, 393, 447–492. [Google Scholar] [CrossRef]
  2. Erenstein, O.; Jaleta, M.; Mottaleb, K.A.; Sonder, K.; Donovan, J.; Braun, H.J. Global Trends in Wheat Production, Consumption and Trade; Springer International Publishing: Cham, Switzerland, 2022; pp. 47–66. [Google Scholar]
  3. Shewry, P.R.; Hey, S.J. The Contribution of Wheat to Human Diet and Health. Food Energy Secur. 2015, 4, 178–202. [Google Scholar] [CrossRef] [PubMed]
  4. Grote, U.; Fasse, A.; Nguyen, T.T.; Erenstein, O. Food Security and the Dynamics of Wheat and Maize Value Chains in Africa and Asia. Front. Sustain. Food Syst. 2021, 4, 617009. [Google Scholar] [CrossRef]
  5. Poutanen, K.S.; Kårlund, A.O.; Gómez-Gallego, C.; Johansson, D.P.; Scheers, N.M.; Marklinder, I.M.; Eriksen, A.K.; Silventoinen, P.C.; Nordlund, E.; Sozer, N.; et al. Grains—A major source of sustainable protein for health. Nutr. Rev. 2022, 80, 1648–1663. [Google Scholar] [CrossRef] [PubMed]
  6. Kumar, R.; Kumar, A.; Sharma, N.K.; Kaur, N.; Chunduri, V.; Chawla, M.; Sharma, S.; Singh, K.; Garg, M. Soft and hard textured wheat differ in starch properties as indicated by trimodal distribution, morphology, thermal and crystalline properties. PLoS ONE 2016, 11, e0147622. [Google Scholar] [CrossRef] [PubMed]
  7. Schaible, U.E.; Kaufmann, S.H.E. Malnutrition and infection: Complex mechanisms and global impacts. PLoS Med. 2007, 4, e115. [Google Scholar] [CrossRef] [PubMed]
  8. Kar, B.R.; Rao, S.L.; Chandramouli, B.A. Cognitive Development in Children with Chronic Protein Energy Malnutrition. Behav. Brain Funct. 2008, 4, 31. [Google Scholar] [CrossRef] [PubMed]
  9. Müller, O.; Krawinkel, M. Malnutrition and health in developing countries. Can. Med. Assoc. J. 2005, 173, 279–286. [Google Scholar] [CrossRef]
  10. Simón, M.R.; Fleitas, M.C.; Castro, A.C.; Schierenbeck, M. How Foliar Fungal Diseases Affect Nitrogen Dynamics, Milling, and End-Use Quality of Wheat. Front. Plant Sci. 2020, 11, 569401. [Google Scholar] [CrossRef] [PubMed]
  11. Khalid, A.; Hameed, A.; Tahir, M.F. Wheat Quality: A Review on Chemical Composition, Nutritional Attributes, Grain Anatomy, Types, Classification, and Function of Seed Storage Proteins in Bread Making Quality. Front. Nutr. 2023, 10, 1053196. [Google Scholar] [CrossRef]
  12. Fleitas, M.C.; Schierenbeck, M.; Gerard, G.S.; Dietz, J.I.; Golik, S.I.; Campos, P.E.; Simón, M.R. How Leaf Rust Disease and Its Control with Fungicides Affect Dough Properties, Gluten Quality and Loaf Volume under Different N Rates in Wheat. J. Cereal Sci. 2018, 80, 119–127. [Google Scholar] [CrossRef]
  13. Biesiekierski, J.R. What Is Gluten? J. Gastroenterol. Hepatol. 2017, 32 (Suppl. S1), 78–81. [Google Scholar] [CrossRef]
  14. Laidig, F.; Hüsken, A.; Rentel, D.; Piepho, H.-P. Protein Use Efficiency and Stability of Baking Quality in Winter Wheat Based on the Relation of Loaf Volume and Grain Protein Content. Züchter Genet. Breed. Res. 2022, 135, 1331–1343. [Google Scholar] [CrossRef]
  15. Ooms, N.; Delcour, J.A. How to Impact Gluten Protein Network Formation during Wheat Flour Dough Making. Curr. Opin. Food Sci. 2019, 25, 88–97. [Google Scholar] [CrossRef]
  16. Baardseth, P.; Kvaal, K.; Lea, P.; Ellekjær, M.R.; Færgestad, E.M. The Effects of Bread Making Process and Wheat Quality on French Baguettes. J. Cereal Sci. 2000, 32, 73–87. [Google Scholar] [CrossRef]
  17. Kartseva, T.; Alqudah, A.M.; Aleksandrov, V.; Alomari, D.Z.; Doneva, D.; Arif, M.A.R.; Börner, A.; Misheva, S. Nutritional Genomic Approach for Improving Grain Protein Content in Wheat. Foods 2023, 12, 1399. [Google Scholar] [CrossRef]
  18. Gupta, P.K.; Balyan, H.S.; Chhuneja, P.; Jaiswal, J.P.; Tamhankar, S.; Mishra, V.K.; Bains, N.S.; Chand, R.; Joshi, A.K.; Kaur, S.; et al. Pyramiding of Genes for Grain Protein Content, Grain Quality, and Rust Resistance in Eleven Indian Bread Wheat Cultivars: A Multi-Institutional Effort. Mol. Breed. 2022, 42, 21. [Google Scholar] [CrossRef] [PubMed]
  19. Tanin, M.J.; Sharma, A.; Saini, D.K.; Singh, S.; Kashyap, L.; Srivastava, P.; Mavi, G.S.; Kaur, S.; Kumar, V.; Kumar, V.; et al. Ascertaining Yield and Grain Protein Content Stability in Wheat Genotypes Having the Gpc-B1 Gene Using Univariate, Multivariate, and Correlation Analysis. Front. Genet. 2022, 13, 1001904. [Google Scholar] [CrossRef]
  20. Tshikunde, N.M.; Mashilo, J.; Shimelis, H.; Odindo, A. Agronomic and Physiological Traits, and Associated Quantitative Trait Loci (QTL) Affecting Yield Response in Wheat (Triticum aestivum L.): A Review. Front. Plant Sci. 2019, 10, 1428. [Google Scholar] [CrossRef]
  21. Schierenbeck, M.; Alqudah, A.M.; Lohwasser, U.; Tarawneh, R.A.; Simón, M.R.; Börner, A. Genetic dissection of grain architecture-related traits in a winter wheat population. BMC Plant Biol. 2021, 21, 417. [Google Scholar]
  22. Nelson, J.C.; Andreescu, C.; Breseghello, F.; Finney, P.L.; Gualberto, D.G.; Bergman, C.J.; Sorrells, M.E. Quantitative trait locus analysis of wheat quality traits. Euphytica 2006, 149, 145–159. [Google Scholar] [CrossRef]
  23. Liu, J.; Huang, L.; Wang, C.; Liu, Y.; Yan, Z.; Wang, Z.; Xiang, L.; Zhong, X.; Gong, F.; Zheng, Y.; et al. Genome-wide association study reveals novel genomic regions associated with high grain protein content in wheat lines derived from wild emmer wheat. Front. Plant Sci. 2019, 10, 464. [Google Scholar] [CrossRef]
  24. Muqaddasi, Q.H.; Brassac, J.; Ebmeyer, E.; Kollers, S.; Korzun, V.; Argillier, O.; Stiewe, G.; Plieske, J.; Ganal, M.W.; Röder, M.S. Prospects of GWAS and Predictive Breeding for European Winter Wheat’s Grain Protein Content, Grain Starch Content, and Grain Hardness. Sci. Rep. 2020, 10, 12541. [Google Scholar] [CrossRef] [PubMed]
  25. Alemu, A.; Suliman, S.; Hagras, A.; Thabet, S.; Al-Abdallat, A.; Abdelmula, A.A.; Tadesse, W. Multi-model genome-wide association and genomic prediction analysis of 16 agronomic, physiological and quality related traits in ICARDA spring wheat. Euphytica 2021, 217, 205. [Google Scholar] [CrossRef]
  26. Kumar, A.; Jain, S.; Elias, E.M.; Ibrahim, M.; Sharma, L.K. An Overview of QTL Identification and Marker-Assisted Selection for Grain Protein Content in Wheat. In Eco-Friendly Agro-Biological Techniques for Enhancing Crop Productivity; Sengar, R., Singh, A., Eds.; Springer: Singapore, 2018; pp. 245–274. [Google Scholar]
  27. Rathan, N.D.; Krishna, H.; Ellur, R.K.; Sehgal, D.; Govindan, V.; Ahlawat, A.K.; Krishnappa, G.; Jaiswal, J.P.; Singh, J.B.; Sv, S.; et al. Genome-Wide Association Study Identifies Loci and Candidate Genes for Grain Micronutrients and Quality Traits in Wheat (Triticum aestivum L.). Sci. Rep. 2022, 12, 7037. [Google Scholar] [CrossRef] [PubMed]
  28. Geyer, M.; Mohler, V.; Hartl, L. Genetics of the Inverse Relationship between Grain Yield and Grain Protein Content in Common Wheat. Plants 2022, 11, 2146. [Google Scholar] [CrossRef]
  29. Alomari, D.; Eggert, K.; von Wirén, N.; Polley, A.; Plieske, J.; Ganal, M.; Liu, F.; Pillen, K.; Röder, M. Whole-Genome Association Mapping and Genomic Prediction for Iron Concentration in Wheat Grains. Int. J. Mol. Sci. 2018, 20, 76. [Google Scholar] [CrossRef]
  30. Alomari, D.Z.; Alqudah, A.M.; Pillen, K.; von Wirén, N.; Röder, M.S. Toward Identification of a Putative Candidate Gene for Nutrient Mineral Accumulation in Wheat Grains for Human Nutrition Purposes. J. Exp. Bot. 2021, 72, 6305–6318. [Google Scholar] [CrossRef]
  31. Alomari, D.Z.; Eggert, K.; von Wirén, N.; Pillen, K.; Röder, M.S. Genome-Wide Association Study of Calcium Accumulation in Grains of European Wheat Cultivars. Front. Plant Sci. 2017, 8, 1797. [Google Scholar] [CrossRef]
  32. Delwiche, S.R.; Pierce, R.O.; Chung, O.K.; Seabourn, B.W. Protein Content of Wheat by Near-Infrared Spectroscopy of Whole Grain: Collaborative Study. J. AOAC Int. 1998, 81, 587–603. [Google Scholar] [CrossRef]
  33. VSN International. Genstat for Windows, 18th ed.; VSN International Ltd.: Hemel Hempstead, UK, 2015. [Google Scholar]
  34. Falconer, D.S.; Mackay, T.F. Introduction to Quantitative Genetics, 4th ed.; Pearson Prentice Hall: Hoboken, NJ, USA, 2005. [Google Scholar]
  35. Wang, S.; Wong, D.; Forrest, K.; Allen, A.; Chao, S.; Huang, B.E. Akhunov Characterization of Polyploid Wheat Genomic Diversity Using a High-Density 90 000 Single Nucleotide Polymorphism Array. Plant Biotechnol. J. 2014, 12, 787–796. [Google Scholar] [CrossRef]
  36. Allen, A.M.; Winfield, M.O.; Burridge, A.J.; Downie, R.C.; Benbow, H.R.; Barker, G.L.A.; Wilkinson, P.A.; Coghill, J.; Waterfall, C.; Davassi, A.; et al. Characterization of a Wheat Breeders’ Array Suitable for High-Throughput SNP Genotyping of Global Accessions of Hexaploid Bread Wheat (Triticum Aestivum). Plant Biotechnol. J. 2017, 15, 390–401. [Google Scholar] [CrossRef] [PubMed]
  37. Poland, J.A.; Brown, P.J.; Sorrells, M.E.; Jannink, J.L. Development of high-density genetic maps for barley and wheat using a novel two-enzyme genotyping-by-sequencing approach. PLoS ONE 2012, 7, e32253. [Google Scholar] [CrossRef]
  38. Sorrells, M.E.; Gustafson, J.P.; Somers, D.; Chao, S.; Benscher, D.; Guedira-Brown, G. Qualset Reconstruction of the Synthetic W7984× Opata M85 Wheat Reference Population. Genome 2011, 54, 875–882. [Google Scholar] [CrossRef] [PubMed]
  39. Lipka, A.E.; Tian, F.; Wang, Q.; Peiffer, J.; Li, M.; Bradbury, P.J.; Gore, M.A.; Buckler, E.S.; Zhang, Z. GAPIT: Genome association and prediction integrated tool. Bioinformatics 2012, 28, 2397–2399. [Google Scholar] [CrossRef]
  40. Wang, J.; Zhang, Z. GAPIT version 3: Boosting power and accuracy for genomic association and prediction. Genom. Proteom. Bioinform. 2021, 19, 629–640. [Google Scholar] [CrossRef]
  41. VanRaden, P.M. Efficient Methods to Compute Genomic Predictions. J. Dairy Sci. 2008, 91, 4414–4423. [Google Scholar] [CrossRef] [PubMed]
  42. Liu, X.; Huang, M.; Fan, B.; Buckler, E.S.; Zhang, Z. Iterative usage of fixed and random effect models for powerful and efficient genome-wide association studies. PLoS Genet. 2016, 12, e1005767. [Google Scholar] [CrossRef] [PubMed]
  43. Zhang, L.; Dong, C.; Chen, Z.; Gui, L.; Chen, C.; Li, D.; Xie, Z.; Zhang, Q.; Zhang, X.; Xia, C.; et al. WheatGmap: A comprehensive platform for wheat gene mapping and genomic studies. Mol. Plant 2021, 14, 187–190. [Google Scholar] [CrossRef]
  44. Saint Pierre, C.; Peterson, C.J.; Ross, A.S.; Ohm, J.B.; Verhoeven, M.C.; Larson, M.; Hoefer, B. Winter Wheat Genotypes under Different Levels of Nitrogen and Water Stress: Changes in Grain Protein Composition. J. Cereal Sci. 2008, 47, 407–416. [Google Scholar] [CrossRef]
  45. Ross, A.S. Genetic and Other Factors Affecting Wheat Quality. In Achieving Sustainable Cultivation of Wheat; Burleigh Dodds Science Publishing: Cambridge, UK, 2017; Volume 1, pp. 233–268. [Google Scholar]
  46. Doroodian, P.; Hua, Z. The ubiquitin switch in plant stress response. Plants 2021, 10, 246. [Google Scholar] [CrossRef] [PubMed]
  47. Yao, S.; Xie, M.; Hu, M.; Cui, X.; Wu, H.; Li, X.; Hu, P.; Tong, C.; Yu, X. Genome-Wide Characterization of Ubiquitin-Conjugating Enzyme Gene Family Explores Its Genetic Effects on the Oil Content and Yield of Brassica Napus. Front. Plant Sci. 2023, 14, 1118339. [Google Scholar] [CrossRef] [PubMed]
  48. Li, N.; Li, Y. Ubiquitin-mediated control of seed size in plants. Front. Plant Sci. 2014, 5, 332. [Google Scholar] [CrossRef]
  49. Brinton, J.; Simmonds, J.; Uauy, C. Ubiquitin-related genes are differentially expressed in isogenic lines contrasting for pericarp cell size and grain weight in hexaploid wheat. BMC Plant Biol. 2018, 18, 22. [Google Scholar] [CrossRef] [PubMed]
  50. Yang, B.; Chen, N.; Dang, Y.; Wang, Y.; Wen, H.; Zheng, J.; Zheng, X.; Zhao, J.; Lu, J.; Qiao, L. Identification and Validation of Quantitative Trait Loci for Chlorophyll Content of Flag Leaf in Wheat under Different Phosphorus Supply. Front. Plant Sci. 2022, 13, 1019012. [Google Scholar] [CrossRef]
  51. Grasser, M.; Kane, C.M.; Merkle, T.; Melzer, M.; Emmersen, J.; Grasser, K.D. Transcript Elongation Factor TFIIS Is Involved in Arabidopsis Seed Dormancy. J. Mol. Biol. 2009, 386, 598–611. [Google Scholar] [CrossRef]
  52. Obermeyer, S.; Stöckl, R.; Schnekenburger, T.; Kapoor, H.; Stempfl, T.; Schwartz, U.; Grasser, K.D. TFIIS Is Crucial during Early Transcript Elongation for Transcriptional Reprogramming in Response to Heat Stress. J. Mol. Biol. 2023, 435, 167917. [Google Scholar] [CrossRef]
  53. Da Costa e Silva, O.; Lorbiecke, R.; Garg, P.; Müller, L.; Waßmann, M.; Lauert, P.; Scanlon, M.; Hsia, A.P.; Schnable, P.S.; Krupinska, K.; et al. The Etched1 Gene of Zea mays (L.) Encodes a Zinc Ribbon Protein That Belongs to the Transcriptionally Active Chromosome (TAC) of Plastids and Is Similar to the Transcription Factor TFIIS. Plant J. 2004, 38, 923–939. [Google Scholar] [CrossRef]
  54. Dumont, M.; Lehner, A.; Bouton, S.; Kiefer-Meyer, M.C.; Voxeur, A.; Pelloux, J.; Lerouge, P.; Mollet, J.-C. The Cell Wall Pectic Polymer Rhamnogalacturonan-II Is Required for Proper Pollen Tube Elongation: Implications of a Putative Sialyltransferase-like Protein. Ann. Bot. 2014, 114, 1177–1188. [Google Scholar] [CrossRef]
  55. Cascallares, M.; Setzes, N.; Marchetti, F.; López, G.A.; Distéfano, A.M.; Cainzos, M.; Zabaleta, E.; Pagnussat, G.C. A Complex Journey: Cell Wall Remodeling, Interactions, and Integrity during Pollen Tube Growth. Front. Plant Sci. 2020, 11, 599247. [Google Scholar] [CrossRef]
  56. Rodríguez-Salazar, J.; Suárez, R.; Caballero-Mellado, J.; Iturriaga, G. Trehalose Accumulation in Azospirillum Brasilense Improves Drought Tolerance and Biomass in Maize Plants. FEMS Microbiol. Lett. 2009, 296, 52–59. [Google Scholar] [CrossRef]
  57. Griffiths, C.A.; Sagar, R.; Geng, Y.; Primavesi, L.F.; Patel, M.K.; Passarelli, M.K.; Gilmore, I.S.; Steven, R.T.; Bunch, J.; Paul, M.J.; et al. Chemical intervention in plant sugar signalling increases yield and resilience. Nature 2016, 540, 574–578. [Google Scholar] [CrossRef]
  58. Paul, M.J.; Watson, A.; Griffiths, C.A. Trehalose 6-Phosphate Signalling and Impact on Crop Yield. Biochem. Soc. Trans. 2020, 48, 2127–2137. [Google Scholar] [CrossRef] [PubMed]
  59. Du, L.; Li, S.; Ding, L.; Cheng, X.; Kang, Z.; Mao, H. Genome-wide analysis of trehalose-6-phosphate phosphatases (TPP) gene family in wheat indicates their roles in plant development and stress response. BMC Plant Biol. 2022, 22, 120. [Google Scholar] [CrossRef] [PubMed]
  60. Singh, V.; Louis, J.; Ayre, B.G.; Reese, J.C.; Pegadaraju, V.; Shah, J. TREHALOSE PHOSPHATE SYNTHASE11-Dependent Trehalose Metabolism Promotes Arabidopsis Thaliana Defense against the Phloem-Feeding Insect Myzus Persicae: Trehalose Signaling in Plant Defense. Plant J. 2011, 67, 94–104. [Google Scholar] [CrossRef]
  61. Huda, K.M.K.; Yadav, S.; Banu, M.S.A.; Trivedi, D.K.; Tuteja, N. Genome-Wide Analysis of Plant-Type II Ca2+ ATPases Gene Family from Rice and Arabidopsis: Potential Role in Abiotic Stresses. Plant Physiol. Biochem. 2013, 65, 32–47. [Google Scholar] [CrossRef]
  62. Hoffmann, R.D.; Portes, M.T.; Olsen, L.I.; Damineli, D.S.C.; Hayashi, M.; Nunes, C.O.; Pedersen, J.T.; Lima, P.T.; Campos, C.; Feijó, J.A.; et al. Plasma Membrane H+-ATPases Sustain Pollen Tube Growth and Fertilization. Nat. Commun. 2020, 11, 2395. [Google Scholar] [CrossRef] [PubMed]
  63. Zhao, B.; Wu, H.; Xu, W.; Zhang, W.; Chen, X.; Zhu, Y.; Chen, H.; Zeng, H. Genome-wide identification, characterization, and expression analyses of P-type ATPase superfamily genes in soybean. Agronomy 2020, 11, 71. [Google Scholar] [CrossRef]
  64. Taneja, M.; Upadhyay, S.K. Molecular Characterization and Differential Expression Suggested Diverse Functions of P-Type II Ca2+ ATPases in Triticum aestivum L. BMC Genom. 2018, 19, 389. [Google Scholar] [CrossRef]
  65. Louriki, S.; Rehman, S.; El Hanafi, S.; Bouhouch, Y.; Al-Jaboobi, M.; Amri, A.; Douira, A.; Tadesse, W. Identification of Resistance Sources and Genome-Wide Association Mapping of Septoria Tritici Blotch Resistance in Spring Bread Wheat Germplasm of ICARDA. Front. Plant Sci. 2021, 12, 600176. [Google Scholar] [CrossRef]
  66. Liu, Y.; Imai, R. Function of Plant DExD/H-Box RNA Helicases Associated with Ribosomal RNA Biogenesis. Front. Plant Sci. 2018, 9, 125. [Google Scholar] [CrossRef] [PubMed]
  67. Li, D.; Liu, H.; Zhang, H.; Wang, X.; Song, F. OsBIRH1, a DEAD-box RNA helicase with functions in modulating defence responses against pathogen infection and oxidative stress. J. Exp. Bot. 2008, 59, 2133–2146. [Google Scholar] [CrossRef]
  68. Tuteja, N.; Sahoo, R.K.; Garg, B.; Tuteja, R. O s SUV 3 Dual Helicase Functions in Salinity Stress Tolerance by Maintaining Photosynthesis and Antioxidant Machinery in Rice (O Ryza Sativa L. Cv. IR 64). Plant J. 2013, 76, 115–127. [Google Scholar] [CrossRef] [PubMed]
  69. Lange, H.; Sement, F.M.; Gagliardi, D. MTR4, a Putative RNA Helicase and Exosome Co-Factor, Is Required for Proper RRNA Biogenesis and Development in Arabidopsis Thaliana: Role of AtMTR4 in RRNA Biogenesis. Plant J. 2011, 68, 51–63. [Google Scholar] [CrossRef] [PubMed]
  70. Lange, H.; Zuber, H.; Sement, F.M.; Chicher, J.; Kuhn, L.; Hammann, P.; Brunaud, V.; Bérard, C.; Bouteiller, N.; Balzergue, S.; et al. The RNA Helicases AtMTR4 and HEN2 Target Specific Subsets of Nuclear Transcripts for Degradation by the Nuclear Exosome in Arabidopsis Thaliana. PLoS Genet. 2014, 10, e1004564. [Google Scholar] [CrossRef]
  71. Guo, B.; Jin, X.; Chen, J.; Xu, H.; Zhang, M.; Lu, X.; Wu, R.; Zhao, Y.; Guo, Y.; An, Y.; et al. ATP-Dependent DNA Helicase (TaDHL), a Novel Reduced-Height (Rht) Gene in Wheat. Genes 2022, 13, 979. [Google Scholar] [CrossRef]
  72. Waese, J.; Fan, J.; Pasha, A.; Yu, H.; Fucile, G.; Shi, R.; Cumming, M.; Kelley, L.A.; Sternberg, M.J.; Krishnakumar, V.; et al. ePlant: Visualizing and exploring multiple levels of data for hypothesis generation in plant biology. Plant Cell 2017, 29, 1806–1821. [Google Scholar] [CrossRef]
Figure 1. (a) Boxplot and jitter for three years and BLUEs values for grain protein content (GPC) in 369 European elite wheat genotypes. Genotypes showing (b) higher and (c) lower %GPC values across the years evaluated.
Nutrients 15 04398 g001
Figure 2. Correlation among grain protein in 369 winter wheat genotypes evaluated in four environments. The degree of significance for all correlations across different years was p < 0.001. The color reflects the strength of the correlation. Non-significant correlations are expressed using crosses.
Nutrients 15 04398 g002
Figure 3. (a) Manhattan plots showing significant marker traits association for agronomical traits in 369 winter wheat genotypes in three environments and BLUEs values (p < 0.0001; −log10 > FDR). (b) qq plots for grain protein concentration; red line represents the expected values.
Nutrients 15 04398 g003
Figure 4. Gene ontology (GO) enrichment analysis.
Nutrients 15 04398 g004
Figure 5. Expression value TPM (Transcripts Per Kilobase Million) of candidate genes in flag leaf (during milk grain stage) and grain development (Milk grain stage, dough stage, endosperm in dough stage, embryo proper in dough stage and grain hard dough).
Nutrients 15 04398 g005
Table 1. Significant QTNs and candidate genes associated with grain protein content of 369 genotypes analyzed in three environments and BLUEs through the FarmCPU model.
EnvChrMarkerEffect (%GPC)−log10Position (bp)Candidate Gene and Genomic Location (bp)Annotation
(Superfamily and PANTHER)
20171AAX-94392216−0.3444.5922611655TraesCS1A02G041100
(22612227-2614080)
RGA5 gene
P-loop containing nucleoside triphosphate hydrolase
20171AAX-158560740−0.2664.1727275836NA
blue1AAX-1585565470.1195.58476981928TraesCS1A02G279600
(476972557-476981741)
Josephin domain
20151ARAC875_c46551_3390.1725.04506283718TraesCS1A02G314400
(506281816-506286607)
Homeobox-like domain superfamily
20151AIAAV62340.1544.11513893374TraesCS1A02G323500
(513879955-513894399)
P-loop containing nucleoside triphosphate hydrolase; DNA/RNA polymerase superfamily
blue2BAX-158536988−0.1234.47122713731TraesCS2B02G154500
(122710128-122714573)
Protein Rolling Stone-like
20163AAX-944516850.2404.2214045695TraesCS3A02G026800
(14045083-14049309)
DEK C-terminal domain
20163AAX-944866510.2404.3114045732
20163AExcalibur_c10383_4320.2404.3114047699
20163AExcalibur_c11505_1550.2404.3114850594TraesCS3A02G027700
(14848772-14852646)
Tetratricopeptide-like helical domain superfamily
20163ARAC875_c20134_5350.2404.3114851011
20163AIAAV11550.2404.3114851251
20163AExcalibur_c92401_1570.2404.3115089050TraesCS3A02G028300
(15086445-15089436)
Alpha-ketoglutarate-dependent dioxygenase AlkB-like superfamily
20163ACAP11_c6193_2320.2394.2015090085TraesCS3A02G028400
(15089868-15092852)
A0A077RAM9 (hypothetical protein wheat)
blue3ABS00065734_510.2284.90711095135NA
20173ABS00065734_510.4854.03711095135NA
20163BAX-108848182−0.2134.46511035835TraesCS3B02G317300
(511034602-511051546)
Peptidase S8/S53 domain superfamily
20163BAX-158537019−0.2204.69511074018TraesCS3B02G317600
(511072080-511076195)
Galactose-binding-like domain superfamily
20163BAX-111060338−0.2144.42511507665NA
20163BAX-158538466−0.2144.35519416654TraesCS3B02G320500
(519415064-519417176)
ATPase, nucleotide binding domain
20163BAX-158558088−0.2044.04522280255NA
20163BAX-110467694−0.2204.59524450613TraesCS3B02G323900
(524449173-52445430)
UDP-Glycosyltransferase/glycogen phosphorylase
HAD-like superfamily
20174AAX-1088451090.6425.18712225082NA
blue5AAX-1585425300.1565.64382113600NA
20175AAX-945526780.5014.51613543528TraesCS5A02G429000
(613543346-613547572)
UBC2 Gene
Ubiquitin-conjugating enzyme/RWD-like
20175ABobWhite_rep_c64315_1800.5014.51613543528
20175AAX-1092925830.5154.44613544399
blue5BAX-158525605−0.1565.88488112608TraesCS5B02G303800
(488111479-488113567)
Polyketide synthase, enoylreductase domain
20166AAX-1585523620.3054.1910493939TraesCS6A02G021300
(10491634-10496460)
Sam-dependent Methyltransferase
20166AAX-1088948630.3134.2710494137
20166ARAC875_c22627_3150.2955.1510560290TraesCS6A02G021600
(10559982-10561177)
Uncharacterized protein
20166AAX-950070920.3014.4511965153TraesCS6A02G024000
(11963972-11966414)
C2H2 zinc finger transcription factor
20166AAX-111512288−0.2774.7012058265TraesCS6A02G024100
(12055217-12058516)
LRRNT_2 domain-containing protein
20166AAX-110469066−0.2874.8312078919TraesCS6A02G024200
(12077818-12079854)
OS10G0469600 PROTEIN
20166AAX-158588344−0.2624.0312312937TraesCS6A02G024800
(12313087-12314289)
F-box domain-containing protein
20156ABS00073124_51−0.2204.1957728595TraesCS6A02G089400
(57725544-57732746)
Calcium-dependent protein kinase 16
20166AAX-158530854−0.4564.42571851398TraesCS6A02G338300
(571851256-571855462)
E3 ubiquitin ligase
20166AAX-110545207−0.4564.42571851707
20166AAX-94973054−0.5024.68571852988
20166ATdurum_contig46828_730−0.5024.68571929129TraesCS6A02G338600
(571928076-571931078)
Aminotran_1_2 domain-containing protein
20176BRAC875_c18659_6510.2814.6348348762TraesCS6B02G071500
(48347795-48354269)
Transcription elongation factor S-II, central domain superfamily
20176Bwsnp_Ku_c8343_141903180.2814.6348348762
20176Bwsnp_Ex_c8011_135848470.2864.7348349076
20176Bwsnp_Ex_c13352_210446070.2864.7348352481
20176BAX-951559790.2864.7348414777TraesCS6B02G071700
(48411470-48415030)
Sialyltransferase-like protein 2
blue6BCAP7_rep_c6771_3320.1466.4149984647TraesCS6B02G073600
(49984316-49986442)
Protein lurp-one-related 1-related
20176BAX-947274700.4724.34659234876TraesCS6B02G384500
(659232852-659237118)
TPS11 gene
Trehalose 6-phosphate phosphatase
20176BAX-1585886550.5394.16665512073TraesCS6B02G391200
(665512071-665516262)
ATP-dependent RNA Helicase DDX51
blue6DRAC875_c64099_90−0.1054.94460570647TraesCS6D02G377900
(460567567-460573565)
Protein lutein deficient 5, chloroplastic
20177AAX-952037670.3484.541281744TraesCS7A02G001700
(1280349-1295461)
Terpene cyclase/mutase family member
20157Awsnp_Ra_c4418_80127320.2934.51118156309TraesCS7A02G161500
(118145757-118159311)
PPR_long domain-containing protein
20177ABS00022169_510.2834.04691259601TraesCS7A02G501500
(691258415-691260048)
OS10G0469600 Protein
20177AAX-1585670410.2764.01691474553TraesCS7A02G502400
(691472525-691473807)
Peptidase A1 domain-containing protein
20167BAX-948302650.5254.2347000619TraesCS7B02G047600
(47000524-47004008)
Plasma membrane ATPase
Disclaimer/Publisher’s Note: The statements, opinions and data contained in all publications are solely those of the individual author(s) and contributor(s) and not of MDPI and/or the editor(s). MDPI and/or the editor(s) disclaim responsibility for any injury to people or property resulting from any ideas, methods, instructions or products referred to in the content.

