Article

Beneficial Effects of Oral Nutrition Supplements on the Nutritional Status and Physical Performance of Older Nursing Home Residents at Risk of Malnutrition

1
School of Nutrition and Health Sciences, Taipei Medical University, Taipei 11031, Taiwan
2
Chia-Ying Nutrition Consultation Center, Taipei 10068, Taiwan
3
Research Center of Geriatric Nutrition, College of Nutrition, Taipei Medical University, Taipei 11031, Taiwan
4
Nutrition Research Center, Taipei Medical University Hospital, Taipei 11031, Taiwan
5
School of Gerontology and Long-Term Care, College of Nursing, Taipei Medical University, Taipei 11031, Taiwan
*
Author to whom correspondence should be addressed.
Nutrients 2023, 15(19), 4291; https://doi.org/10.3390/nu15194291
Submission received: 14 September 2023 / Revised: 5 October 2023 / Accepted: 6 October 2023 / Published: 8 October 2023
(This article belongs to the Special Issue Dietary Management and Nutritional Health for Age-Related Diseases)

Abstract

:
The purpose of this study was to compare the effects of nutritional supplement drinks (NSDs) and nutritional education (NE) on the nutritional status and physical performance of older nursing home residents who were at risk of malnutrition. This study was a clustered, randomized, parallel, multi-center clinical trial, with 107 participants more than 65 years old and at risk of malnutrition recruited from several nursing homes in this study. Participants were divided into two groups: an NE group (n = 50) and an NSD group (n = 57). The NE group was given NE by a dietitian, while the NSD group was provided with two packs of NSD except receiving NE (Mei Balance, Meiji Holdings, Tokyo, Japan) per day as a snack between meals and before bed. Anthropometric data, blood pressure, nutritional status, blood biochemical biomarkers, and physical performance were measured before and after 12-week interventions. After 12 weeks of NE combined with NSD intervention, body weight, body-mass index, the mini nutritional assessment-short form (MNA-SF) score, walking speed, and SF-36 questionnaire score were improved in older nursing home residents at risk of malnutrition.

1. Introduction

The World Health Organization (WHO) estimates the total number of older or older people (≥60 years) worldwide will surpass 1.2 billion by 2025 [1]. Malnutrition is a common health problem in older individuals, which is related to decreased protein and energy intake and is attributed to sarcopenia, frailty, chronic diseases, a decreased ability to chew and swallow, etc. Moreover, protein-energy malnutrition can affect physical performance and muscle loss, increase incidences of falling and hospitalization, and the mortality rate in the older population [2,3].
The WHO reported that the prevalence of malnutrition in older people ranges from 1.3% to 47.8% [4]. A systematic review also showed that the prevalence of malnutrition and at risk of malnutrition were 11.7–60% and 21–60% in older people, respectively [5]. According to research in the US, the prevalence of malnutrition was 1~15% in older persons who lived in the community, but that increased to 25~85% among those in nursing homes and hospitals [6]. Those studies showed that residents in nursing homes had a higher rate of malnutrition than community-dwelling older adults. A study in Taiwan showed that around 3.6% of community-dwelling older adults were in a state of malnutrition [7]. Nevertheless, the Nutrition and Health Survey in Taiwan in 2013–2016 reported that approximately 40% of older adults had insufficient intake of energy, while 18.2% of older adults did not reach 75% of the recommended protein intake [8]. The reports indicated that the prevalence of malnutrition in older adults was rising. Taiwan became an aging society in 2018, which meant that 14% of Taiwanese were older than 65 years. It has become increasingly important to improve the health of older adults in a simple and easy way because of the growing senior population, the elongation of life expectancy, and the lack of caregivers [9].
Oral nutritional supplements (ONSs) can provide high-quality nutrients and are easy to prepare, and they are an ideal choice to provide protein and energy in patients and older individuals [10]. Recent studies reported that ONSs can be a strategy for nutritional interventions for inhibiting body weight (BW) loss and accelerating wound healing because of elevated total nutrient intake [11,12]. Moreover, ONSs had positive effects on mild and moderate sarcopenia in older persons, including increasing gait speed and muscle strength [10,12]. On the other hand, nutritional education (NE) can also increase energy intake through changing a subject’s eating behaviors [13]. NE is a time-saving and cost-effective way to improve nutrition knowledge and behaviors among older diabetics and those with other nutrition-related conditions [14]. Studies reported that older people decrease their dietary intake due to influences of social and physiological changes, including changes in taste and chewing and swallowing abilities, and these can reduce the overall nutritional status [14,15]. Although dietary educational interventions can improve people’s dietary variety, nutritional status, and health-related eating behaviors, their efficacy is limited in target populations of older adults [16].
Several studies demonstrated the unique effects of ONSs in improving the nutritional status of older adults, but most studies focused on the late stage of malnutrition [17,18]. Moreover, there is limited research on ONSs as an intervention for older adults at risk of malnutrition, especially older nursing home residents [6,19]. Therefore, the purpose of this study was to investigate the effects of nutritional supplement drinks (NSD) on the nutritional status and physical performance of older nursing home residents who were at risk of malnutrition.

2. Materials and Methods
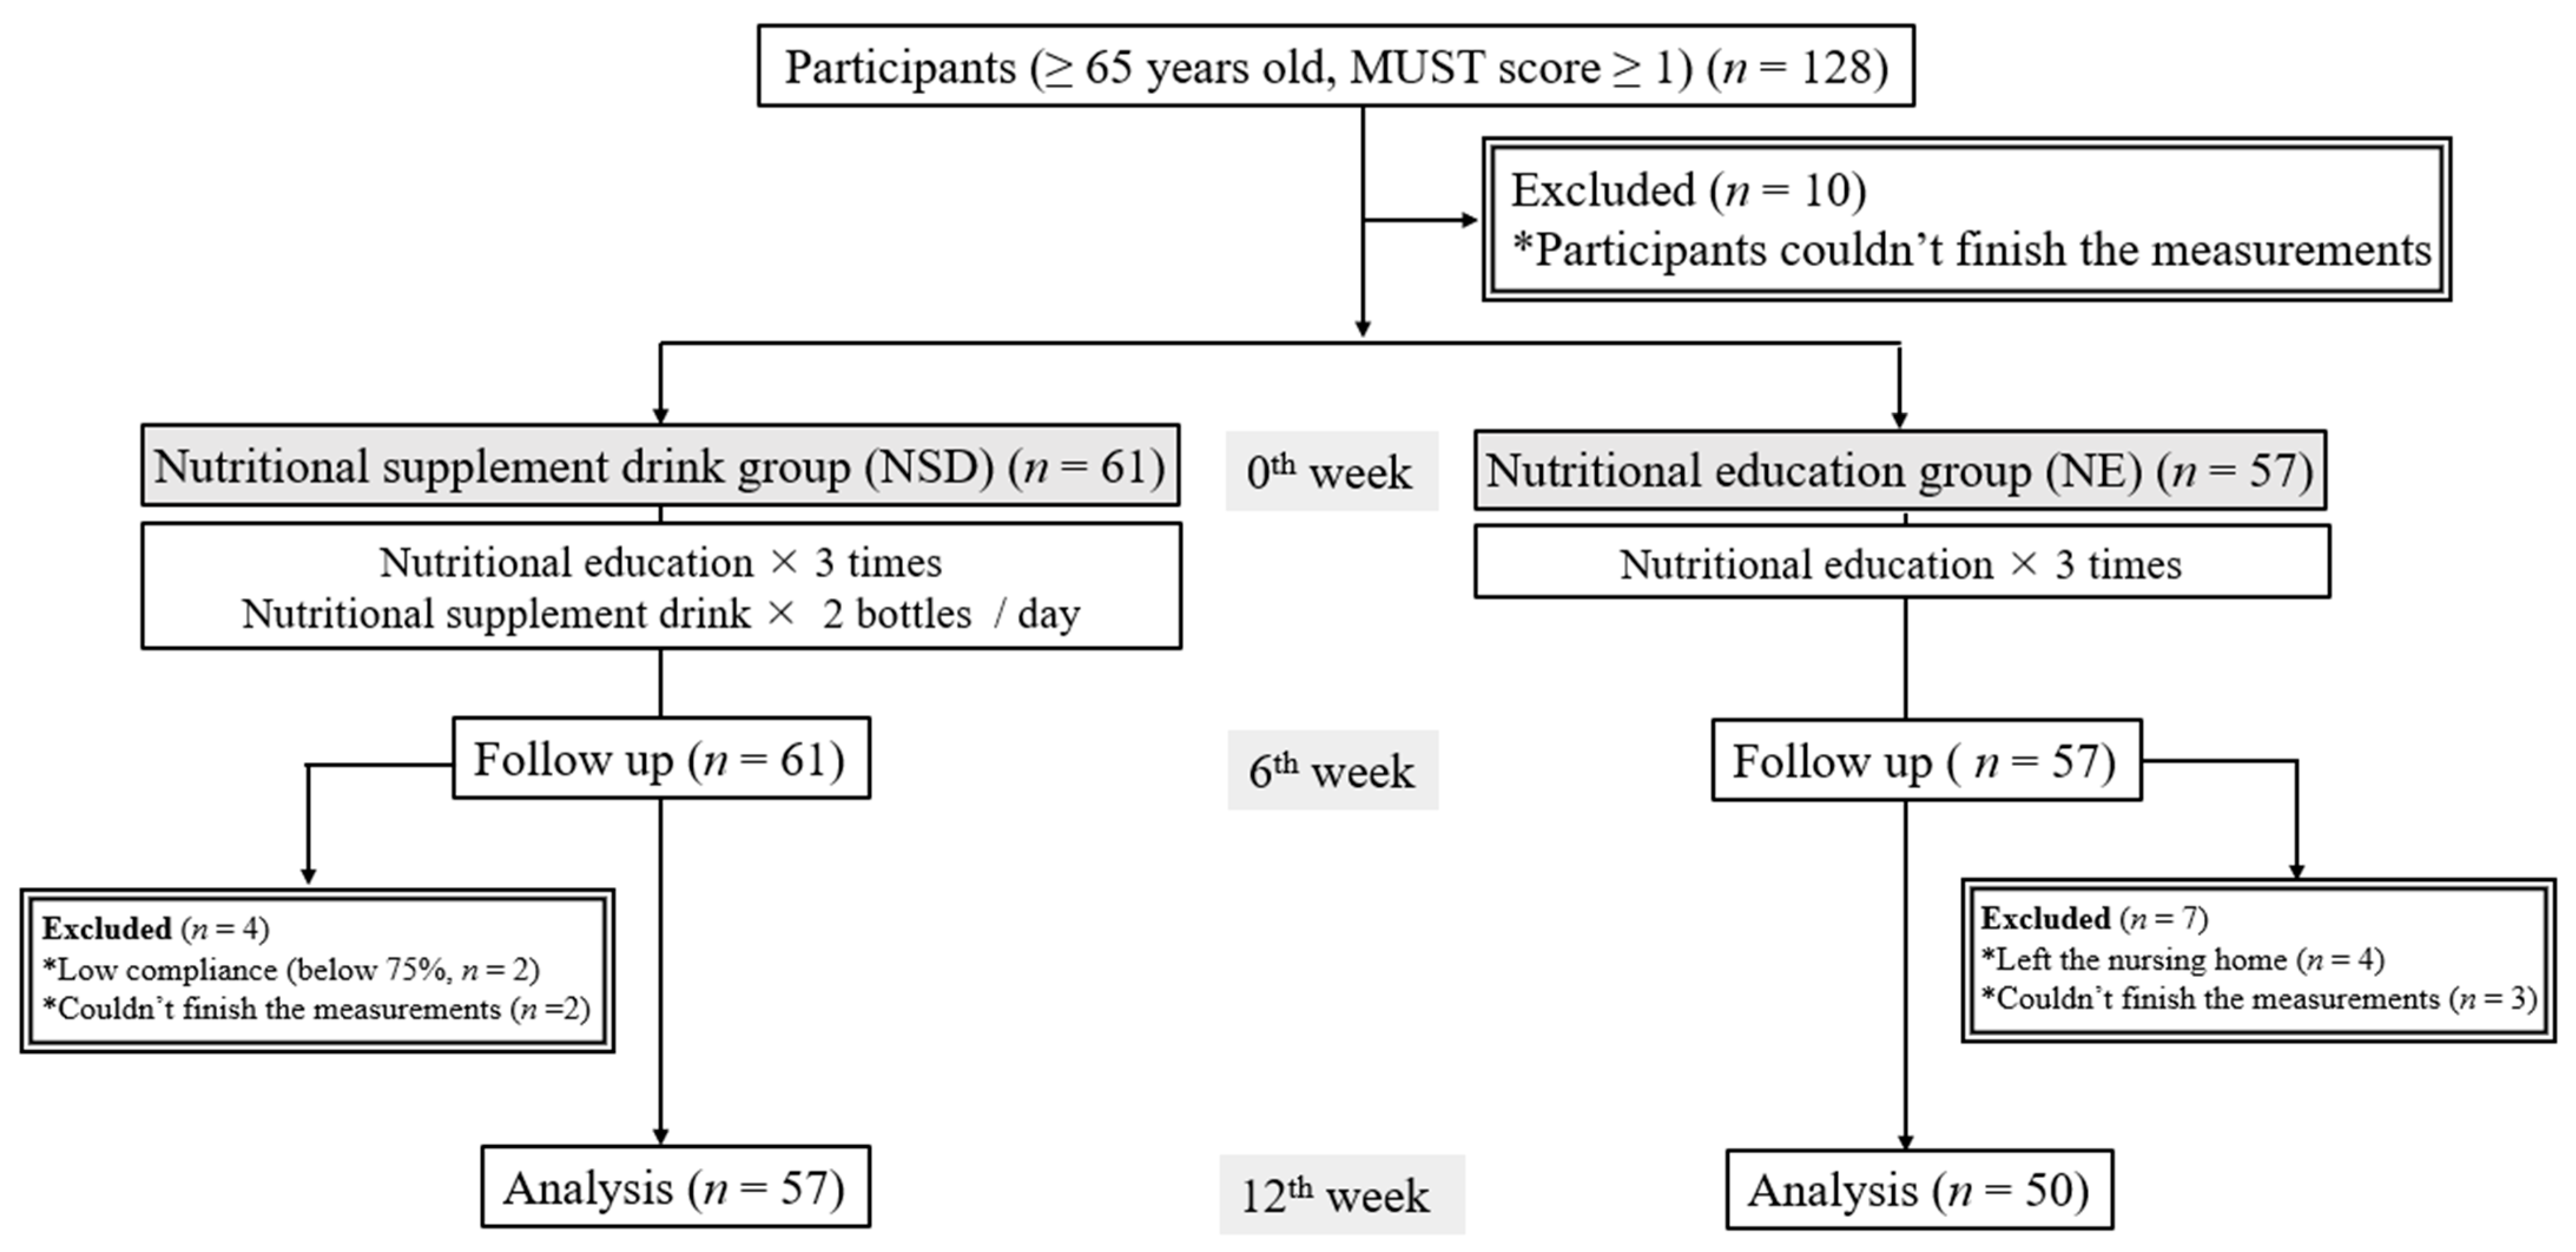
2.1. Study Design

This study was a clustered, randomized, parallel, multicenter clinical trial that was approved by the Taipei Medical University (TMU)-Joint Institutional Review Board (ID: N202011065, 27 January 2021) and ClinicalTrials.gov Protocol Registration and Results System (NCT04857463, 20 April 2021).
Participants who met the criteria were divided into two groups: an NE (NE) group and an NSD group. The experimental period was 12 weeks. Participants in the NE group received NE offered by a dietitian, twice in the first 6 weeks and once in the last 6 weeks. For the NE, the Geriatric Nutrition Handbook from the Taiwan Health Promotion Administration was used, which includes daily dietary guidelines and how to eat when dysphagia and gastrointestinal discomfort occur. Except for regular nutritional education in the NE group, the NSD group was provided with two packs of NSD (Mei Balance, Meiji Holdings, Tokyo, Japan) per day as a snack between meals and before bed. The nutrient contents of the NSD are shown in Table 1. The body composition, muscle strength, nutritional status, and blood biomarkers were evaluated at the baseline, in the sixth week, and at the end of the study at 12 weeks. A survey of the quality of life (QOL) and the health status during the experimental period were monitored at the baseline and the end of the study.

2.2. Participant Recruitment

Regarding inclusion criteria, participants who were older than 65 years and had the Malnutrition Universal Screening Tool (MUST) score of ≥1 were considered at risk of malnutrition. The MUST score was evaluated by three factors such as BMI, unplanned weight loss, and acute disease effects. Additionally, participants were not allowed to accept any ONSs at the time of recruitment for this study. The exclusion criteria included subjects who have chronic diseases, such as diabetes undergoing insulin therapy, chronic kidney disease, and cancer. Hypertension and hyperlipidemia, without taking medicine, were not excluded in this study.
There were four nursing homes in this study, including (1) Taipei Veterans Home, Veterans Affairs Council, (2) Ren-ai Senior Citizens Home, New Taipei City Government, (3) Northern Region Senior Citizens’ Home, Ministry of the Interior, and (4) Hygge Healthcare. The group assignment was determined through a random selection process, where participants within the same nursing home were assigned to the same group. This was carried out to avoid participants comparing whether they received oral nutritional supplements with each other. As a result, (1) and (2) were NE groups, while (3) and (4) were NSD groups. Regarding the recruitment process, the staff members of the project took the opportunity to explain the details of the experiment to the participants during the group activities. This included providing information about the purpose of the study, the intervention being tested, and the potential benefits and risks. Staff members also emphasized the voluntary nature of participation and assured them of their right to withdraw from the study at any time without consequences. After the explanation, those participants who expressed a willingness to participate were asked to remain for further assessment, such as the MSUT score and medical history. Participants who achieved inclusion/exclusion criteria were then given the opportunity to discuss their participation with their family members. Finally, participants who expressed continued willingness to participate after discussing with their family members were asked to sign a consent form. This formalized their agreement to be part of the experiment and marked their official entry into the study.

2.3. Anthropometric Data

Anthropometric measurements were conducted using Karada scan 371 (Omron Kabushiki-Gaisha, Kyoto, Japan) including BW, percentage of muscle mass, and percentage of body fat. The appendicular skeletal muscle mass index (ASMI) was calculated based on the BW, percentage of muscle mass, and height. The calculation formula was BW (kg) × muscle mass (%) ÷ height2 (m) = ASMI (kg/m2). The normal ASMI was defined based on the Asian Working Group for Sarcopenia: 2019 consensus update on sarcopenia diagnosis and treatment. Regarding the measurement method for calf circumference, a tape measure was used to determine the circumference around the thickest part of the calf.

2.4. Blood Pressure

Blood pressure data, including systolic (SBP) and diastolic blood pressure (DBP), were collected by daily records of the nursing home and were measured with an Omron HBP-9020 (Omron Corporation, Tokyo, Japan).

2.5. Physical Performance

The Study of Osteoporotic Fractures (SOF) index was used to assess the frailty of older participants [20]. Hand grip strength was measured with a Camry eh101 hand dynamometer (Camry Scale, South El Monte, CA, USA). Walking speed was determined by a 6-m walking test [21].

2.6. Dietary Calorie Intake and Nutritional Status

The daily calorie intake and the Mini-Nutritional Assessment Short Form (MNA-SF) were assessed by a dietitian. Regarding the dietary intake, since the nursing home provided the same meals to all residents; the calorie intake was estimated based on the remaining portion of each participant’s meal. The MNA-SF was used to assess the nutritional status, with scores of 12~14 considered no risk of malnutrition, 8~11 considered at risk of malnutrition, and 0~7 considered malnutrition [22].

2.7. Blood Biochemical Analyses

Fasting blood samples were analyzed with the ADVIA 1800® Clinical Chemistry System (Siemens Healthcare, Erlangen, Germany), including blood cell analysis, liver function indicators (aspartate transaminase, AST; alanine transaminase, ALT), blood sugar, blood triglycerides, a nutritional status indicator (albumin level), and renal function indicators (uric acid and creatinine levels). A total of 25(OH) vitamin D (Vit. D) was analyzed by a chemiluminescence immunoassay using Abbott Alinity I (Abbott Park, IL, USA). Serum zinc was analyzed by NexION 350 Series (PerkinElmer, Waltham, MA, USA).

2.8. QOL and Health Status

The physical and mental components scale of the MOS 36-Item Short Form Health Survey (SF-36) were used to monitor QOL and the health status [23,24].

2.9. Statistical Analysis

All values are expressed as the mean and standard deviation (SD) or n and percentage (%). SPSS vers. 22 (IBM, Armonk, NY, USA) was used to evaluate differences between groups and changes in parameters. The Shapiro-Wilk test was used to determine the normality. Parametric data were compared with a paired t-test, t-test, or Wilcoxon signed-rank test, and the Mann-Whitney U test was used to analyze non-parametric data. Frequencies between groups were compared by Fisher’s exact test or a Chi-squared test. A multiple linear regression was used to evaluate parameters associated with the intervention. A logistic regression was used to determine the odds ratio of parameters. Pearson’s correlation or Spearman’s rank correlation was used to examine correlations between the albumin level and different parameters. The power of the current study was 0.99 as calculated by G*Power software vers. 3.1 (Heinrich-Heine-Universität Düsseldorf, Düsseldorf, Germany) based on the mean of the MNA-SF at the 12th week and setting α to 0.05. Statistical significance was accepted at p < 0.05.

3. Results

3.1. Basic Information

A study flow diagram is shown in Figure 1. Recruitment for this study began in November 2021 and ended in March 2023. In total, 128 participants met the inclusion criteria; however, 10 participants could not finish the measurements. Sixty-one participants entered the NSD group, while 57 participants entered the NE group. After 6 weeks of the intervention, four participants in the NSD group dropped out due to low compliance and being unable to finish the measurements. Seven participants dropped out in the NE group at the follow-up time point in the 6th week for leaving the nursing home (n = 4) or being unable to finish the measurements (n = 3). After 12 weeks of the intervention, 57 participants completed the study in the NSD group, and 50 participants in the NE group completed the study. Compliance was 75% based on the number of empty bottles collected from participants.

3.2. Baseline Demographics, Anthropometric Assessments, and Dietary Intake of Study Participants

As shown in Table 2, participants in the NE group were significantly younger than those in the NSD group. At the baseline, the NE group had significantly higher BW, BMI, and ASMI, compared to the NSD group. On the other hand, the numbers, or percentages of each MUST score significantly differed between the two groups at the baseline. The NSD group had more participants whose MUST score was 2 or 3.

3.3. Body Composition, Physical Performance, and Nutritional Status

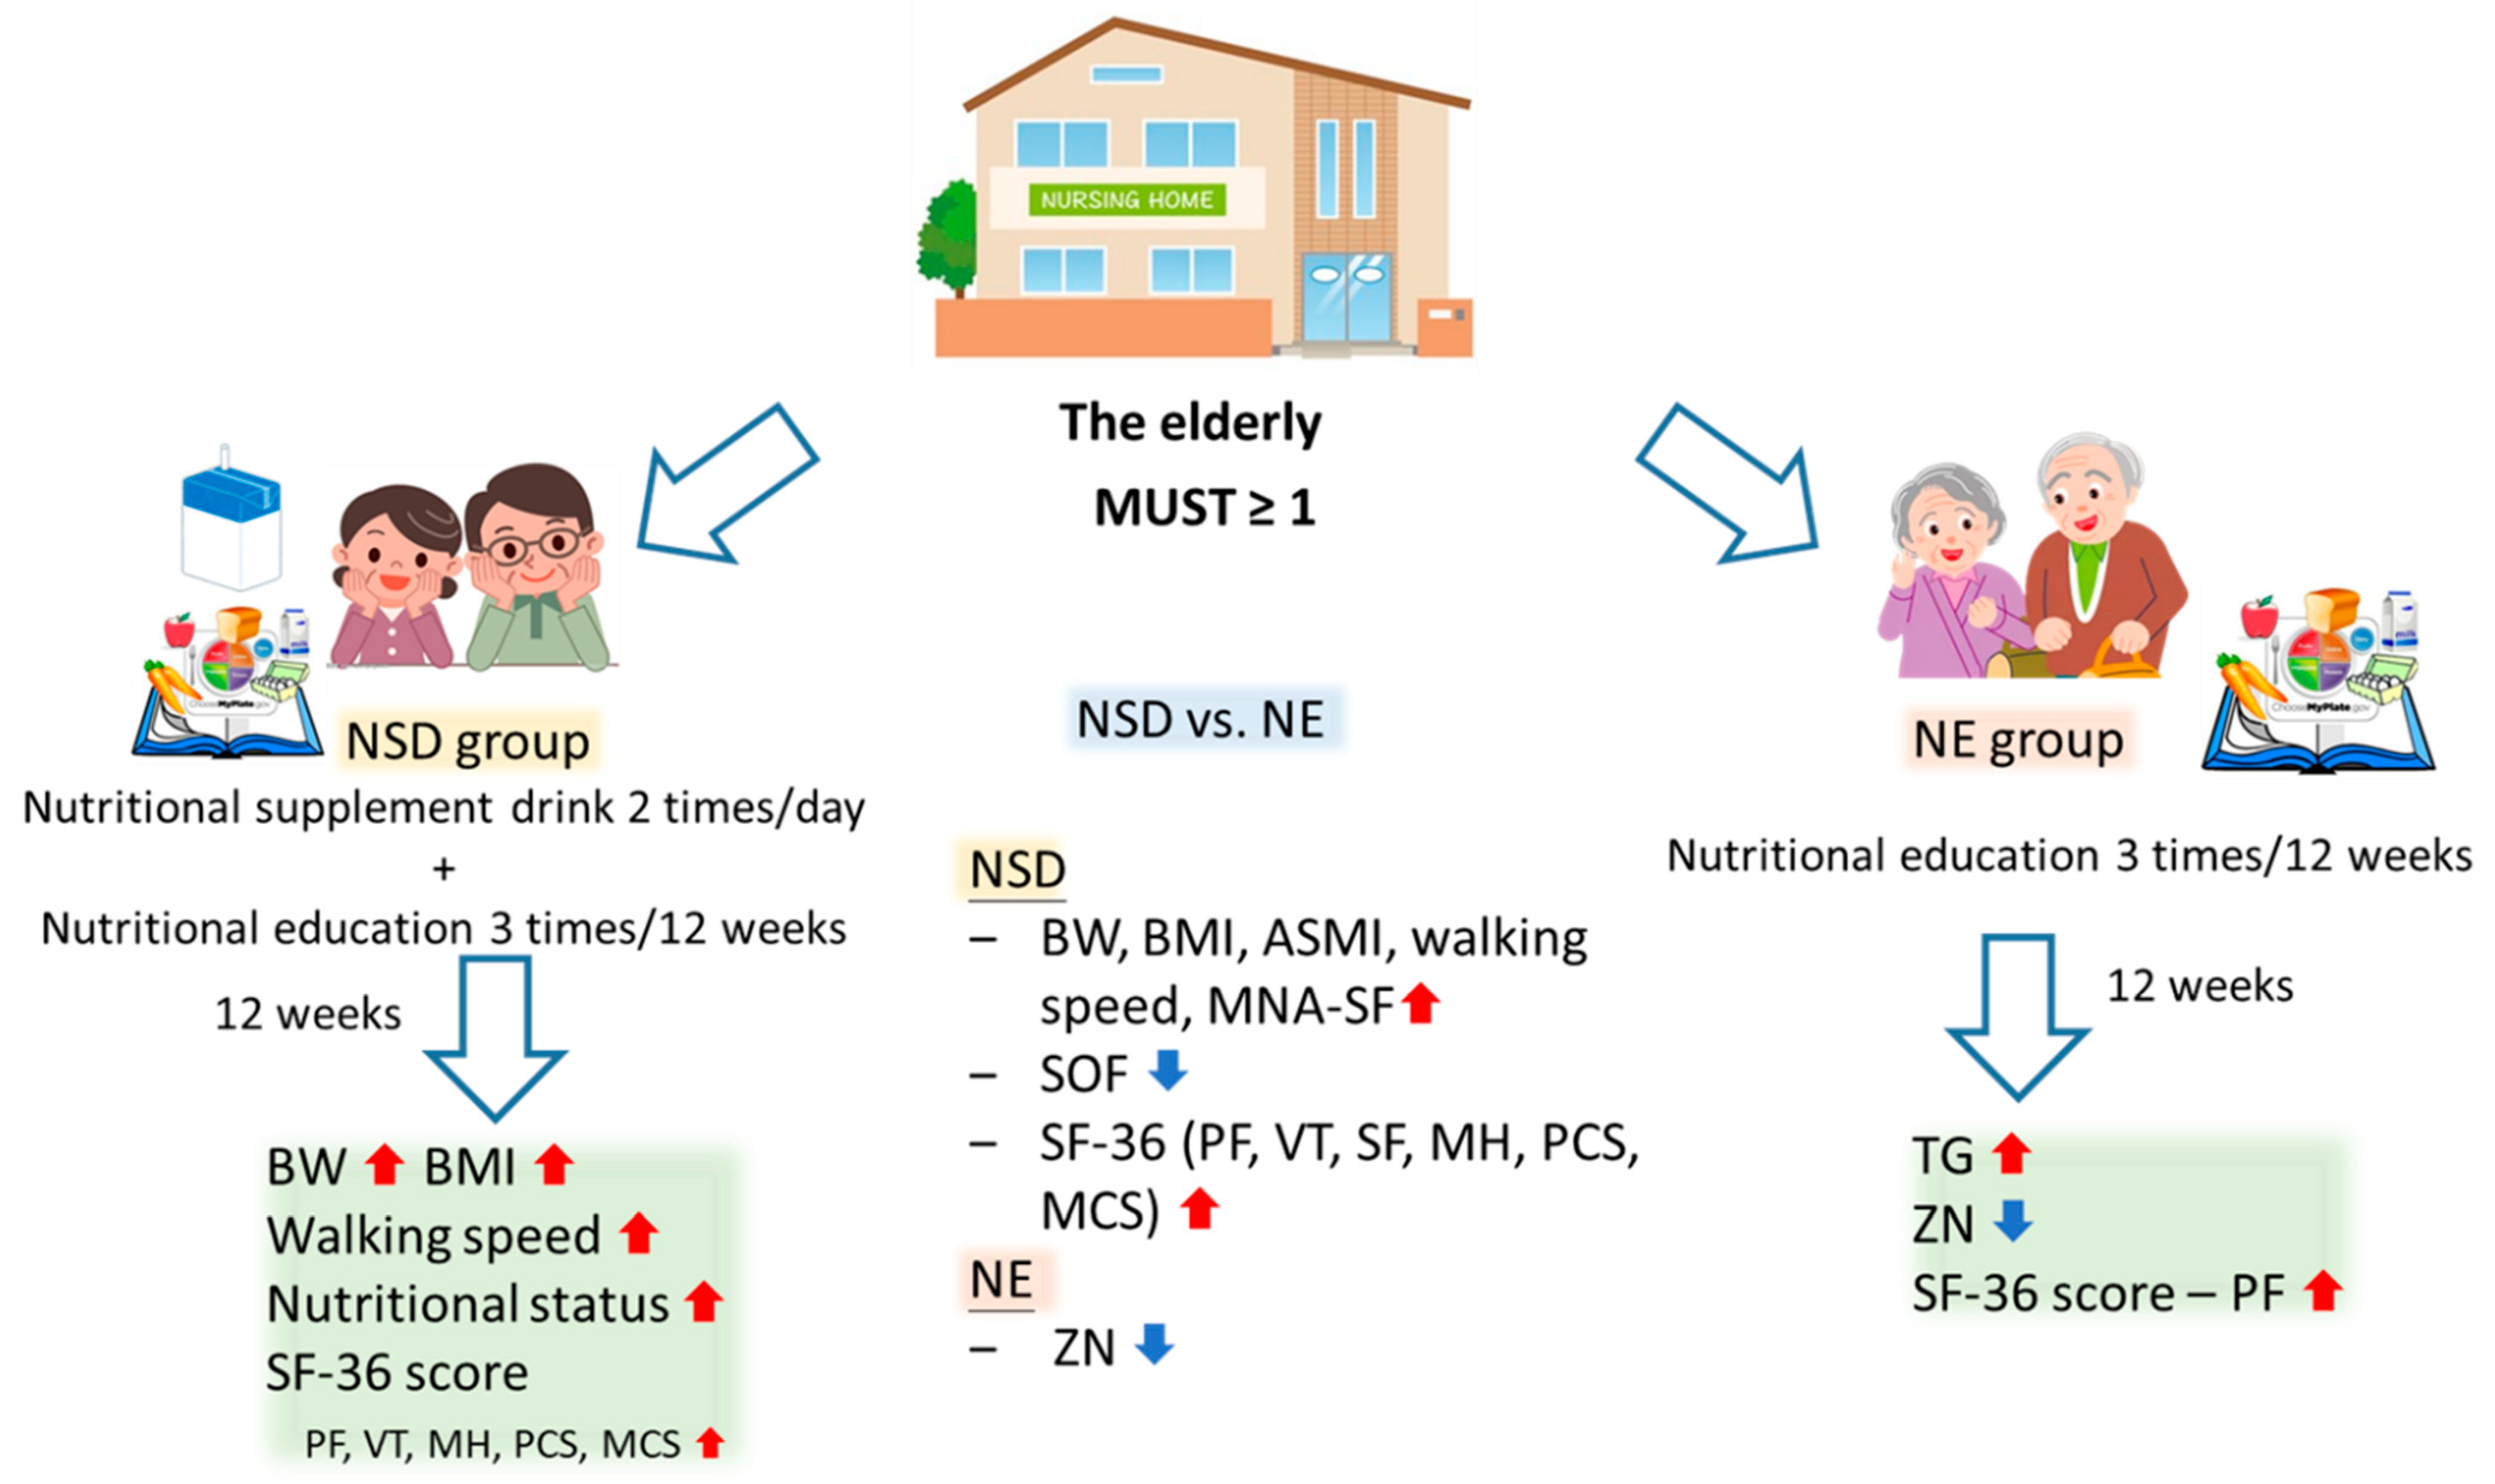
3.3.1. Changes after the NSD Intervention

In the NSD group, compared to the baseline, BW and BMI had significantly increased after 12 weeks of the NSD intervention. The SOF score had significantly decreased while walking speed had significantly increased at the endpoint compared to the baseline. Moreover, the MNA-SF score was significantly higher at the endpoint compared to the baseline (Table 3).

3.3.2. Changes after the NE Intervention

In the NE group, there were no differences in any parameters after 12 weeks of NE (Table 3).

3.3.3. Comparisons of the Effects between NSD and NE

Table 4 displays the changes in anthropometric data and nutritional status, considering the differences in baseline BW, BMI, and ASMI between the two groups. Compared to the NE group, the elevation of BW and BMI was significantly higher in the NSD group. Moreover, the SOF score significantly decreased, whereas the walking speed was significantly higher in the NSD group compared to the NE group. The NSD group had significantly increased caloric intake compared to the NE group. In addition, based on the MNA-SF score, the NSD group showed obvious improvement in the nutritional status compared to the NE group.

3.4. Blood Biochemical Analysis

Blood biochemical parameters are shown in Supplementary Table S2. Although values of several items undulated, they were still in an acceptable range, such as white blood cell count (WBC), mean corpuscular hemoglobin (MCH), mean corpuscular hemoglobin concentration (MCHC), percentages of neutrophils and lymphocytes, AST activity, ALT activity, and albumin level in the NSD group as well as MCH, mean corpuscular volume (MCV), and triglyceride levels in the NE group. Blood Vit. D and zinc levels are discussed further in the next paragraph. The blood albumin level significantly decreased in the NSD group after 12 weeks of the intervention. Albumin levels were 4.28 ± 0.27, 4.18 ± 0.32, and 4.19 ± 0.32 g/dL in the NSD group, and 4.17 ± 0.41, 4.21 ± 0.42, and 4.15 ± 0.47 g/dL in the NE group, at weeks 0, 6, and 12, respectively. Changes in albumin level (week 12—the baseline) were −0.09 ± 0.28 g/dL in the NSD group and −0.02 ± 0.34 g/dL in the NE group (NSD vs. NE p = 0.252). However, albumin levels were still within a normal range in both the NSD and NE groups.

3.5. Vit. D and Zinc Deficiencies

3.5.1. Changes after the NSD Intervention

In the NSD group, 42.1% of participants exhibited a Vit. D deficiency and 31.6% of participants had an insufficient level at the baseline (Table 5). After the 12-week intervention, there was no change in the Vit. D status. As to the zinc status, 49.1% of participants had a deficient level at the beginning of the experiment (Table 5). However, no change was found in the zinc status after 12 weeks.

3.5.2. Changes after the NE Intervention

In the NE group, 42.0% of participants had a deficiency and 42.0% of participants had an insufficient level of Vit. D at the baseline (Table 5). After 12 weeks, no change was found in the Vit. D status. As to the zinc status, 24.0% of participants exhibited a zinc deficiency at the baseline. However, the percentage of participants with a zinc deficiency had significantly increased after 12 weeks (Table 5).

3.5.3. Comparison of the Vit. D and Zinc Statuses between the NSD and NE Groups

The NE group had more participants with sufficient zinc at the baseline compared to the NSD group. However, there were no differences in percentages of participants with deficiencies in the Vit D and zinc statuses at the end of the study between the two groups (Table 5).

3.6. Effects of NSDs on Variables at Week 12, as Analyzed by a Multiple Linear Regression

3.6.1. Body Composition, Physical Performance, and Nutritional Status

As shown in Table 6, BW, BMI, calf circumference, walking speed, and the MNA-SF score were positively significantly affected by the NSD, while the SOF score was negatively significantly affected by the NSD (Table 6). Results indicated that the NSD could increase the BW, BMI, calf circumference, walking speed, and MNA-SF score, and improve frailty.

3.6.2. Blood Biochemical Analysis

Table 7 shows biochemical parameters analyzed by the multiple linear regression. The albumin level was positively affected by the NSD, while the eosinophil percentage was negatively affected by the NSD (Table 7).

3.7. Odds Ratio (OR)

Crude ORs are shown in Table 8, and the risks of frailty, malnutrition, and low walking speed were significantly reduced after the NSD intervention. After the NSD intervention, models 1 and 2 showed the same trend of the risks of frailty, malnutrition, and low walking speed being reduced.
However, the risk of a low ASMI increased after the NSD intervention in models 1 and 2. After adjusting for the baseline ASMI and other parameters in model 2, the risk of a low ASMI disappeared in model 3. Therefore, it was estimated that the higher risk of a low ASMI might be related to the significantly lower ASMI in the NSD group at the baseline.
In model 3, the NSD intervention produced a lower risk of zinc deficiency.

3.8. QOL and SF-36 Questionnaire

3.8.1. Effects of the NSD or NE Interventions

After 12 weeks of the intervention, the NSD group exhibited significant improvements in physical function (PF), vitality (VT), mental health (MH), and also the total score of physical health (physical component score, PCS) and total mental health (mental component score, MCS) in the SF-36 questionnaire (Supplementary Table S3). Results indicated that the NSD intervention improved the vitality and mental health of nursing home-dwelling older persons. There were no differences between the endpoint and the baseline for each item of the SF-36 questionnaire except for PF in the NE group, as PF had significantly decreased at the endpoint compared to the baseline (Supplementary Table S3).

3.8.2. Changes in SF-36 Questionnaire Scores after the NSD and NE Interventions

To evaluate changes and improvements in SF-36 scores after the intervention, we compared changes in scores of both groups by analyzing values of week 12 minus those of week 0. The NSD group had significantly greater improvements in PF, VT, social functioning (SF), MH, PCS, and MCS than the NE group (Supplementary Table S4).

3.9. Correlations among the SF-36 Questionnaire, the Nutritional Status, Physical Performance, Vit. D, and the Intervention

As shown in Supplementary Table S5, after the 12-week intervention, PF, general health (GH), VT, and MH were positively correlated with the MNA-SF. PF, GH, and PCS were positively correlated with walking speed, while GH was positively correlated with the albumin level. Moreover, the NSD intervention was positively correlated with PF, GH, VT, MH, and MCS. Based on these results, a better nutritional status was associated with a higher SF-36 score, which included PF and MH.

4. Discussion

4.1. ONSs, BW, Body Composition, and Physical Performance

The current results demonstrated that NSDs significantly increased BW and BMI (Table 3, NSD group). One report indicated that the excess energy requirement for 1 kg of weight gain in young women with anorexia nervosa was approximately 7500 kcal/kg BW [25]. In contrast, the excess energy requirement was shown to be 8856 to 22,620 kcal/kg BW in malnourished nursing home patients [26]. Therefore, it was suggested that amelioration of a malnourished state is more difficult in the older than in young individuals [27]. In this study, BW gain was 1.21 ± 1.83 kg after 3 months of the NSD intervention (Table 4, NSD group). The excess total energy intake was around 35,813 (397.92 × 90 days) kcal (Table 4, energy intake). Therefore, it was speculated that the NSD provided more calories and nutrients which contributed to elevated BW and BMI. In addition, according to the Dietary Reference Intake (DRI) values in Taiwan, the recommended daily energy intake of older adults (older than 65 years) is 1900 kcal for males and 1500 for females. In this study, energy intake was insufficient at the baseline (Table 3). This is an important issue for increasing the energy intake of older nursing home residents. Detailed nutrient intake levels should be evaluated in future studies.
In this study, the SOF significantly decreased, and walking speed significantly increased without changing the body fat or muscle mass in the NSD group (Table 3). In this study, a cafeteria diet was provided to nursing home residents except during the period of coronavirus disease 2019 (COVID-19) restrictions. Interestingly, outdoor activities were also restricted during the study period because of COVID-19 transmission prevention, even though the SOF and walking speed improved in the NSD group. Loman et al. indicated that ONS consumption increased the intake of numerous nutrients without decreasing nutrient intake from food in older malnourished adults post-discharge [28]. Anton et al. also reported that dietary interventions had inconsistent effects on functional and strength outcomes; however, exercise interventions and combined diet and exercise interventions consistently improved lower-body muscle strength but had less consistent effects on walking speed and grip strength [29]. Therefore, in this study, it is undeniable that the NSDs contributed to decreasing frailty based on the SOF and the increase in the walking speed in older residents. However, physical activities should be monitored in future studies.
Compared to participants who only received the NE intervention, the improved effects of the NSD intervention on increasing BW, BMI, and ASMI and decreasing the SOF and physical performance were more obvious than those of the NE intervention (Table 4). As a result, providing ONS can be effective in improving the nutritional status of older nursing home residents.

4.2. Effects of the NSD on Related Variables

Based on a multiple linear regression, NSDs showed positive effects on BW, BMI, calf circumference, walking speed, and MNA-SF scores, and negative effects on the SOF, and produced an improvement in frailty (Table 6). Phillips et al. indicated that the MNA-SF and MUST are practical nutritional screening tools for community-dwelling seniors [30]. In Japan, Nakamura et al. discovered that the MNA had the highest area under the curve (AUC) score for age-related muscle loss and sarcopenia when using the criteria of the Asian Working Group for Sarcopenia (AWGS) [31]. Poulia et al. also noted that the MNA-SF and MUST tools are practical, as they can be used in clinical settings and all community areas [32]. In this study, MUST was used to evaluate the risk of malnutrition because the information could be checked based on the health records of the nursing homes. At the baseline, both groups showed a risk of malnutrition based on MUST as well as the MNA-SF (Table 3). After 12 weeks, the NSD group had MNA-SF scores of >12, which represented a normal nutritional status [22].

4.3. Blood Albumin Levels and Related Variables

Blood albumin levels remained within the normal range in both the NSD and NE groups, although it had significantly decreased in the NSD group after 3 months (Supplementary Table S2). As shown in Supplementary Table S6, calf circumference, ASMI, grip strength, walking speed, and MNA-SF scores were positively correlated with the blood albumin level, but without strong correlations. According to previous studies, albumin levels decrease with aging, and older adults exhibit greater decreases in albumin [33,34], which was also observed in this study. The NSD group had a higher average age, which may explain why decreases in the albumin level were more apparent in the NSD group than in the NE group. In addition, a meta-analysis by Cabrerizo et al. and a cohort study by Kitamura et al. showed that albumin levels were associated with physical activities, activities of daily living (ADLs), and muscle mass, which is related to inadequate protein intake [34,35]. Therefore, nutrient intake, especially protein, and physical activities should be monitored in future studies.

4.4. Vit. D and Zn Deficiencies

In this study, the definition of the Vit. D status was based on recommendations from the Endocrine Society Task Force on Vitamin D in the US population [36]. It was found that 78.5% (84/107) of participants exhibited Vit. D insufficiency or deficiency (Table 5). In Europe, the prevalence of Vit. D deficiency in the general population is as high as 37% and as high as 80% in nursing home residents and non-European immigrants [37]. A study in a Swedish community involving 22 nursing homes also indicated a significant number of older persons with a low Vit. D condition with a mean of 34 ng/mL, and 82% had a value of <20 ng/mL [38]. In Taiwan, a study among community-based older persons found most of the deficiency in Vit. D was 22.4% as serum 25(OH)D which was <20 ng/mL, and the mean level of participants was <30 ng/mL [39]. Unfortunately, there is limited study of awareness among nursing home dwellers in Taiwan to evaluate the prevalence of Vit. D deficiency. After the 12-week NSD intervention, the Vit. D status had not improved in participants, which might be because the drink was not a Vit. D-fortified product (Table 1 and Table 8). The Vit. D status of older adults must be highlighted in nutritional care.
The percentage of participants with a Zn deficiency was 37.3% (40/107) at the baseline in this study (Table 5). In addition, the percentage with a Zn deficiency did not change in the NSD group, while it significantly increased in the NE group after the 12-week intervention. Zinc is among the minerals whose consumption or bioavailability may drop in older populations, as influenced by reduced absorption, an increasing number of diseases that alter the use of zinc, and increased use of drugs that reduce its bioavailability in the body [40]. IZiNCG recommends that if more than 20% of a population’s serum Zn concentrations are below a critical value, the population’s risk of a Zn deficiency is considered to have increased [41]. A limited amount of research has been conducted on the Zn status of older adults. As a result, the ZN status may soon become an important health issue.

4.5. Crude and Adjusted ORs

The crude and adjusted ORs showed risks of frailty, malnutrition, and low walking speed were significantly reduced after the NSD intervention (Table 8). However, the risk of low ASMI increased in models 1 and 2, whereas there was no change in model 3 after the NSD intervention (Table 8). An ASMI evaluation can contribute important information to an assessment of the nutritional status because it reflects the body’s protein mass [42]. Gallagher et al. also demonstrated that skeletal muscles are affected by age, gender, and ethnicity [43]. Based on Table 8, ORs for frailty, malnutrition, and a low walking speed were significantly reduced, whereas the OR of low ASMI was significantly elevated after the NSD intervention. Nevertheless, after adjusting for age, sex, baseline BMI, and ASMI, the OR for low ASMI became nonsignificant. Possible reasons might be because of the significant difference in age, BMI, or ASMI between the two groups and the measurement tools of muscle mass. Common methods to determine the appendicular skeletal muscle mass (ASMM) are a bioelectrical impedance analysis (BIA) and dual-energy X-ray absorptiometry (DEXA) [44]. However, Kuriyan also pointed out that several factors must be considered when selecting an appropriate method, including the feasibility, cost, technical skills required, level of accuracy, participant burden, radiation exposure, the time required, validation in an appropriate population, and the availability of reference data [45]. Therefore, a portable electronic body composition scale was utilized in this study, since it is easy to move between different areas and is less burdensome for older individuals.

4.6. Nutritional Status and QoL

Results indicated that NSDs can improve the activity and mental health of older nursing home-dwelling persons more than those who only received NE (Supplementary Tables S3 and S4). In a previous cohort study of older men living in veteran homes, it was found that the non-malnourished population had a higher percentage of better ADLs and better moods than the malnourished population [46]. Results of another study, which recruited 72 participants with an average age of 70.8 years in two nursing homes, indicated that higher MNA scores were associated with a lower tendency for depression and better physical functioning and ADLs. It was proposed that older persons with better physical performance may be better equipped to handle everyday activities associated with eating and physical activities [47]. Similarly, the intervention with a nutritional supplement had positive correlations with both physical function and mental health in this study.

4.7. Strengths and Limitations

In this study, the statistical power was 0.99, which indicates a high possibility of identifying a true effect. Additionally, several nursing homes participated in the study. However, some limitations of this study should be addressed. First, the study was conducted between November 2021 and March 2023, when Taiwan was affected by COVID-19. To prevent the spread of COVID-19, nursing homes had strict requirements, including controlling visitor entry, weekly rapid tests on residents and caregivers, and quarantine measures. This policy and situation both limited researchers from collecting the questionnaires face-to-face with residents and may have created biases due to self-reporting of the questionnaires. Second, since the dietitian only provided a summary of total energy intake, nutrient intake details were not calculated. Third, a portable body composition scale was used in this study because it can conveniently be moved between nursing homes. Although the portable body composition scale was cited in previous studies [8,48,49], it should be replaced in the future by more reliable measurements such as BIA or DEXA. Lastly, apart from Vit. D and zinc, other common nutrients that are prone to deficiency in older adults, such as Ca, iron, Vit. B12, folic acids, etc. Therefore, it is necessary to clarify these kinds of nutrients in future studies.

5. Conclusions

Current results indicated that the NSD intervention combined with NE for 12 weeks improved the nutritional status, including BW, BMI, and MNA-SF scores, as well as physical performance such as walking speed in the older population at risk of malnutrition (Figure 2). Moreover, SF-36 questionnaire scores also increased, including the physical and mental health scales. In conclusion, ONS was effective in improving the nutritional status of older nursing home residents who were at risk of malnutrition.

Supplementary Materials

The following supporting information can be downloaded at: https://www.mdpi.com/article/10.3390/nu15194291/s1, Supplementary Table S1. Effects of nutritional supplement drink (NSD) on body composition, physical performance, nutritional status, and nutrition intake in older nursing home residents at risk of malnutrition; Supplementary Table S2. Effects of nutritional supplement drink (NSD) and nutritional education (NE) on blood biochemical parameters in older nursing home residents at risk of malnutrition; Supplementary Table S3. Effects of nutritional supplement drink (NSD) on the MOS 36-Item Short Form Health Survey (SF)-36 questionnaire of older nursing home residents at risk of malnutrition; Supplementary Table S4. Changes in the MOS 36-Item Short Form Health Survey (SF)-36 questionnaire score after 12 weeks of nutritional supplement drink (NSD) in older nursing home residents at risk of malnutrition; Supplementary Table S5. Correlations of components of the MOS 36-Item Short Form Health Survey (SF)-36 questionnaire with the nutritional status, physical performance, vitamin D, and nutritional supplement drink (NSD); Supplementary Table S6. Correlations of albumin levels with muscle mass, physical function, frailty, and nutrition status.

Author Contributions

Conceptualization, S.-C.Y.; methodology, S.-C.Y. and J.-R.C.; validation, Y.-H.C., S.-C.Y. and J.-R.C.; analysis and interpretation of data, Y.-H.C. and C.-Y.L.; investigation, C.-Y.L., M.-Y.D. and F.-Q.L.; resources, S.-C.Y. and C.-Y.L.; data curation, Y.-H.C. and C.-Y.L.; writing—original draft preparation, Y.-H.C. and S.-C.Y.; writing—review and editing, Y.-H.C. and S.-C.Y.; supervision, S.-C.Y.; project administration, S.-C.Y.; funding acquisition, S.-C.Y. All authors have read and agreed to the published version of the manuscript.

Funding

This research was funded by the Meiji Holding Company, Tokyo, Japan (A109-111) and Formosa Produce Corporation, Taipei, Taiwan (A-109-079).

Institutional Review Board Statement

The study was conducted in accordance with the Declaration of Helsinki. The study protocol was approved by the Taipei Medical University (TMU)-Joint Institutional Review Board (ID: N202011065, 27 January 2021) and ClinicalTrials.gov Protocol Registration and Results System (NCT04857463) “https://clinicaltrials.gov/ (accessed on 20 April 2021)”.

Informed Consent Statement

Informed consent was obtained from all subjects involved in the study.

Data Availability Statement

Data available on request due to privacy/ethical restrictions.

Acknowledgments

The authors express their appreciation to Jia-Miao Hong (Taipei Veterans Home, Veterans Affairs Council), Xiu-Ling Su, Ya-Jun Chen (Ren-ai Senior Citizens Home, New Taipei City Government), Bai-Hui Feng, Shu-Rong Huang (Northern Region Senior Citizens’ Home, Ministry of the Interior), Li-Juan Chen, Yu-Juan Jian (Hygge Healthcare), and all subjects who participated in this study for helping with study conduction and data collection.

Conflicts of Interest

The authors declare no conflict of interest.

References

  1. World Health Organization. The World Health Report 2008: Primary Health Care Now More than Ever. Available online: https://apps.who.int/iris/handle/10665/43949 (accessed on 20 July 2023).
  2. Watanabe, Y.; Hirano, H.; Arai, H.; Morishita, S.; Ohara, Y.; Edahiro, A.; Murakami, M.; Shimada, H.; Kikutani, T.; Suzuki, T. Relationship between frailty and oral function in community-dwelling elderly adults. J. Am. Geriatr. Soc. 2017, 65, 66–76. [Google Scholar] [CrossRef] [PubMed]
  3. Umegaki, H.; Asai, A.; Kanda, S.; Maeda, K.; Shimojima, T.; Nomura, H.; Kuzuya, M. Factors associated with unexpected admissions and mortality among low-functioning older patients receiving home medical care. Geriatr. Gerontol. Int. 2017, 17, 1623–1627. [Google Scholar] [CrossRef]
  4. World Health Organization. Evidence Profile: Malnutrition. Integrated Care for Older People (ICOPE). 2017. Available online: https://www.who.int/publications/i/item/WHO-MCA-17.06.06 (accessed on 5 October 2023).
  5. Algra, Y.; Haverkort, E.; Kok, W.; Etten-Jamaludin, F.V.; Schoot, L.V.; Hollaar, V.; Naumann, E.; Schueren, M.V.; Jerković-Ćosić, K. The Association between Malnutrition and Oral Health in Older People: A Systematic Review. Nutrients 2021, 13, 3584. [Google Scholar] [CrossRef] [PubMed]
  6. Stechmiller, J.K. Early nutritional screening of older adults: Review of nutritional support. J. Infus. Nurs. Off. Publ. Infus. Nurses Soc. 2003, 26, 170–177. [Google Scholar] [CrossRef]
  7. Chan, L.C.; Kao, S.y.; Chin, H.M.L.; Lee, M.S. Nutritional status assessment and predictors of community-dwelling and in-stitutionalized elderly in northern Taiwan. Nutr. Sci. J. 2002, 27, 147–158. [Google Scholar] [CrossRef]
  8. Lin, C.H.; Chang, H.Y.; Li, T.C.; Liu, C.S.; Lin, W.Y.; Lee, M.C.; Liao, L.N.; Li, C.I.; Hsiao, C.Y.; Fang, H.L.; et al. Trends in energy and macronutrient intake among Taiwanese older adults in 1999–2000, 2005–2008 and 2013–2016 periods. BMC Public Health 2023, 23, 871. [Google Scholar] [CrossRef]
  9. Wu, S.C. A new turning point of long term care policy in Taiwan. J. Long-Term Care 2017, 21, 1–7. [Google Scholar]
  10. Cramer, J.T.; Cruz-Jentoft, A.J.; Landi, F.; Hickson, M.; Zamboni, M.; Pereira, S.L.; Hustead, D.S.; Mustad, V.A. Impacts of high-protein oral nutritional supplements among malnourished men and women with sarcopenia: A multicenter, randomized, double-blinded, controlled trial. J. Am. Med. Dir. Assoc. 2016, 17, 1044–1055. [Google Scholar] [CrossRef] [PubMed]
  11. Johnson, S.; Nasser, R.; Banow, T.; Cockburn, T.; Voegeli, L.; Wilson, O.; Coleman, J. Use of oral nutrition supplements in long-term care facilities. Can. J. Diet. Pract. Res. A Publ. Dietit. Can. 2009, 70, 194–198. [Google Scholar] [CrossRef]
  12. Chew, S.T.H.; Tan, N.C.; Cheong, M.; Oliver, J.; Baggs, G.; Choe, Y.; How, C.H.; Chow, W.L.; Tan, C.Y.L.; Kwan, S.C.; et al. Impact of specialized oral nutritional supplement on clinical, nutritional, and functional outcomes: A randomized, placebo-controlled trial in community-dwelling older adults at risk of malnutrition. Clin. Nutr. 2021, 40, 1879–1892. [Google Scholar] [CrossRef]
  13. Rea, J.; Walters, K.; Avgerinou, C. How effective is nutrition education aiming to prevent or treat malnutrition in community-dwelling older adults? A systematic review. Eur. Geriatr. Med. 2019, 10, 339–358. [Google Scholar]
  14. Lyons, B.P. Nutrition education intervention with community-dwelling older adults: Research challenges and opportunities. J. Community Health 2014, 39, 810–818. [Google Scholar] [CrossRef]
  15. Mann, T.; Heuberger, R.; Wong, H. The association between chewing and swallowing difficulties and nutritional status in older adults. Aust. Dent. J. 2013, 58, 200–206. [Google Scholar] [CrossRef]
  16. Zhou, X.; Perez-Cueto, F.J.A.; Santos, Q.D.; Monteleone, E.; Giboreau, A.; Appleton, K.M.; Bjørner, T.; Bredie, W.L.P.; Hartwell, H. A systematic review of behavioural interventions promoting healthy eating among older people. Nutrients 2018, 10, 128. [Google Scholar] [CrossRef] [PubMed]
  17. de van der Schueren, M.A. Use and effects of oral nutritional supplements in patients with cancer. Nutrition 2019, 67, 110550. [Google Scholar]
  18. Parsons, E.L.; Stratton, R.J.; Cawood, A.L.; Smith, T.R.; Elia, M. Oral nutritional supplements in a randomised trial are more effective than dietary advice at improving quality of life in malnourished care home residents. Clin. Nutr. 2017, 36, 134–142. [Google Scholar] [CrossRef]
  19. Perna, S.; Rondanelli, M.; Spadaccini, D.; Lenzi, A.; Donini, L.; Poggiogalle, E. Are the therapeutic strategies in anorexia of ageing effective on nutritional status? A systematic review with meta-analysis. J. Hum. Nutr. Diet. 2019, 32, 128–138. [Google Scholar] [PubMed]
  20. Ensrud, K.E.; Ewing, S.K.; Cawthon, P.M.; Fink, H.A.; Taylor, B.C.; Cauley, J.A.; Dam, T.T.; Marshall, L.M.; Orwoll, E.S.; Cummings, S.R. A comparison of frailty indexes for the prediction of falls, disability, fractures, and mortality in older men. J. Am. Geriatr. Soc. 2009, 57, 492–498. [Google Scholar] [CrossRef] [PubMed]
  21. Chen, L.K.; Woo, J.; Assantachai, P.; Auyeung, T.W.; Chou, M.Y.; Iijima, K.; Jang, H.C.; Kang, L.; Kim, M.; Kim, S.; et al. Asian Working Group for Sarcopenia: 2019 consensus update on sarcopenia diagnosis and treatment. J. Am. Med. Dir. Assoc. 2020, 21, 300–307.e302. [Google Scholar] [CrossRef]
  22. Rubenstein, L.Z.; Harker, J.O.; Salvà, A.; Guigoz, Y.; Vellas, B. Screening for undernutrition in geriatric practice: Developing the short-form mini-nutritional assessment (MNA-SF). J. Gerontology. Ser. A Biol. Sci. Med. Sci. 2001, 56, M366–M372. [Google Scholar] [CrossRef]
  23. Jenkinson, C.; Coulter, A.; Wright, L. Short form 36 (SF36) health survey questionnaire: Normative data for adults of working age. BMJ Clin. Res. Ed. 1993, 306, 1437–1440. [Google Scholar] [CrossRef]
  24. Ware, J.E., Jr.; Sherbourne, C.D. The MOS 36-item short-form health survey (SF-36). I. Conceptual framework and item selection. Med. Care 1992, 30, 473–483. [Google Scholar] [CrossRef]
  25. Hébuterne, X.; Bermon, S.; Schneider, S.M. Ageing and muscle: The effects of malnutrition, re-nutrition, and physical exercise. Curr. Opin. Clin. Nutr. Metab. Care 2001, 4, 295–300. [Google Scholar] [CrossRef] [PubMed]
  26. Walker, J.; Roberts, S.L.; Halmi, K.A.; Goldberg, S.C. Caloric requirements for weight gain in anorexia nervosa. Am. J. Clin. Nutr. 1979, 32, 1396–1400. [Google Scholar] [CrossRef]
  27. Hébuterne, X.; Broussard, J.F.; Rampal, P. Acute renutrition by cyclic enteral nutrition in elderly and younger patients. JAMA 1995, 273, 638–643. [Google Scholar] [CrossRef]
  28. Loman, B.R.; Luo, M.; Baggs, G.E.; Mitchell, D.C.; Nelson, J.L.; Ziegler, T.R.; Deutz, N.E.; Matarese, L.E. Specialized high-protein oral nutrition supplement improves home nutrient intake of malnourished older adults without decreasing usual food intake. JPEN J. Parenter. Enter. Nutr. 2019, 43, 794–802. [Google Scholar] [CrossRef]
  29. Anton, S.D.; Hida, A.; Mankowski, R.; Layne, A.; Solberg, L.M.; Mainous, A.G.; Buford, T. Nutrition and exercise in sarcopenia. Curr. Protein Pept. Sci. 2018, 19, 649–667. [Google Scholar] [CrossRef] [PubMed]
  30. Phillips, M.B.; Foley, A.L.; Barnard, R.; Isenring, E.A.; Miller, M.D. Nutritional screening in community-dwelling older adults: A systematic literature review. Asia Pac. J. Clin. Nutr. 2010, 19, 440–449. [Google Scholar]
  31. Nakamura, H.; Kita, N.; Tanimoto, K.; Kunikata, C.; Taoka, T. Usefulness of nutrition screening tools for sarcopenia screening with chronic obstructive pulmonary disease in JAPAN. Eur. Respir. Soc. 2018, 52, PA70. [Google Scholar]
  32. Poulia, K.A.; Yannakoulia, M.; Karageorgou, D.; Gamaletsou, M.; Panagiotakos, D.B.; Sipsas, N.V.; Zampelas, A. Evaluation of the efficacy of six nutritional screening tools to predict malnutrition in the elderly. Clin. Nutr. 2012, 31, 378–385. [Google Scholar] [CrossRef]
  33. Gom, I.; Fukushima, H.; Shiraki, M.; Miwa, Y.; Ando, T.; Takai, K.; Moriwaki, H. Relationship between serum albumin level and aging in community-dwelling self-supported elderly population. J. Nutr. Sci. Vitaminol. 2007, 53, 37–42. [Google Scholar] [CrossRef]
  34. Cabrerizo, S.; Cuadras, D.; Gomez-Busto, F.; Artaza-Artabe, I.; Marín-Ciancas, F.; Malafarina, V. Serum albumin and health in older people: Review and meta analysis. Maturitas 2015, 81, 17–27. [Google Scholar] [CrossRef]
  35. Kitamura, K.; Nakamura, K.; Nishiwaki, T.; Ueno, K.; Nakazawa, A.; Hasegawa, M. Determination of whether the association between serum albumin and activities of daily living in frail elderly people is causal. Environ. Health Prev. Med. 2012, 17, 164–168. [Google Scholar] [CrossRef] [PubMed]
  36. Holick, M.F.; Binkley, N.C.; Bischoff-Ferrari, H.A.; Gordon, C.M.; Hanley, D.A.; Heaney, R.P.; Murad, M.H.; Weaver, C.M. Evaluation, treatment, and prevention of vitamin D deficiency: An Endocrine Society clinical practice guideline. J. Clin. Endocrinol. Metab. 2011, 96, 1911–1930. [Google Scholar] [CrossRef] [PubMed]
  37. Zittermann, A.; Pilz, S.; Hoffmann, H.; März, W. Vitamin D and airway infections: A European perspective. Eur. J. Med. Res. 2016, 21, 14. [Google Scholar] [CrossRef] [PubMed]
  38. Arnljots, R.; Thorn, J.; Elm, M.; Moore, M.; Sundvall, P.D. Vitamin D deficiency was common among nursing home residents and associated with dementia: A cross sectional study of 545 Swedish nursing home residents. BMC Geriatr. 2017, 17, 229. [Google Scholar] [CrossRef]
  39. Lee, M.J.; Hsu, H.J.; Wu, I.W.; Sun, C.Y.; Ting, M.K.; Lee, C.C. Vitamin D deficiency in northern Taiwan: A community-based cohort study. BMC Public Health 2019, 19, 337. [Google Scholar] [CrossRef]
  40. Sales, M.C.; de Oliveira, L.P.; de Araújo Cabral, N.L.; de Sousa, S.E.S.; das Graças Almeida, M.; Lemos, T.; de Oliveira Lyra, C.; de Lima, K.C.; Sena-Evangelista, K.C.M.; de Fatima Campos Pedrosa, L. Plasma zinc in institutionalized elderly individuals: Relation with immune and cardiometabolic biomarkers. J. Trace Elem. Med. Biol. Organ Soc. Miner. Trace Elem. (GMS) 2018, 50, 615–621. [Google Scholar] [CrossRef]
  41. Brown, K.H.; Rivera, J.A.; Bhutta, Z.; Gibson, R.S.; King, J.C.; Lönnerdal, B.; Ruel, M.T.; Sandtröm, B.; Wasantwisut, E.; Hotz, C. International Zinc Nutrition Consultative Group (IZiNCG) technical document #1. Assessment of the risk of zinc deficiency in populations and options for its control. Food Nutr. Bull. 2004, 25, S99–S203. [Google Scholar]
  42. Kyle, U.G.; Genton, L.; Hans, D.; Pichard, C. Validation of a bioelectrical impedance analysis equation to predict appendicular skeletal muscle mass (ASMM). Clin. Nutr. 2003, 22, 537–543. [Google Scholar] [CrossRef]
  43. Gallagher, D.; Visser, M.; De Meersman, R.E.; Sepúlveda, D.; Baumgartner, R.N.; Pierson, R.N.; Harris, T.; Heymsfield, S.B. Appendicular skeletal muscle mass: Effects of age, gender, and ethnicity. J. Appl. Physiol. 1997, 83, 229–239. [Google Scholar] [CrossRef] [PubMed]
  44. Wen, X.; Wang, M.; Jiang, C.M.; Zhang, Y.M. Anthropometric equation for estimation of appendicular skeletal muscle mass in Chinese adults. Asia Pac. J. Clin. Nutr. 2011, 20, 551–556. [Google Scholar] [PubMed]
  45. Kuriyan, R. Body composition techniques. Indian J. Med. Res. 2018, 148, 648–658. [Google Scholar] [CrossRef] [PubMed]
  46. Chen, L.Y.; Liu, L.K.; Hwang, A.C.; Lin, M.H.; Peng, L.N.; Chen, L.K.; Lan, C.F.; Chang, P.L. Impact of malnutrition on physical, cognitive function and mortality among older men living in veteran homes by minimum data set: A prospective cohort study in Taiwan. J. Nutr. Health Aging 2016, 20, 41–47. [Google Scholar] [CrossRef]
  47. Kung, Y.L.; Cai, M.T.; Liu, C.H. Impact of aboriginal operational capacity on nutrition and melancholy in long term care. J. Health Manag. 2018, 16, 23–42. [Google Scholar]
  48. Adeel, M.; Lai, C.H.; Wu, C.W.; Kang, J.H.; Liou, J.C.; Chen, H.C.; Hong, M.J.; Peng, C.W. Energy expenditure during acute weight training exercises in healthy participants: A preliminary study. Appl. Sci. 2021, 11, 6687. [Google Scholar]
  49. Adeel, M.; Lai, C.H.; Wu, C.W.; Kang, J.H.; Liou, J.C.; Chen, H.C.; Lin, B.S.; Hong, M.J.; Feng, C.T.; Peng, C.W. Modeling of metabolic equivalents (Mets) during moderate resistance training exercises. Appl. Sci. 2021, 11, 8773. [Google Scholar] [CrossRef]
Figure 1. Study flow diagram for nutritional supplement drink or nutritional education on the nutritional status in older individuals at risk of malnutrition. MUST, Malnutrition Universal Screening Tool.
Nutrients 15 04291 g001
Figure 2. Beneficial effects of a nutritional supplement drink (NSD) on the nutritional status of older individuals at high risk of malnutrition. The upward arrow represents an increase or growth, while the downward arrow represents a decrease or decline. NE, nutritional education; MUST, malnutrition universal screening tool; BW, body weight; BMI, body-mass index; ASMI, appendicular skeletal muscle index; SOF, study of osteoporotic fractures; MNA-SF, Mini-Nutritional Assessment Short Form; TGs, triglycerides; SF-36, MOS 36-Item Short Form Health Survey; PF, physical functioning; VT, vitality; MH, role emotional; PCS, physical component score; MCS, mental component score.
Nutrients 15 04291 g002
Table 1. Nutrition Facts of Meiji Mei Balance *.
125 mL per Pack
Energy203 kcal
1.62 kcal/mLVitamin B121.2 μg
Protein7.5 gFolic acid60 mg
Branched-chain amino acids 11580 mgPantothenic acid 1.2 mg
Leucine 720mgBiotin30 μg
Fat 5.6 gVitamin C 100 mg
Saturated fat1.2 gCholine1.5 mg
Trans-fat0 gPotassium (sweet flavor 2)180 mg
Carbohydrates 31.8 g(corn soup flavor)200 mg
Sugar 5.8 gChlorine (sweet flavor 2)120 mg
Dietary fiber2.5 g(corn soup flavor)220 mg
Sodium(sweet flavor 2)130 mgCalcium120 mg
(corn soup flavor)180 mgPhosphorus140 mg
Vitamin A120 μg REMagnesium40 mg
Vitamin D1.2 μgIron1.5 mg
Vitamin E6 mg α-TEZinc2 mg
Vitamin K19 μgManganese0.46 mg
Vitamin B10.3 mgIodine30 μg
Vitamin B20.4 mgSelenium12 μg
Niacin5.4 mg NEMolybdenum10 μg
Vitamin B60.6 mgChromium6 μg
* Mei Balance (Meiji Holdings, Tokyo, Japan). 1 Branched-chain amino acids included valine, leucine, and isoleucine. 2 Sweet flavors included strawberry, banana, yogurt, and coffee.
Table 2. Baseline demographic information, anthropometric assessment results, and dietary intake levels of study participants.
NSD
(N = 57)
NE
(N = 50)
p-Value
Age (years)80.67 ± 9.0375.86 ± 8.210.007
  <75, n (%)38 (66.7)24 (48.0)0.051
  ≥75, n (%)19 (33.3)26 (52.0)
Sex
  Male n, (%)46 (80.7)32 (64.0)0.052
  Female n, (%)11 (19.3)18 (36.0)
Height (cm)162.04 ± 7.61162.47 ± 9.390.793
BW (kg)53.73 ± 8.3162.91 ± 13.57<0.001
BMI (kg/m2)20.47 ± 3.0323.74 ± 4.30<0.001
Body fat (%)25.97 ± 5.9227.03 ± 5.080.326
ASMI (kg/m2)5.38 ± 0.956.38 ± 1.38<0.001
  Normal, n (%)5 (8.8)24 (48.0)<0.001
  Low, n (%)52 (91.2)26 (52.0)
Calf circumference (cm)31.98 ± 3.4032.95 ± 4.050.177
  Normal, n (%)20 (35.1)25 (50.0)0.169
  Low, n (%)37 (64.9)25 (50.0)
SBP (mmHg)133 ± 17132 ± 170.871
DBP (mmHg)78 ± 1177 ± 100.609
MUST
  1, n (%)37 (64.9)41 (82.0)0.007
  2, n (%)19 (17.8)9 (18.0)
  3, n (%)10 (9.3)0 (0.0)
MNA-SF9.07 ± 1.8310.66 ± 1.92<0.001
  Normal 12–14, n (%)7 (12.3)20 (40.0)0.002
  Low 0–11, n (%)50 (87.7)30 (60.0)
Total energy intake (kcal)1213.86 ± 69.531219.00 ± 67.680.315
SOF0.98 ± 0.640.50 ± 0.61<0.001
  Normal, n (%)12 (21.1)28 (56.0)<0.001
  pre-frailty & frailty, n (%)45 (78.9)22 (44.0)
Grip strength (kg)21.66 ± 6.1421.64 ± 8.090.991
  Normal, n (%)13 (22.8)16 (32.0)0.384
  Low, n (%)44 (77.2)34 (68.0)
Walking speed (m/s)0.73 ± 0.300.83 ± 0.200.089
  Normal, n (%)13 (21.1)8 (16.0)0.467
  Slow, n (%)44 (77.2)42 (84.0)
Hypertension, n (%)47 (82.0)41 (82.0)1.000
Hypercholesterolemia, n (%)6 (10.5)12 (24.0)0.074
Hyperglyceridemia, n (%)7 (12.3)8 (16.0)0.591
Data are expressed as the mean ± standard deviation. The Shapiro-Wilk test was used to determine the normality of the population. Data were compared by a t-test or Mann-Whitney U test. Frequencies between groups were compared by Fisher’s exact test or a Chi-squared test. Normal ASMI in males ≥ 7.0 kg/m2, females ≥ 5.7 kg/m2; MNA-SF 12–14 was considered as well-nourished; SOF 1 was considered as pre-frailty, ≥2 was considered as frailty; normal grip strength in male ≥ 28 kg, female ≥ 18 kg; normal walking speed ≥ 1.0m/s; calf circumference > 34 cm in male > 33 cm in female was considered normal; hypertension is defined as SBP > 120 mmHg, DBP > 80 mmHg; hypercholesterolemia is defined as blood total cholesterol level > 200 mg/dL; hyperglyceridemia is defined as blood triglyceride level > 150 mg/dL. NSD, nutritional supplement drink; NE, nutritional education; BW, body weight; BMI, body-mass index; ASMI, appendicular skeletal muscle index; SBP, systolic blood pressure; DBP, diastolic blood pressure.
Table 3. Effects of a nutritional supplement drink (NSD) on the body composition, physical performance, nutritional status, and nutrition intake in older nursing home residents at risk of malnutrition.
NSD (N = 57)NE (N = 50)
p-Valuep-Value
BaselineEndBaseline × EndBaselineEndBaseline × End
Body composition
BW (kg)53.73 ± 8.3154.94 ± 8.50<0.00162.91 ± 13.5762.73 ± 12.670.574
BMI (kg/m2)20.47 ± 3.0320.97 ± 3.03<0.00123.74 ± 4.3023.67 ± 3.980.603
Body fat (%)25.97 ± 5.9226.58 ± 6.130.27327.03 ± 5.0827.43 ± 4.160.356
Muscle mass (%)26.31 ± 3.0326.15 ± 3.130.49926.81 ± 2.8126.49 ± 2.920.313
ASMI (kg/m2)5.38 ± 0.955.46 ± 0.970.1896.38 ± 1.386.30 ± 1.330.263
Calf circumference (cm)31.98 ± 3.4032.14 ± 3.010.84232.95 ± 4.0532.57 ± 3.910.065
Physical performance
SOF0.98 ± 0.640.23 ± 0.42<0.0010.50 ± 0.610.56 ± 0.580.180
Grip strength (kg)21.66 ± 6.1421.97 ± 6.210.48121.64 ± 8.0921.88 ± 7.740.621
6-m walking speed (s)10.02 ± 5.048.56 ± 4.790.0017.71 ± 2.128.16 ± 2.890.111
Walking speed (m/s)0.73 ± 0.300.89 ± 0.38<0.0010.83 ± 0.200.83 ± 0.320.363
Blood pressure
SBP (mmHg)133 ± 17133 ± 150.857132 ± 17131 ± 140.251
DBP (mmHg)78 ± 1176 ± 80.07977 ± 1076 ± 90.574
Nutritional status
MUST
  0, n (%)0 (0.0)34 (59.6)<0.0010 (0.0)2 (3.8)0.355
  1, n (%)37 (64.9)12 (21.1) 41 (78.8)40 (76.9)
  2, n (%)10 (17.5)9 (15.8) 9 (17.3)8 (15.4)
  3, n (%)10 (17.5)2 (3.5) 0 (0.0)0 (0.0)
MNA-SF9.07 ± 1.8312.04 ± 1.31<0.00110.66 ± 1.9210.58 ± 1.930.773
Total energy intake (kcal)1213.9 ± 69.531611.8 ± 71.21<0.0011219.0 ± 67.681223.0 ± 59.080.417
Data are expressed as the mean ± standard deviation. The Shapiro-Wilk test was used to determine the normality of the population, and data were compared by a t-test, Mann-Whitney U test, paired t-test, Wilcoxon signed-rank test, or Chi-squared test. NE, nutritional education; BW, body weight; BMI, body-mass index; ASMI, appendicular skeletal muscle index; SOF, the study of osteoporotic fractures; MUST, malnutrition universal screening tool; MNA-SF, Mini-Nutritional Assessment Short Form.
Table 4. Changes in anthropometric data and the nutritional status after 12 weeks of the intervention.
NSD (N = 57)NE (N = 50)NSD × NE
Week12-BaselineWeek12-Baselinep-Value
Body composition
BW (kg)1.21 ± 1.83−0.17 ± 2.17<0.001
BMI (kg/m2)0.5 ± 0.78−0.07 ± 0.88<0.001
Body fat (%)0.62 ± 4.210.40 ± 3.060.783
Muscle mass (%)−0.16 ± 1.83−0.33 ± 2.260.685
ASMI (kg/m2)0.09 ± 0.48−0.08 ± 0.540.016
Calf circumference (cm)0.17 ± 2.77−0.39 ± 1.460.191
Physical performance
SOF−0.75 ± 0.690.06 ± 0.31<0.001
Grip strength (kg)0.31 ± 3.340.19 ± 2.020.428
6-m walking speed (s)−1.47 ± 3.230.45 ± 2.120.001
Walking speed (m/s)0.15 ± 0.240.00 ± 0.290.004
Nutritional status
Total energy intake (kcal)397.92 ± 29.904.00 ± 31.68<0.001
MNA-SF2.96 ± 1.86−0.08 ± 1.28<0.001
Data were calculated by the value of week 12—the baseline and are expressed as the mean ± standard deviation. The Shapiro-Wilk test was used to determine the normality of the population. Data were compared by a t-test or Mann-Whitney U test. NSD, nutritional supplement drink; NE, nutritional education; BW, body weight; BMI, body mass index; ASMI, appendicular skeletal muscle index; SOF, study of osteoporotic fractures; MUST, malnutrition universal screening tool; MNA-SF, Mini-Nutritional Assessment Short Form.
Table 5. Effects of nutritional supplement drink (NSD) on the plasma vitamin (Vit.) D and zinc status in older nursing home residents at risk of malnutrition.
NSDNENSD × NE
p-Valuep-Valuep-Value
BaselineEndBaseline × EndBaselineEndBaseline × EndBaselineEnd
25-OH Vit. D (ng/mL)
  Deficiency (≤20 ng/mL), n (%)24 (42.1)23 (40.4)0.92321 (42.0)21 (42.0)0.9560.3480.355
  Insufficiency (21~29.9 ng/mL), n (%)18 (31.6)20 (35.1)21 (42.0)22(44.0)
  Sufficiency (≥30 ng/mL), n (%)15 (26.3)14 (24.6)8 (16.0)7 (14.0)
Zinc (μg/L)
  Deficiency (<700 μg/L), n (%)28 (49.1)23 (40.4)0.45112 (24.0)23 (46.0)0.0350.0090.565
  Sufficiency (≥700 μg/L), n (%)29 (50.9)34 (59.6)38 (76.0)27 (54.0)
Data are expressed as numbers and percentages. Frequencies between groups were compared by Fisher’s exact test or a Chi-squared test. NE, nutritional education. 25-OH Vit.D, 25-Hydroxyvitamin D.
Table 6. Effects of a nutritional supplement drink on the body composition, physical performance, nutritional status, and nutrition intake of older nursing home residents at risk of malnutrition by multiple linear regression.
12th Weekβp-ValueR2
Body composition
BW (kg)0.0410.0300.971
BMI (kg/m2)0.0480.0400.956
Body fat (%)0.0670.5110.135
Muscle mass (%)0.0080.9380.191
ASMI (kg/m2)0.0200.7220.726
Calf circumference (cm)0.2530.0020.476
Physical performance
SOF−0.3260.0020.080
Grip strength (kg)0.1600.0900.258
Walking speed (m/s)0.0940.0260.094
Blood pressure
SBP (mmHg)0.0340.7550.003
DBP (mmHg)−0.0790.472−0.003
Nutritional status
MNA-SF0.705<0.0010.512
Data were analyzed by multiple linear regression and were adjusted for age, baseline BW, and baseline BMI. BW, body weight; BMI, body mass index; ASMI, appendicular skeletal muscle index; SOF, study of osteoporotic fractures; SBP, systolic blood pressure; DBP, diastolic blood pressure; MNA-SF, Mini-Nutritional Assessment Short Form.
Table 7. Effects of a nutritional supplement drink on biochemical parameters in older nursing home residents at risk of malnutrition by multiple linear regression.
12th Weekβp-ValueR2
Blood sugar (AC) (mg/dL)0.1810.0930.043
Lipid profile
Cholesterol (mg/dL)0.0410.6980.055
Triglycerides (mg/dL)0.0340.7410.104
Kidney function
Uric acid (mg/dL)−0.0480.6530.027
Creatinine (mg/dL)−0.1570.154−0.014
Liver function
AST (U/L)0.0560.615−0.024
ALT (U/L)0.1750.1030.039
Nutritional status
Albumin (g/dL)0.2470.0140.178
Vitamin (Vit.) D status
Total 25-OH Vit. D (ng/mL)0.1590.1400.035
Zinc status
Zinc (μg/L)0.1650.1650.016
Hematology
RBCs (106/μL)0.0970.3210.199
WBCs (103/μL)0.1480.180−0.011
Hemoglobin (g/dL)0.1660.0870.222
Hematocrit (%)0.1360.1590.222
Platelets (103/μL)0.0840.4340.041
MCH (pg)0.0980.376−0.027
MCHC (g/dL)0.1860.0870.020
MCV (fL)−0.0250.698−0.025
Neutrophil Seg. (%)0.0720.517−0.022
Lymphocytes (%)−0.0230.836−0.006
Monocytes (%)−0.0110.955−0.011
Eosinophils (%)−0.2500.0220.030
Basophils (%)0.0020.985−0.014
RDW-CV (%)−0.0060.9570.015
Data were analyzed by a multiple linear regression and were adjusted for age, baseline body weight, and baseline body-mass index. ALT, alanine aminotransferase; AST, aspartate aminotransferase; MCH, mean corpuscular hemoglobin; MCHC, mean corpuscular hemoglobin concentration; MCV, mean corpuscular volume; RBCs, red blood cells; TC, total cholesterol; TIBC, total iron-binding capacity; WBCs, white blood cells; RDW-CV: red blood cell distribution width.
Table 8. Crude and adjusted odd ratios (ORs) (95% confidence intervals (CIs)) of variables related to oral nutritional supplement drink administration in older nursing home residents at risk of malnutrition in the 12th week.
CrudeModel 1Model 2Model 3
AdjustedAdjustedAdjusted
OR95% CIOR95% CIOR95% CIOR95% CI
Total 25-OH Vitamin D (ng/mL)
  Sufficiency (≥30 ng/mL)1 1 1 1
  Insufficiency (20.1~29.9 ng/mL)0.455(0.153, 1.353)0.416(0.132, 1.315)0.374(0.108, 1.299)0.316(0.085, 1.174)
  Deficiency (≤20 ng/mL)0.548(0.185, 1.618)0.446(0.141, 1.409)0.373(0.108, 1.284)0.369(0.101, 1.346)
Zinc (μg/L)
  Sufficiency (≥700 μg/L)1 1 1 1
  Deficiency (<700 μg/L)0.794(0.369, 1.711)0.587(0.248, 1.391)0.429(0.165, 1.117)0.356(0.128, 0.990)
SOF
  Score = 01 1 1 1
  Score ≥ 10.273(0.119, 0.626)0.301(0.126, 0.721)0.299(0.086, 0.612)0.192(0.067, 0.551)
MNA-SF
  Score 12~141 1 1 1
  Score 6~110.381(0.174, 0.833)0.301(0.126, 0.721)0.076(0.020, 0.282)0.058(0.014, 0.250)
Calf circumference (cm)
  Normal 1 1 1 1
  Low calf circumference1.704(0.779, 3.727)2.213(0.906, 5.407)0.991(0.332, 2.957)0.793(0.248, 2.538)
Walking speed (m/s)
≥1.0 m/s1 1 1 1
<1.0 m/s0.262(0.104, 0.658)0.214(0.078, 0.591)0.089(0.022, 0.360)0.104(0.026, 0.426)
Hemoglobin (g/dL)
  Normal range1 1 1 1
  Below normal range1.093(0.473, 2.528)0.936(0.358, 2.447)0.616(0.217, 1.744)0.739(0.250, 2.185)
ASMI (kg/m2)
  Normal 1 1 1 1
  Low ASMI7.846(2.853, 21.577)6.783(2.416, 19.040)3.703(1.067, 12.857)1.954(0.445, 8.581)
Grip strength (kg)
  Normal 1 1 1 1
  Low grip strength1.194(0.504, 2.831)0.905(0.358, 2.287)0.876(0.319, 2.406)0.727(0.249, 2.117)
Data were analyzed by a logistic regression. Model 1 was adjusted for age and sex, model 2 was adjusted for age, sex, and baseline body-mass index (BMI), and model 3 was adjusted for age, sex, baseline BMI, and baseline appendicular skeletal muscle index (ASMI). SOF, the study of osteoporotic fractures; MNA-SF, Mini-Nutritional Assessment Short Form. Normal range of calf circumference, Males > 34 cm, Females > 33 cm; normal range of hemoglobin, Males 12.3~18.3 g/dL, Females 11.3~15.3 g/dL; normal range of ASMI, Males ≥ 7.0 (kg/m2), Females ≥ 5.7 (kg/m2) [21]; normal range of grip strength, Males ≥ 28 kg, Females ≥ 18 kg.
Disclaimer/Publisher’s Note: The statements, opinions and data contained in all publications are solely those of the individual author(s) and contributor(s) and not of MDPI and/or the editor(s). MDPI and/or the editor(s) disclaim responsibility for any injury to people or property resulting from any ideas, methods, instructions or products referred to in the content.

