

Associations between Fatty Acid Intakes and Plasma Phospholipid Fatty Acid Concentrations in the European Prospective Investigation into Cancer and Nutrition

 , , , ,
  , , , ,
Abstract
1. Introduction
2. Materials and Methods
2.1. Study Design and Population
2.2. Assessment of Dietary Intake and Other Predictor Variables
2.3. Nested Case-Control Studies with Plasma Phospholipid Fatty Acids
2.4. Measurements of Plasma Phospholipid Fatty Acids
2.5. Individual Fatty Acids Analyzed
2.6. Statistical Analysis
3. Results
4. Discussion
Strengths and Limitations
5. Conclusions
Author Contributions
Funding
Institutional Review Board Statement
Informed Consent Statement
Data Availability Statement
Conflicts of Interest
Abbreviations
| AA | Arachidonic acid |
| ALA | alpha-linolenic acid |
| BHT | butylated hydroxytoluene |
| DHA | docosahexaenoic acid |
| DPA | docosapentaenoic acid |
| EPA | eicopentaenoic acid |
| EPIC | European Prospective Investigation into Cancer and Nutrition |
| FAs | Fatty acids |
| FAMEs | Fatty acid methyl esters |
| FFQs | frequency questionnaires |
| LA | Linoleic acid |
| MUFAs | Monounsaturated fatty acids |
| PUFAs | Polyunsaturated fatty acids |
| SFA | Saturated fatty acid |
| tFA | Trans fatty acid |
Appendix A

| Groups | For Diet or Plasma | Used Isomers and Syntaxes |
|---|---|---|
| SFA | diet/plasma | myristic acid (14:0) + pentadecanoic acid (15:0) + palmitic acid (16:0) + heptadecanoic acid (17:0) + stearic acid (18:0) + arachidic acid (20:0) + behenic acid (22:0) + lignoceric acid (24:0) |
| MUFA | diet/plasma | myristoleic acid (14:1n5) + pentadecenoic acid (15:1) + palmitoleic acid (16:1n-7) + heptadecenoic acid (17:1) + oleic acid (18:1n-9) + gadoleic acid (20:1n-11) + erucic acid (22:1n-9) + nervonic acid (24:1n-9) |
| Total cis n-3 PUFA | diet/plasma | ALA (18:3n-3ccc) + EPA (20:5n-3) + eicosatrienoic acid ETE (20:3n-3) + docosapentaenoic acid DPA (22:5n-3) + DHA (22:6n-3) |
| Total long-chain n-3 PUFA | diet/plasma | EPA (20:5n-3) + eicosatrienoic acid ETE (20:3n-3) + docosapentaenoic acid DPA (22:5n-3) + DHA (22:6n-3) |
| Total cis n-6 PUFA | diet | LA (18:2n-6) + gamma-linolenic acid (18:3n-6) + eicosadienoic acid (20:2n6) + di-homo-gamma-linolenic acid (20:3n-6) + arachidonic acid (20:4n-6) + docosatetraenoic acid DTA (22:4n-6) |
| plasma | LA (18:2n-6) + gamma-linolenic acid (18:3n-6) + eicosadienoic acid (20:2n6) + di-homo-gamma-linolenic acid (20:3n-6) + arachidonic acid (20:4n-6) + docosatetraenoic acid DTA (22:4n-6) + docosapentaenoic acid, DPA (22:5n6) | |
| Total long-chain n-6 PUFA | diet | eicosadienoic acid (20:2n-6) + arachidonic acid (20:4n-6) + docosatetraenoic acid DTA (22:4n-6) |
| plasma | linolenic acid (20:3n-6) + eicosadienoic acid (20:2n-6) + docosatetraenoic acid DTA (22:4n-6) + docosapentaenoic acid, DPA (22:5n-6) | |
| Total PUFA | diet/Plasma | Total cis n-3 PUFA + Total cis n-6 PUFA |
| Total trans industrial fatty acids C16-18 | diet | Palmitelaidic acid (16:1t) + Elaidic acid (18:1t) + octadecadienoic trans (18:2tt) + trans 18:2t |
| plasma | Palmitelaidic (16:1n-7/9) + Elaidic acid (18:1n 9t) + (Trans Pufa 3 = (18:3n 3ctt + 18:3n 3tcc)) + (Trans Pufa 6 = (18:2n 6tc + 18:2n 6tt)) | |
| Total trans industrial fatty acids C18 | diet | Elaidic acid (18:1t) + octadecadienoic trans (18:2tt) + trans 18:2t |
| plasma | Elaidic acid (18:1n 9t) + (Trans Pufa 3 = (18:3n 3ctt + 18:3n 3tcc)) + (Trans Pufa 6 = (18:2n 6tc + 18:2n 6tt)) | |
| Total trans ruminant fatty acids | diet | Palmitelaidic acid (16:1t) + Conjugated linoleic acid (18:2 CLA) + Vaccenic acid (18:1n-7) |
| plasma | Palmitelaidic acid (16:1t) + Vaccenic acid (18:1n-7) + conjugated linoleic acid (10t 12c) + conjugated linoleic acid (9t 11c) | |
| Total trans C16-18 | diet/Plasma | Trans industrial C18-16 + Trans ruminant |
| Total trans C18 | diet/Plasma | Trans industrial C18 + Trans ruminant |
| Ratio n-6 PUFA/n-3 PUFA | diet | PUFA 6/PUFA 3 |
| Ratio long-chain n-6 PUFA/n-3 PUFA | Diet/Plasma | PUFA 6 long chain/PUFA 3 long chain |
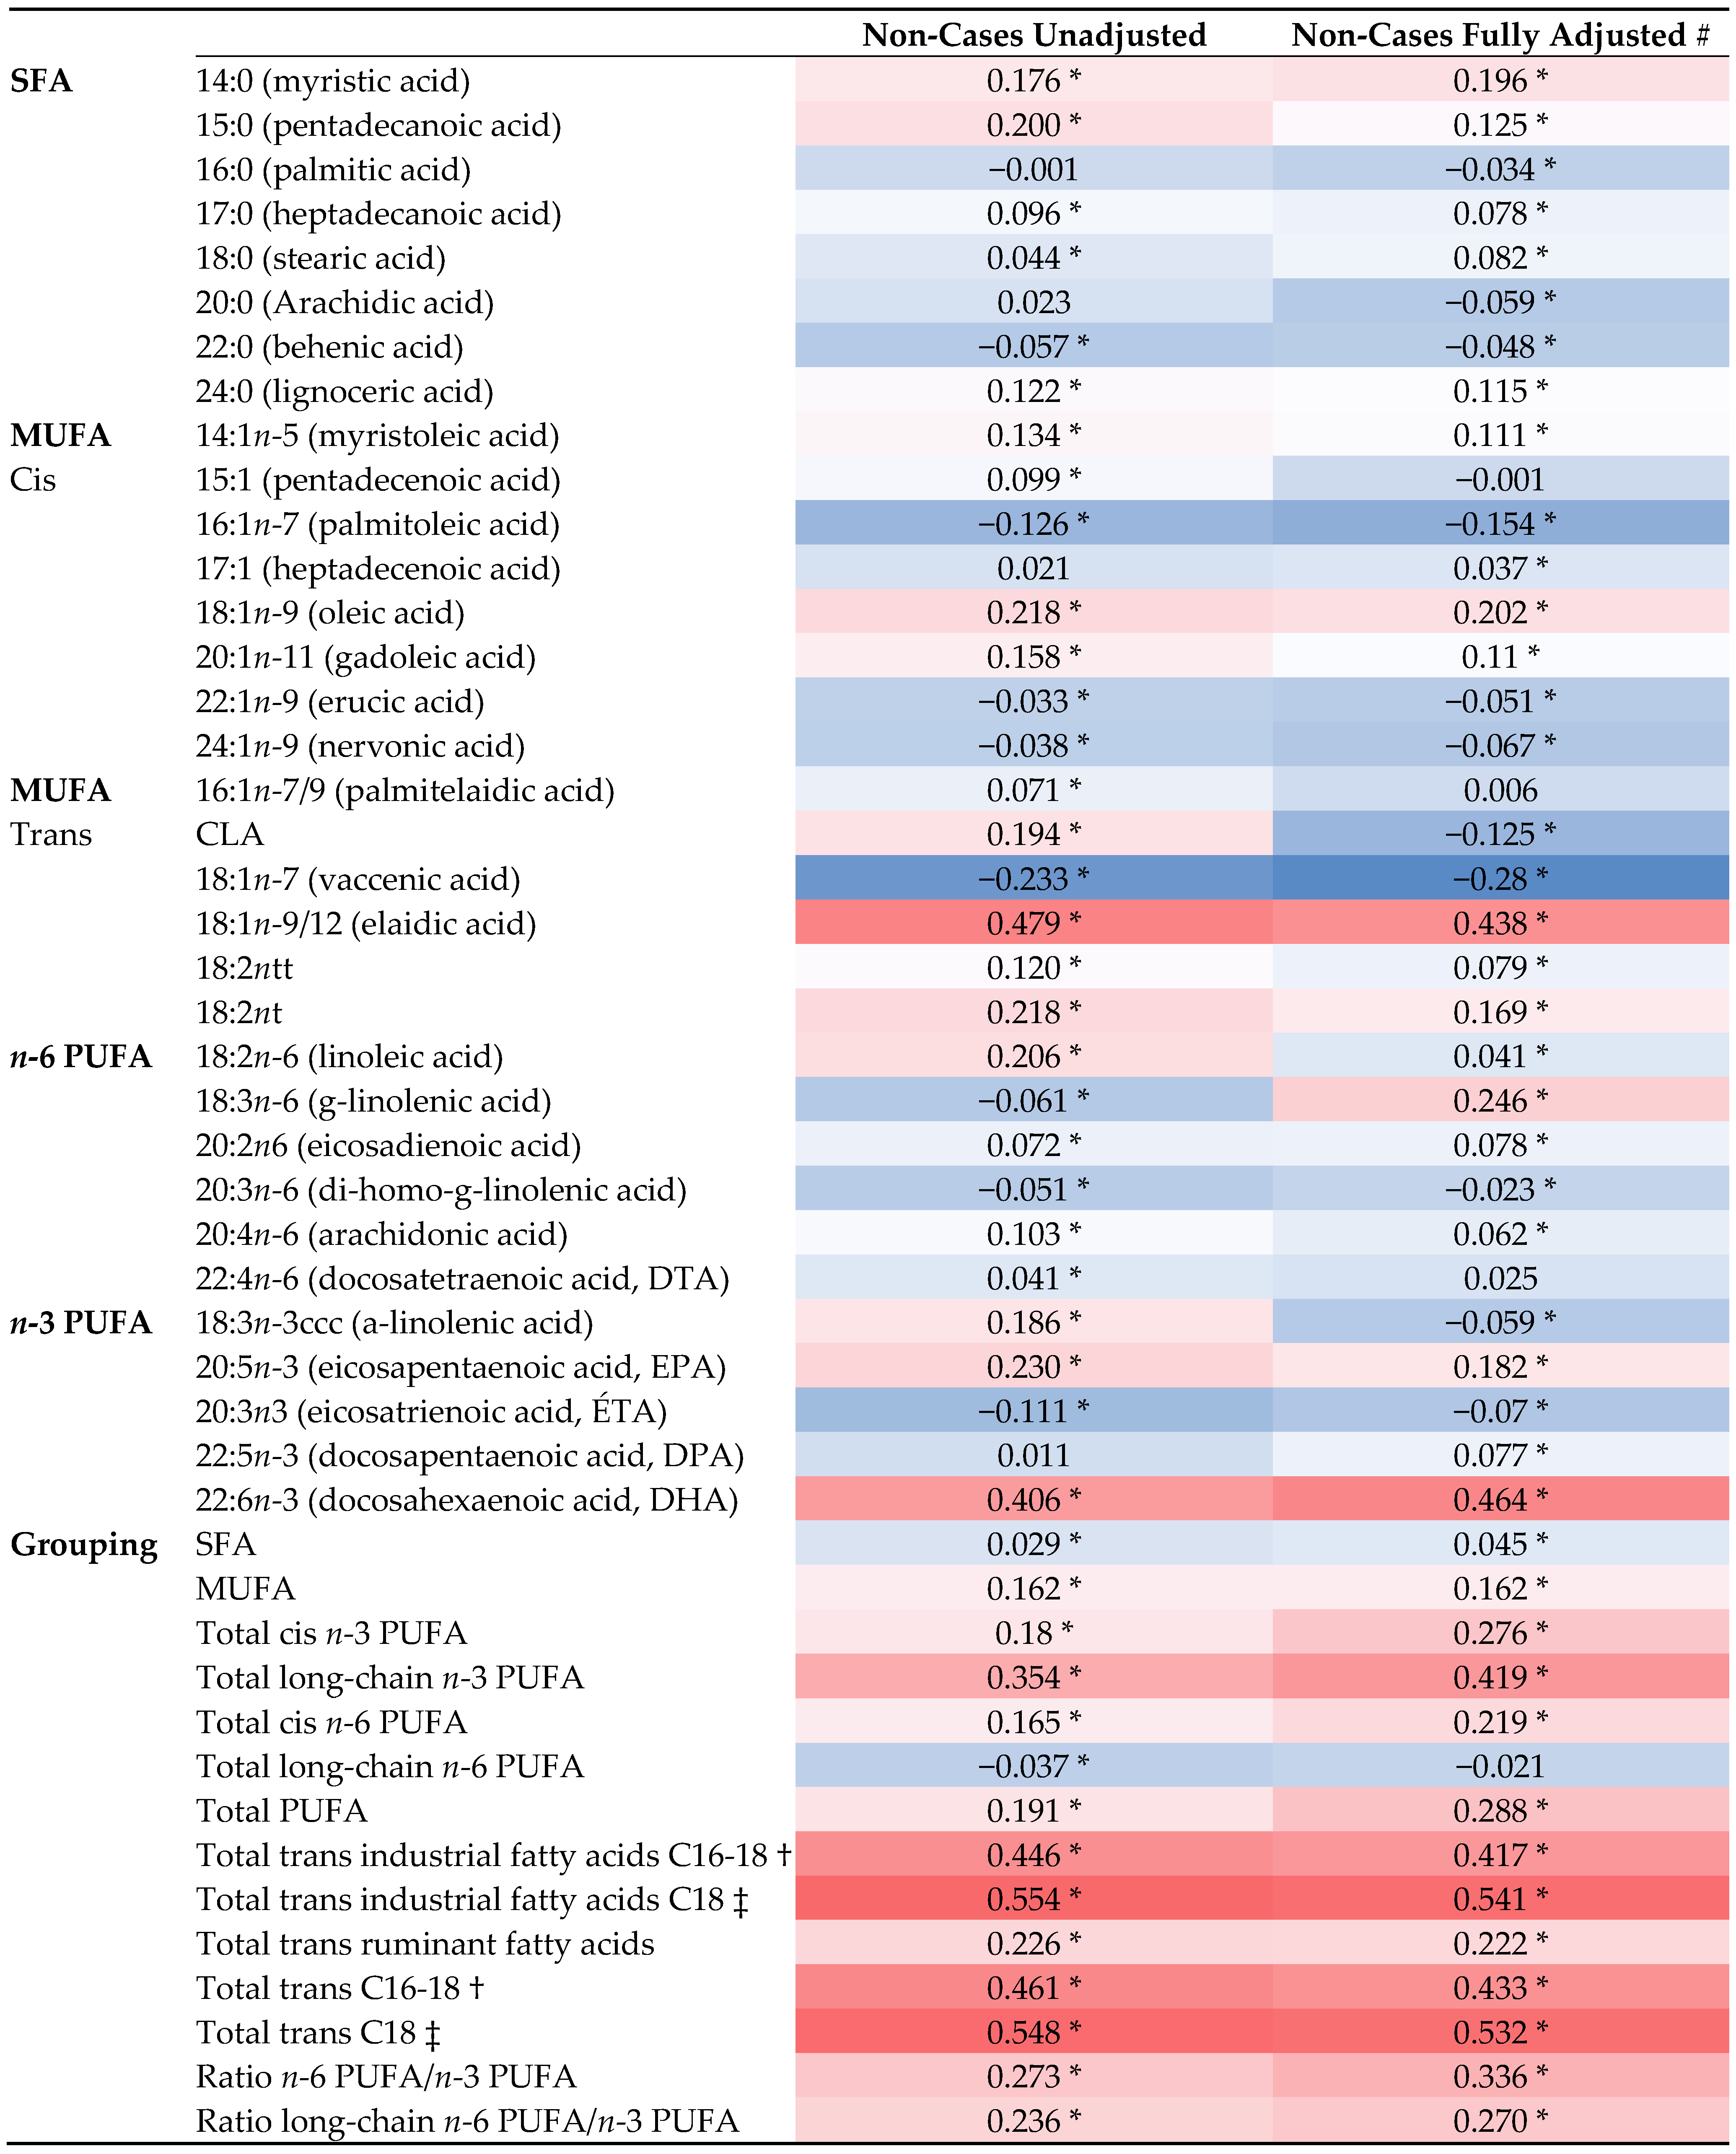
| Spearman Correlation | Partial Correlation # | Partial Correlation * | ||||
|---|---|---|---|---|---|---|
| Non-Cases (n = 4923) | Non-Cases (n = 4923) | Non-Cases (n = 4923) | ||||
| r | p | r | p | r | p | |
| SFA | ||||||
| 14:0 (myristic acid) | 0.176 | <0.001 | 0.196 | <0.001 | 0.173 | <0.001 |
| 15:0 (pentadecanoic acid) | 0.200 | <0.001 | 0.125 | <0.001 | 0.111 | <0.001 |
| 16:0 (palmitic acid) | −0.001 | 0.922 | −0.034 | 0.019 | −0.050 | 0.001 |
| 17:0 (heptadecanoic acid) | 0.096 | <0.001 | 0.078 | <0.001 | 0.087 | <0.001 |
| 18:0 (stearic acid) | 0.044 | 0.002 | 0.082 | <0.001 | 0.046 | 0.002 |
| 20:0 (Arachidic acid) | 0.023 | 0.112 | −0.059 | <0.001 | 0.000 | 0.976 |
| 22:0 (behenic acid) | −0.057 | <0.001 | −0.048 | 0.001 | −0.002 | 0.904 |
| 24:0 (lignoceric acid) | 0.122 | <0.001 | 0.115 | <0.001 | 0.012 | 0.418 |
| MUFA | ||||||
| Cis | ||||||
| 14:1n-5 (myristoleic acid) | 0.134 | <0.001 | 0.111 | <0.001 | 0.051 | 0.001 |
| 15:1 (pentadecenoic acid) | 0.099 | <0.001 | −0.001 | 0.973 | 0.007 | 0.623 |
| 16:1n-7 (palmitoleic acid) | −0.126 | <0.001 | −0.154 | <0.001 | −0.016 | 0.279 |
| 17:1 (heptadecenoic acid) | 0.021 | 0.149 | 0.037 | <0.012 | −0.012 | 0.416 |
| 18:1n-9 (oleic acid) | 0.218 | <0.001 | 0.202 | <0.001 | 0.088 | <0.001 |
| 20:1n-11 (gadoleic acid) | 0.158 | <0.001 | 0.110 | <0.001 | 0.077 | <0.001 |
| 22:1n-9 (erucic acid) | −0.033 | 0.021 | −0.051 | 0.001 | 0.018 | 0.222 |
| 24:1n-9 (nervonic acid) | −0.038 | 0.008 | −0.067 | <0.001 | −0.031 | 0.036 |
| Trans | ||||||
| 16:1n-7/9 (palmitelaidic acid) | 0.071 | <0.001 | 0.006 | 0.699 | −0.005 | 0.722 |
| CLA | 0.194 | <0.001 | −0.125 | <0.001 | 0.013 | 0.379 |
| 18:1n-7 (vaccenic acid) | −0.233 | <0.001 | −0.280 | <0.001 | 0.019 | 0.19 |
| 18:1n-9/12 (elaidic acid) | 0.479 | <0.001 | 0.438 | <0.001 | 0.181 | <0.001 |
| 18:2ntt | 0.120 | <0.001 | 0.079 | <0.001 | −0.035 | 0.016 |
| 18:2nt | 0.218 | <0.001 | 0.169 | <0.001 | 0.018 | 0.212 |
| n-6 PUFA | ||||||
| 18:2n-6 (linoleic acid) | 0.206 | <0.001 | 0.041 | 0.005 | 0.037 | 0.011 |
| 18:3n-6 (g-linolenic acid) | −0.061 | <0.001 | 0.246 | <0.001 | −0.026 | 0.08 |
| 20:2n-6 (eicosadienoic acid) | 0.072 | <0.001 | 0.078 | <0.001 | 0.044 | 0.003 |
| 20:3n-6 (di-homo-g-linolenic acid) | −0.051 | 0.000 | −0.023 | 0.043 | −0.006 | 0.701 |
| 20:4n-6 (arachidonic acid) | 0.103 | <0.001 | 0.062 | <0.001 | 0.057 | <0.001 |
| 22:4n-6 (docosatetraenoic acid, DTA) | 0.041 | 0.004 | 0.025 | 0.086 | 0.009 | 0.558 |
| n-3 PUFA | ||||||
| 18:3n-3ccc (a-linolenic acid) | 0.186 | <0.001 | −0.059 | <0.001 | −0.041 | 0.006 |
| 20:5n-3 (eicosapentaenoic acid, EPA) | 0.230 | <0.001 | 0.182 | <0.001 | 0.190 | <0.001 |
| 20:3n3 (eicosatrienoic acid, ÉTA) | −0.111 | <0.001 | −0.070 | <0.001 | 0.006 | 0.698 |
| 22:5n-3 (docosapentaenoic acid, DPA) | 0.011 | 0.432 | 0.077 | <0.001 | 0.055 | <0.001 |
| 22:6n-3 (docosahexaenoic acid, DHA) | 0.406 | <0.001 | 0.464 | <0.001 | 0.413 | <0.001 |
| Grouping | ||||||
| SFA | 0.029 | 0.044 | 0.045 | 0.002 | 0.003 | 0.858 |
| MUFA | 0.162 | <0.001 | 0.162 | <0.001 | 0.090 | <0.001 |
| Total cis n-3 PUFA | 0.180 | <0.001 | 0.276 | <0.001 | 0.146 | <0.001 |
| Total long-chain n-3 PUFA | 0.354 | <0.001 | 0.419 | <0.001 | 0.387 | <0.001 |
| Total cis n-6 PUFA | 0.165 | <0.001 | 0.219 | <0.001 | 0.265 | <0.001 |
| Total long-chain n-6 PUFA | −0.037 | 0.009 | −0.021 | 0.159 | 0.080 | <0.001 |
| Total PUFA | 0.191 | <0.001 | 0.288 | <0.001 | 0.288 | <0.001 |
| Total trans industrial fatty acids C16-18 † | 0.446 | <0.001 | 0.417 | <0.001 | 0.130 | <0.001 |
| Total trans industrial fatty acids C18 ‡ | 0.554 | <0.001 | 0.541 | <0.001 | 0.200 | <0.001 |
| Total trans ruminant fatty acids | 0.226 | <0.001 | 0.222 | <0.001 | 0.084 | <0.001 |
| Total trans C16-18 † | 0.461 | <0.001 | 0.433 | <0.001 | 0.101 | <0.001 |
| Total trans C18 ‡ | 0.548 | <0.001 | 0.532 | <0.001 | 0.089 | <0.001 |
| Ratio n-6 PUFA/n-3 PUFA | 0.273 | <0.001 | 0.336 | <0.001 | 0.250 | <0.001 |
| Ratio long-chain n-6 PUFA/n-3 PUFA | 0.236 | <0.001 | 0.270 | <0.001 | 0.360 | <0.001 |
References
- Kumar, N.G.; Contaifer, D.; Madurantakam, P.; Carbone, S.; Price, E.T.; Van Tassell, B.; Brophy, D.F.; Wijesinghe, D.S. Dietary Bioactive Fatty Acids as Modulators of Immune Function: Implications on Human Health. Nutrients 2019, 11, 2974. [Google Scholar] [CrossRef]
- Tvrzicka, E.; Kremmyda, L.-S.; Stankova, B.; Zak, A. Fatty acids as biocompounds: Their role in human metabolism, health and disease—A review. part 1: Classification, dietary sources and biological functions. Biomed. Pap. Med. Fac. Palacky Univ. Olomouc 2011, 155, 117–130. [Google Scholar] [CrossRef]
- Figlewicz, D.P.; Witkamp, R.F. Fatty acids as cell signals in ingestive behaviors. Physiol. Behav. 2020, 223, 112985. [Google Scholar] [CrossRef] [PubMed]
- Galli, C.; Calder, P.C. Effects of Fat and Fatty Acid Intake on Inflammatory and Immune Responses: A Critical Review. Ann. Nutr. Metab. 2009, 55, 123–139. [Google Scholar] [CrossRef] [PubMed]
- Demirkan, A.; van Duijn, C.M.; Ugocsai, P.; Isaacs, A.; Pramstaller, P.P.; Liebisch, G.; Wilson, J.F.; Johansson, Å.; Rudan, I.; Aulchenko, Y.S.; et al. Genome-Wide Association Study Identifies Novel Loci Associated with Circulating Phospho- and Sphingolipid Concentrations. PLOS Genet. 2012, 8, e1002490. [Google Scholar] [CrossRef]
- Schaeffer, L.; Gohlke, H.; Müller, M.; Heid, I.M.; Palmer, L.J.; Kompauer, I.; Demmelmair, H.; Illig, T.; Koletzko, B.; Heinrich, J. Common genetic variants of the FADS1 FADS2 gene cluster and their reconstructed haplotypes are associated with the fatty acid composition in phospholipids. Hum. Mol. Genet. 2006, 15, 1745–1756. [Google Scholar] [CrossRef] [PubMed]
- Calder, P.C. The relationship between the fatty acid composition of immune cells and their function. Prostaglandins Leukot. Essent. Fat. Acids 2008, 79, 101–108. [Google Scholar] [CrossRef]
- Calder, P.C. Omega-3 Fatty Acids and Inflammatory Processes. Nutrients 2010, 2, 355–374. [Google Scholar] [CrossRef]
- Calder, P.C. Fatty acids and inflammation: The cutting edge between food and pharma. Eur. J. Pharmacol. 2011, 668 (Suppl. S1), S50–S58. [Google Scholar] [CrossRef]
- Oomen, C.M.; Ocké, M.C.; Feskens, E.J.; van Erp-Baart, M.-A.J.; Kok, F.J.; Kromhout, D. Association between trans fatty acid intake and 10-year risk of coronary heart disease in the Zutphen Elderly Study: A prospective population-based study. Lancet 2001, 357, 746–751. [Google Scholar] [CrossRef]
- Hu, F.B.; Liu, S.; van Dam, R.; Liu, S. Diet and risk of Type II diabetes: The role of types of fat and carbohydrate. Diabetologia 2001, 44, 805–817. [Google Scholar] [CrossRef] [PubMed]
- Dashti, N.; Feng, Q.; Freeman, M.R.; Gandhi, M.; Franklin, F.A. Trans Polyunsaturated Fatty Acids Have More Adverse Effects than Saturated Fatty Acids on the Concentration and Composition of Lipoproteins Secreted by Human Hepatoma HepG2 Cells. J. Nutr. 2002, 132, 2651–2659. [Google Scholar] [CrossRef] [PubMed]
- Kuhnt, K.; Wagner, A.; Kraft, J.; Basu, S.; Jahreis, G. Dietary supplementation with 11trans- and 12trans-18:1 and oxidative stress in humans. Am. J. Clin. Nutr. 2006, 84, 981–988. [Google Scholar] [CrossRef] [PubMed]
- Chavarro, J.E.; Stampfer, M.J.; Campos, H.; Kurth, T.; Willett, W.C.; Ma, J. A Prospective Study ofTrans-Fatty Acid Levels in Blood and Risk of Prostate Cancer. Cancer Epidemiol. Biomark. Prev. 2008, 17, 95–101. [Google Scholar] [CrossRef] [PubMed]
- King, I.B.; Kristal, A.R.; Schaffer, S.; Thornquist, M.; Goodman, G.E. SerumTrans-Fatty Acids Are Associated with Risk of Prostate Cancer in β-Carotene and Retinol Efficacy Trial. Cancer Epidemiol. Biomark. Prev. 2005, 14, 988–992. [Google Scholar] [CrossRef]
- Liu, X.; Schumacher, F.R.; Plummer, S.J.; Jorgenson, E.; Casey, G.; Witte, J.S. trans-Fatty acid intake and increased risk of advanced prostate cancer: Modification by RNASEL R462Q variant. Carcinog. 2007, 28, 1232–1236. [Google Scholar] [CrossRef]
- Thompson, A.K.; Shaw, D.I.; Minihane, A.M.; Williams, C.M. Trans-fatty acids and cancer: The evidence reviewed. Nutr. Res. Rev. 2008, 21, 174–188. [Google Scholar] [CrossRef]
- Rauber, F.; Campagnolo, P.D.B.; Hoffman, D.J.; Vitolo, M.R. Consumption of ultra-processed food products and its effects on children’s lipid profiles: A longitudinal study. Nutr. Metab. Cardiovasc. Dis. 2015, 25, 116–122. [Google Scholar] [CrossRef]
- Stender, S.; Dyerberg, J.; Astrup, A. High Levels of Industrially Produced Trans Fat in Popular Fast Foods. N. Engl. J. Med. 2006, 354, 1650–1652. [Google Scholar] [CrossRef]
- Skeaff, C.M.; Hodson, L.; McKenzie, J.E. Dietary-Induced Changes in Fatty Acid Composition of Human Plasma, Platelet, and Erythrocyte Lipids Follow a Similar Time Course. J. Nutr. 2006, 136, 565–569. [Google Scholar] [CrossRef]
- Wolk, A.; Furuheim, M.; Vessby, B. Fatty Acid Composition of Adipose Tissue and Serum Lipids Are Valid Biological Markers of Dairy Fat Intake in Men. J. Nutr. 2001, 131, 828–833. [Google Scholar] [CrossRef] [PubMed]
- Hodson, L.; Skeaff, C.M.; Fielding, B.A. Fatty acid composition of adipose tissue and blood in humans and its use as a biomarker of dietary intake. Prog. Lipid Res. 2008, 47, 348–380. [Google Scholar] [CrossRef] [PubMed]
- Hodge, A.M.; Simpson, J.A.; Gibson, R.A.; Sinclair, A.J.; Makrides, M.; O’Dea, K.; English, D.R.; Giles, G.G. Plasma phospholipid fatty acid composition as a biomarker of habitual dietary fat intake in an ethnically diverse cohort. Nutr. Metab. Cardiovasc. Dis. 2007, 17, 415–426. [Google Scholar] [CrossRef] [PubMed]
- Asciutti-Moura, L.S.; Guilland, J.C.; Fuchs, F.; Richard, D.; Klepping, J. Fatty acid composition of serum lipids and its relation to diet in an elderly institutionalized population. Am. J. Clin. Nutr. 1988, 48, 980–987. [Google Scholar] [CrossRef] [PubMed]
- Andersen, L.F.; Solvoll, K.; Johansson, L.R.K.; Salminen, I.; Aro, A.; Drevon, C.A. Evaluation of a Food Frequency Questionnaire with Weighed Records, Fatty Acids, and Alpha-Tocopherol in Adipose Tissue and Serum. Am. J. Epidemiol. 1999, 150, 75–87. [Google Scholar] [CrossRef] [PubMed]
- Katan, M.B.; Deslypere, J.P.; van Birgelen, A.P.; Penders, M.; Zegwaard, M. Kinetics of the incorporation of dietary fatty acids into serum cholesteryl esters, erythrocyte membranes, and adipose tissue: An 18-month controlled study. J. Lipid Res. 1997, 38, 2012–2022. [Google Scholar] [CrossRef] [PubMed]
- Ma, J.; Folsom, A.R.; Shahar, E.; Eckfeldt, J.H. Plasma fatty acid composition as an indicator of habitual dietary fat intake in middle-aged adults. The Atherosclerosis Risk in Communities (ARIC) Study Investigators. Am. J. Clin. Nutr. 1995, 62, 564–571. [Google Scholar] [CrossRef]
- Yaqoob, P.; Pala, H.S.; Cortina-Borja, M.; Newsholme, E.A.; Calder, P.C. Encapsulated fish oil enriched in α-tocopherol alters plasma phospholipid and mononuclear cell fatty acid compositions but not mononuclear cell functions. Eur. J. Clin. Investig. 2000, 30, 260–274. [Google Scholar] [CrossRef]
- Riboli, E.; Hunt, K.; Slimani, N.; Ferrari, P.; Norat, T.; Fahey, M.; Charrondière, U.; Hémon, B.; Casagrande, C.; Vignat, J.; et al. European Prospective Investigation into Cancer and Nutrition (EPIC): Study populations and data collection. Public Health Nutr. 2002, 5, 1113–1124. [Google Scholar] [CrossRef]
- Margetts, B.M.; Pietinen, P. European Prospective Investigation into Cancer and Nutrition: Validity studies on dietary assessment methods. Leuk. Res. 1997, 26, S1–S5. [Google Scholar] [CrossRef]
- Yammine, S.; Huybrechts, I.; Biessy, C.; Dossus, L.; Aglago, E.K.; Naudin, S.; Ferrari, P.; Weiderpass, E.; Tjønneland, A.; Hansen, L.; et al. Dietary and Circulating Fatty Acids and Ovarian Cancer Risk in the European Prospective Investigation into Cancer and Nutrition. Cancer Epidemiol. Biomark. Prev. 2020, 29, 1739–1749. [Google Scholar] [CrossRef] [PubMed]
- Aglago, E.K.; Biessy, C.; Torres-Mejía, G.; Angeles-Llerenas, A.; Gunter, M.J.; Romieu, I.; Chajès, V. Association between serum phospholipid fatty acid levels and adiposity in Mexican women. J. Lipid Res. 2017, 58, 1462–1470. [Google Scholar] [CrossRef] [PubMed]
- Chajès, V.; Thiébaut, A.C.M.; Rotival, M.; Gauthier, E.; Maillard, V.; Boutron-Ruault, M.-C.; Joulin, V.; Lenoir, G.M.; Clavel-Chapelon, F. Association between Serum trans-Monounsaturated Fatty Acids and Breast Cancer Risk in the E3N-EPIC Study. Am. J. Epidemiol. 2008, 167, 1312–1320. [Google Scholar] [CrossRef] [PubMed]
- Yuan, C.; Spiegelman, D.; Rimm, E.B.; Rosner, B.A.; Stampfer, M.J.; Barnett, J.B.; Chavarro, J.E.; Rood, J.C.; Harnack, L.J.; Sampson, L.K.; et al. Relative Validity of Nutrient Intakes Assessed by Questionnaire, 24-Hour Recalls, and Diet Records as Compared With Urinary Recovery and Plasma Concentration Biomarkers: Findings for Women. Am. J. Epidemiol. 2018, 187, 1051–1063. [Google Scholar] [CrossRef]
- Food and Agriculture Organization of the United Nations. Fats and Fatty Acids in Human Nutrition. Report of an Expert Consultation; FAO Food and Nutrition Paper; FAO: Rome, Italy, 2010; Report No. 978-92-5-106733-8. [Google Scholar]
- Juan, J.; Huang, H.; Jiang, X.; Korat, A.V.A.; Song, M.; Sun, Q.; Willett, W.C.; Jensen, M.K.; Kraft, P. Joint effects of fatty acid desaturase 1 polymorphisms and dietary polyunsaturated fatty acid intake on circulating fatty acid proportions. Am. J. Clin. Nutr. 2018, 107, 826–833. [Google Scholar] [CrossRef]
- Madsen, M.T.B.; Bjerregaard, A.A.; Furtado, J.D.; Halldorsson, T.I.; Ström, M.; Granström, C.; Giovannucci, E.; Olsen, S.F. Comparisons of Estimated Intakes and Plasma Concentrations of Selected Fatty Acids in Pregnancy. Nutrients 2019, 11, 568. [Google Scholar] [CrossRef]
- Adebamowo, C.A.; Adekunle, O.O. Case-controlled study of the epidemiological risk factors for breast cancer in Nigeria. Br. J. Surg. 1999, 86, 665–668. [Google Scholar] [CrossRef]
- Vyncke, K.E.; Libuda, L.; De Vriendt, T.; Moreno, L.A.; Van Winckel, M.; Manios, Y.; Gottrand, F.; Molnar, D.; Vanaelst, B.; Sjöström, M.; et al. Dietary fatty acid intake, its food sources and determinants in European adolescents: The HELENA (Healthy Lifestyle in Europe by Nutrition in Adolescence) Study. Br. J. Nutr. 2012, 108, 2261–2273. [Google Scholar] [CrossRef]
- Von Houwelingen, A.C.; Kester, A.D.; Kromhout, D.; Hornstra, G. Comparison between habitual intake of polyunsaturated fatty acids and their concentrations in serum lipid fractions. Eur. J. Clin. Nutr. 1989, 43, 11–20. [Google Scholar]
- Tanaka, T.; Shen, J.; Abecasis, G.R.; Kisialiou, A.; Ordovas, J.M.; Guralnik, J.M.; Singleton, A.; Bandinelli, S.; Cherubini, A.; Arnett, D.; et al. Genome-Wide Association Study of Plasma Polyunsaturated Fatty Acids in the InCHIANTI Study. PLOS Genet. 2009, 5, e1000338. [Google Scholar] [CrossRef]
- Schisterman, E.F.; Cole, S.R.; Platt, R.W. Overadjustment Bias and Unnecessary Adjustment in Epidemiologic Studies. Epidemiology 2009, 20, 488–495. [Google Scholar] [CrossRef] [PubMed]
- Arab, L. Biomarkers of Fat and Fatty Acid Intake. J. Nutr. 2003, 133, 925S–932S. [Google Scholar] [CrossRef] [PubMed]
- Bingham, S.A. Biomarkers in nutritional epidemiology. Public Health Nutr. 2002, 5, 821–827. [Google Scholar] [CrossRef] [PubMed]
- Weaver, K.L.; Ivester, P.; Chilton, J.A.; Wilson, M.D.; Pandey, P.; Chilton, F.H. The Content of Favorable and Unfavorable Polyunsaturated Fatty Acids Found in Commonly Eaten Fish. J. Am. Diet. Assoc. 2008, 108, 1178–1185. [Google Scholar] [CrossRef]

| Non-Cases (n = 4923) | |
|---|---|
| Women, n (%) | 4614 (93.7) |
| Age at recruitment, years, mean (SD) | 53.90 ± 8.32 |
| BMI, kg/m2, mean (SD) | 25.60 ± 4.31 |
| Smoking status, n (%) | |
| never | 2793 (56.7) |
| current | 1190 (24.2) |
| former | 845 (17.2) |
| missing | 95 (1.9) |
| Physical activity, n (%) | |
| inactive | 1313 (26.7) |
| moderately inactive | 1739 (35.3) |
| moderately active | 1051 (21.4) |
| active | 743 (15.1) |
| missing | 77 (1.5) |
| Energy intake, kcal/day, mean (SD) | 2040 ± 557 |
| Dietary Intake, g/day | PLFA, as % of Total Fatty Acids | |
|---|---|---|
| Non-Cases (n = 4923) | Non-Cases (n = 4923) | |
| SFA | ||
| 14:0 (myristic acid) | 2.68 (1.81–3.73) | 0.26 (0.21–0.32) |
| 15:0 (pentadecanoic acid) | 0.05 (0.02–0.09) | 0.18 (0.15–0.21) |
| 16:0 (palmitic acid) | 14.00 (10.80–17.80) | 25.60 (24.40–26.80) |
| 17:0 (heptadecanoic acid) | 0.10 (0.06–0.14) | 0.39 (0.35–0.44) |
| 18:0 (stearic acid) | 5.94 (4.43–7.78) | 14.10 (13.20–14.90) |
| 20:0 (Arachidic acid) | 0.12 (0.08–0.18) | 0.00 (0.00–0.05) |
| 22:0 (behenic acid) | 0.06 (0.04–0.11) | 0.02 (0.01–0.03) |
| 24:0 (lignoceric acid) | 0.01 (0.01–0.03) | 0.00 (0.00–0.00) |
| MUFA | ||
| Cis | ||
| 14:1n-5 (myristoleic acid) | 0.04 (0.02–0.07) | 0.01 (0.01–0.02) |
| 15:1 (pentadecenoic acid) | 0.00 (0.00–0.01) | 0.05 (0.03–0.07) |
| 16:1n-7 (palmitoleic acid) | 1.15 (0.83–1.53) | 0.60 (0.48–0.75) |
| 17:1 (heptadecenoic acid) | 0.05 (0.03–0.07) | 0.06 (0.05–0.07) |
| 18:1n-9 (oleic acid) | 25.40 (19.00–33.90) | 10.10 (9.00–11.50) |
| 20:1n-11 (gadoleic acid) | 0.22 (0.16–0.29) | 0.16 (0.14–0.20) |
| 22:1n-9 (erucic acid) | 0.04 (0.01–0.10) | 0.03 (0.02–0.05) |
| 24:1n-9 (nervonic acid) | 0.00 (0.00–0.00) | 0.01 (0.01–0.02) |
| Trans | ||
| 16:1n-7/9 (palmitelaidic acid) | 0.01 (0.00–0.01) | 0.23 (0.16–0.40) |
| CLA | 0.03 (0.02–0.05) | 0.20 (0.12–0.28) |
| 18:1n-7 (vaccenic acid) | 0.00 (0.00–0.00) | 0.22 (0.13–0.33) |
| 18:1n-9/12 (elaidic acid) | 0.86 (0.42–1.67) | 0.26 (0.18–0.42) |
| 18:2ntt | 0.00 (0.00–0.00) | 0.08 (0.05–0.12) |
| 18:2nt | 0.03 (0.02–0.05) | 0.04 (0.03–0.07) |
| n-6 PUFA | ||
| 18:2n-6 (linoleic acid) | 11.40 (8.72–15.10) | 22.20 (20.10–24.20) |
| 18:3n-6 (g-linolenic acid) | 0.01 (0.01–0.01) | 0.09 (0.07–0.13) |
| 20:2n-6 (eicosadienoic acid) | 0.02 (0.01–0.03) | 0.36 (0.32–0.41) |
| 20:3n-6 (di-homo-g-linolenic acid) | 0.01 (0.00–0.01) | 3.34 (2.81–3.90) |
| 20:4n-6 (arachidonic acid) | 0.11 (0.08–0.15) | 11.00 (9.58–12.30) |
| 22:4n-6 (docosatetraenoic acid, DTA) | 0.01 (0.00–0.01) | 0.34 (0.28–0.40) |
| n-3 PUFA | ||
| 18:3n-3ccc (a-linolenic acid) | 0.36 (0.23–0.57) | 0.18 (0.14–0.24) |
| 20:5n-3 (eicosapentaenoic acid, EPA) | 0.05 (0.02–0.09) | 0.97 (0.7–1.39) |
| 20:3n3 (eicosatrienoic acid, ÉTA) | 0.00 (0.00–0.00) | 0.07 (0.05–0.08) |
| 22:5n-3 (docosapentaenoic acid, DPA) | 0.02 (0.01–0.03) | 0.99 (0.81–1.17) |
| 22:6n-3 (docosahexaenoic acid, DHA) | 0.09 (0.04–0.16) | 4.60 (3.75–5.64) |
| Grouping | ||
| SFA | 23.10 (17.50–29.70) | 40.50 (39.60–41.40) |
| MUFA | 26.90 (20.30–35.90) | 12.80 (11.50–14.30) |
| Total cis n-3 PUFA | 0.59 (0.41–0.85) | 6.83 (5.73–8.29) |
| Total long-chain n-3 PUFA | 0.16 (0.08–0.28) | 6.63 (5.53–8.10) |
| Total cis n-6 PUFA | 15.60 (11.70–21.30) | 37.80 (35.90–39.70) |
| Total long-chain n-6 PUFA | 0.02 (0.02–0.04) | 15.30 (13.70–17.00) |
| Total PUFA | 16.20 (12.20–22.10) | 45.00 (43.30–46.60) |
| Total trans industrial fatty acids | 0.92 (0.46–1.75) | 0.74 (0.54–1.07) |
| Total trans ruminant fatty acids | 0.04 (0.02–0.06) | 0.41 (0.30–0.56) |
| Total trans | 1.00 (0.50–1.91) | 1.17 (0.88–1.64) |
| Ratio n-6 PUFA/n-3 PUFA | 19.40 (14.40–26.90) | 5.55 (4.41–6.76) |
| Ratio long-chain n-6 PUFA/n-3 PUFA | 0.17 (0.08–0.33) | 2.33 (1.81–2.89) |
Disclaimer/Publisher’s Note: The statements, opinions and data contained in all publications are solely those of the individual author(s) and contributor(s) and not of MDPI and/or the editor(s). MDPI and/or the editor(s) disclaim responsibility for any injury to people or property resulting from any ideas, methods, instructions or products referred to in the content. |
© 2023 by the authors. Licensee MDPI, Basel, Switzerland. This article is an open access article distributed under the terms and conditions of the Creative Commons Attribution (CC BY) license (https://creativecommons.org/licenses/by/4.0/).
Share and Cite
Huybrechts, I.; Jacobs, I.; Aglago, E.K.; Yammine, S.; Matta, M.; Schmidt, J.A.; Casagrande, C.; Nicolas, G.; Biessy, C.; Van Puyvelde, H.; et al. Associations between Fatty Acid Intakes and Plasma Phospholipid Fatty Acid Concentrations in the European Prospective Investigation into Cancer and Nutrition. Nutrients 2023, 15, 3695. https://doi.org/10.3390/nu15173695
Huybrechts I, Jacobs I, Aglago EK, Yammine S, Matta M, Schmidt JA, Casagrande C, Nicolas G, Biessy C, Van Puyvelde H, et al. Associations between Fatty Acid Intakes and Plasma Phospholipid Fatty Acid Concentrations in the European Prospective Investigation into Cancer and Nutrition. Nutrients. 2023; 15(17):3695. https://doi.org/10.3390/nu15173695
Chicago/Turabian StyleHuybrechts, Inge, Inarie Jacobs, Elom K. Aglago, Sahar Yammine, Michèle Matta, Julie A. Schmidt, Corinne Casagrande, Geneviève Nicolas, Carine Biessy, Heleen Van Puyvelde, and et al. 2023. "Associations between Fatty Acid Intakes and Plasma Phospholipid Fatty Acid Concentrations in the European Prospective Investigation into Cancer and Nutrition" Nutrients 15, no. 17: 3695. https://doi.org/10.3390/nu15173695
APA StyleHuybrechts, I., Jacobs, I., Aglago, E. K., Yammine, S., Matta, M., Schmidt, J. A., Casagrande, C., Nicolas, G., Biessy, C., Van Puyvelde, H., Scalbert, A., Derksen, J. W. G., van der Schouw, Y. T., Grioni, S., Amiano, P., Halkjær, J., Tjønneland, A., Huerta, J. M., Luján-Barroso, L., ... Chajès, V. (2023). Associations between Fatty Acid Intakes and Plasma Phospholipid Fatty Acid Concentrations in the European Prospective Investigation into Cancer and Nutrition. Nutrients, 15(17), 3695. https://doi.org/10.3390/nu15173695