
Assessment of Serum Zn, Cu, Mn, and Fe Concentration in Women with Endometrial Cancer and Different Endometrial Pathologies

 , , , , and
Abstract
1. Introduction
- -
- Group 1—carcinogenic to humans;
- -
- Group 2A—probably carcinogenic to humans;
- -
- Group 2B—possibly carcinogenic to humans;
- -
- Group 3—not classifiable as to its carcinogenicity to humans.
2. Materials and Methods
2.1. Sample Collection and Storage
2.2. Measurement Methodology
2.3. Statistical Analysis
3. Results
3.1. Group Characteristics
3.1.1. Trace Metal Concentration
3.1.2. Patient Age
3.1.3. Patient Weight and BMI
3.2. Distribution of Trace Metal Concentration Based on Patient BMI
3.3. Analysis of Trace Metal Concentration Considering Patient Characteristics
3.4. Endometrial Cancer Risk Factor Analysis
4. Discussion
5. Conclusions
Author Contributions
Funding
Institutional Review Board Statement
Informed Consent Statement
Data Availability Statement
Conflicts of Interest
Appendix A

| Variable | Pair * | Mean Rank Difference | Z | Critical Value | p-Value |
|---|---|---|---|---|---|
| Cu/Zn ratio | X1–X2 | 23.625 | 2.403 | 25.932 | 0.0162 |
| X1–X3 | 22.808 | 2.963 | 20.309 | 0.0030 | |
| X1–X4 | 13.125 | 1.423 | 24.327 | 0.155 | |
| X2–X3 | −0.817 | 0.092 | 23.387 | 0.927 | |
| X2–X4 | −10.500 | 1.028 | 26.949 | 0.304 | |
| X3–X4 | −9.683 | 1.183 | 21.593 | 0.237 | |
| Mn | X1–X2 | 10.015 | 1.202 | 21.983 | 0.229 |
| X1–X3 | 25.539 | 3.861 | 17.452 | 0.01 | |
| X1–X4 | 19.960 | 2.705 | 19.468 | 0.0067 | |
| X2–X3 | 15.524 | 1.938 | 21.135 | 0.053 | |
| X2–X4 | 9.944 | 1.149 | 22.829 | 0.250 | |
| X3–X4 | −5.579 | 0.795 | 18.506 | 0.426 |
| Variable | Pair * | Difference | Lower CI | Upper CI | Critical Mean | p-Value |
|---|---|---|---|---|---|---|
| Fe | X1–X2 | 0.472 | −0.002 | 0.946 | 0.475 | 0.052 |
| X1–X3 | 0.117 | −0.216 | 0.451 | 0.333 | 0.793 | |
| X1–X4 | 0.320 | −0.080 | 0.720 | 0.400 | 0.163 | |
| X2–X3 | 0.354 | −0.087 | 0.796 | 0.441 | 0.161 | |
| X2–X4 | 0.151 | −0.342 | 0.645 | 0.494 | 0.853 | |
| X3–X4 | 0.203 | −0.158 | 0.563 | 0.360 | 0.458 |
| Variable | Pair * | Mean Rank Difference | Z | Critical Value | p-Value |
|---|---|---|---|---|---|
| Age | X1–X2 | −17.00 | 1.667 | 26.9 | 0.095 |
| X1–X3 | −16.60 | 2.137 | 20.6 | 0.033 | |
| X1–X4 | −48.00 | 5.110 | 24.8 | <0.001 | |
| X2–X3 | 0.35 | 0.034 | 24.0 | 0.969 | |
| X2–X4 | −31.00 | 2.954 | 27.7 | 0.003 | |
| X3–X4 | −31.40 | 3.835 | 21.6 | <0.001 |
| Variable | Pair * | Mean Rank Difference | Z | Critical Value | p-Value |
|---|---|---|---|---|---|
| BMI | X1–X2 | −19.51 | 1.95 | 26.39 | 0.051 |
| X1–X3 | −2.31 | 0.30 | 20.43 | 0.765 | |
| X1–X4 | −21.13 | 2.29 | 24.35 | 0.022 | |
| X2–X3 | 17.20 | 1.94 | 23.44 | 0.053 | |
| X2–X4 | −1.617 | 0.16 | 26.92 | 0.874 | |
| X3–X4 | −18.81 | 2.35 | 21.11 | 0.019 |
Appendix B
| Pair * | Difference | Lower CI | Upper CI | Critical Mean | p-Value |
|---|---|---|---|---|---|
| X1–X2 | 0.090 | −0.052 | 0.233 | 0.142 | 0.288 |
| X1–X3 | 0.197 | 0.054 | 0.341 | 0.143 | 0.004 |
| X2–X3 | 0.107 | −0.036 | 0.250 | 0.143 | 0.182 |
References
- Rodriguez, A.C.; Blanchard, Z.; Maurer, K.A.; Gertz, J. Estrogen Signaling in Endometrial Cancer: A Key Oncogenic Pathway with Several Open Questions. Horm. Cancer 2019, 10, 51–63. [Google Scholar] [CrossRef] [PubMed]
- Dossus, L.; Lukanova, A.; Rinaldi, S.; Allen, N.; Cust, A.E.; Becker, S.; Tjonneland, A.; Hansen, L.; Overvad, K.; Chabbert-Buffet, N.; et al. Hormonal, Metabolic, and Inflammatory Profiles and Endometrial Cancer Risk within the EPIC Cohort—A Factor Analysis. Am. J. Epidemiol. 2013, 177, 787–799. [Google Scholar] [CrossRef] [PubMed]
- McGonigle, K.F.; Karlan, B.Y.; Barbuto, D.A.; Leuchter, R.S.; Lagasse, L.D.; Judd, H.L. Development of Endometrial Cancer in Women on Estrogen and Progestin Hormone Replacement Therapy. Gynecol. Oncol. 1994, 55, 126–132. [Google Scholar] [CrossRef] [PubMed]
- Schindler, A.E. Progestogen Deficiency and Endometrial Cancer Risk. Maturitas 2009, 62, 334–337. [Google Scholar] [CrossRef] [PubMed]
- Getz, G.; Gabriel, S.B.; Cibulskis, K.; Lander, E.; Sivachenko, A.; Sougnez, C.; Lawrence, M.; Kandoth, C.; Dooling, D.; Fulton, R.; et al. Integrated Genomic Characterization of Endometrial Carcinoma. Nature 2013, 497, 67–73. [Google Scholar] [CrossRef]
- Concin, N.; Matias-Guiu, X.; Vergote, I.; Cibula, D.; Mirza, M.R.; Marnitz, S.; Ledermann, J.; Bosse, T.; Chargari, C.; Fagotti, A.; et al. ESGO/ESTRO/ESP Guidelines for the Management of Patients with Endometrial Carcinoma. Int. J. Gynecol. Cancer 2021, 31, 12–39. [Google Scholar] [CrossRef] [PubMed]
- de Boer, S.M.; Powell, M.E.; Mileshkin, L.; Katsaros, D.; Bessette, P.; Haie-Meder, C.; Ottevanger, P.B.; Ledermann, J.A.; Khaw, P.; Colombo, A.; et al. Adjuvant Chemoradiotherapy versus Radiotherapy Alone for Women with High-Risk Endometrial Cancer (PORTEC-3): Final Results of an International, Open-Label, Multicentre, Randomised, Phase 3 Trial. Lancet Oncol. 2018, 19, 295–309. [Google Scholar] [CrossRef]
- van Den Heerik, A.S.V.M.; Horeweg, N.; Nout, R.A.; Lutgens, L.C.H.W.; van Der Steen-Banasik, E.M.; Westerveld, G.H.; van Den Berg, H.A.; Slot, A.; Koppe, F.L.A.; Kommoss, S.; et al. PORTEC-4a: International Randomized Trial of Molecular Profile-Based Adjuvant Treatment for Women with High-Intermediate Risk Endometrial Cancer. Int. J. Gynecol. Cancer 2020, 30, 2002–2007. [Google Scholar] [CrossRef]
- Stefanidou, M.; Maravelias, A.C.; Dona, A.A.; Spiliopoulou, C. Zinc: A Multipurpose Trace Element. Arch. Toxicol. 2006, 80, 1–9. [Google Scholar] [CrossRef]
- Uriu-Adams, J.Y.; Keen, C.L. Copper, Oxidative Stress, and Human Health. Mol. Aspects Med. 2005, 26, 268–298. [Google Scholar] [CrossRef]
- Balsano, C.; Porcu, C.; Sideri, S. Is Copper a New Target to Counteract the Progression of Chronic Diseases? Metallomics 2018, 10, 1712–1722. [Google Scholar] [CrossRef] [PubMed]
- ASDR (Agency for Toxic Substances and Disease Registry). Division of Toxicology ToxFAQs; ASDR (Agency for Toxic Substances and Disease Registry): Atlanta, GA, USA, 2005.
- Mrl, A.; Bmds, E.P.A.; A-, T.; Mrl, T.; Substances, T.; Registry, D. Regulations, Advisories, and Guidelines. In Toxicological Profile for Radon; Agency for Toxic Substances and Disease Registry: Atlanta, GA, USA, 2000. [Google Scholar]
- Brown, K.H.; Rivera, J.A.; Bhutta, Z.; Gibson, R.S.; King, J.C.; Lönnerdal, B.; Ruel, M.T.; Sandtröm, B.; Wasantwisut, E.; Hotz, C.; et al. International Zinc Nutrition Consultative Group (IZiNCG) Technical Document #1. Assessment of the Risk of Zinc Deficiency in Populations and Options for Its Control. Food Nutr. Bull. 2004, 25, S99–S203. [Google Scholar] [PubMed]
- Leone, N.; Courbon, D.; Ducimetiere, P.; Zureik, M. Zinc, Copper, and Magnesium and Risks for All-Cause, Cancer, and Cardiovascular Mortality. Epidemiology 2006, 17, 308–314. [Google Scholar] [CrossRef]
- Rizk, S.L.; Sky-Peck, H.H. Comparison between Concentrations of Trace Elements in Normal and Neoplastic Human Breast Tissue. Cancer Res. 1984, 44, 5390–5394. [Google Scholar] [PubMed]
- Kuo, H.W.; Chen, S.F.; Wu, C.C.; Chen, D.R.; Lee, J.H. Serum and Tissue Trace Elements in Patients with Breast Cancer in Taiwan. Biol. Trace Elem. Res. 2002, 89, 1–11. [Google Scholar] [CrossRef] [PubMed]
- Zowczak, M.; Iskra, M.; Torliński, L.; Cofta, S. Analysis of Serum Copper Zinc Concentrations in Cancer Patients. Biol. Trace Elem. Res. 2001, 82, 1–8. [Google Scholar] [CrossRef]
- Bo, S.; Durazzo, M.; Gambino, R.; Berutti, C.; Milanesio, N.; Caropreso, A.; Gentile, L.; Cassader, M.; Cavallo-Perin, P.; Pagano, G. Associations of Dietary and Serum Copper with Inflammation, Oxidative Stress, and Metabolic Variables in Adults. J. Nutr. 2008, 138, 305–310. [Google Scholar] [CrossRef]
- Osredkar, J. Copper and Zinc, Biological Role and Significance of Copper/Zinc Imbalance. J. Clin. Toxicol. 2011, s3, 1. [Google Scholar] [CrossRef]
- Stepien, M.; Jenab, M.; Freisling, H.; Becker, N.P.; Czuban, M.; Tjønneland, A.; Olsen, A.; Overvad, K.; Boutron-Ruault, M.C.; Mancini, F.R.; et al. Pre-Diagnostic Copper and Zinc Biomarkers and Colorectal Cancer Risk in the European Prospective Investigation into Cancer and Nutrition Cohort. Carcinogenesis 2017, 38, 699–707. [Google Scholar] [CrossRef]
- Gupta, S.K.; Singh, S.P.; Shukla, V.K. Copper, Zinc, and Cu/Zn Ratio in Carcinoma of the Gallbladder. J. Surg. Oncol. 2005, 91, 204–208. [Google Scholar] [CrossRef]
- Poo, J.L.; Rosas-Romero, R.; Montemayor, A.C.; Isoard, F.; Uribe, M. Diagnostic Value of the Copper/Zinc Ratio in Hepatocellular Carcinoma: A Case Control Study. J. Gastroenterol. 2003, 38, 45–51. [Google Scholar] [CrossRef] [PubMed]
- Feng, Y.; Zeng, J.W.; Ma, Q.; Zhang, S.; Tang, J.; Feng, J.F. Serum Copper and Zinc Levels in Breast Cancer: A Meta-Analysis. J. Trace Elem. Med. Biol. 2020, 62, 126629. [Google Scholar] [CrossRef]
- Shobeiri, M.J.; Tabrizi, A.D.; Atashkhoyi, S.; Sayyah-Melli, M.; Ouladsahebmadarek, E.; Gojazadeh, M.; Hodayi, N. Serum Levels of Copper and Zinc, Copper/Zinc Ratio in Patients with Benign and Malignant Ovarian Tumors. J. Maz. Univ. Med. Sci. 2011, 20, 20–30. [Google Scholar]
- Atakul, T.; Altinkaya, S.O.; Abas, B.I.; Yenisey, C. Serum Copper and Zinc Levels in Patients with Endometrial Cancer. Biol. Trace Elem. Res. 2020, 195, 46–54. [Google Scholar] [CrossRef]
- Smita, M.; Naidu, K.; Suryakar, A.N.; Swami, S.C.; Katkam, R.V.; Kumbar, K.M. Oxidative Stress and Antioxidant Status in Cervical Cancer Patients. Indian J. Clin. Biochem. 2007, 22, 140–144. [Google Scholar] [CrossRef]
- Weinberg, E.D. The Role of Iron in Cancer. Eur. J. Cancer Prev. 1996, 5, 19–36. [Google Scholar]
- McCord, J.M. Iron, Free Radicals, and Oxidative Injury. Semin. Hematol. 1998, 35, 333–339. [Google Scholar] [CrossRef]
- Stevens, R.G.; Graubard, B.I.; Micozzi, M.S.; Neriishi, K.; Blumberg, B.S. Moderate Elevation of Body Iron Level and Increased Risk of Cancer Occurrence and Death. Int. J. Cancer 1994, 56, 364–369. [Google Scholar] [CrossRef]
- Guo, Q.; Li, L.; Hou, S.; Yuan, Z.; Li, C.; Zhang, W.; Zheng, L.; Li, X. The Role of Iron in Cancer Progression. Front. Oncol. 2021, 11, 778492. [Google Scholar] [CrossRef]
- Wu, T.; Sempos, C.T.; Freudenheim, J.L.; Muti, P.; Smit, E. Serum Iron, Copper and Zinc Concentrations and Risk of Cancer Mortality in US Adults. Ann. Epidemiol. 2004, 14, 195–201. [Google Scholar] [CrossRef]
- Ali, M.A.; Akhmedkhanov, A.; Zeleniuch-Jaquotte, A.; Toniolo, P.; Frenkel, K.; Huang, X. Reliability of Serum Iron, Ferritin, Nitrite, and Association with Risk of Renal Cancer in Women. Cancer Detect. Prev. 2003, 27, 116–121. [Google Scholar] [CrossRef]
- Cross, A.J.; Sinha, R.; Wood, R.J.; Xue, X.; Huang, W.Y.; Yeager, M.; Hayes, R.B.; Gunter, M.J. Iron Homeostasis and Distal Colorectal Adenoma Risk in the Prostate, Lung, Colorectal, and Ovarian Cancer Screening Trial. Cancer Prev. Res. 2011, 4, 1465–1475. [Google Scholar] [CrossRef]
- Gaur, A.; Collins, H.; Wulaningsih, W.; Holmberg, L.; Garmo, H.; Hammar, N.; Walldius, G.; Jungner, I.; van Hemelrijck, M. Iron Metabolism and Risk of Cancer in the Swedish AMORIS Study. Cancer Causes Control 2013, 24, 1393–1402. [Google Scholar] [CrossRef]
- Mainous, A.G.; Wells, B.J.; Koopman, R.J.; Everett, C.J.; Gill, J.M. Iron, Lipids, and Risk of Cancer in the Framingham Offspring Cohort. Am. J. Epidemiol. 2005, 161, 1115–1122. [Google Scholar] [CrossRef] [PubMed][Green Version]
- Rajpathak, S.; Ma, J.; Manson, J.A.; Willett, W.C.; Hu, F.B. Iron Intake and the Risk of Type 2 Diabetes in Women: A Prospective Cohort Study. Diabetes Care 2006, 29, 1370–1376. [Google Scholar] [CrossRef] [PubMed]
- Lee, D.H.; Folsom, A.R.; Jacobs, D.R. Dietary Iron Intake and Type 2 Diabetes Incidence in Postmenopausal Women: The Iowa Women’s Health Study. Diabetologia 2004, 47, 185–194. [Google Scholar] [CrossRef] [PubMed]
- Kabat, G.C.; Miller, A.B.; Jain, M.; Rohan, T.E. Dietary Iron and Haem Iron Intake and Risk of Endometrial Cancer: A Prospective Cohort Study. Br. J. Cancer 2008, 98, 194–198. [Google Scholar] [CrossRef]
- Genkinger, J.M.; Friberg, E.; Goldbohm, R.A.; Wolk, A. Long-Term Dietary Heme Iron and Red Meat Intake in Relation to Endometrial Cancer Risk. Am. J. Clin. Nutr. 2012, 96, 848–854. [Google Scholar] [CrossRef]
- Kallianpur, A.R.; Lee, S.A.; Xu, W.H.; Zheng, W.; Gao, Y.T.; Cai, H.; Ruan, Z.X.; Xiang, Y.B.; Shu, X.O. Dietary Iron Intake and Risk of Endometrial Cancer: A Population-Based Case-Control Study in Shanghai, China. Nutr. Cancer 2010, 62, 40–50. [Google Scholar] [CrossRef]
- Tomczyk, K.M.; Rzymski, P.; Wilczak, M. Canonical Analysis of Concentrations of Toxic Metals in Endometrium of Women with Gynecological Disorders. Ginekol. Pol. 2022, 93, 806–810. [Google Scholar] [CrossRef]
- Wang, Y.; Jafar, T.H.; Jin, A.; Yuan, J.M.; Koh, W.P. Dietary Intakes of Trace Elements and the Risk of Kidney Cancer: The Singapore Chinese Health Study. Nutr. Cancer 2021, 73, 239–245. [Google Scholar] [CrossRef] [PubMed]
- Hashemian, M.; Poustchi, H.; Nasrabadi, F.M.; Sharafkhah, M.; Malekshah, A.F.; Hekmatdoost, A.; Malekzadeh, R. Manganese Intake and Risk of Esophageal Cancer in Golestan Cohort Study. Govaresh 2016, 21, 20–25. [Google Scholar]


| Characteristics | Overall |
|---|---|
| Age (years) | |
| <50 | 45 |
| ≥50–60 | 30 |
| ≥60 | 32 |
| BMI (kg/m2) | |
| Normal (<25) | 35 |
| Overweight (≥25–30) | 36 |
| Obese (≥30) | 25 |
| Smoking | |
| Yes | 7 |
| No | 101 |
| Type 2 diabetes | |
| Yes | 15 |
| No | 93 |
| Menopause | |
| Yes | 64 |
| No | 36 |
| Hypothyroidism | |
| Yes | 18 |
| No | 90 |
| Histopathological diagnosis | |
| Endometrial cancer | 21 |
| Uterine fibroma | 25 |
| Endometrial polyp | 48 |
| Normal endometrium | 16 |
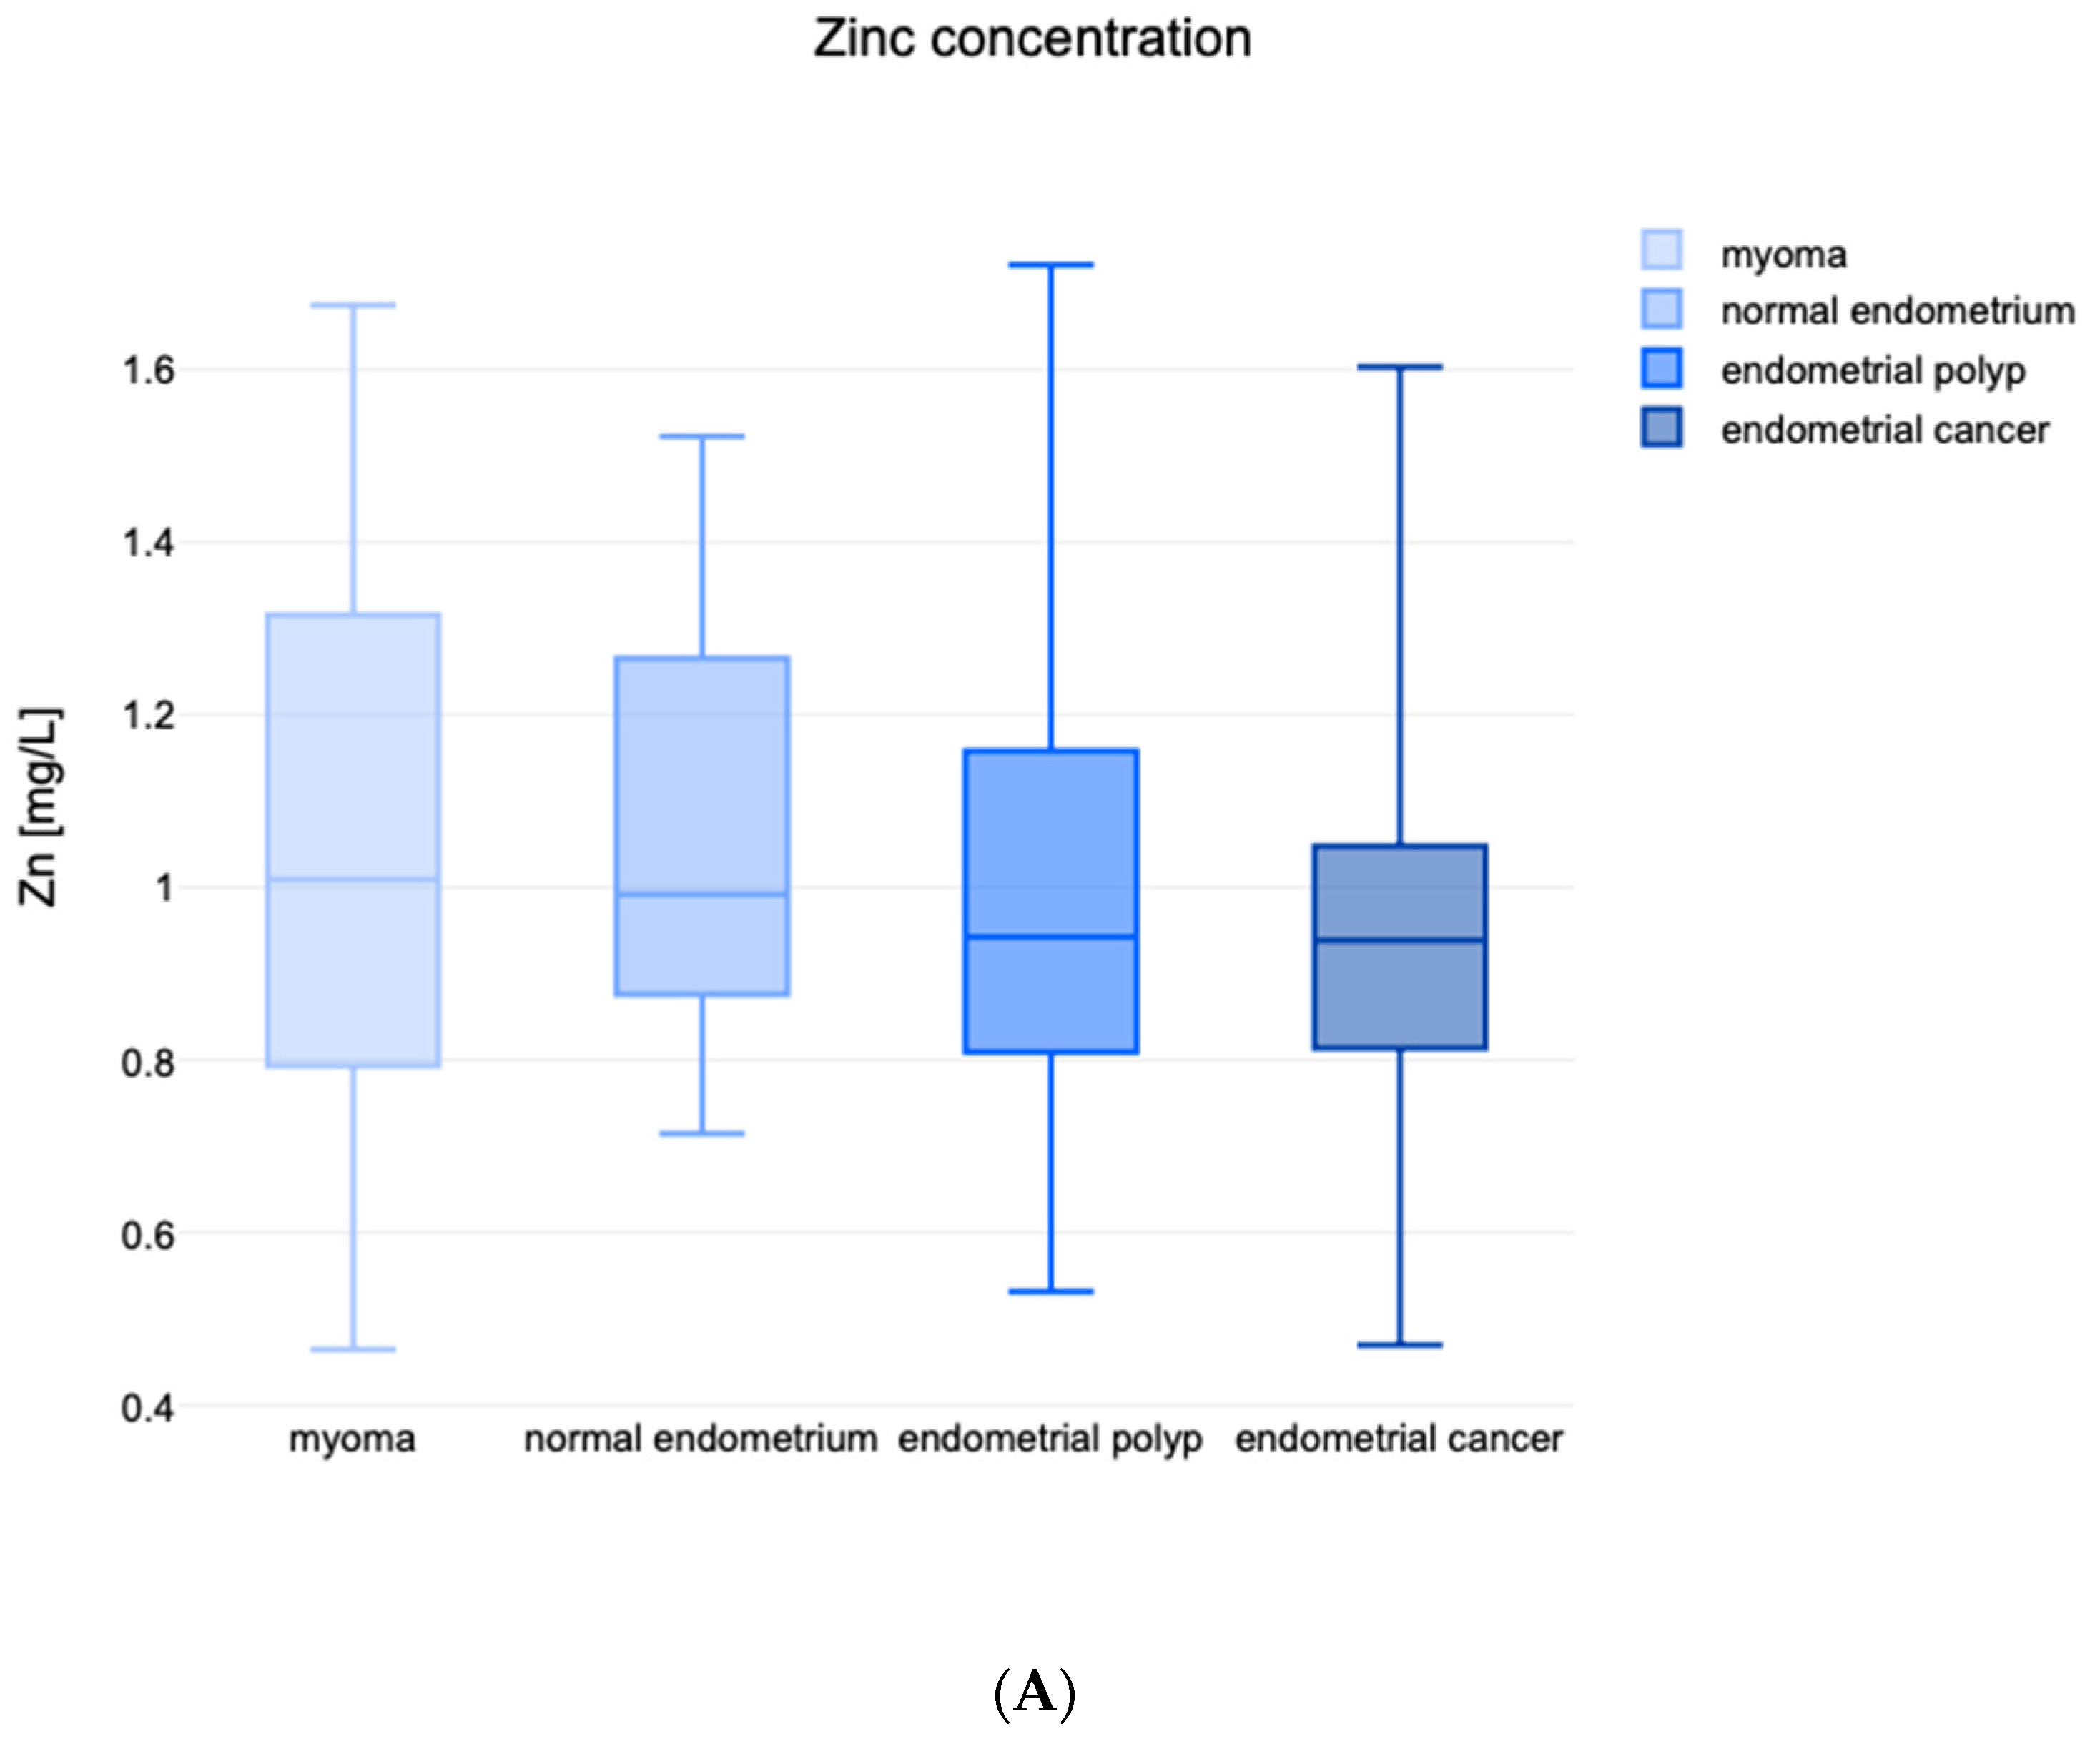
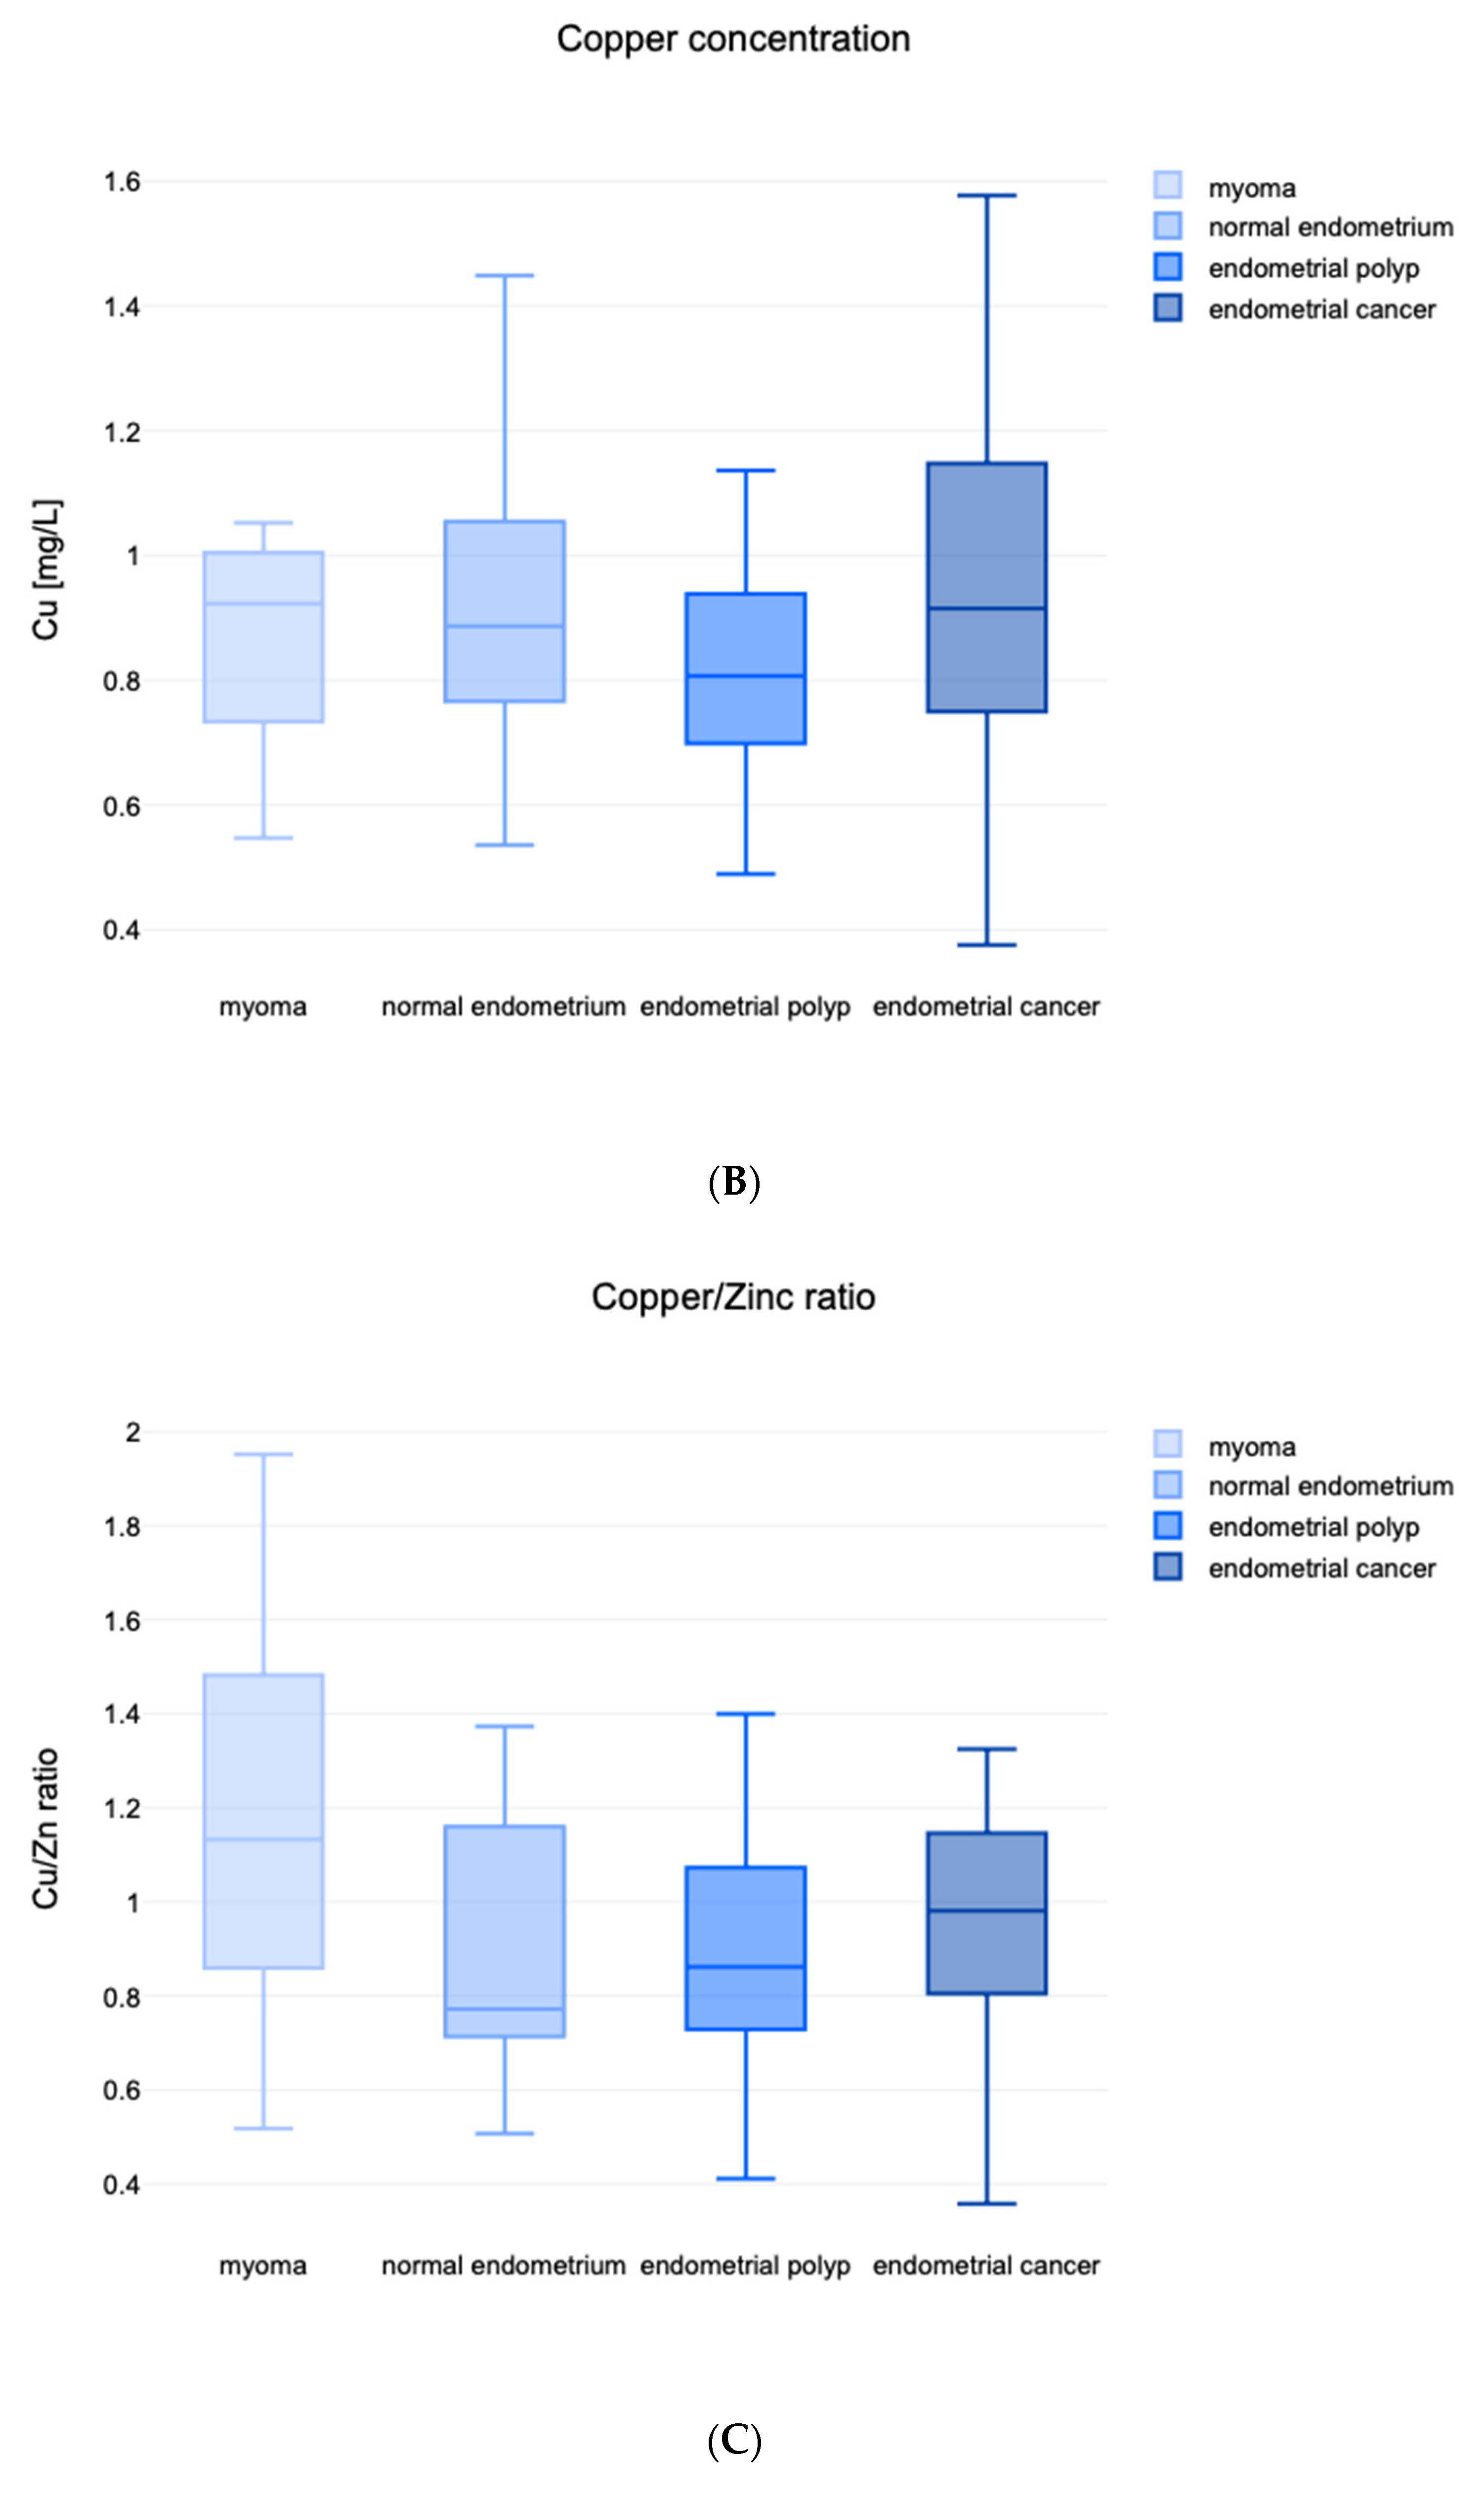
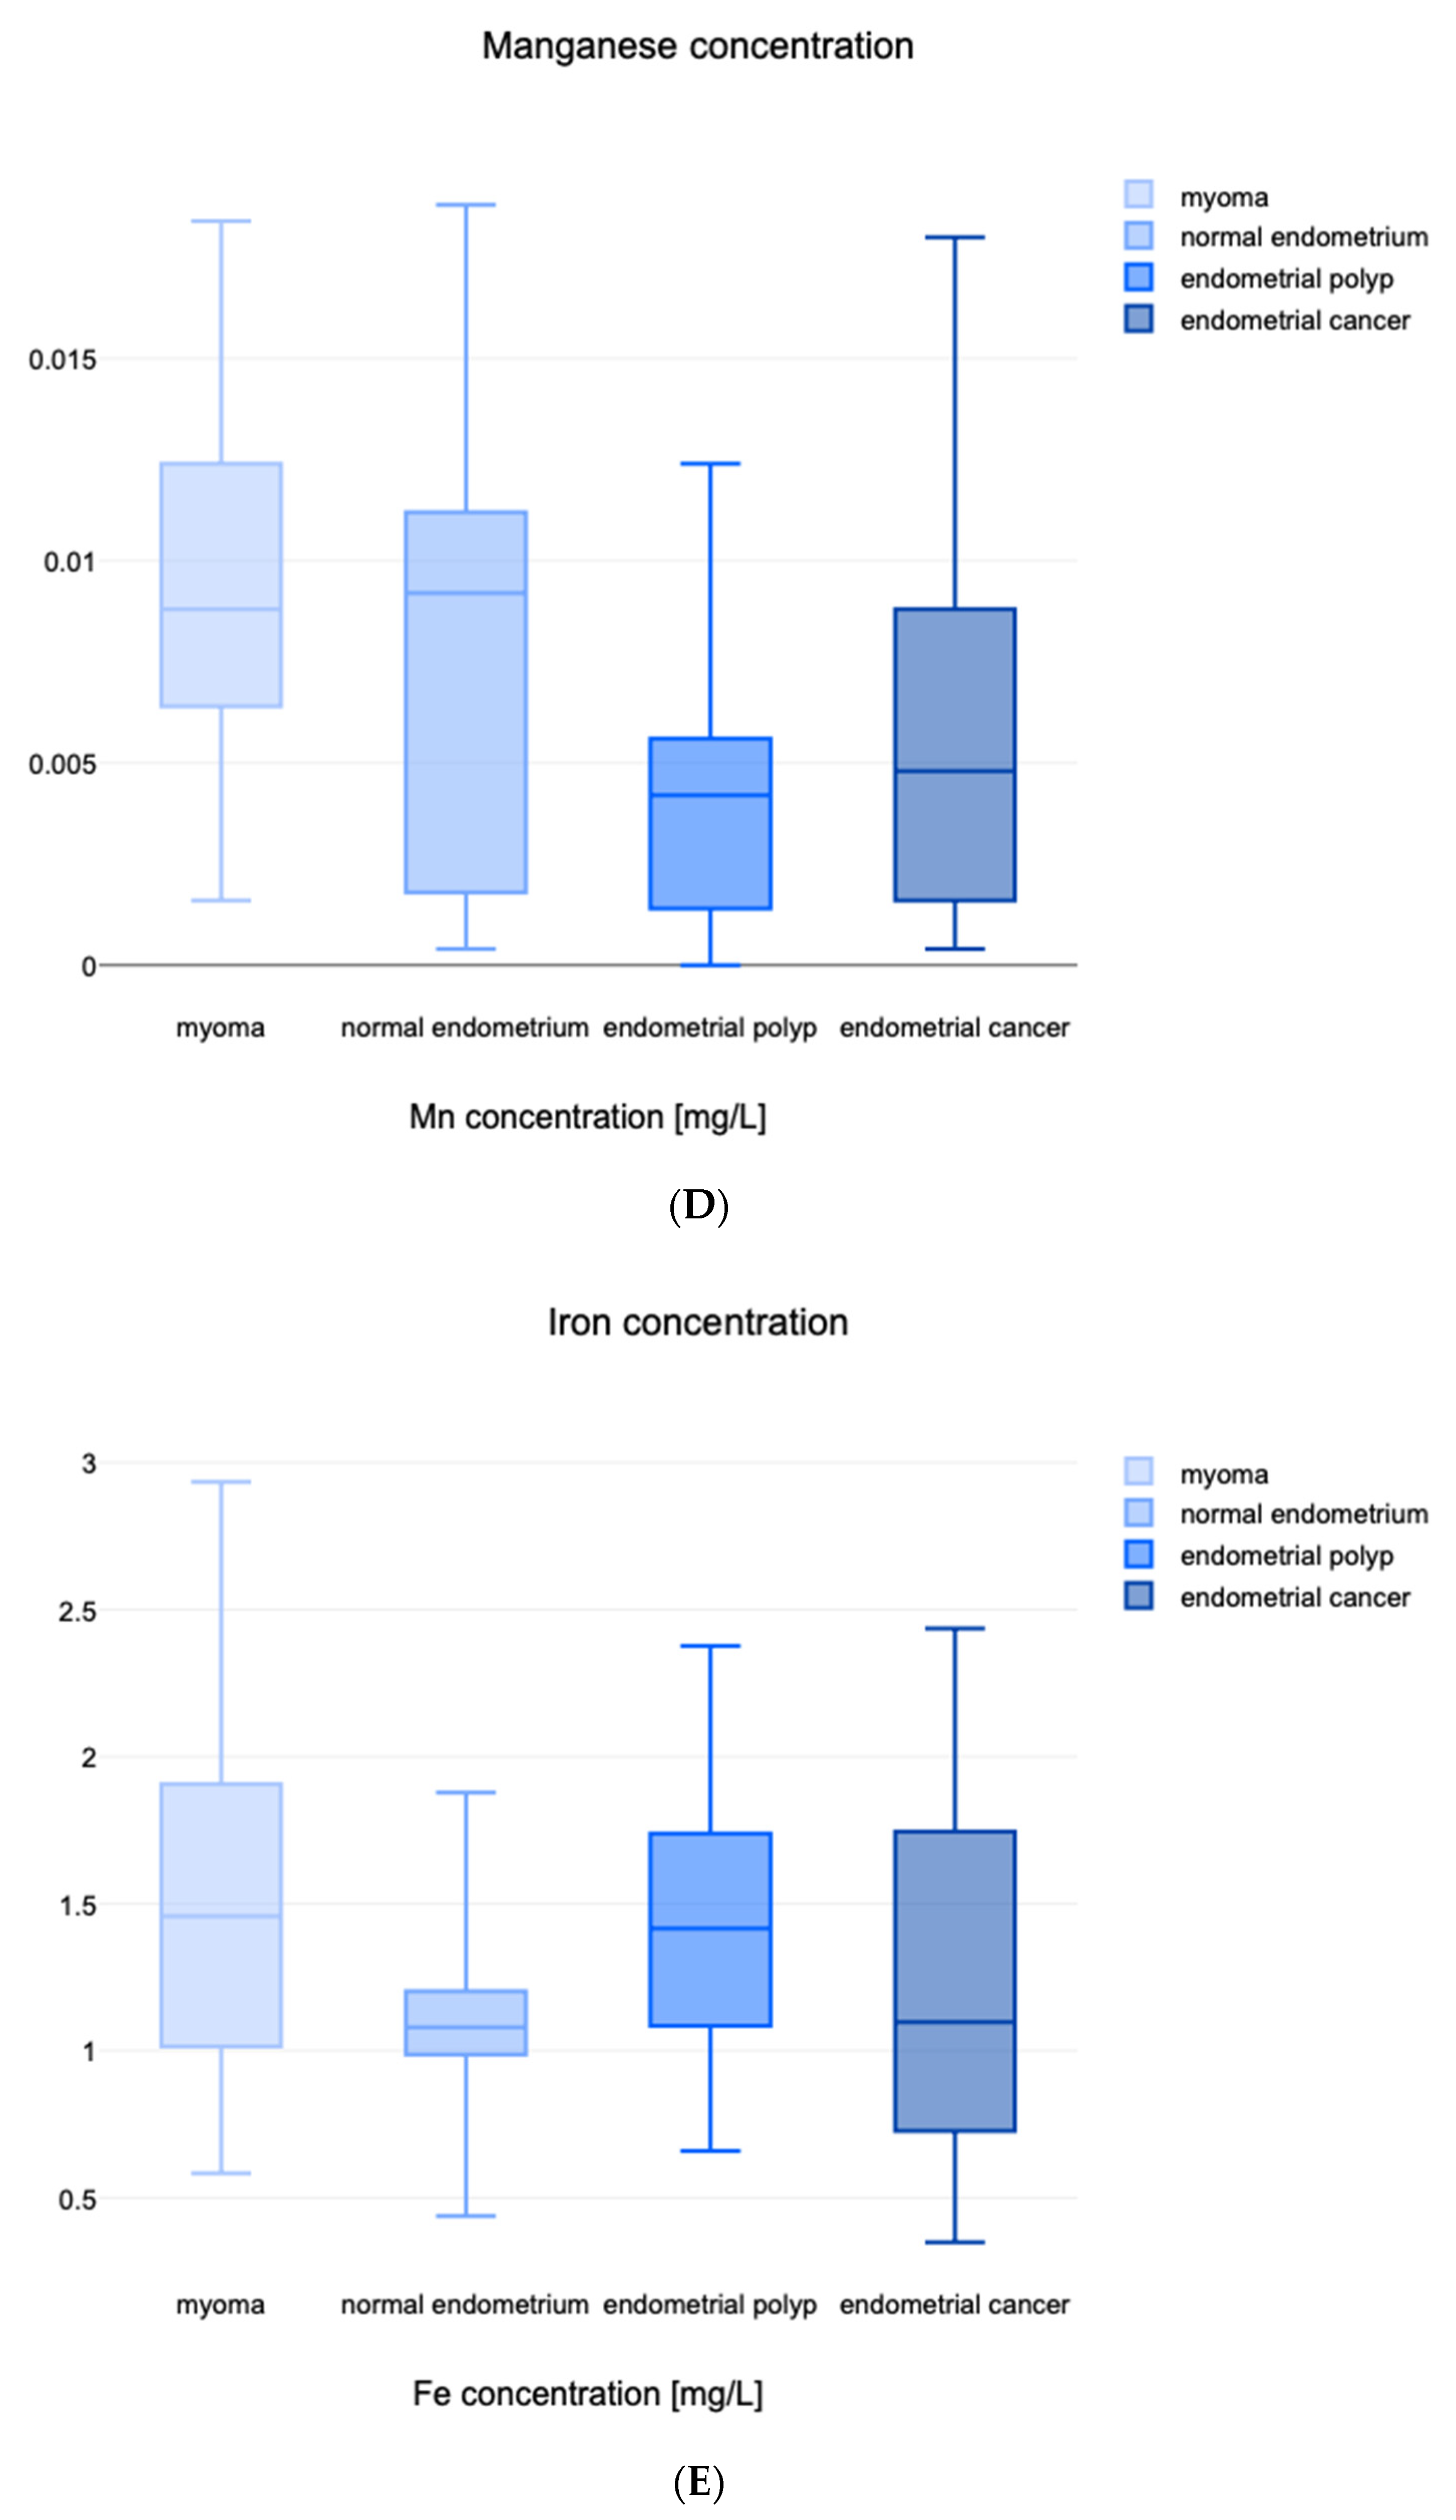
| Variable | Myoma (X1) | Normal Endometrium (X2) | Endometrial Polyp (X3) | Endometrial Cancer (X4) | p-Value |
|---|---|---|---|---|---|
| Zn (mg/L) | 1.001 (0.793; 1.316) | 0.992 (0.876; 1.265) | 0.942 (0.812; 1.265) | 0.938 (0.814; 1.048) | 0.714 * |
| Cu (mg/L) | 0.923 (0.752; 1.003 | 0.887 (0.766; 1.055) | 0.807 (0.699; 0.938) | 0.915 (0.750; 1.148) | 0.328 * |
| Cu/Zn ratio | 1.133 (0.859; 1.482) | 0.772 (0.713; 0.772) | 0.862 (0.733; 0.862) | 0.981 (0.805; 0.981) | 0.018 * |
| Mn (mg/L) | 0.009 (0.006; 0.012) | 0.009 (0.002; 0.011) | 0.004 (0.001; 0.006) | 0.005 (0.002; 0.009) | <0.001 * |
| Fe (mg/L) | 1.512 ± 0.607 | 1.107 ± 0.367 | 1.394 ± 0.433 | 1.192 ± 0.597 | 0.034 |
| Age (years) | 45 (40.5; 51.5) | 52 (47; 55) | 51 (43.5; 60.5) | 70 (58.5; 79) | <0.001 * |
| Weight (kg) | 69.8 ± 13.4 | 79.1 ± 15.0 | 71.1 ± 15.5 | 78.7 ± 21.2 | 0.128 |
| BMI (kg/m2) | 25.28 (23.32; 28.95) | 29.72 (26.08; 34.18) | 26.56 (21.78; 30.04) | 30.27 (26.24; 37.52) | 0.025 * |
| BMI (kg/m2) | <25 | 25–30 | ≥30 | p |
|---|---|---|---|---|
| Zn (mg/L) | 0.957 ± 0.279 | 1.053 ± 0.229 | 1.075 ± 0.347 | 0.051 |
| Cu (mg/L) | 0.821 ± 0.184 | 0.896 ± 0.185 | 1.003 ± 0.334 | 0.006 |
| Cu/Zn ratio | 0.869 ± 0.238 | 0.976 ± 0.303 | 1.020 ± 0.376 | 0.127 |
| Mn (mg/L) | 0.005 | 0.006 | 0.007 | 0.676 * |
| Fe (mg/L) | 1.357 ± 0.436 | 1.384 ± 0.481 | 1.317 ± 0.708 | 0.890 |
| Zn (mg/L) | Cu (mg/L) | Cu/Zn ratio | Mn (mg/L) | Fe (mg/L) | |
|---|---|---|---|---|---|
| Before menopause | 0.999 | 0.795 | 0.843 | 0.007 | 1.441 |
| After menopause | 0.893 | 0.942 | 1.012 | 0.006 | 1.216 |
| p | 0.634 | 0.001 | 0.002 | 0.084 | 0.706 |
| No diabetes | 1.002 | 0.923 | 0.916 | 0.006 | 1.413 |
| Diabetes type 2 | 0.856 | 0.840 | 0.939 | 0.006 | 1.043 |
| p | 0.004 | 0.340 | 0.785 | 0.633 | 0.051 |
| No hypothyroidism | 0.979 | 0.908 | 0.939 | 0.006 | 1.256 |
| Hypothyroidism | 1.086 | 0.868 | 0.853 | 0.008 | 1.552 |
| p | 0.098 | 0.173 | 0.083 | 0.187 | 0.577 |
| Non-smoking | 0.982 | 0.908 | 0.917 | 0.006 | 1.284 |
| Smoking | 1.151 | 0.822 | 0.928 | 0.010 | 1.734 |
| p | 0.174 | 0.623 | 0.369 | 0.255 | 0.468 |
| Characteristics | OR | 95%Cl | p-Value |
|---|---|---|---|
| Zn * | 0.70 | 0.27–1.83 | 0.466 |
| Cu * | 1.31 | 0.49–3.49 | 0.587 |
| Cu/Zn * | 2.36 | 0.87–6.43 | 0.093 |
| Mn * | 0.81 | 0.29–2.30 | 0.693 |
| Fe * | 0.70 | 0.27–1.83 | 0.466 |
| Age * | 7.27 | 1.99–26.57 | 0.003 |
| Weight * | 1.36 | 0.51–3.68 | 0.540 |
| BMI * | 2.14 | 0.78–5.91 | 0.517 |
| Menopause | 20.45 | 12.63–159.0 | 0.004 |
| Smoking | 3.46 | 0.71–18.81 | 0.124 |
| Diabetes type 2 | 14.91 | 4.296–51.75 | <0.001 |
| Hypothyroidism | 0.21 | 0.03–1.64 | 0.136 |
| Normal Range | Obtained Results for Endometrial Cancer Patients | |
|---|---|---|
| Zn | 80–100 μg/dL | 93.8 μg/dL (81.4; 104.8) |
| Cu | 60–140 μg/dL | 91.5 μg/dL (75.0; 114.8) |
| Mn | 0.4–0.85 μg/L | 0.5 μg/L (0.2; 0.9) |
| Fe | 60–170 μg/dL | 98.1 μg/dL (80.5; 98.1) |
Disclaimer/Publisher’s Note: The statements, opinions and data contained in all publications are solely those of the individual author(s) and contributor(s) and not of MDPI and/or the editor(s). MDPI and/or the editor(s) disclaim responsibility for any injury to people or property resulting from any ideas, methods, instructions or products referred to in the content. |
© 2023 by the authors. Licensee MDPI, Basel, Switzerland. This article is an open access article distributed under the terms and conditions of the Creative Commons Attribution (CC BY) license (https://creativecommons.org/licenses/by/4.0/).
Share and Cite
Michalczyk, K.; Kapczuk, P.; Kupnicka, P.; Witczak, G.; Michalczyk, B.; Bosiacki, M.; Chlubek, D.; Cymbaluk-Płoska, A. Assessment of Serum Zn, Cu, Mn, and Fe Concentration in Women with Endometrial Cancer and Different Endometrial Pathologies. Nutrients 2023, 15, 3605. https://doi.org/10.3390/nu15163605
Michalczyk K, Kapczuk P, Kupnicka P, Witczak G, Michalczyk B, Bosiacki M, Chlubek D, Cymbaluk-Płoska A. Assessment of Serum Zn, Cu, Mn, and Fe Concentration in Women with Endometrial Cancer and Different Endometrial Pathologies. Nutrients. 2023; 15(16):3605. https://doi.org/10.3390/nu15163605
Chicago/Turabian StyleMichalczyk, Kaja, Patrycja Kapczuk, Patrycja Kupnicka, Grzegorz Witczak, Barbara Michalczyk, Mateusz Bosiacki, Dariusz Chlubek, and Aneta Cymbaluk-Płoska. 2023. "Assessment of Serum Zn, Cu, Mn, and Fe Concentration in Women with Endometrial Cancer and Different Endometrial Pathologies" Nutrients 15, no. 16: 3605. https://doi.org/10.3390/nu15163605
APA StyleMichalczyk, K., Kapczuk, P., Kupnicka, P., Witczak, G., Michalczyk, B., Bosiacki, M., Chlubek, D., & Cymbaluk-Płoska, A. (2023). Assessment of Serum Zn, Cu, Mn, and Fe Concentration in Women with Endometrial Cancer and Different Endometrial Pathologies. Nutrients, 15(16), 3605. https://doi.org/10.3390/nu15163605