
Lipidome Profiling in Childhood Obesity Compared to Adults: A Pilot Study
 , , , , ,
  , , and
Abstract
:1. Introduction
2. Methods
2.1. Study Cohorts
2.1.1. Pediatric (PE) Cohort
2.1.2. The Adult (AD) Cohort
2.2. Ethical Statement
2.3. Serum Measurements
2.4. Lipid Extraction
2.5. Mass Spectrometry
3. Statistical Methods
3.1. Descriptive Analyses
3.2. Lipidomic Profile at 0 M and 6 M in the PE and AD Cohorts
3.3. Lipidomics Pathway Assessment
3.4. Correlation between Clinical Variables and Differentially Regulated Lipids
4. Results
4.1. PE Cohort
4.2. AD Cohort
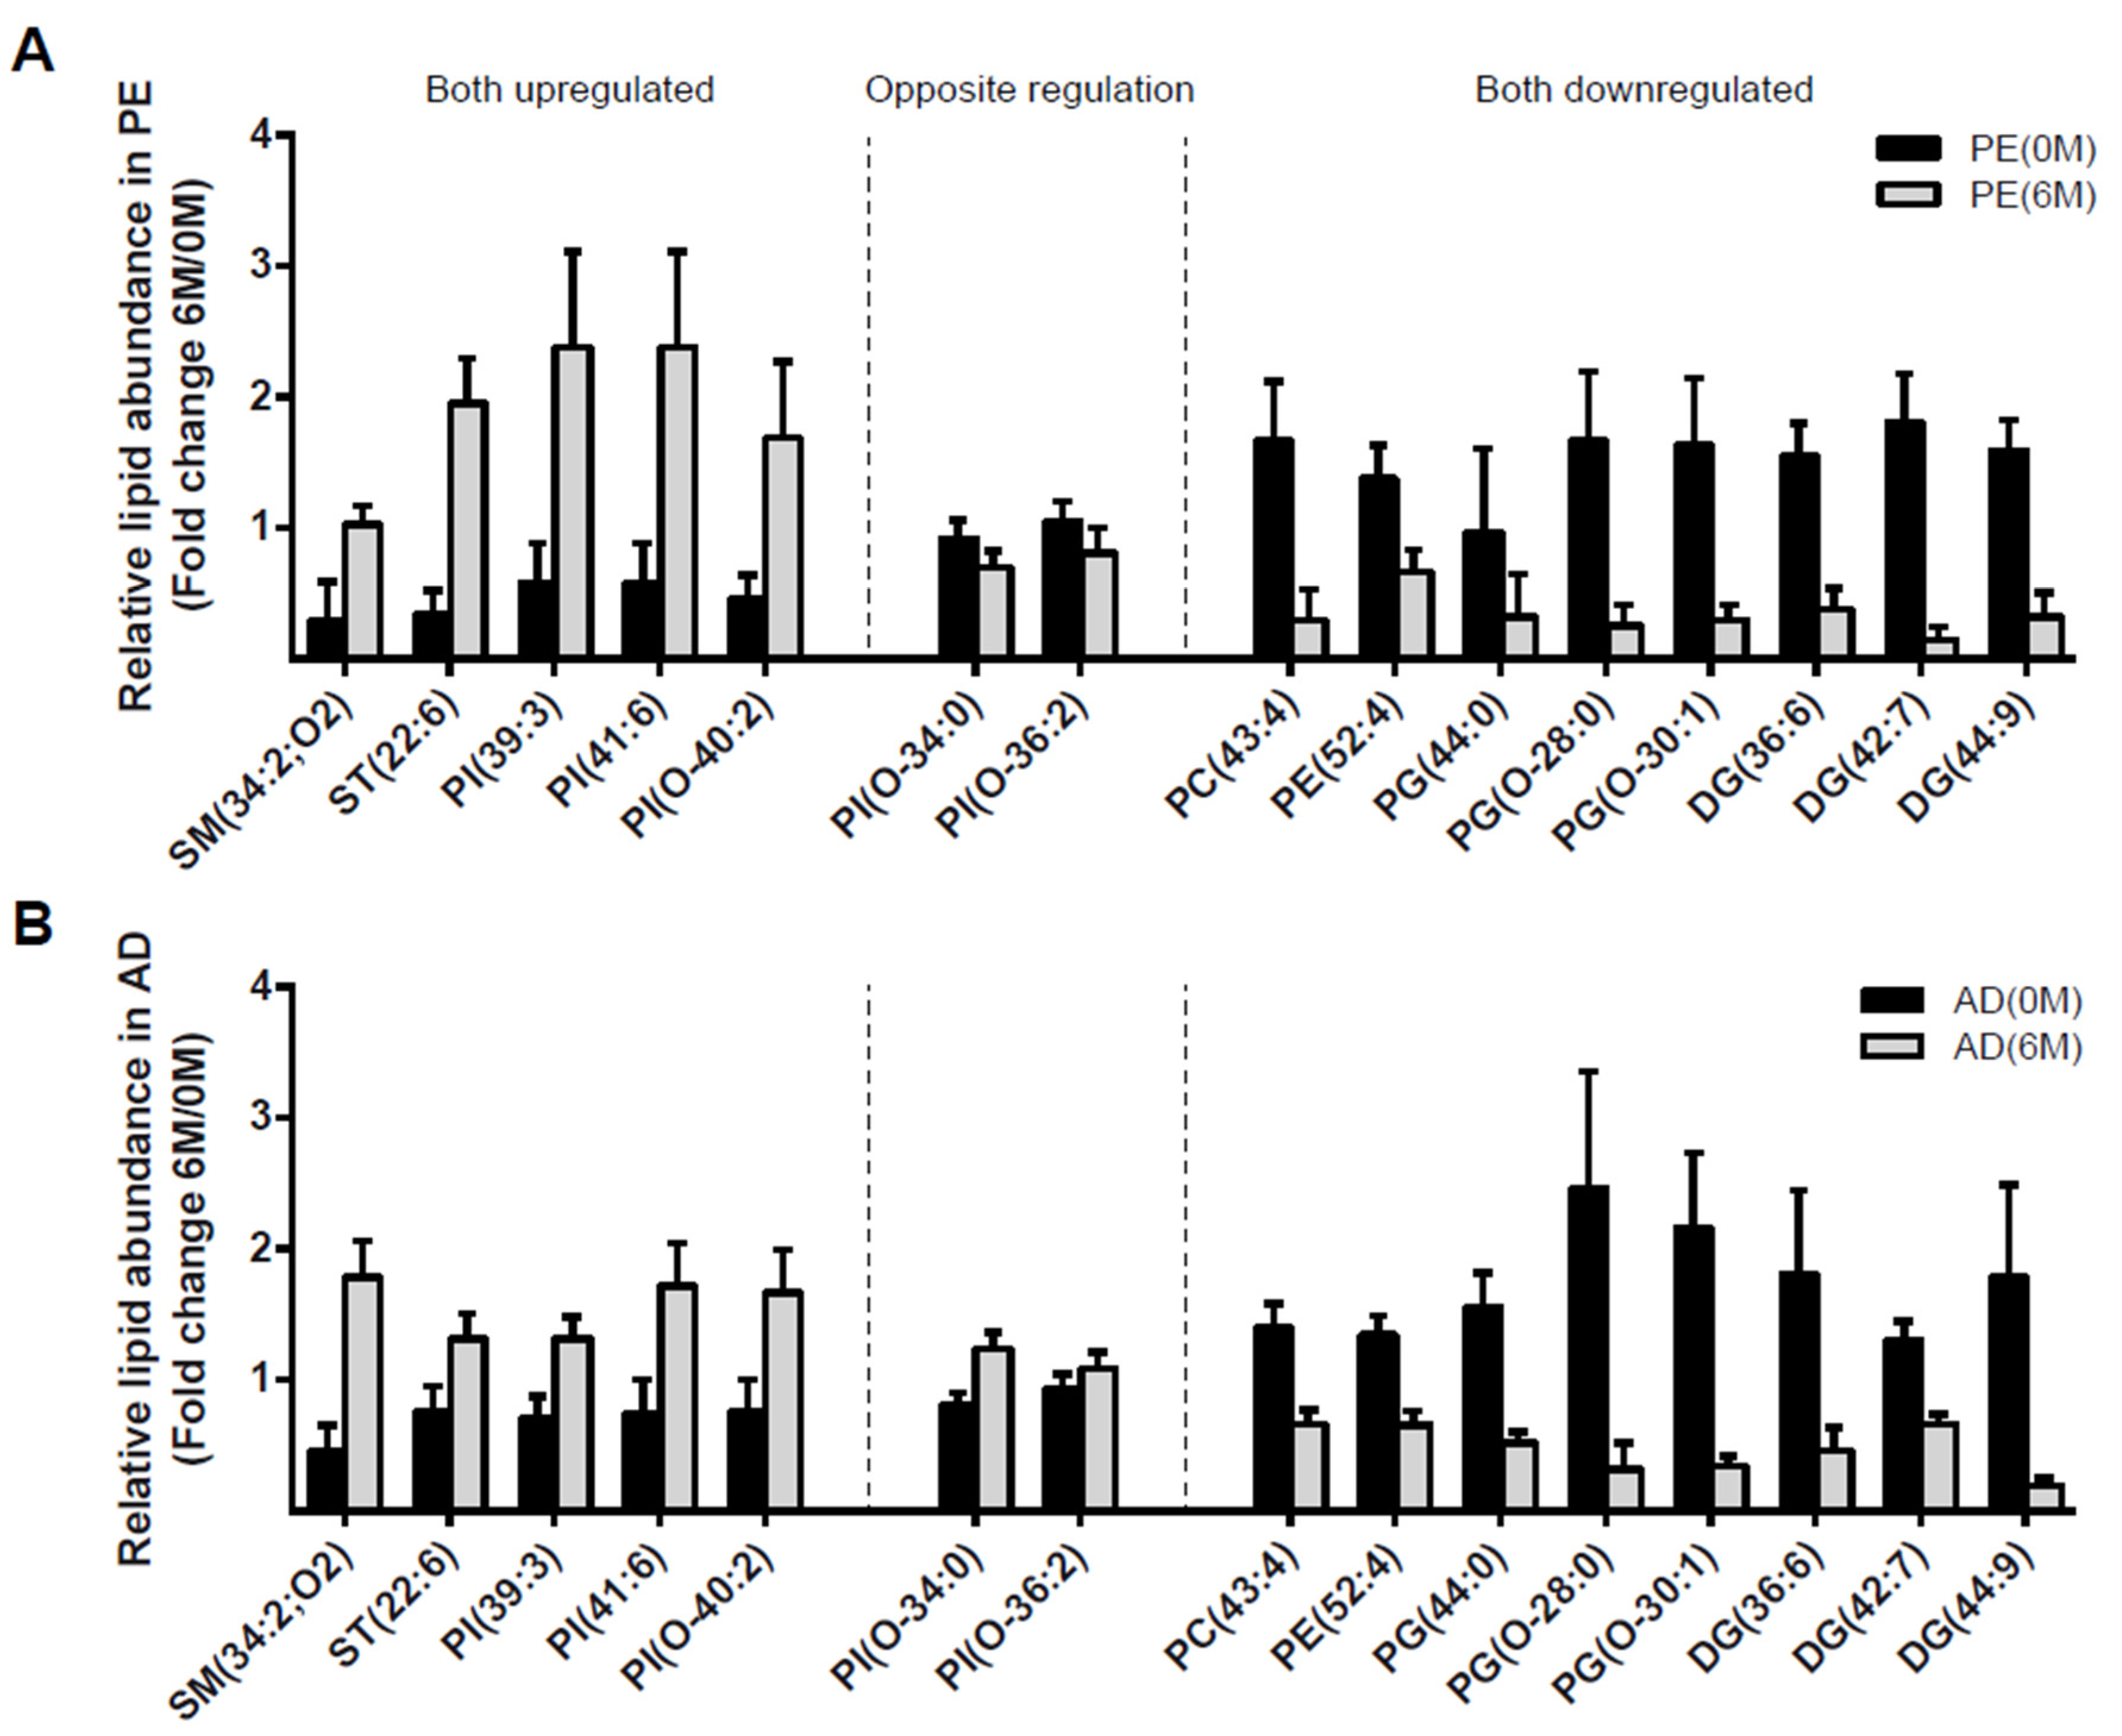
4.3. Lipidomic Profile at 0 M and 6 M in PE and AD Cohorts
5. Discussion
Supplementary Materials
Author Contributions
Funding
Institutional Review Board Statement
Informed Consent Statement
Data Availability Statement
Acknowledgments
Conflicts of Interest
References
- Ng, M.; Fleming, T.; Robinson, M.; Thomson, B.; Graetz, N.; Margono, C.; Mullany, E.C.; Biryukov, S.; Alfonso, R.; Ali, M.K.; et al. Global, Regional, and National Prevalence of Overweight and Obesity in Children and Adults during 1980–2013: A Systematic Analysis for the Global Burden of Disease Study 2013. Lancet 2014, 384, 766–781. [Google Scholar] [CrossRef] [PubMed] [Green Version]
- World Health Organization. Mapping the Health System Response to Childhood Obesity in the WHO European Region an Overview and Country Perspectives; World Health Organization: Geneva, Switzerland, 2019. [Google Scholar]
- Morrison, J.A.; Friedman, L.A.; Gray-mcguire, C.; Morrison, J.A.; Friedman, L.A.; Gray-mcguire, C. Metabolic Syndrome in Childhood Predicts Adult Cardiovascular Disease 25 Years Later: The Princeton Lipid Research Clinics Follow-up Study. Pediatrics 2007, 120, 340–345. [Google Scholar] [CrossRef] [PubMed]
- Juonala, M.; Magnussen, C.G.; Berenson, G.S.; Venn, A.; Burns, T.L.; Sabin, M.A.; Srinivasan, S.R.; Daniels, S.R.; Davis, P.H.; Chen, W.; et al. Childhood Adiposity, Adult Adiposity, and Cardiovascular Risk Factors. N. Engl. J. Med. 2011, 365, 1876–1885. [Google Scholar] [CrossRef] [PubMed] [Green Version]
- Cunningham, S.A.; Kramer, M.R.; Narayan, K.M.V. Incidence of Childhood Obesity in the United States. N. Engl. J. Med. 2014, 370, 403–411. [Google Scholar] [CrossRef] [Green Version]
- Shashaj, B.; Bedogni, G.; Graziani, M.P.; Tozzi, A.E.; DiCorpo, M.L.; Morano, D.; Tacconi, L.; Veronelli, P.; Contoli, B.; Manco, M. Origin of Cardiovascular Risk in Overweight Preschool Children at the Onset of Obesity. JAMA Pediatr. 2015, 168, 917–924. [Google Scholar] [CrossRef] [Green Version]
- Alberts, B.; Johnson, A.; Lewis, J.; Morgan, D.; Raff, M.; Roberts, K.; Walter, P. Molecular Biology of the Cell, 6th ed.; Garland Science: New York, NY, USA, 2007. [Google Scholar]
- Jenkins, B.J.; Seyssel, K.; Chiu, S.; Pan, P.; Lin, S.; Stanley, E.; Ament, Z.; West, J.A.; Summerhill, K.; Griffin, J.L.; et al. Odd Chain Fatty Acids; New Insights of the Relationship Between the Gut Microbiota, Dietary Intake, Biosynthesis and Glucose Intolerance. Sci. Rep. 2017, 7, 44845. [Google Scholar] [CrossRef] [Green Version]
- Nakamura, M.T.; Yudell, B.E.; Loor, J.J. Regulation of Energy Metabolism by Long-Chain Fatty Acids. Prog. Lipid Res. 2014, 53, 124–144. [Google Scholar] [CrossRef]
- Wymann, M.P.; Schneiter, R. Lipid Signalling in Disease. Nat. Rev. Mol. Cell Biol. 2008, 9, 162–176. [Google Scholar] [CrossRef] [Green Version]
- Harayama, T.; Riezman, H. Understanding the diversity of membrane lipid composition. Nat. Rev. Mol. Cell Biol. 2018, 19, 281–296. [Google Scholar] [CrossRef]
- May, F.J.; Baer, L.A.; Lehnig, A.C.; So, K.; Chen, E.Y.; Gao, F.; Narain, N.R.; Gushchina, L.; Rose, A.; Doseff, A.I.; et al. Lipidomic Adaptations in White and Brown Adipose Tissue in Response to Exercise Demonstrates Molecular Species-Specific Remodeling. Cell Rep. 2017, 18, 1558–1572. [Google Scholar] [CrossRef]
- Marcher, A.; Loft, A.; Nielsen, R.; Sysi-Aho, M.; Ekroos, K.; Mandrup, S.; Marcher, A.; Loft, A.; Nielsen, R.; Vihervaara, T.; et al. Reveal Extensive Changes of Glycerolipid Pathways in Brown Adipose Tissue in Response to Cold RNA-Seq and Mass-Spectrometry-Based Lipidomics Reveal Extensive Changes of Glycerolipid Pathways in Brown Adipose Tissue in Response to Cold. Cell Rep. 2015, 13, 2000–2013. [Google Scholar] [CrossRef] [Green Version]
- Pietiläinen, K.H.; Rog, T.; Seppänen-Laakso, T.; Virtue, S.; Peddinti, G.; Jing, T.; Rodriguez-Cuenca, S.; Arkadiusz, M.; Jussi, N.; Ruskeepaa, A.-L.; et al. Association of Lipidome Remodeling in the Adipocyte Membrane with Acquired Obesity in Humans. PLoS Biol. 2011, 9, e1000623. [Google Scholar] [CrossRef] [Green Version]
- Unger, R.H.; Orci, L. Diseases of Liporegulation: New Perspective on Obesity. FASEB J. 2001, 15, 312–321. [Google Scholar] [CrossRef] [PubMed]
- Sokolowska, E.; Blachnio-zabielska, A. The Role of Ceramides in Insulin Resistance. Front. Endocrinol 2019, 10, 577. [Google Scholar] [CrossRef] [PubMed] [Green Version]
- Kolak, M.; Westerbacka, J.; Velagapudi, V.R.; Wågsa, D.; Yetukuri, L.; Makkonen, J.; Rissanen, A.; Ha, A.; Lindell, M.; Bergholm, R.; et al. Adipose Tissue Inflammation and Increased Ceramide Content Characterize Subjects With High Liver Fat Content Independent of Obesity. Diabetes 2007, 56, 1960–1968. [Google Scholar] [CrossRef] [Green Version]
- Anjos, S.; Feiteira, E.; Cerveira, F.; Melo, T.; Reboredo, A.; Colombo, S.; Dantas, R.; Costa, E.; Moreira, A.; Santos, S.; et al. Lipidomics Reveals Similar Changes in Serum Phospholipid Signatures of Overweight and Obese Pediatric Subjects. J. Proteome Res. 2019, 18, 3174–3183. [Google Scholar] [CrossRef] [PubMed]
- Wang, Y.; Jiang, C.T.; Song, J.Y.; Song, Q.Y.; Ma, J.; Wang, H.J. Lipidomic Profile Revealed the Association of Plasma Lysophosphatidylcholines with Adolescent Obesity. BioMed Res. Int. 2019, 2019, 1382418. [Google Scholar] [CrossRef] [PubMed] [Green Version]
- Rodriguez-Cuenca, S.; Pellegrinelli, V.; Campbell, M.; Oresic, M.; Vidal-Puig, A. Sphingolipids and Glycerophospholipids—The “Ying and Yang” of Lipotoxicity in Metabolic Diseases. Prog. Lipid Res. 2017, 66, 14–29. [Google Scholar] [CrossRef] [Green Version]
- Rauschert, S.; Uhl, O.; Koletzko, B.; Kirchberg, F.; Mori, T.A.; Huang, R.C.; Beilin, L.J.; Hellmuth, C.; Oddy, W.H. Lipidomics Reveals Associations of Phospholipids With Obesity and Insulin Resistance in Young Adults. J. Clin. Endocrinol. Metab. 2016, 101, 871–879. [Google Scholar] [CrossRef]
- Styne, D.M.; Arslanian, S.A.; Connor, E.L.; Farooqi, I.S.; Murad, M.H.; Silverstein, J.H.; Yanovski, J.A. Pediatric Obesity-Assessment, Treatment, and Prevention: An Endocrine Society Clinical Practice Guideline. J. Clin. Endocrinol. Metab. 2017, 102, 709–757. [Google Scholar] [CrossRef] [Green Version]
- Vallés, M.M.; Comós, J.B. Obesidad y Síndrome Metabólico. Protoc. Diagn. Ter Pediatr. 2019, 1, 285–294. [Google Scholar]
- Sanders, F.W.B.; Acharjee, A.; Walker, C.; Marney, L.; Roberts, L.D.; Imamura, F.; Jenkins, B.; Case, J.; Ray, S.; Virtue, S.; et al. Hepatic Steatosis Risk Is Partly Driven by Increased de Novo Lipogenesis Following Carbohydrate Consumption. Genome Biol. 2018, 19, 79. [Google Scholar] [CrossRef] [Green Version]
- Harshfield, E.L.; Koulman, A.; Ziemek, D.; Marney, L.; Fauman, E.B.; Paul, D.S.; Stacey, D.; Rasheed, A.; Lee, J.J.; Shah, N.; et al. An Unbiased Lipid Phenotyping Approach To Study the Genetic Determinants of Lipids and Their Association with Coronary Heart Disease Risk Factors. J. Proteome Res. 2019, 18, 2397–2410. [Google Scholar] [CrossRef]
- Smyth, G.K. Linear Models and Empirical Bayes Methods for Assessing Differential Expression in Microarray Experiments. Stat. Appl. Genet. Mol. Biol. 2004, 3, 1–25. [Google Scholar] [CrossRef]
- Hasson, U.; Furman, O.; Clark, D.; Dudai, Y.; Davachi, L. Enhanced Intersubject Correlations during Movie Viewing Correlate with Successful Episodic Encoding. Neuron 2008, 57, 452–462. [Google Scholar] [CrossRef] [Green Version]
- Lopez-Clavijo, A.F.; Gaud, C.; Sousa, B.; Nguyen, A.; Fedorova, M.; Ni, Z.; O’Donnell, V.B.; Wakelam, M.J.O.; Andrews, S. BioPAN: A Web-Based Tool to Explore Mammalian Lipidome Metabolic Pathways on LIPID MAPS. F1000Research 2021, 10, 4. [Google Scholar] [CrossRef]
- Horrobin, D.F. The Membrane Phospholipid Hypothesis as a Biochemical Basis for the Neurodevelopmental Concept of Schizophrenia. Schizophr. Res. 1998, 30, 193–208. [Google Scholar] [CrossRef]
- Hartmann, T.; Kuchenbecker, J.; Grimm, M.O.W. Alzheimer’s Disease: The Lipid Connection. J. Neurochem. 2007, 103, 159–170. [Google Scholar] [CrossRef]
- Lusis, A.J. Atherosclerosis. Nature 2010, 407, 233–241. [Google Scholar] [CrossRef]
- Menendez, J.A.; Lupu, R. Fatty Acid Synthase and the Lipogenic Phenotype in Cancer Pathogenesis. Nat. Rev. Cancer 2007, 7, 763–777. [Google Scholar] [CrossRef]
- Syme, C.; Czajkowski, S.; Shin, J.; Abrahamowicz, M.; Leonard, G.; Perron, M.; Richer, L.; Veillette, S.; Gaudet, D.; Strug, L.; et al. Glycerophosphocholine Metabolites and Cardiovascular Disease Risk Factors in Adolescents: A Cohort Study. Circulation 2016, 134, 1629–1636. [Google Scholar] [CrossRef]
- Reinehr, T.; Wolters, B.; Knop, C.; Lass, N.; Hellmuth, C.; Harder, U.; Peissner, W.; Wahl, S.; Grallert, H.; Adamski, J.; et al. Changes in the Serum Metabolite Profile in Obese Children with Weight Loss. Eur. J. Nutr. 2015, 54, 173–181. [Google Scholar] [CrossRef]
- Balagopal, P.; de Ferranti, S.D.; Cook, S.; Daniels, S.R.; Gidding, S.S.; Hayman, L.L.; McCrindle, B.W.; Mietus-Snyder, M.L.; Steinberger, J. AHA Scientific Statement Nontraditional Risk Factors and Biomarkers for Cardiovascular Disease: Mechanistic, Research, and Clinical Considerations for Youth A Scientific Statement From the American Heart Association. Circulation 2011, 23, 2749–2769. [Google Scholar] [CrossRef] [Green Version]
- Farpour-Lambert, N.J.; Martin, X.E.; Bucher Della Torre, S.; Von Haller, L.; Ells, L.J.; Herrmann, F.R.; Aggoun, Y. Effectiveness of Individual and Group Programmes to Treat Obesity and Reduce Cardiovascular Disease Risk Factors in Pre-Pubertal Children. Clin. Obes. 2019, 9, e12335. [Google Scholar] [CrossRef] [PubMed] [Green Version]
- Sirico, F.; Bianco, A.; D’Alicandro, G.; Castaldo, C.; Montagnani, S.; Spera, R.; Di Meglio, F.; Nurzynska, D. Effects of Physical Exercise on Adiponectin, Leptin, and Inflammatory Markers in Childhood Obesity: Systematic Review and Meta-Analysis. Child. Obes. 2018, 14, 207–217. [Google Scholar] [CrossRef] [PubMed] [Green Version]
- Blüher, S.; Panagiotou, G.; Petroff, D.; Markert, J.; Wagner, A.; Klemm, T.; Filippaios, A.; Keller, A.; Mantzoros, C.S. Effects of a 1-Year Exercise and Lifestyle Intervention on Irisin, Adipokines, and Inflammatory Markers in Obese Children. Obesity 2014, 22, 1701–1708. [Google Scholar] [CrossRef] [PubMed]
- Ramos-Molina, B.; Castellano-Castillo, D.; Alcaide-Torres, J.; Pastor, Ó.; de Luna Díaz, R.; Salas-Salvadó, J.; López-Moreno, J.; Fernández-García, J.C.; Macías-González, M.; Cardona, F.; et al. Differential Effects of Restrictive and Malabsorptive Bariatric Surgery Procedures on the Serum Lipidome in Obese Subjects. J. Clin. Lipidol. 2018, 12, 1502–1512. [Google Scholar] [CrossRef]
- Gu, L.; Huang, X.; Li, S.; Mao, D.; Shen, Z.; Khadaroo, P.A.; Ng, D.M.; Chen, P. A Meta-Analysis of the Medium- and Long-Term Effects of Laparoscopic Sleeve Gastrectomy and Laparoscopic Roux-En-Y Gastric Bypass. BMC Surg. 2020, 20, 30. [Google Scholar] [CrossRef] [Green Version]
- Kontush, A.; Lhomme, M.; Chapman, M.J. Unraveling the Complexities of the HDL Lipidome. J. Lipid Res. 2013, 54, 2950–2963. [Google Scholar] [CrossRef] [Green Version]
- Tanaka, Y.; Shimanaka, Y.; Caddeo, A.; Kubo, T.; Mao, Y.; Kubota, T.; Kubota, N.; Yamauchi, T.; Mancina, R.M.; Baselli, G.; et al. LPIAT1/MBOAT7 Depletion Increases Triglyceride Synthesis Fueled by High Phosphatidylinositol Turnover. Gut 2021, 70, 180–193. [Google Scholar] [CrossRef]
- Hannun, Y.A.; Obeid, L.M. Sphingolipids and Their Metabolism in Physiology and Disease. Nat. Rev. Mol. Cell Biol. 2018, 19, 175–191. [Google Scholar] [CrossRef]
- Kayser, B.D.; Lhomme, M.; Dao, M.C.; Ichou, F.; Bouillot, J.L.; Prifti, E.; Kontush, A.; Chevallier, J.M.; Aron-Wisnewsky, J.; Dugail, I.; et al. Serum Lipidomics Reveals Early Differential Effects of Gastric Bypass Compared with Banding on Phospholipids and Sphingolipids Independent of Differences in Weight Loss. Int. J. Obes. 2017, 41, 917–925. [Google Scholar] [CrossRef] [PubMed] [Green Version]
- Bajnok, L.; Seres, I.; Varga, Z.; Jeges, S.; Peti, A.; Karanyi, Z.; Juhasz, A.; Csongradi, E.; Mezosi, E.; Nagy, E.V.; et al. Relationship of Endogenous Hyperleptinemia to Serum Paraoxonase 1, Cholesteryl Ester Transfer Protein, and Lecithin Cholesterol Acyltransferase in Obese Individuals. Metabolism 2007, 56, 1542–1549. [Google Scholar] [CrossRef] [PubMed]
- Mayneris-Perxachs, J.; Mousa, A.; Naderpoor, N.; Fernández-Real, J.M.; de Courten, B. Plasma Phospholipids with Long-Chain Polyunsaturated Fatty Acids and Dihydroceramides at the Crossroads of Iron Stores and Insulin Resistance. Mol. Nutr. Food Res. 2020, 64, 1901055. [Google Scholar] [CrossRef]


| Pediatric (Total n = 10) | Adult (Total n = 30) | |||||
|---|---|---|---|---|---|---|
| n (%) [CI] | n (%) [CI] | |||||
| Male/female sex | 7/3 (70/30) | 9/21 (33.3/66.7) | ||||
| Sleeve gastrectomy | 0 (0) | 13 (43.3) [29.9; 70.1] | ||||
| Roux-en-Y gastric bypass | 0 (0) | 17 (56.7) [29.9; 70.1] | ||||
| mean (sd) | mean (sd) | |||||
| Age (years) | 14 (2.3) | 51.2 (9.3) | ||||
| Pediatric (Total n = 10) | p-Value | Adult (Total n = 30) | p-Value | |||
| mean (sd) | mean (sd) | mean (sd) | mean (sd) | |||
| T0 | T6 | T0 | T6 | |||
| Height (cm) | 160 (10) | 160 (10) | 0.72 | 170 (10) | 170 (10) | |
| Weight (kg) | 86 (21.3) | 83.5 (22.1) | 0.42 | 118.4 (23.3) | 87.9 (14.8) | <0.001 |
| Waist circumference (cm) | 111.6 (11) | 110 (14) | 0.86 | 133.8 (13.6) | 106.5 (12.4) | <0.001 |
| BMI (kg/m2) range | 34 (5.5) (27.5–43.3) | 33.1 (6.1) (25.8–42.8) | 0.36 | 43.2 (5.5) (36.5–65) | 32.1 (3.4) (25.3–42.1) | <0.001 |
| Glucose (mg/dL) | 88.1 (5.7) | 87.6 (4.8) | 1 | 101.1 (26.7) | 88.4 (10.5) | 0.01 |
| Insulin (mUI/L) | 17.6 (7) | 16.5 (6) | 0.85 | 8.9 (7.2) | 6.7 (2.4) | 0.27 |
| HbA1c (mmol/mol) | 33.3 (1.3) | 33.3 (1.3) | 0.75 | 37 (8.6) | 33.5 (3) | <0.001 |
| HOMA-IR | 3.9 (1.7) | 3.5 (1.3) | 0.56 | 2.4 (2.6) | 1.5 (0.6) | 0.1 |
| Urea (mg/dL) | 27.1 (4) | 27.6 (6.5) | 0.65 | 29.8 (16.3) | 30.9 (9.1) | 0.03 |
| Creatinine (mg/dL) | 0.6 (0.1) | 0.7 (0.1) | 0.15 | 0.8 (0.2) | 0.7 (0.1) | 0.19 |
| AST (IU/L) | 24.8 (10.2) | 24.5 (7.8) | 1 | 44.5 (18.4) | 21.2 (5.5) | 0.008 |
| ALT (IU/L) | 33.1 (30.3) | 23.6 (19.6) | 0.19 | 29.4 (16.4) | 21.1 (10.3) | 0.006 |
| GGT (IU/L) | 16.8 (4.0) | 16.5 (3.1) | 0.76 | 29.3 (28.7) | 21.3 (20) | <0.001 |
| TG (mg/dL) | 119.4 (53.2) | 103.3 (33.6) | 0.23 | 129.8 (41) | 86.6 (25.6) | <0.001 |
| LDL-c (mg/dL) | 114.9 (28.6) | 105.4 (24.2) | 0.04 | 85.9 (31.4) | 107.5 (26.6) | <0.001 |
| HDL-c (mg/dL) | 43.9 (9.7) | 45.4 (8.7) | 0.39 | 37.9 (9.7) | 49 (18.3) | <0.001 |
| Cholesterol (mg/dL) | 177.2 (38.6) | 171.1 (32.1) | 0.44 | 149 (38.1) | 170.1 (33.1) | 0.005 |
| Total protein (g/L) | 73.4 (4.1) | 74.8 (4.5) | 0.72 | 65.2 (12.7) | 66.8 (3.9) | 0.65 |
| FLI | 79.2 (16.0) | 75.7 (18.7) | 0.29 | 97.0 (2.6) | 61.5 (21.1) | <0.001 |
| Expression Pattern | Subclass | Lipid Species | Clinical Variable | Correlation Coefficient | p-Value | FDR |
|---|---|---|---|---|---|---|
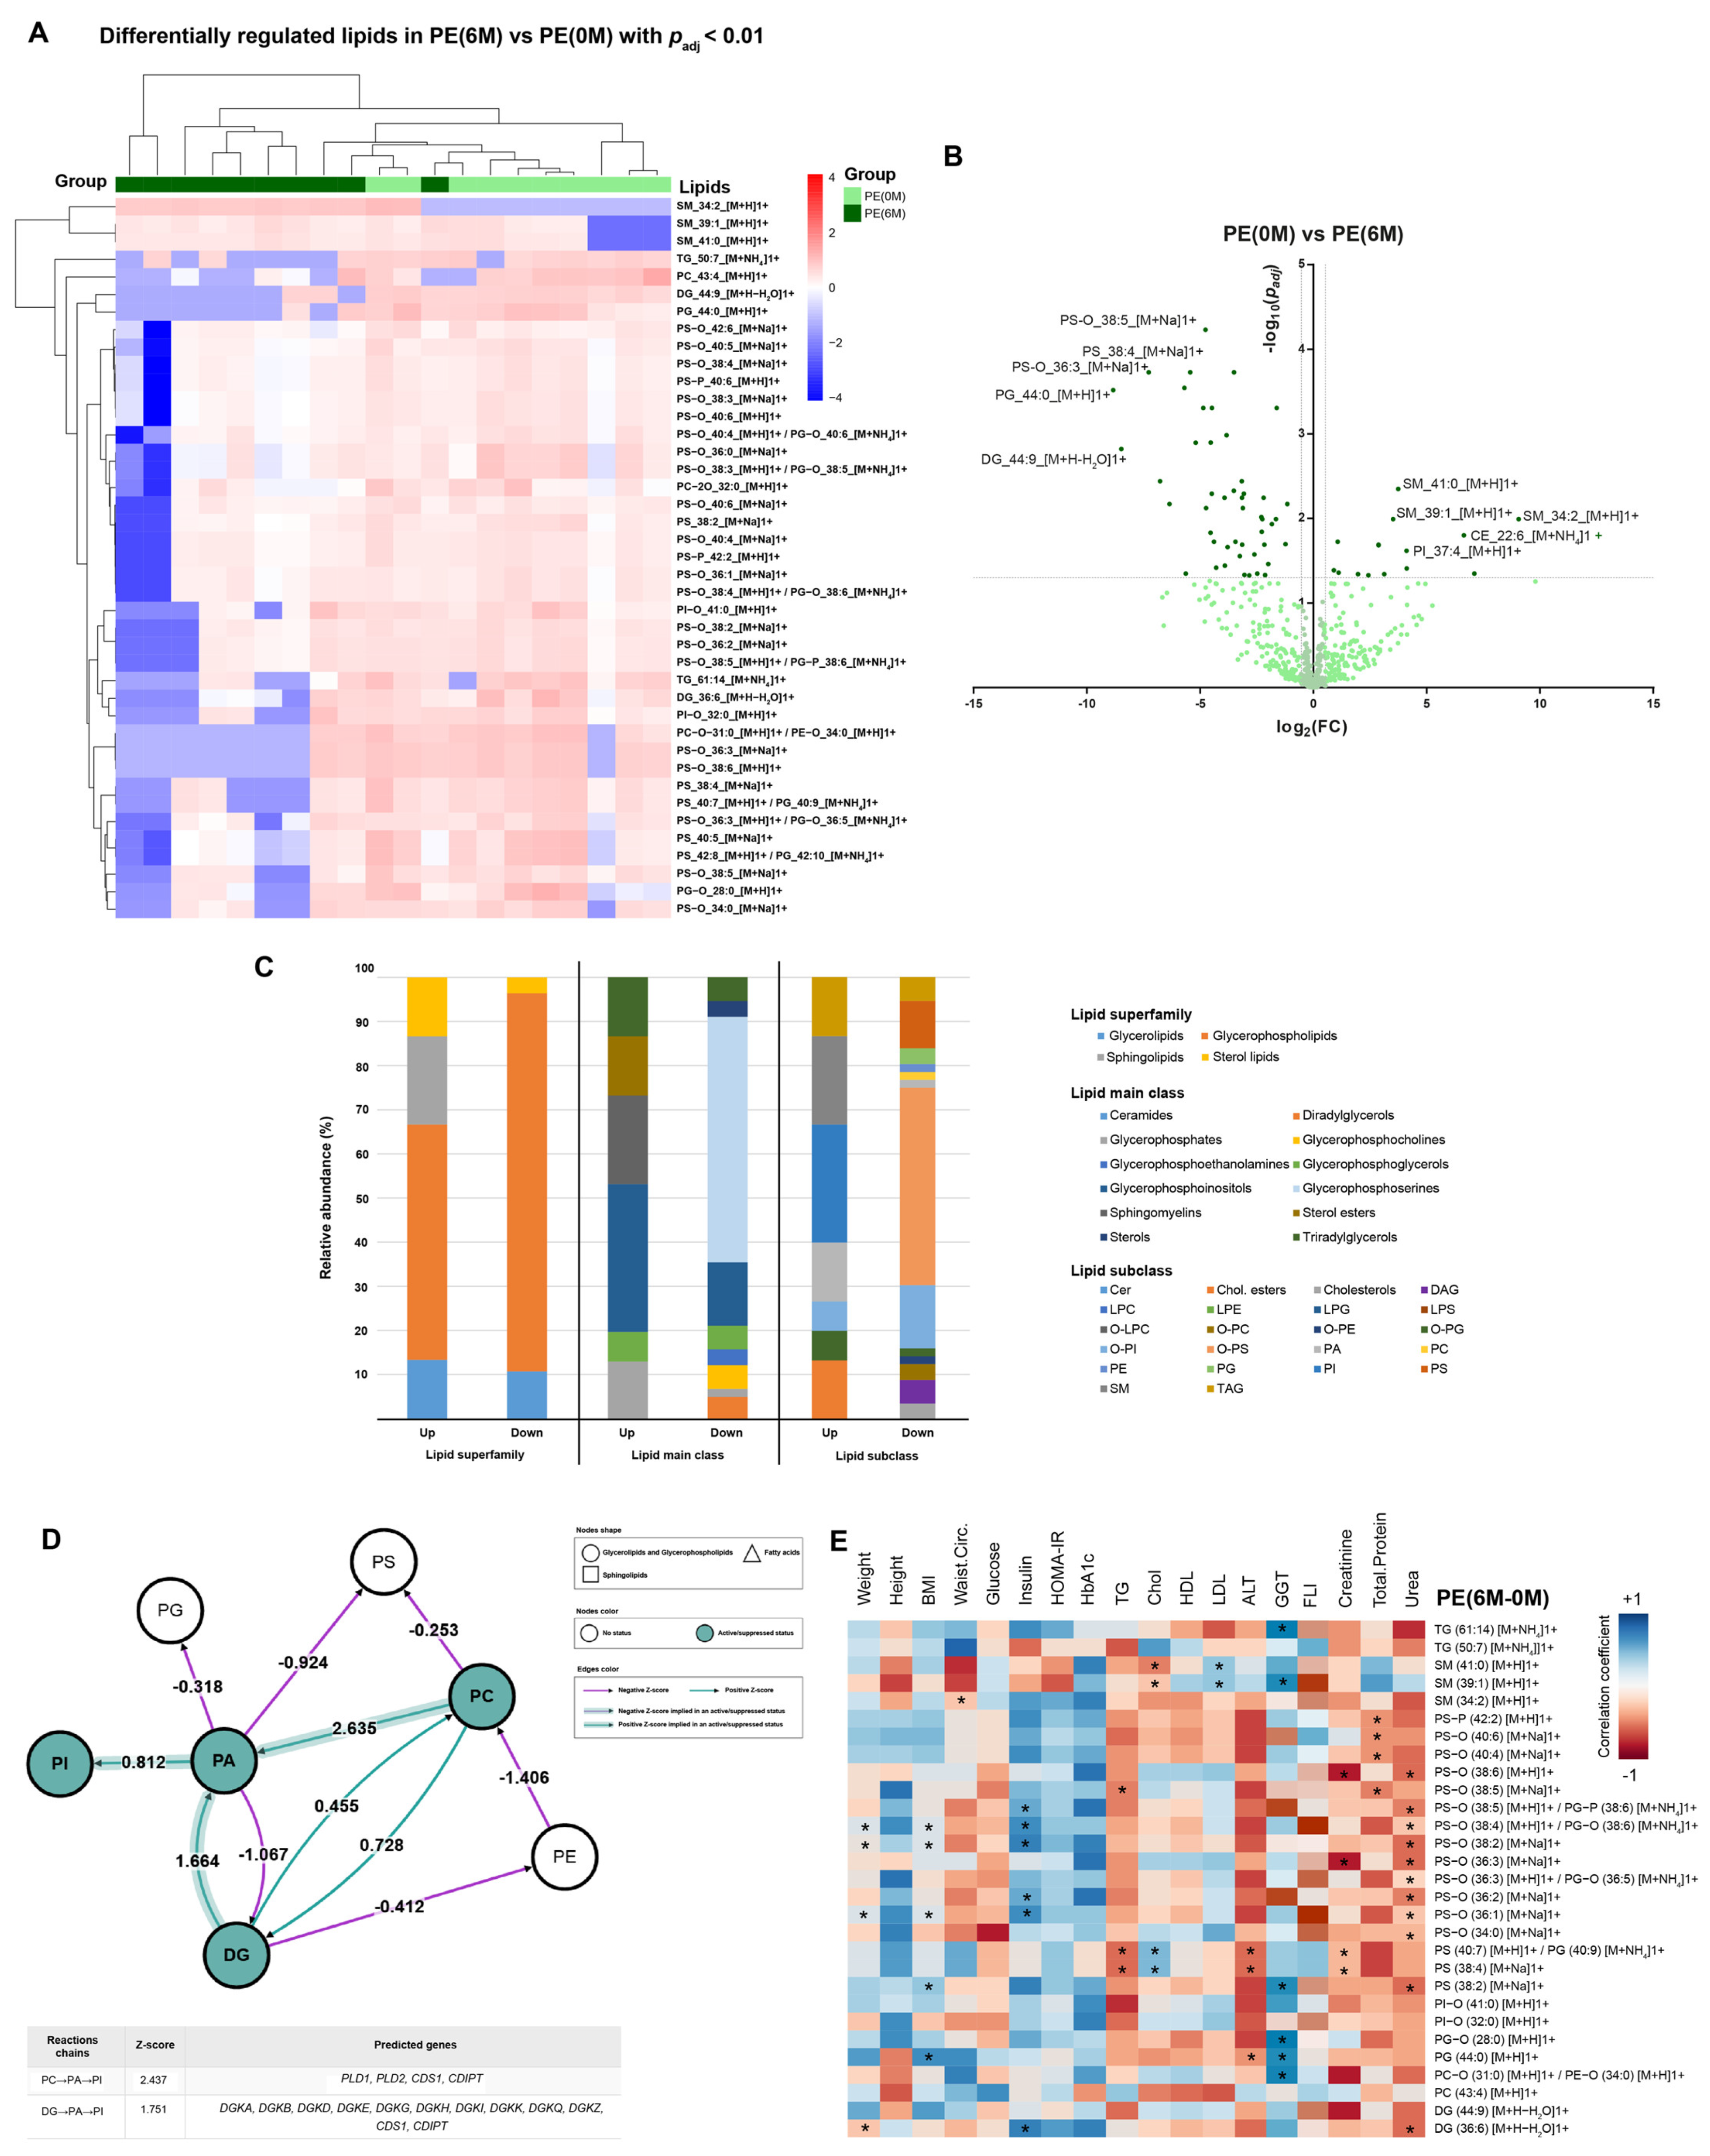
| PE (6 M-0 M) | ||||||
| Upregulated | SM | SM (39:1) [M+H]1+ | Chol | 0.6848 | 0.0289 | 0.1430 |
| SM (41:0) [M+H]1+ | Chol | 0.8303 | 0.0029 | 0.0410 | ||
| SM (39:1) [M+H]1+ | LDL | 0.7356 | 0.0153 | 0.1046 | ||
| SM (41:0) [M+H]1+ | LDL | 0.8389 | 0.0024 | 0.0365 | ||
| SM (34:2) [M+H]1+ | Waist Circ. | −0.8857 | 0.0188 | 0.1108 | ||
| Downregulated | O-PS | PS-O (36:1) [M+Na]1+ | BMI | 0.6833 | 0.0424 | 0.1821 |
| PS-O (38:2) [M+Na]1+ | BMI | 0.6778 | 0.0448 | 0.1864 | ||
| PS-O (38:4) [M+H]1+/PG-O (38:6) [M+NH4]1+ | BMI | 0.6833 | 0.0424 | 0.1821 | ||
| PS-O (36:1) [M+Na]1+ | Weight | 0.7667 | 0.0159 | 0.1057 | ||
| PS-O (38:2) [M+Na]1+ | Weight | 0.7448 | 0.0213 | 0.1206 | ||
| PS-O (38:4) [M+H]1+/PG-O (38:6) [M+NH4]1+ | Weight | 0.7667 | 0.0159 | 0.1057 | ||
| PS-O (36:2) [M+Na]1+ | Insulin | 0.6442 | 0.0444 | 0.1854 | ||
| PS-O (36:1) [M+Na]1+ | Insulin | 0.6809 | 0.0302 | 0.1452 | ||
| PS-O (38:4) [M+H]1+/PG-O (38:6) [M+NH4]1+ | Insulin | 0.6809 | 0.0302 | 0.1452 | ||
| PS-O (38:2) [M+Na]1+ | Insulin | 0.7301 | 0.0165 | 0.1082 | ||
| PS-O (38:5) [M+H]1+/PG-P (38:6) [M+NH4]1+ | Insulin | 0.6442 | 0.0444 | 0.1854 | ||
| PS-O (34:0) [M+Na]1+ | Urea | −0.7150 | 0.0201 | 0.1158 | ||
| PS-O (36:1) [M+Na]1+ | Urea | −0.7256 | 0.0175 | 0.1108 | ||
| PS-O (36:2) [M+Na]1+ | Urea | −0.8923 | 0.0005 | 0.0131 | ||
| PS-O (36:3) [M+H]1+/PG-O (36:5) [M+NH4]1+ | Urea | −0.7323 | 0.0160 | 0.1057 | ||
| PS-O (36:3) [M+Na]1+ | Urea | −0.7330 | 0.0159 | 0.1057 | ||
| PS-O (38:2) [M+Na]1+ | Urea | −0.9354 | 0.0001 | 0.0030 | ||
| PS-O (38:4) [M+H]1+/PG-O (38:6) [M+NH4]1+ | Urea | −0.7256 | 0.0175 | 0.1108 | ||
| PS-O (38:5) [M+H]1+/PG-P (38:6) [M+NH4]1+ | Urea | −0.8923 | 0.0005 | 0.0131 | ||
| PS-O (38:6) [M+H]1+ | Urea | −0.7330 | 0.0159 | 0.1057 | ||
| PS-O (36:3) [M+Na]1+ | Creatinine | −0.6507 | 0.0416 | 0.1806 | ||
| PS-O (38:6) [M+H]1+ | Creatinine | −0.6507 | 0.0416 | 0.1806 | ||
| PS-O (38:5) [M+Na]1+ | TG | −0.6868 | 0.0283 | 0.1413 | ||
| PS-O (38:5) [M+Na]1+ | Total Protein | −0.7254 | 0.0176 | 0.1108 | ||
| PS-O (40:4) [M+Na]1+ | Total Protein | −0.9179 | 0.0002 | 0.0060 | ||
| PS-O (40:6) [M+Na]1+ | Total Protein | −0.7720 | 0.0089 | 0.0707 | ||
| PS-P (42:2) [M+H]1+ | Total Protein | −0.9179 | 0.0002 | 0.0060 | ||
| PS | PS (38:2) [M+Na]1+ | BMI | 0.7000 | 0.0358 | 0.1639 | |
| PS (38:2) [M+Na]1+ | Urea | −0.7561 | 0.0114 | 0.0868 | ||
| PS (38:4) [M+Na]1+ | ALT | −0.7241 | 0.0274 | 0.1383 | ||
| PS (40:7) [M+H]1+/PG (40:9) [M+NH4]1+ | ALT | −0.7241 | 0.0274 | 0.1383 | ||
| PS (38:4) [M+Na]1+ | Chol | −0.6659 | 0.0356 | 0.1637 | ||
| PS (40:7) [M+H]1+/PG (40:9) [M+NH4]1+ | Chol | −0.6659 | 0.0356 | 0.1637 | ||
| PS (38:4) [M+Na]1+ | Creatinine | −0.7393 | 0.0146 | 0.1008 | ||
| PS (40:7) [M+H]1+/PG (40:9) [M+NH4]1+ | Creatinine | −0.7393 | 0.0146 | 0.1008 | ||
| PS (38:4) [M+Na]1+ | TG | −0.7847 | 0.0072 | 0.0622 | ||
| PS (40:7) [M+H]1+/PG (40:9) [M+NH4]1+ | TG | −0.7847 | 0.0072 | 0.0622 | ||
| DG | DG (36:6) [M+H-H2O]1+ | Insulin | 0.7128 | 0.0207 | 0.1183 | |
| DG (36:6) [M+H-H2O]1+ | Weight | 0.7120 | 0.0314 | 0.1503 | ||
| DG (36:6) [M+H-H2O]1+ | Urea | −0.8655 | 0.0012 | 0.0250 | ||
| PG | PG (44:0) [M+H]1+ | BMI | 0.6832 | 0.0425 | 0.1821 | |
| PG (44:0) [M+H]1+ | ALT | −0.7250 | 0.0271 | 0.1383 | ||
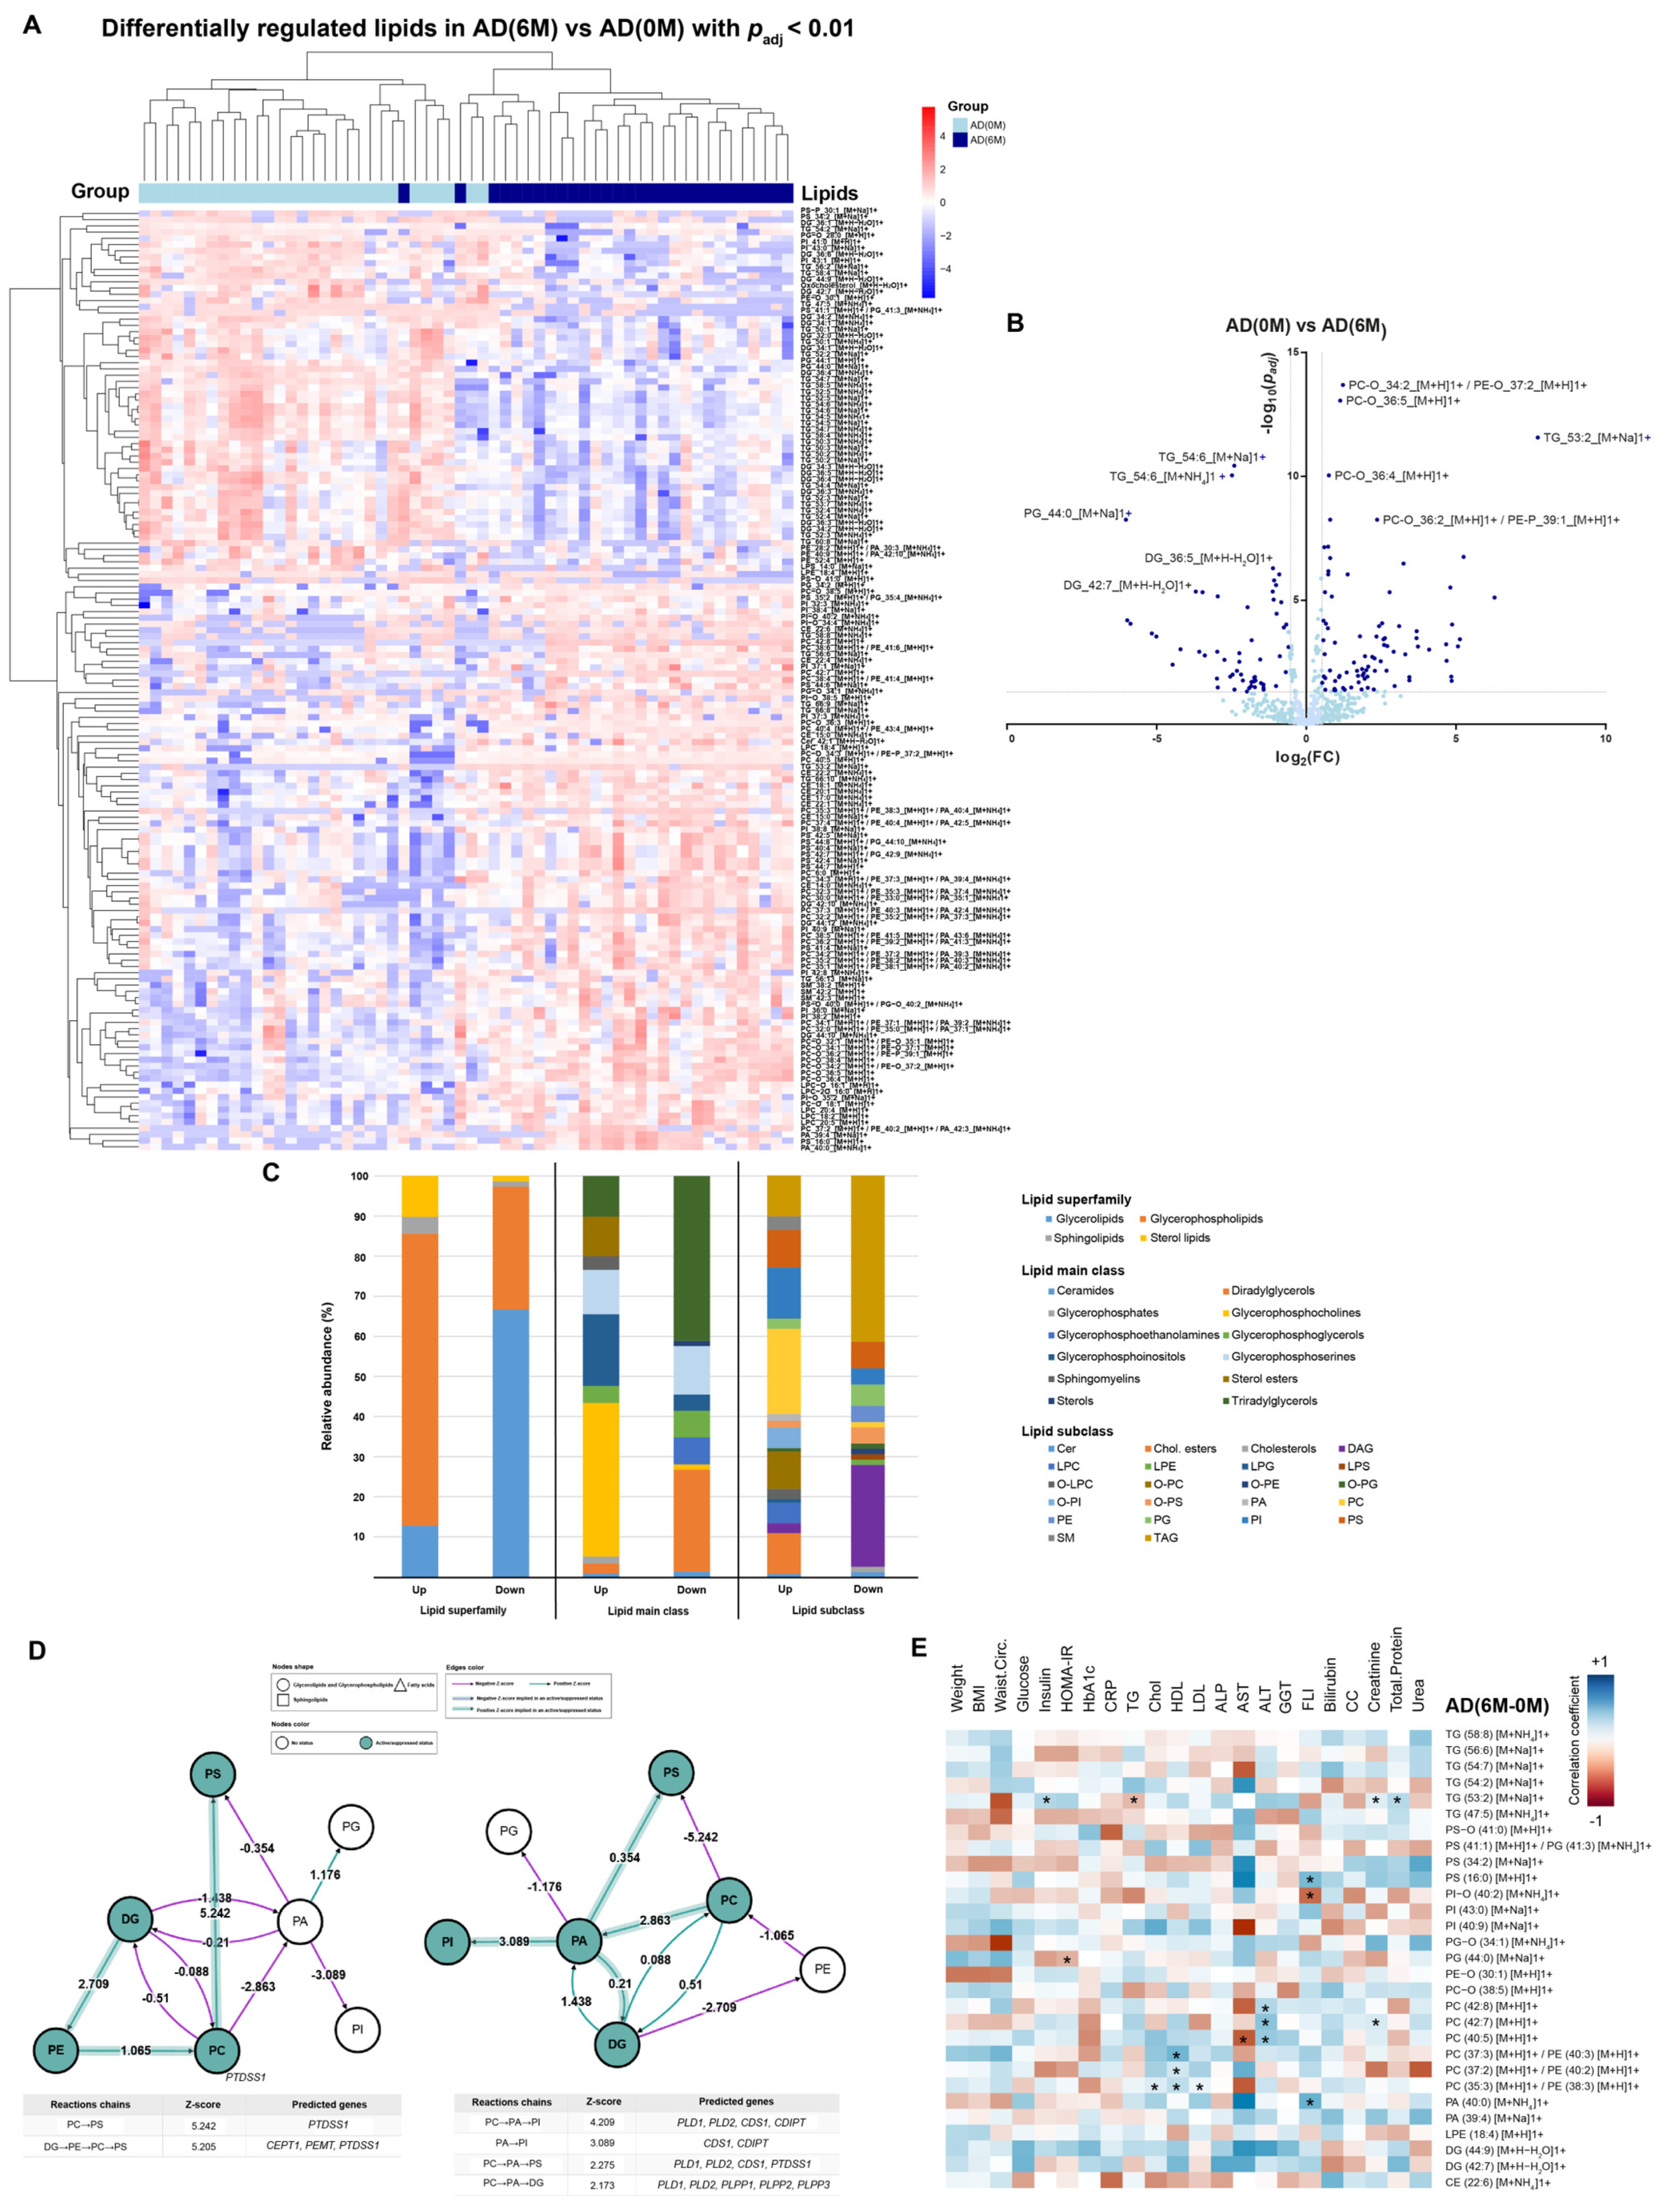
| AD (6 M-0 M) | ||||||
| Upregulated | PC | PC (35:3) [M+H]1+/PE (38:3) [M+H]1+/PA (40:4) [M+NH4]1+ | Chol | 0.4921 | 0.0057 | 0.1558 |
| PC (35:3) [M+H]1+/PE (38:3) [M+H]1+/PA (40:4) [M+NH4]1+ | LDL | 0.4179 | 0.0215 | 0.3750 | ||
| PC (35:3) [M+H]1+/PE (38:3) [M+H]1+/PA (40:4) [M+NH4]1+ | HDL | 0.5692 | 0.0010 | 0.0444 | ||
| PC (37:2) [M+H]1+/PE (40:2) [M+H]1+/PA (42:3) [M+NH4]1+ | HDL | 0.3649 | 0.0474 | 0.4911 | ||
| PC (37:3) [M+H]1+/PE (40:3) [M+H]1+/PA (42:4) [M+NH4]1+ | HDL | 0.4472 | 0.0132 | 0.2858 | ||
| PC (40:5) [M+H]1+ | AST | 0.5091 | 0.0041 | 0.1205 | ||
| PC (40:5) [M+H]1+ | ALT | 0.5356 | 0.0023 | 0.0810 | ||
| PC (42:7) [M+H]1+ | ALT | 0.3622 | 0.0492 | 0.4937 | ||
| PC (42:8) [M+H]1+ | ALT | 0.4208 | 0.0206 | 0.3748 | ||
| PC (42:7) [M+H]1+ | Total Protein | −0.4093 | 0.0247 | 0.3793 | ||
| Downregulated | TG | TG (53:2) [M+Na]1+ | Insulin | 0.3706 | 0.0438 | 0.4694 |
| TG (53:2) [M+Na]1+ | TG | 0.8158 | 0.0000 | 0.0000 | ||
| TG (53:2) [M+Na]1+ | Total Protein | 0.3971 | 0.0298 | 0.3994 | ||
| TG (53:2) [M+Na]1+ | Urea | 0.3921 | 0.0321 | 0.4096 | ||
| TG (54:2) [M+Na]1+ | HbA1c | −0.4011 | 0.0280 | 0.3857 | ||
| PG | PG (44:0) [M+Na]1+ | HOMA.IR | 0.3814 | 0.0376 | 0.4559 | |
Disclaimer/Publisher’s Note: The statements, opinions and data contained in all publications are solely those of the individual author(s) and contributor(s) and not of MDPI and/or the editor(s). MDPI and/or the editor(s) disclaim responsibility for any injury to people or property resulting from any ideas, methods, instructions or products referred to in the content. |
© 2023 by the authors. Licensee MDPI, Basel, Switzerland. This article is an open access article distributed under the terms and conditions of the Creative Commons Attribution (CC BY) license (https://creativecommons.org/licenses/by/4.0/).
Share and Cite
Soria-Gondek, A.; Fernández-García, P.; González, L.; Reyes-Farias, M.; Murillo, M.; Valls, A.; Real, N.; Pellitero, S.; Tarascó, J.; Jenkins, B.; et al. Lipidome Profiling in Childhood Obesity Compared to Adults: A Pilot Study. Nutrients 2023, 15, 3341. https://doi.org/10.3390/nu15153341
Soria-Gondek A, Fernández-García P, González L, Reyes-Farias M, Murillo M, Valls A, Real N, Pellitero S, Tarascó J, Jenkins B, et al. Lipidome Profiling in Childhood Obesity Compared to Adults: A Pilot Study. Nutrients. 2023; 15(15):3341. https://doi.org/10.3390/nu15153341
Chicago/Turabian StyleSoria-Gondek, Andrea, Pablo Fernández-García, Lorena González, Marjorie Reyes-Farias, Marta Murillo, Aina Valls, Nativitat Real, Silvia Pellitero, Jordi Tarascó, Benjamin Jenkins, and et al. 2023. "Lipidome Profiling in Childhood Obesity Compared to Adults: A Pilot Study" Nutrients 15, no. 15: 3341. https://doi.org/10.3390/nu15153341