Diet Quality Trajectories over Adulthood in a Biracial Urban Sample from the Healthy Aging in Neighborhoods of Diversity across the Life Span Study
Abstract
1. Introduction
2. Methods
2.1. HANDLS Study
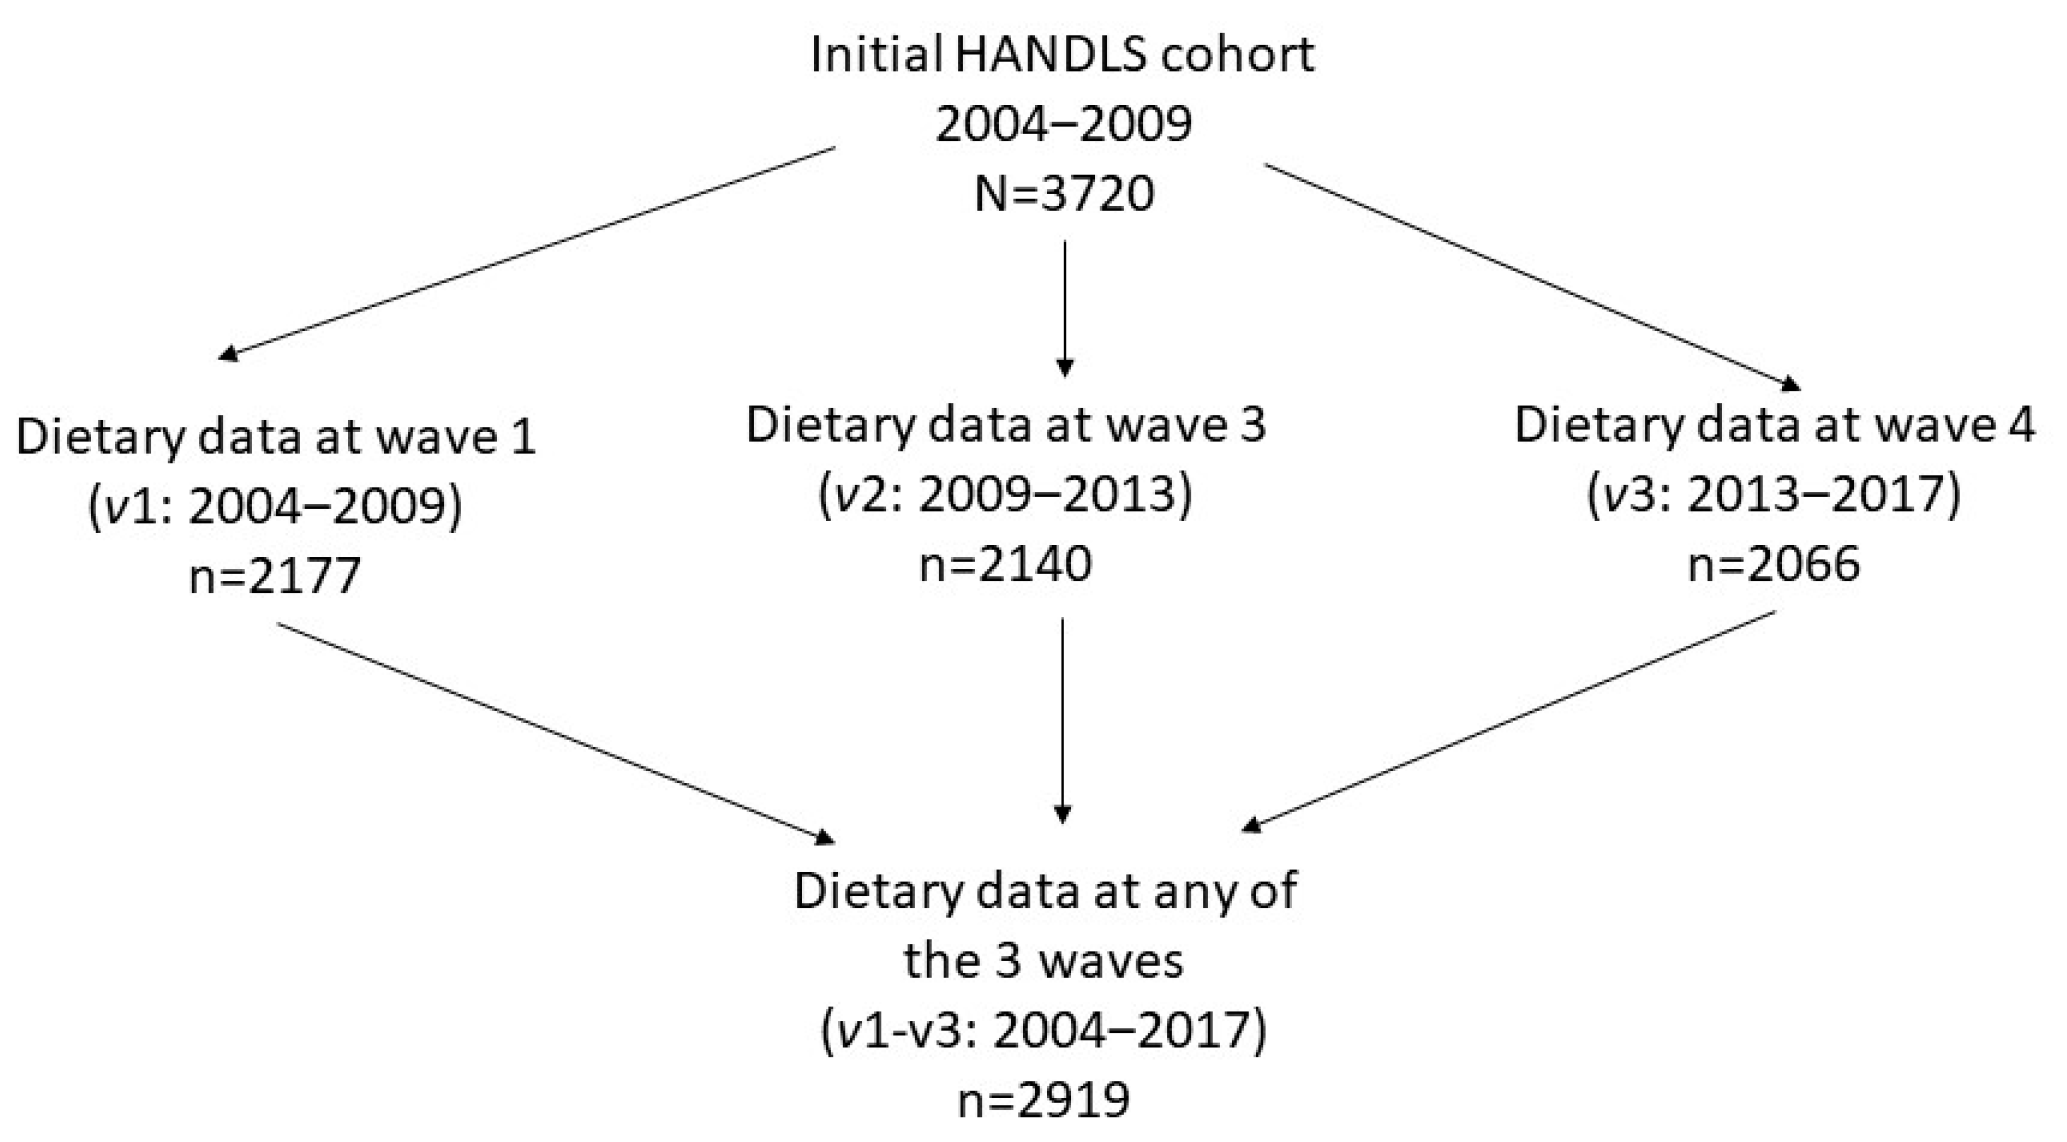
2.2. Study Participants
2.3. Participant Characteristics
2.4. Dietary Collection Method
2.5. Diet Quality Indices
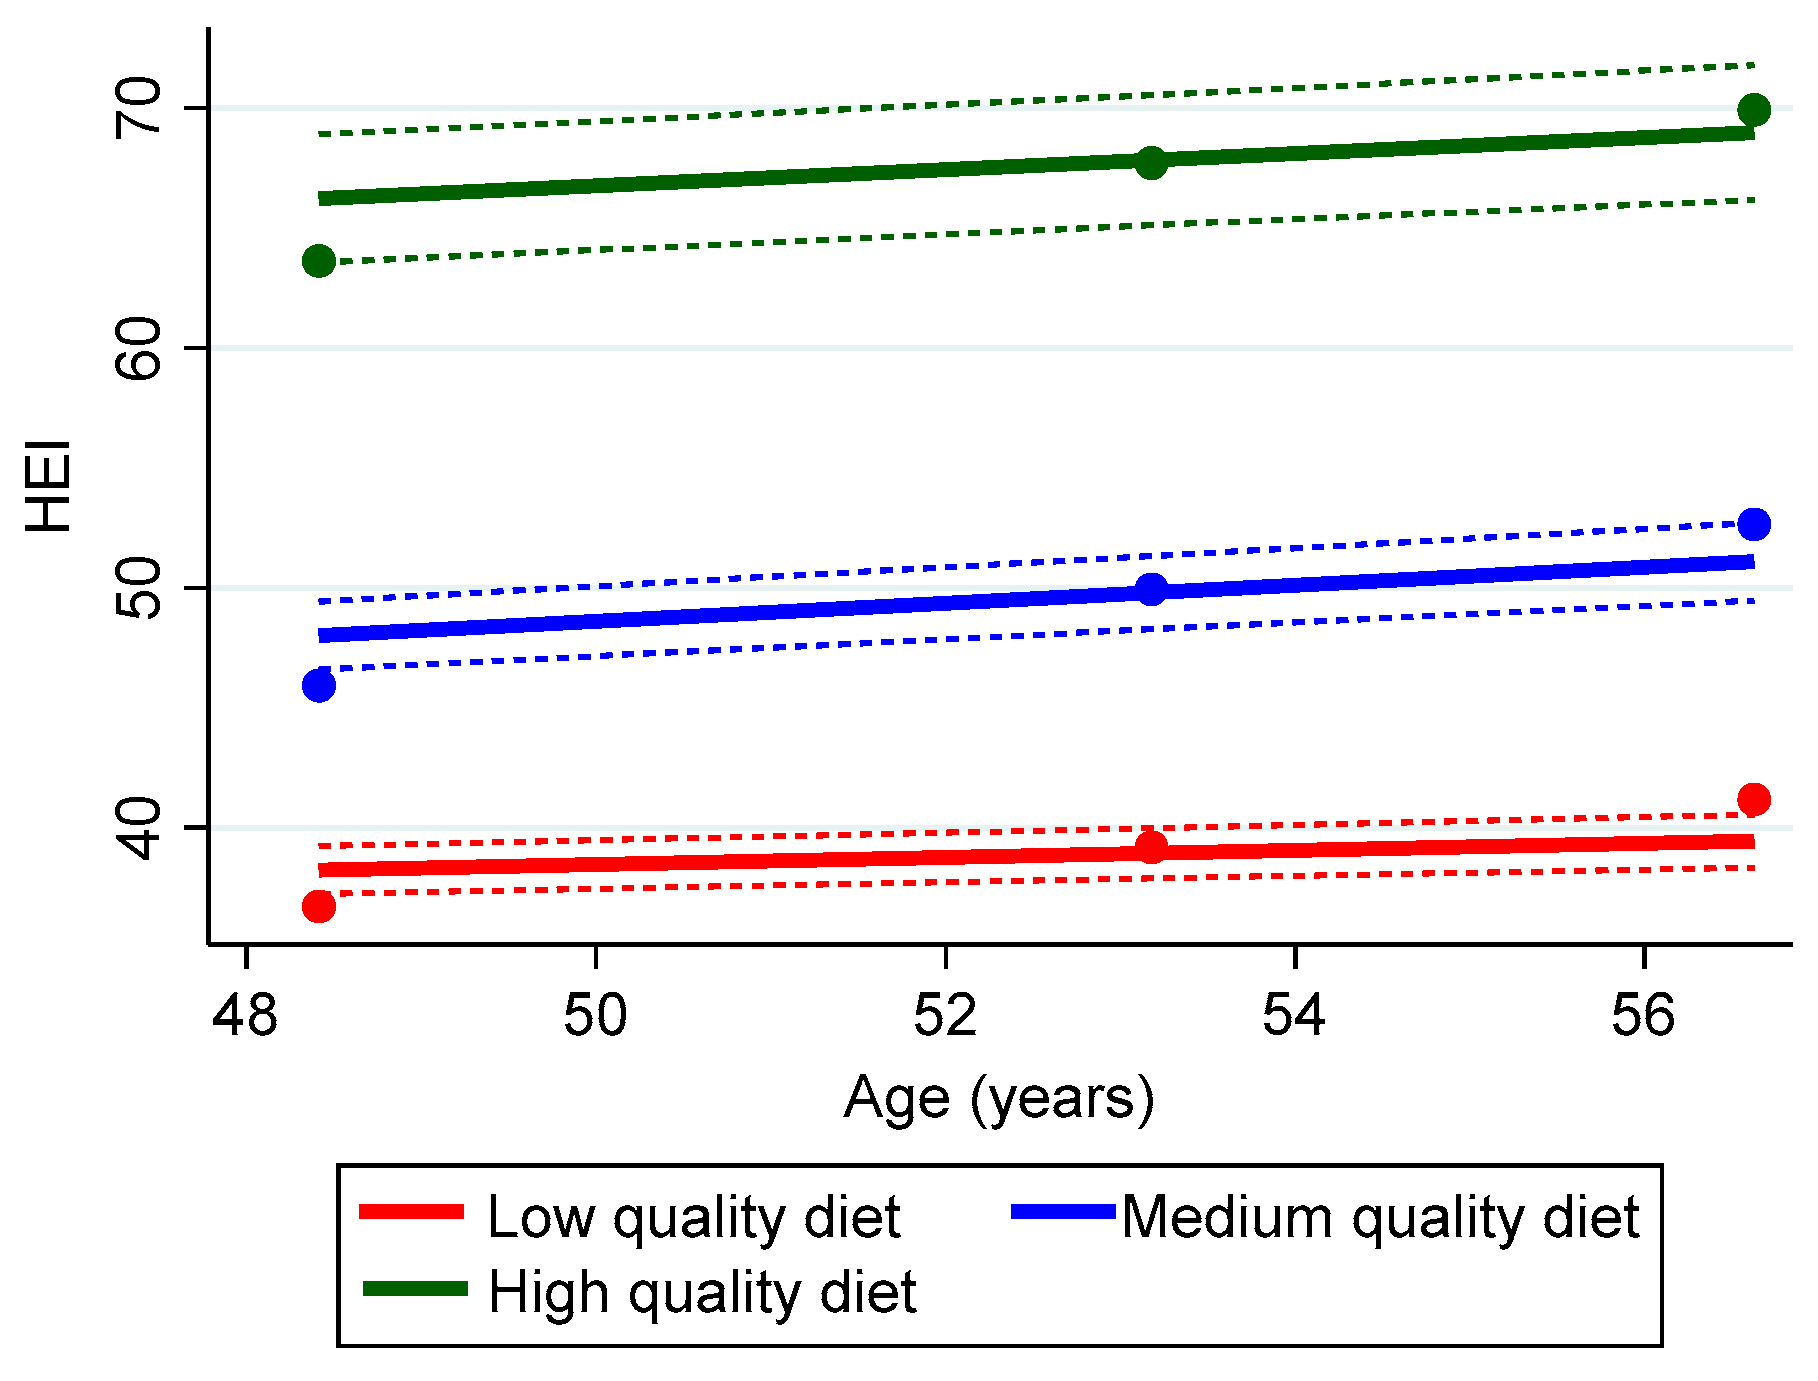
2.5.1. Healthy Eating Index (HEI)-2010
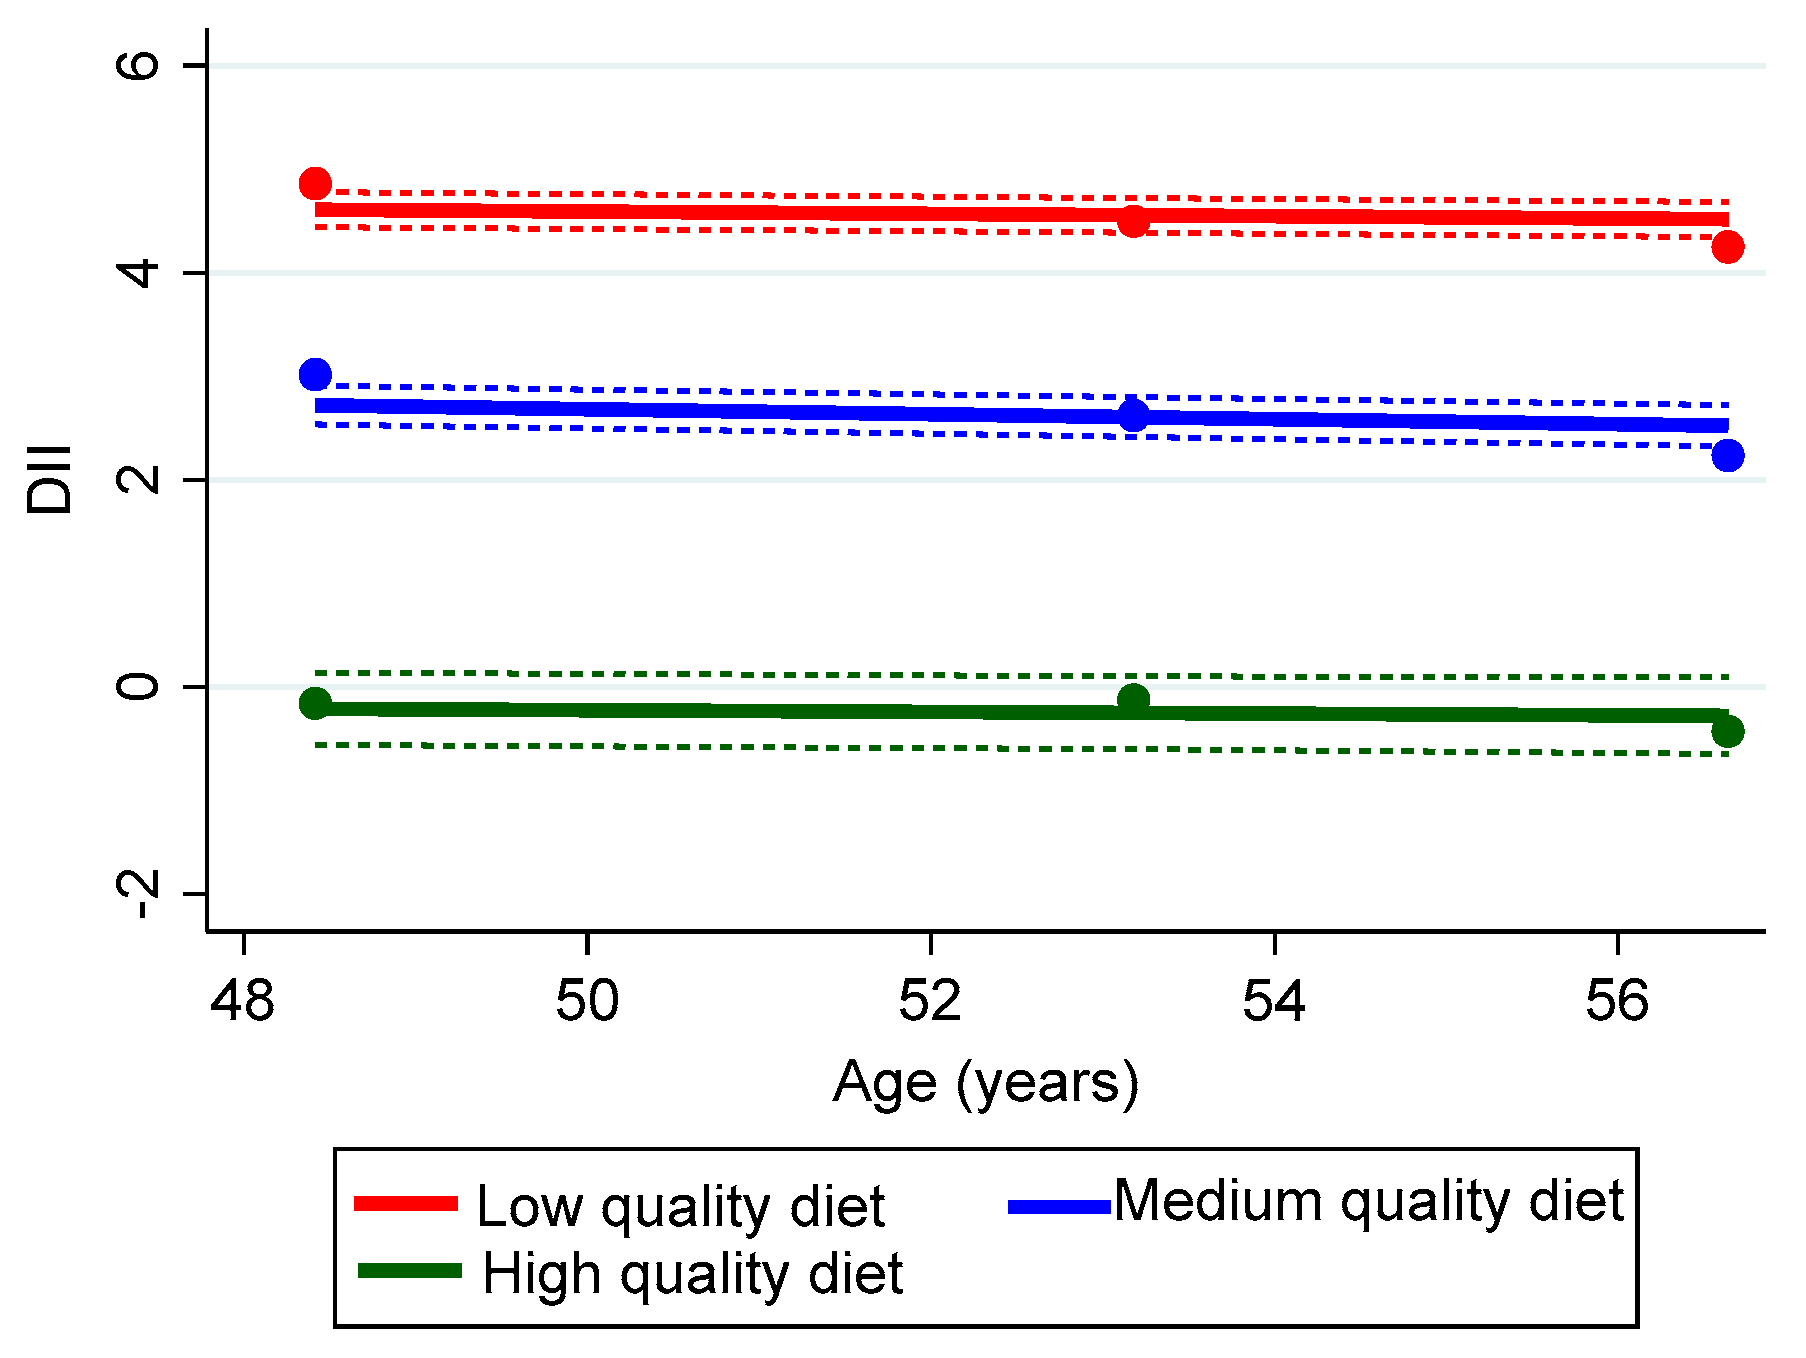
2.5.2. Dietary Inflammatory Index (DII)
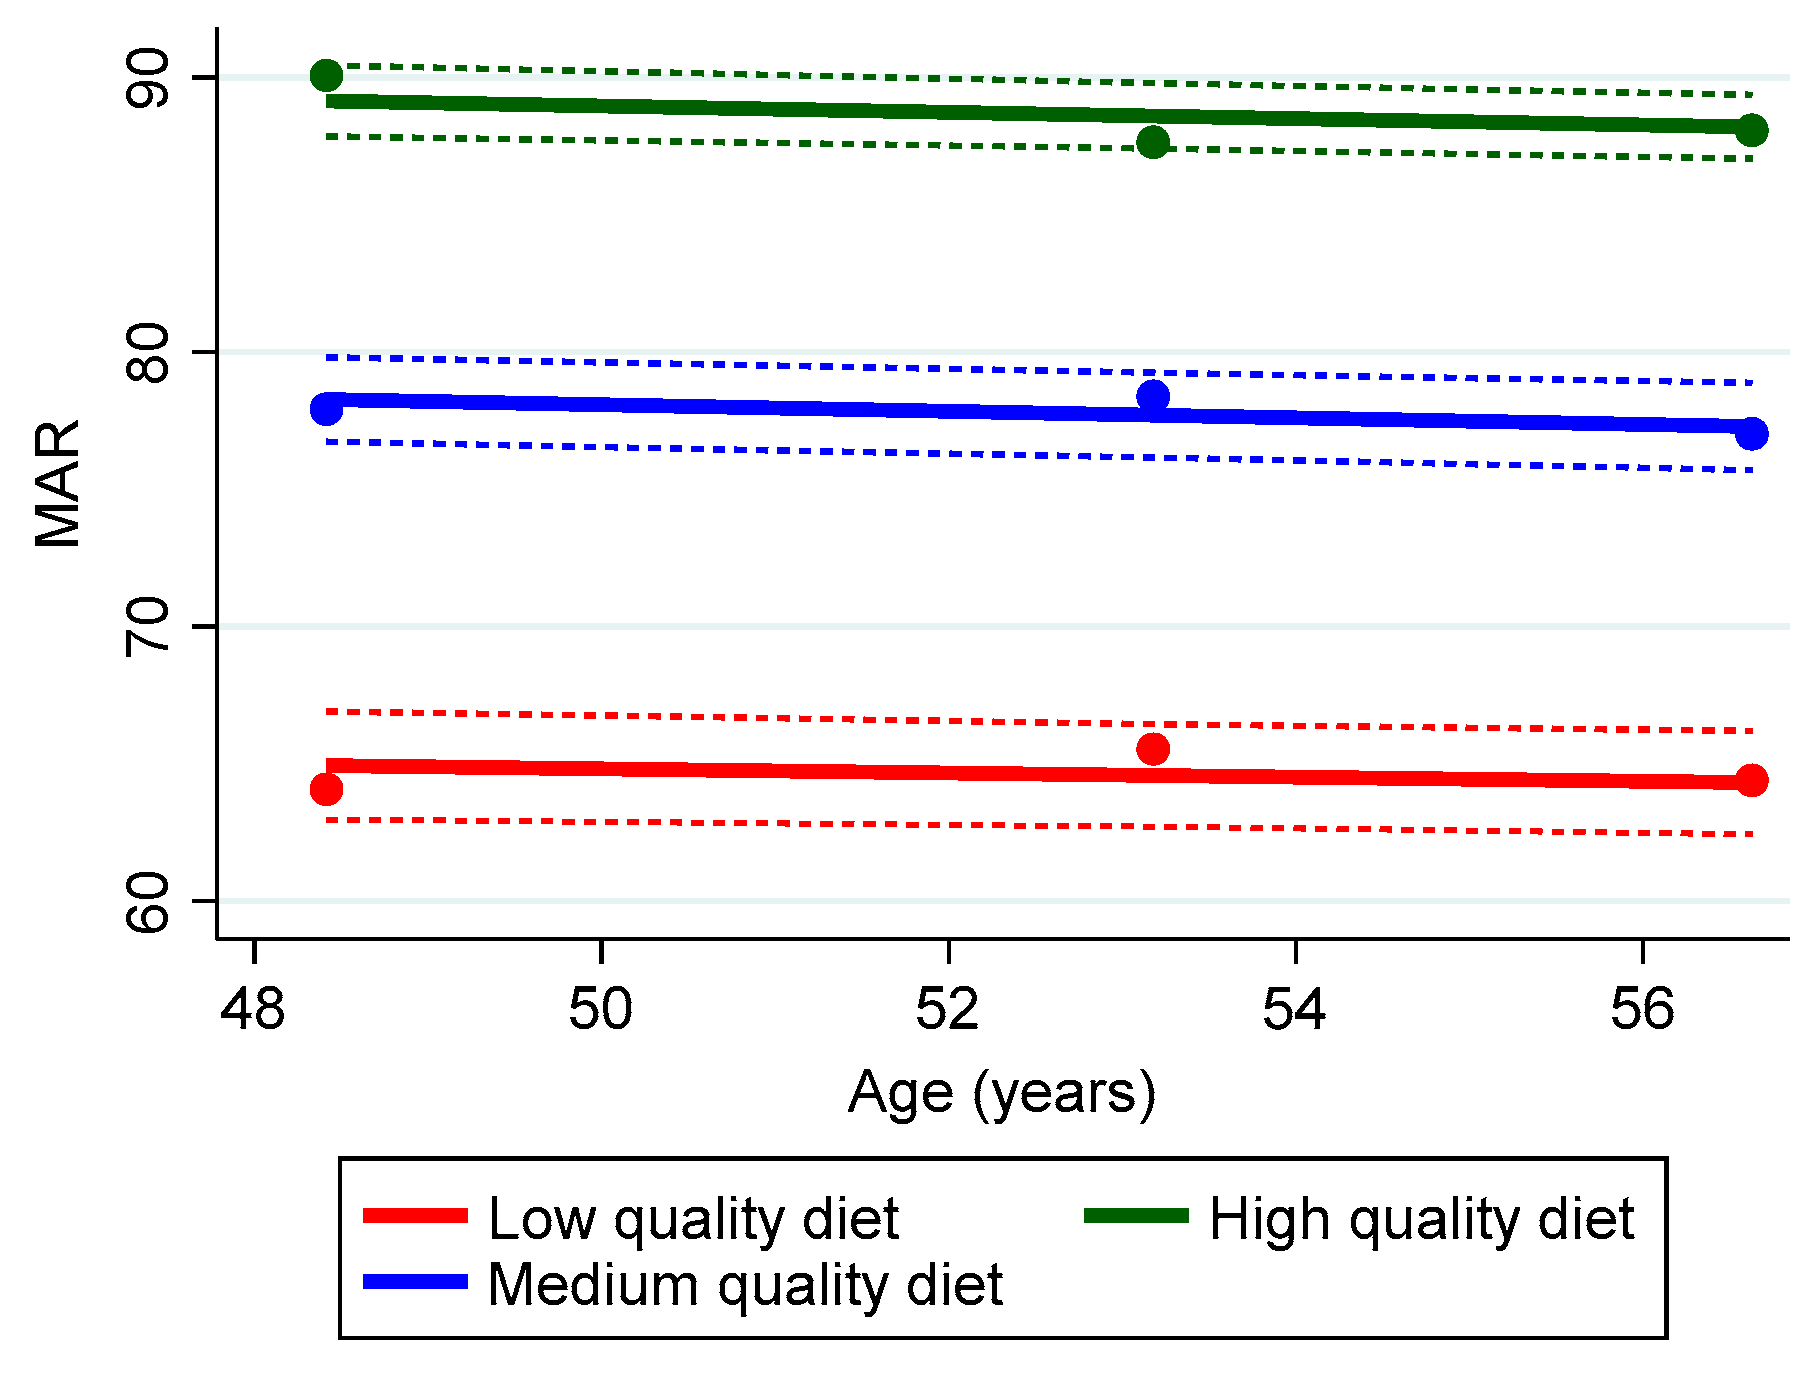
2.5.3. Mean Adequacy Ratio (MAR)
2.6. Statistical Analyses
3. Results
4. Discussion
5. Conclusions
Supplementary Materials
Author Contributions
Funding
Institutional Review Board Statement
Informed Consent Statement
Data Availability Statement
Acknowledgments
Conflicts of Interest
References
- Iriti, M.; Varoni, E.M.; Vitalini, S. Healthy Diets and Modifiable Risk Factors for Non-Communicable Diseases-The European Perspective. Foods 2020, 9, 940. [Google Scholar] [CrossRef] [PubMed]
- Ding, M.; Fitzmaurice, G.M.; Arvizu, M.; Willett, W.C.; Manson, J.E.; Rexrode, K.M.; Hu, F.B.; Chavarro, J.E. Associations between patterns of modifiable risk factors in mid-life to late life and longevity: 36 year prospective cohort study. BMJ Med. 2022, 1, e000098. [Google Scholar] [CrossRef] [PubMed]
- Arsyad, D.S.; Westerink, J.; Cramer, M.J.; Ansar, J.; Wahiduddin; Visseren, F.L.J.; Doevendans, P.A.; Ansariadi. Modifiable risk factors in adults with and without prior cardiovascular disease: Findings from the Indonesian National Basic Health Research. BMC Public Health 2022, 22, 660. [Google Scholar] [CrossRef] [PubMed]
- Fanelli, S.M.; Jonnalagadda, S.S.; Pisegna, J.L.; Kelly, O.J.; Krok-Schoen, J.L.; Taylor, C.A. Poorer Diet Quality Observed Among US Adults With a Greater Number of Clinical Chronic Disease Risk Factors. J. Prim. Care Community Health 2020, 11, 2150132720945898. [Google Scholar] [CrossRef] [PubMed]
- Cong, X.; Tracy, M.; Edmunds, L.S.; Hosler, A.S.; Appleton, A.A. The relationship between inflammatory dietary pattern in childhood and depression in early adulthood. Brain Behav. Immun. Health 2020, 2, 100017. [Google Scholar] [CrossRef]
- Hu, T.; Jacobs, D.R., Jr.; Larson, N.I.; Cutler, G.J.; Laska, M.N.; Neumark-Sztainer, D. Higher Diet Quality in Adolescence and Dietary Improvements Are Related to Less Weight Gain During the Transition From Adolescence to Adulthood. J. Pediatr. 2016, 178, 188–193.e3. [Google Scholar] [CrossRef]
- Fadnes, L.T.; Okland, J.M.; Haaland, O.A.; Johansson, K.A. Estimating impact of food choices on life expectancy: A modeling study. PLoS Med. 2022, 19, e1003889. [Google Scholar] [CrossRef]
- Kimokoti, R.W.; Newby, P.K.; Gona, P.; Zhu, L.; Campbell, W.R.; D’Agostino, R.B.; Millen, B.E. Stability of the Framingham Nutritional Risk Score and its component nutrients over 8 years: The Framingham Nutrition Studies. Eur. J. Clin. Nutr. 2012, 66, 336–344. [Google Scholar] [CrossRef]
- Shan, Z.; Li, Y.; Baden, M.Y.; Bhupathiraju, S.N.; Wang, D.D.; Sun, Q.; Rexrode, K.M.; Rimm, E.B.; Qi, L.; Willett, W.C.; et al. Association Between Healthy Eating Patterns and Risk of Cardiovascular Disease. JAMA Intern. Med. 2020, 180, 1090–1100. [Google Scholar] [CrossRef]
- Wu, F.; Pahkala, K.; Juonala, M.; Rovio, S.P.; Sabin, M.A.; Rönnemaa, T.; Buscot, M.J.; Smith, K.J.; Männistö, S.; Jula, A.; et al. Dietary Pattern Trajectories from Youth to Adulthood and Adult Risk of Impaired Fasting Glucose: A 31-year Cohort Study. J. Clin. Endocrinol. Metab. 2021, 106, e2078–e2086. [Google Scholar] [CrossRef]
- Winpenny, E.M.; van Sluijs, E.M.F.; White, M.; Klepp, K.-I.; Wold, B.; Lien, N. Changes in diet through adolescence and early adulthood: Longitudinal trajectories and association with key life transitions. Int. J. Behav. Nutr. Phys. Act. 2018, 15, 86. [Google Scholar] [CrossRef] [PubMed]
- Sirkka, O.; Fleischmann, M.; Abrahamse-Berkeveld, M.; Halberstadt, J.; Olthof, M.R.; Seidell, J.C.; Corpeleijn, E. Dietary Patterns in Early Childhood and the Risk of Childhood Overweight: The GECKO Drenthe Birth Cohort. Nutrients 2021, 13, 2046. [Google Scholar] [CrossRef] [PubMed]
- Chong, M.F.-F. Dietary trajectories through the life course: Opportunities and challenges. Br. J. Nutr. 2022, 128, 154–159. [Google Scholar] [CrossRef]
- Dalrymple, K.V.; Vogel, C.; Godfrey, K.M.; Baird, J.; Hanson, M.A.; Cooper, C.; Inskip, H.M.; Crozier, S.R. Evaluation and interpretation of latent class modelling strategies to characterise dietary trajectories across early life: A longitudinal study from the Southampton Women’s Survey. Br. J. Nutr. 2022, 129, 1945–1954. [Google Scholar] [CrossRef] [PubMed]
- Luque, V.; Escribano, J.; Closa-Monasterolo, R.; Zaragoza-Jordana, M.; Ferré, N.; Grote, V.; Koletzko, B.; Totzauer, M.; Verduci, E.; ReDionigi, A.; et al. Unhealthy Dietary Patterns Established in Infancy Track to Mid-Childhood: The EU Childhood Obesity Project. J. Nutr. 2018, 148, 752–759. [Google Scholar] [CrossRef] [PubMed]
- Lioret, S.; Campbell, K.J.; McNaughton, S.A.; Cameron, A.J.; Salmon, J.; Abbott, G.; Hesketh, K.D. Lifestyle Patterns Begin in Early Childhood, Persist and Are Socioeconomically Patterned, Confirming the Importance of Early Life Interventions. Nutrients 2020, 12, 724. [Google Scholar] [CrossRef]
- Movassagh, E.Z.; Baxter-Jones, A.D.G.; Kontulainen, S.; Whiting, S.J.; Vatanparast, H. Tracking Dietary Patterns over 20 Years from Childhood through Adolescence into Young Adulthood: The Saskatchewan Pediatric Bone Mineral Accrual Study. Nutrients 2017, 9, 990. [Google Scholar] [CrossRef]
- Talegawkar, S.A.; Jin, Y.; Xue, Q.L.; Tanaka, T.; Simonsick, E.M.; Tucker, K.L.; Ferrucci, L. Dietary Pattern Trajectories in Middle Age and Physical Function in Older Age. J. Gerontol. A Biol. Sci. Med. Sci. 2021, 76, 513–519. [Google Scholar] [CrossRef]
- Aljadani, H.M.; Patterson, A.J.; Sibbritt, D.W.; Taylor, R.M.; Collins, C.E. Improving diet quality over nine-years is associated with less weight gain in mid-age Australian women: A cohort study. Nutr. Metab. Cardiovasc. Dis. 2020, 30, 223–232. [Google Scholar] [CrossRef]
- Gao, M.; Wang, F.; Shen, Y.; Zhu, X.; Zhang, X.; Sun, X. Trajectories of Mediterranean Diet Adherence and Risk of Hypertension in China: Results from the CHNS Study, 1997–2011. Nutrients 2018, 10, 2014. [Google Scholar] [CrossRef]
- Nagin, D.S. Group-based trajectory modeling: An overview. Ann. Nutr. Metab. 2014, 65, 205–210. [Google Scholar] [CrossRef]
- Zhang, J.; Wang, H.; Wang, Z.; Huang, F.; Zhang, X.; Du, W.; Su, C.; Ouyang, Y.; Li, L.; Bai, J.; et al. Trajectories of Dietary Patterns and Their Associations with Overweight/Obesity among Chinese Adults: China Health and Nutrition Survey 1991–2018. Nutrients 2021, 13, 2835. [Google Scholar] [CrossRef] [PubMed]
- Mertens, E.; Clarys, P.; Mullie, P.; Lefevre, J.; Charlier, R.; Knaeps, S.; Huybrechts, I.; Deforche, B. Stability of physical activity, fitness components and diet quality indices. Eur. J. Clin. Nutr. 2017, 71, 519–524. [Google Scholar] [CrossRef] [PubMed]
- Wirt, A.; Collins, C.E. Diet quality—What is it and does it matter? Public Health Nutr. 2009, 12, 2473–2492. [Google Scholar] [CrossRef] [PubMed]
- McAuley, E.A.; MacLaughlin, H.L.; Hannan-Jones, M.T.; King, N.; Ross, L.J. Effectiveness of diet quality indices in measuring a change in diet quality over time: A systematic review and meta-analysis of randomized controlled trials. Nutr. Rev. 2023, 81, 361–383. [Google Scholar] [CrossRef]
- Burggraf, C.; Teuber, R.; Brosig, S.; Meier, T. Review of a priori dietary quality indices in relation to their construction criteria. Nutr. Rev. 2018, 76, 747–764. [Google Scholar] [CrossRef]
- Shivappa, N.; Steck, S.E.; Hurley, T.G.; Hussey, J.R.; Hebert, J.R. Designing and developing a literature-derived, population-based dietary inflammatory index. Public Health Nutr. 2014, 17, 1689–1696. [Google Scholar] [CrossRef]
- INDDEX Project. Mean Adequacy Ratio (MAR). Available online: https://inddex.nutrition.tufts.edu/data4dietsData4Diets (accessed on 7 July 2023).
- Jackson, M.K.; Lappe, J.; Ma, J.; Timmerman, M.; Lyden, E.R.; Shivappa, N.; Hébert, J.R.; Travers Gustafson, D.; Graeff-Armas, L.; Hanson, C. Changes in Dietary Inflammatory Index Score over Time and Cancer Development in Rural Post-Menopausal Women. Antioxidants 2023, 12, 946. [Google Scholar] [CrossRef]
- Park, S.-Y.; Lozano, C.P.; Shvetsov, Y.B.; Boushey, C.J.; Wirth, M.D.; Shivappa, N.; Hébert, J.R.; Haiman, C.A.; Wilkens, L.R.; Le Marchand, L. Change in the inflammatory potential of diet over 10 years and subsequent mortality: The Multiethnic Cohort Study. Br. J. Nutr. 2023, 129, 157–165. [Google Scholar] [CrossRef]
- Dougherty, M.; Lappe, J.; Watson, P.; Travers-Gustafson, D.; Recker, R.; Garland, C.; Gorham, E.; Baggerly, K.; McDonnell, S.; Ma, J.; et al. Changes in the Dietary Inflammatory Index Over Time and Cancer Development Within Rural Post-Menopausal Women. Curr. Dev. Nutr. 2020, 4, 319. [Google Scholar] [CrossRef]
- Evans, M.K.; Lepkowski, J.M.; Powe, N.R.; LaVeist, T.; Kuczmarski, M.F.; Zonderman, A.B. Healthy aging in neighborhoods of diversity across the life span (HANDLS): Overcoming barriers to implementing a longitudinal, epidemiologic, urban study of health, race, and socioeconomic status. Ethn. Dis. 2010, 20, 267–275. [Google Scholar] [PubMed]
- National Institutes of Health; National Institute on Aging; Intramural Research Program. Healthy Aging in Neighborhoods of Diversity across the Life Span. Available online: https://handls.nih.gov/02Protocol.htm (accessed on 20 January 2023).
- U.S. Department of Health and Human Services. The 2004 HHS Poverty Guidelines. Available online: https://aspe.hhs.gov/2004-hhs-poverty-guidelines (accessed on 6 June 2023).
- Steinfeldt, L.; Anand, J.; Murayi, T. Food reporting patterns in the USDA Automated Multiple-Pass Method. Procedia Food Sci. 2013, 2, 145–156. [Google Scholar] [CrossRef]
- U.S. Department of Agriculture. Food and Nutrient Database for Dietary Studies. Available online: https://www.ars.usda.gov/northeast-area/beltsville-md-bhnrc/beltsville-human-nutrition-research-center/food-surveys-research-group/docs/fndds-download-databases/ (accessed on 6 June 2023).
- Guenther, P.M.; Kirkpatrick, S.I.; Reedy, J.; Krebs-Smith, S.M.; Buckman, D.W.; Dodd, K.W.; Casavale, K.O.; Carroll, R.J. The Healthy Eating Index-2010 is a valid and reliable measure of diet quality according to the 2010 Dietary Guidelines for Americans. J. Nutr. 2014, 144, 399–407. [Google Scholar] [CrossRef] [PubMed]
- National Insitute on Aging; Intramural Research Program. Healthy Eating Index 2010 calculation. Available online: https://handls.nih.gov/06Coll-w01HEI.htm (accessed on 6 June 2023).
- National Cancer Institute; National Institutes of Health. Healthy Eating Index; How to Choose an Analysis Method on Purpose. Available online: https://epi.grants.cancer.gov/hei/tools.html (accessed on 6 June 2023).
- Shivappa, N.; Steck, S.E.; Hurley, T.G.; Hussey, J.R.; Ma, Y.; Ockene, I.S.; Tabung, F.; Hébert, J.R. A population-based dietary inflammatory index predicts levels of C-reactive protein in the Seasonal Variation of Blood Cholesterol Study (SEASONS). Public Health Nutr. 2014, 17, 1825–1833. [Google Scholar] [CrossRef] [PubMed]
- Fanelli Kuczmarski, M.; Mason, M.A.; Allegro, D.; Zonderman, A.B.; Evans, M.K. Diet Quality Is Inversely Associated with C-Reactive Protein Levels in Urban, Low-Income African-American and White Adults. J. Acad. Nutr. Diet. 2013, 113, 1620–1631. [Google Scholar] [CrossRef] [PubMed]
- Murphy, S.P.; Foote, J.A.; Wilkens, L.R.; Basiotis, P.P.; Carlson, A.; White, K.K.; Yonemori, K.M. Simple measures of dietary variety are associated with improved dietary quality. J. Am. Diet. Assoc. 2006, 106, 425–429. [Google Scholar] [CrossRef]
- Food and Nutrition Board. Nutrient Recommendations: Dietary Reference Intakes (DRI). Available online: https://ods.od.nih.gov/HealthInformation/nutrientrecommendations.aspx (accessed on 20 January 2023).
- Institute of Medicine. Dietary Reference Intakes for Vitamin C, Vitamin E, Selenium, and Carotenoids; National Academies Press: Washington, DC, USA, 2000. [Google Scholar]
- Jones, B.L.; Nagin, D. A Stata Plugin for Estimating Group-Based Trajectory Models. Available online: https://doi.org/10.1184/R1/6470963.v1 (accessed on 20 January 2023).
- Jones, B.L.; Nagin, D.S. Advances in group-based trajectory modeling and an SAS procedure for estimating them. Sociol. Methods Res. 2007, 35, 542–571. [Google Scholar] [CrossRef]
- R Core Team. R: A Language and Environment for Statistical Computing. Available online: https://www.R-project.org/ (accessed on 7 July 2023).
- Mertens, E.; Deforche, B.; Mullie, P.; Lefevre, J.; Charlier, R.; Knaeps, S.; Huybrechts, I.; Clarys, P. Longitudinal study on the association between three dietary indices, anthropometric parameters and blood lipids. Nutr. Metab. 2015, 12, 47. [Google Scholar] [CrossRef]
- Baldwin, J.N.; Forder, P.M.; Haslam, R.L.; Hure, A.J.; Loxton, D.J.; Patterson, A.J.; Collins, C.E. Change in Diet Quality over 12 Years in the 1946-1951 Cohort of the Australian Longitudinal Study on Women’s Health. Nutrients 2020, 12, 147. [Google Scholar] [CrossRef]
- Liu, M.W.; McNaughton, S.A.; He, Q.Q.; Leech, R. Longitudinal trajectories of diet quality and subsequent mortality among Chinese adults: Results from the China health and nutrition survey 1997–2015. Int. J. Behav. Nutr. Phys. Act. 2021, 18, 51. [Google Scholar] [CrossRef]
- Tabung, F.K.; Steck, S.E.; Zhang, J.; Ma, Y.; Liese, A.D.; Tylavsky, F.A.; Vitolins, M.Z.; Ockene, J.K.; Hebert, J.R. Longitudinal changes in the dietary inflammatory index: An assessment of the inflammatory potential of diet over time in postmenopausal women. Eur. J. Clin. Nutr. 2016, 70, 1374–1380. [Google Scholar] [CrossRef] [PubMed]
- Liese, A.D.; Krebs-Smith, S.M.; Subar, A.F.; George, S.M.; Harmon, B.E.; Neuhouser, M.L.; Boushey, C.J.; Schap, T.E.; Reedy, J. The Dietary Patterns Methods Project: Synthesis of findings across cohorts and relevance to dietary guidance. J. Nutr. 2015, 145, 393–402. [Google Scholar] [CrossRef]
- DiNatale, J.; Crowe-White, K.; Knol, L.; Azarmanesh, D. Diet Quality Assessed by the Dietary Inflammatory Index and the Healthy Eating Index: An Analysis of the National Health and Nutrition Examination Survey (2015–2018). Curr. Dev. Nutr. 2022, 6, 360. [Google Scholar] [CrossRef]
- Chen, A.Y.; Sturm, R. Diet Quality in the United States Improved during the Great Recession and Deteriorated During Economic Recovery. J. Acad. Nutr. Diet. 2022, 122, 974–980. [Google Scholar] [CrossRef] [PubMed]
- Darmon, N.; Drewnowski, A. Contribution of food prices and diet cost to socioeconomic disparities in diet quality and health: A systematic review and analysis. Nutr. Rev. 2015, 73, 643–660. [Google Scholar] [CrossRef]
- French, S.A.; Tangney, C.C.; Crane, M.M.; Wang, Y.; Appelhans, B.M. Nutrition quality of food purchases varies by household income: The SHoPPER study. BMC Public Health 2019, 19, 231. [Google Scholar] [CrossRef] [PubMed]
- McCullough, M.L.; Chantaprasopsuk, S.; Islami, F.; Rees-Punia, E.; Um, C.Y.; Wang, Y.; Leach, C.R.; Sullivan, K.R.; Patel, A.V. Association of Socioeconomic and Geographic Factors with Diet Quality in US Adults. JAMA Network Open 2022, 5, e2216406. [Google Scholar] [CrossRef] [PubMed]
- Shan, Z.; Wang, F.; Li, Y.; Baden, M.Y.; Bhupathiraju, S.N.; Wang, D.D.; Sun, Q.; Rexrode, K.M.; Rimm, E.B.; Qi, L.; et al. Healthy Eating Patterns and Risk of Total and Cause-Specific Mortality. JAMA Intern. Med. 2023, 183, 142–153. [Google Scholar] [CrossRef] [PubMed]
- Wambogo, E.; Ansai, N.; Wang, C.Y.; Terry, A.; Fryar, C.D.; Ahluwalia, N.; Ogden, C.L. Awareness of the MyPlate Plan: United States, 2017–March 2020. Natl. Health Stat. Rep. 2022, 178, 1–14. [Google Scholar]
- Carson, T.L.; Hidalgo, B.; Ard, J.D.; Affuso, O. Dietary interventions and quality of life: A systematic review of the literature. J. Nutr. Educ. Behav. 2014, 46, 90–101. [Google Scholar] [CrossRef]
- Moshfegh, A.J.; Rhodes, D.G.; Baer, D.J.; Murayi, T.; Clemens, J.C.; Rumpler, W.V.; Paul, D.R.; Sebastian, R.S.; Kuczynski, K.J.; Ingwersen, L.A.; et al. The US Department of Agriculture Automated Multiple-Pass Method reduces bias in the collection of energy intakes. Am. J. Clin. Nutr. 2008, 88, 324–332. [Google Scholar] [CrossRef] [PubMed]
- Poslusna, K.; Ruprich, J.; de Vries, J.H.; Jakubikova, M.; van’t Veer, P. Misreporting of energy and micronutrient intake estimated by food records and 24 hour recalls, control and adjustment methods in practice. Br. J. Nutr. 2009, 101 (Suppl. S2), S73–S85. [Google Scholar] [CrossRef] [PubMed]
- Herle, M.; Micali, N.; Abdulkadir, M.; Loos, R.; Bryant-Waugh, R.; Hübel, C.; Bulik, C.M.; De Stavola, B.L. Identifying typical trajectories in longitudinal data: Modelling strategies and interpretations. Eur. J. Epidemiol. 2020, 35, 205–222. [Google Scholar] [CrossRef] [PubMed]


| Overall | Sex | Race | |||||
|---|---|---|---|---|---|---|---|
| n = 2919 | Men n = 1261 | Women n = 1640 | p | African American n = 1724 | White n = 1177 | p | |
| Age, v 1, X ± SE | 48.5 ± 0.2 | 48.3 ± 0.3 | 48.5 ± 0.2 | 0.662 | 48.3 ± 0.2 | 48.7 ± 0.3 | 0.298 |
| Sex, % Men | 43.5 | - | - | 43.2 | 43.8 | 0.760 | |
| Race, % African American | 59.6 | 59.2 | 59.8 | 0.760 | - | - | |
| % below poverty status | 41.4 | 37.7 | 44.2 | <0.001 | 48.0 | 31.7 | <0.001 |
| Education, % | |||||||
| <High School | 6.6 | 7.5 | 5.9 | 0.161 | 4.9 | 9.1 | <0.001 |
| High School | 60.2 | 60.9 | 59.8 | base | 64.5 | 53.9 | base |
| >High School | 33.2 | 31.7 | 34.3 | 0.235 | 30.6 | 37.0 | <0.001 |
| Index | Low Trajectory | Middle Trajectory | High Trajectory | ||||||
|---|---|---|---|---|---|---|---|---|---|
| Visit 1 | Visit 2 | Visit 3 | Visit 1 | Visit 2 | Visit 3 | Visit 1 | Visit 2 | Visit 3 | |
| HEI-2010 | 35.7 ± 0.2 | 38.2 ± 0.2 | 40.0 ± 0.3 | 47.8 ± 0.3 | 51.3 ± 0.3 | 54.0 ± 0.3 | 65.2 ± 1.0 | 69.3 ± 0.8 | 71.9 ± 0.7 |
| DII | 5.07 ± 0.04 | 4.71 ± 0.04 | 4.48 ± 0.05 | 2.85 ± 0.05 | 2.49 ± 0.04 | 2.12 ± 0.04 | −0.67 ± 0.13 | −0.55 ± 0.12 | −0.87 ± 0.11 |
| MAR | 59.2 ± 0.7 | 61.8 ± 0.8 | 61.0 ± 0.7 | 77.4 ± 0.3 | 78.0 ± 0.3 | 76.4 ± 0.3 | 91.4 ± 0.3 | 88.4 ± 0.2 | 89.01 ± 0.2 |
| HEI-2010 | Coefficient | SE | t | p |
|---|---|---|---|---|
| Time | 0.617 | 0.066 | 9.38 | <0.001 |
| Trajectory Group 2 | 12.416 | 0.330 | 37.68 | <0.001 |
| Trajectory Group 3 | 30.651 | 0.757 | 40.48 | <0.001 |
| Time × Trajectory Group 2 | 0.156 | 0.578 | 2.70 | 0.007 |
| Time × Trajectory Group 3 | 0.110 | 0.124 | 0.89 | 0.375 |
| Age, visit 1, centered | 0.244 | 0.172 | 14.17 | <0.001 |
| Time × Age | −0.003 | 0.003 | −0.97 | 0.330 |
| Sex, Men | −0.101 | 0.323 | −0.31 | 0.756 |
| Time × Sex, Men | −0.071 | 0.057 | −1.26 | 0.209 |
| Race, African American (AA) | 0.755 | 0.329 | 2.29 | 0.022 |
| Time × Race (AA) | −0.140 | 0.059 | −2.37 | 0.018 |
| Below poverty status, <125% | −0.848 | 0.332 | −2.55 | 0.011 |
| Time × Below poverty status | 0.006 | 0.058 | 0.11 | 0.916 |
| Cons | 36.014 | 0.354 | 101.64 | <0.001 |
| DII | Coefficient | SE | t | p |
|---|---|---|---|---|
| Time | 0.091 | 0.012 | 7.31 | <0.001 |
| Trajectory Group 2 | 2.241 | 0.061 | 36.59 | <0.001 |
| Trajectory Group 3 | 5.624 | 0.108 | 51.98 | <0.001 |
| Time × Trajectory Group 2 | 0.002 | 0.011 | 0.21 | 0.831 |
| Time × Trajectory Group 3 | −0.054 | 0.019 | −2.88 | 0.004 |
| Age, visit 1, centered | 0.020 | 0.003 | 6.74 | <0.001 |
| Time × Age | −0.001 | 0.0005 | −2.04 | 0.041 |
| Sex, Men | 0.232 | 0.056 | 4.13 | <0.001 |
| Time × Sex, Men | −0.006 | 0.010 | −0.62 | 0.534 |
| Race, African American (AA) | 0.189 | 0.057 | 3.28 | 0.001 |
| Time × Race (AA) | 0.007 | 0.010 | 0.63 | 0.529 |
| Below poverty status, <125% | 0.107 | 0.058 | 1.85 | 0.064 |
| Time × Below poverty status | −0.042 | 0.010 | −4.23 | <0.001 |
| Cons | −5.071 | 0.067 | −75.73 | <0.001 |
| MAR | Coefficient | SE | t | p |
|---|---|---|---|---|
| Time | 0.298 | 0.096 | 3.12 | 0.002 |
| Trajectory Group 2 | 18.221 | 0.507 | 35.96 | <0.001 |
| Trajectory Group 3 | 31.352 | 0.564 | 55.64 | <0.001 |
| Time × Trajectory Group 2 | −0.390 | 0.090 | −4.36 | <0.001 |
| Time × Trajectory Group 3 | −0.583 | 0.099 | −5.87 | <0.001 |
| Age, visit 1, centered | 0.001 | 0.022 | 0.03 | 0.977 |
| Time X Age | −0.025 | 0.004 | −6.42 | <0.001 |
| Sex, Men | 0.524 | 0.411 | 1.28 | 0.202 |
| Time × Sex, Men | 0.040 | 0.072 | 0.56 | 0.577 |
| Race, African American (AA) | 0.205 | 0.416 | 0.49 | 0.621 |
| Time × Race (AA) | −0.018 | 0.075 | −0.24 | 0.810 |
| Below poverty status, <125% | 0.683 | 0.415 | 1.65 | 0.100 |
| Time × Below poverty status | −0.182 | 0.072 | −2.53 | 0.011 |
| Cons | 58.941 | 0.520 | 113.44 | <0.001 |
| Healthy Eating Index-2010 (HEI) | Diet Inflammatory Index (DII) | Mean Adequacy Ratio (MAR) | ||||||||||
|---|---|---|---|---|---|---|---|---|---|---|---|---|
| Covariates 1 | Middle | High | Middle | High | Middle | High | ||||||
| OR ± SE | p | OR ± SE | p | OR ± SE | p | OR ± SE | p | OR ± SE | p | OR ± SE | p | |
| Age, Visit 1 | 1.01 ± 0.4 × 10⁻² | 0.001 | 0.97 ± 0.01 | 0.007 | 0.97 ± 0.4 × 10⁻² | <0.001 | 0.95 ± 0.01 | <0.001 | 1.00 ± 0.01 | 0.288 | 1.00 ± 0.01 | 0.523 |
| Sex | 1.38 ± 0.11 | <0.001 | 0.64 ± 0.12 | 0.018 | 1.65 ± 0.14 | <0.001 | 2.10 ± 0.32 | <0.001 | 1.85 ± 0.19 | <0.001 | 2.66 ± 0.29 | <0.001 |
| Race | 0.72 ± 0.06 | <0.001 | 0.47 ± 0.09 | <0.001 | 0.90 ± 0.08 | 0.198 | 0.40 ± 0.06 | <0.001 | 0.93 ± 0.09 | 0.483 | 0.60 ± 0.07 | <0.001 |
| Poverty status | 1.54 ± 0.12 | <0.001 | 0.41 ± 0.09 | <0.001 | 0.69 ± 0.06 | <0.001 | 0.41 ± 0.07 | <0.001 | 0.80 ± 0.08 | 0.020 | 0.68 ± 0.07 | <0.001 |
Disclaimer/Publisher’s Note: The statements, opinions and data contained in all publications are solely those of the individual author(s) and contributor(s) and not of MDPI and/or the editor(s). MDPI and/or the editor(s) disclaim responsibility for any injury to people or property resulting from any ideas, methods, instructions or products referred to in the content. |
© 2023 by the authors. Licensee MDPI, Basel, Switzerland. This article is an open access article distributed under the terms and conditions of the Creative Commons Attribution (CC BY) license (https://creativecommons.org/licenses/by/4.0/).
Share and Cite
Fanelli Kuczmarski, M.; Beydoun, M.A.; Georgescu, M.F.; Noren Hooten, N.; Mode, N.A.; Evans, M.K.; Zonderman, A.B. Diet Quality Trajectories over Adulthood in a Biracial Urban Sample from the Healthy Aging in Neighborhoods of Diversity across the Life Span Study. Nutrients 2023, 15, 3099. https://doi.org/10.3390/nu15143099
Fanelli Kuczmarski M, Beydoun MA, Georgescu MF, Noren Hooten N, Mode NA, Evans MK, Zonderman AB. Diet Quality Trajectories over Adulthood in a Biracial Urban Sample from the Healthy Aging in Neighborhoods of Diversity across the Life Span Study. Nutrients. 2023; 15(14):3099. https://doi.org/10.3390/nu15143099
Chicago/Turabian StyleFanelli Kuczmarski, Marie, May A. Beydoun, Michael F. Georgescu, Nicole Noren Hooten, Nicolle A. Mode, Michele K. Evans, and Alan B. Zonderman. 2023. "Diet Quality Trajectories over Adulthood in a Biracial Urban Sample from the Healthy Aging in Neighborhoods of Diversity across the Life Span Study" Nutrients 15, no. 14: 3099. https://doi.org/10.3390/nu15143099
APA StyleFanelli Kuczmarski, M., Beydoun, M. A., Georgescu, M. F., Noren Hooten, N., Mode, N. A., Evans, M. K., & Zonderman, A. B. (2023). Diet Quality Trajectories over Adulthood in a Biracial Urban Sample from the Healthy Aging in Neighborhoods of Diversity across the Life Span Study. Nutrients, 15(14), 3099. https://doi.org/10.3390/nu15143099


