
Phosphorus May Induce Phenotypic Transdifferentiation of Vascular Smooth Muscle Cells through the Reduction of microRNA-145

 , , , , and
Abstract
1. Introduction
2. Materials and Methods
2.1. In Vivo Study
2.1.1. Animal Model
2.1.2. Biochemical Markers
2.1.3. Blood Pressure Measurement
2.2. In Vitro Study
2.2.1. Induction of A7r5 Osteogenic Phenotype Differentiation and Calcification
- (1)
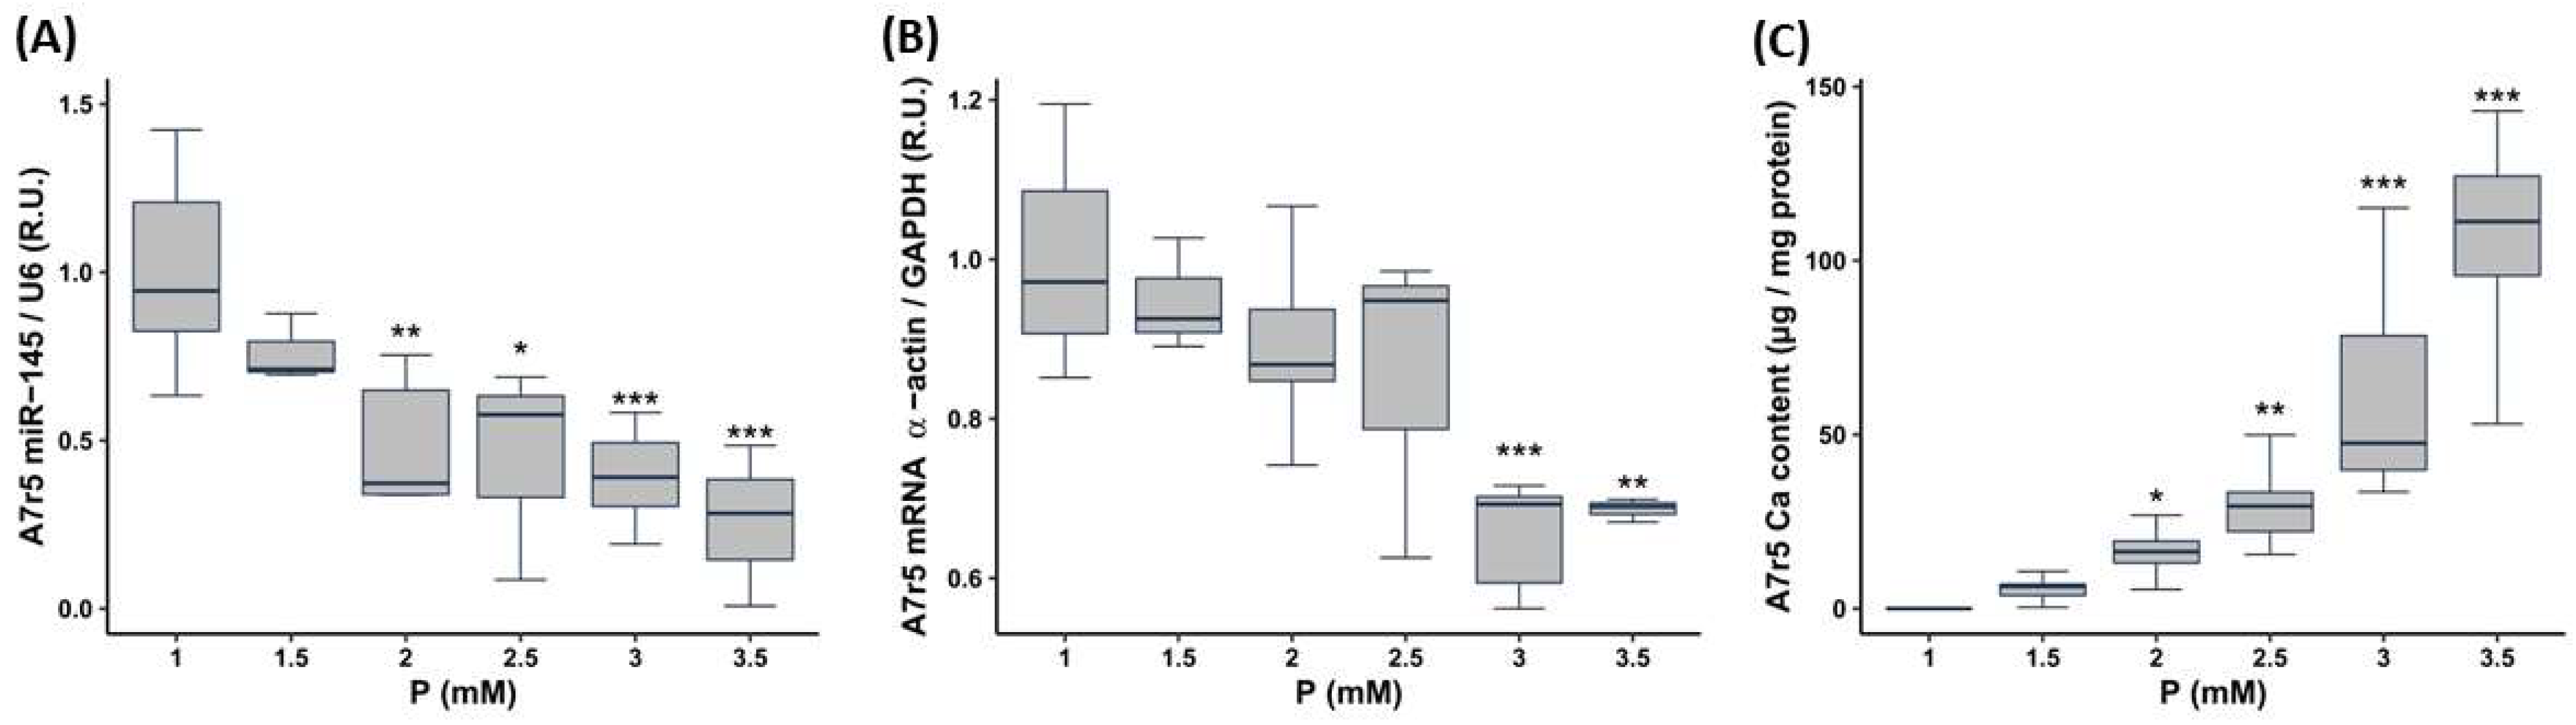
- To evaluate the influence of the P concentration, A7r5 cells were cultured in DMEM with 1% FBS increasing the P content as follows: 1 mM P (control with no P supplementation, named from now onwards as non-calcifying medium), 1.5 mM P, 2 mM P, 2.5 mM P, 3 mM P (named from now onwards as calcifying medium) and 3.5 mM P, the culture medium was replaced daily. Ca deposition and gene/miR expression were assessed 3 days after the exposure to P.
- (2)
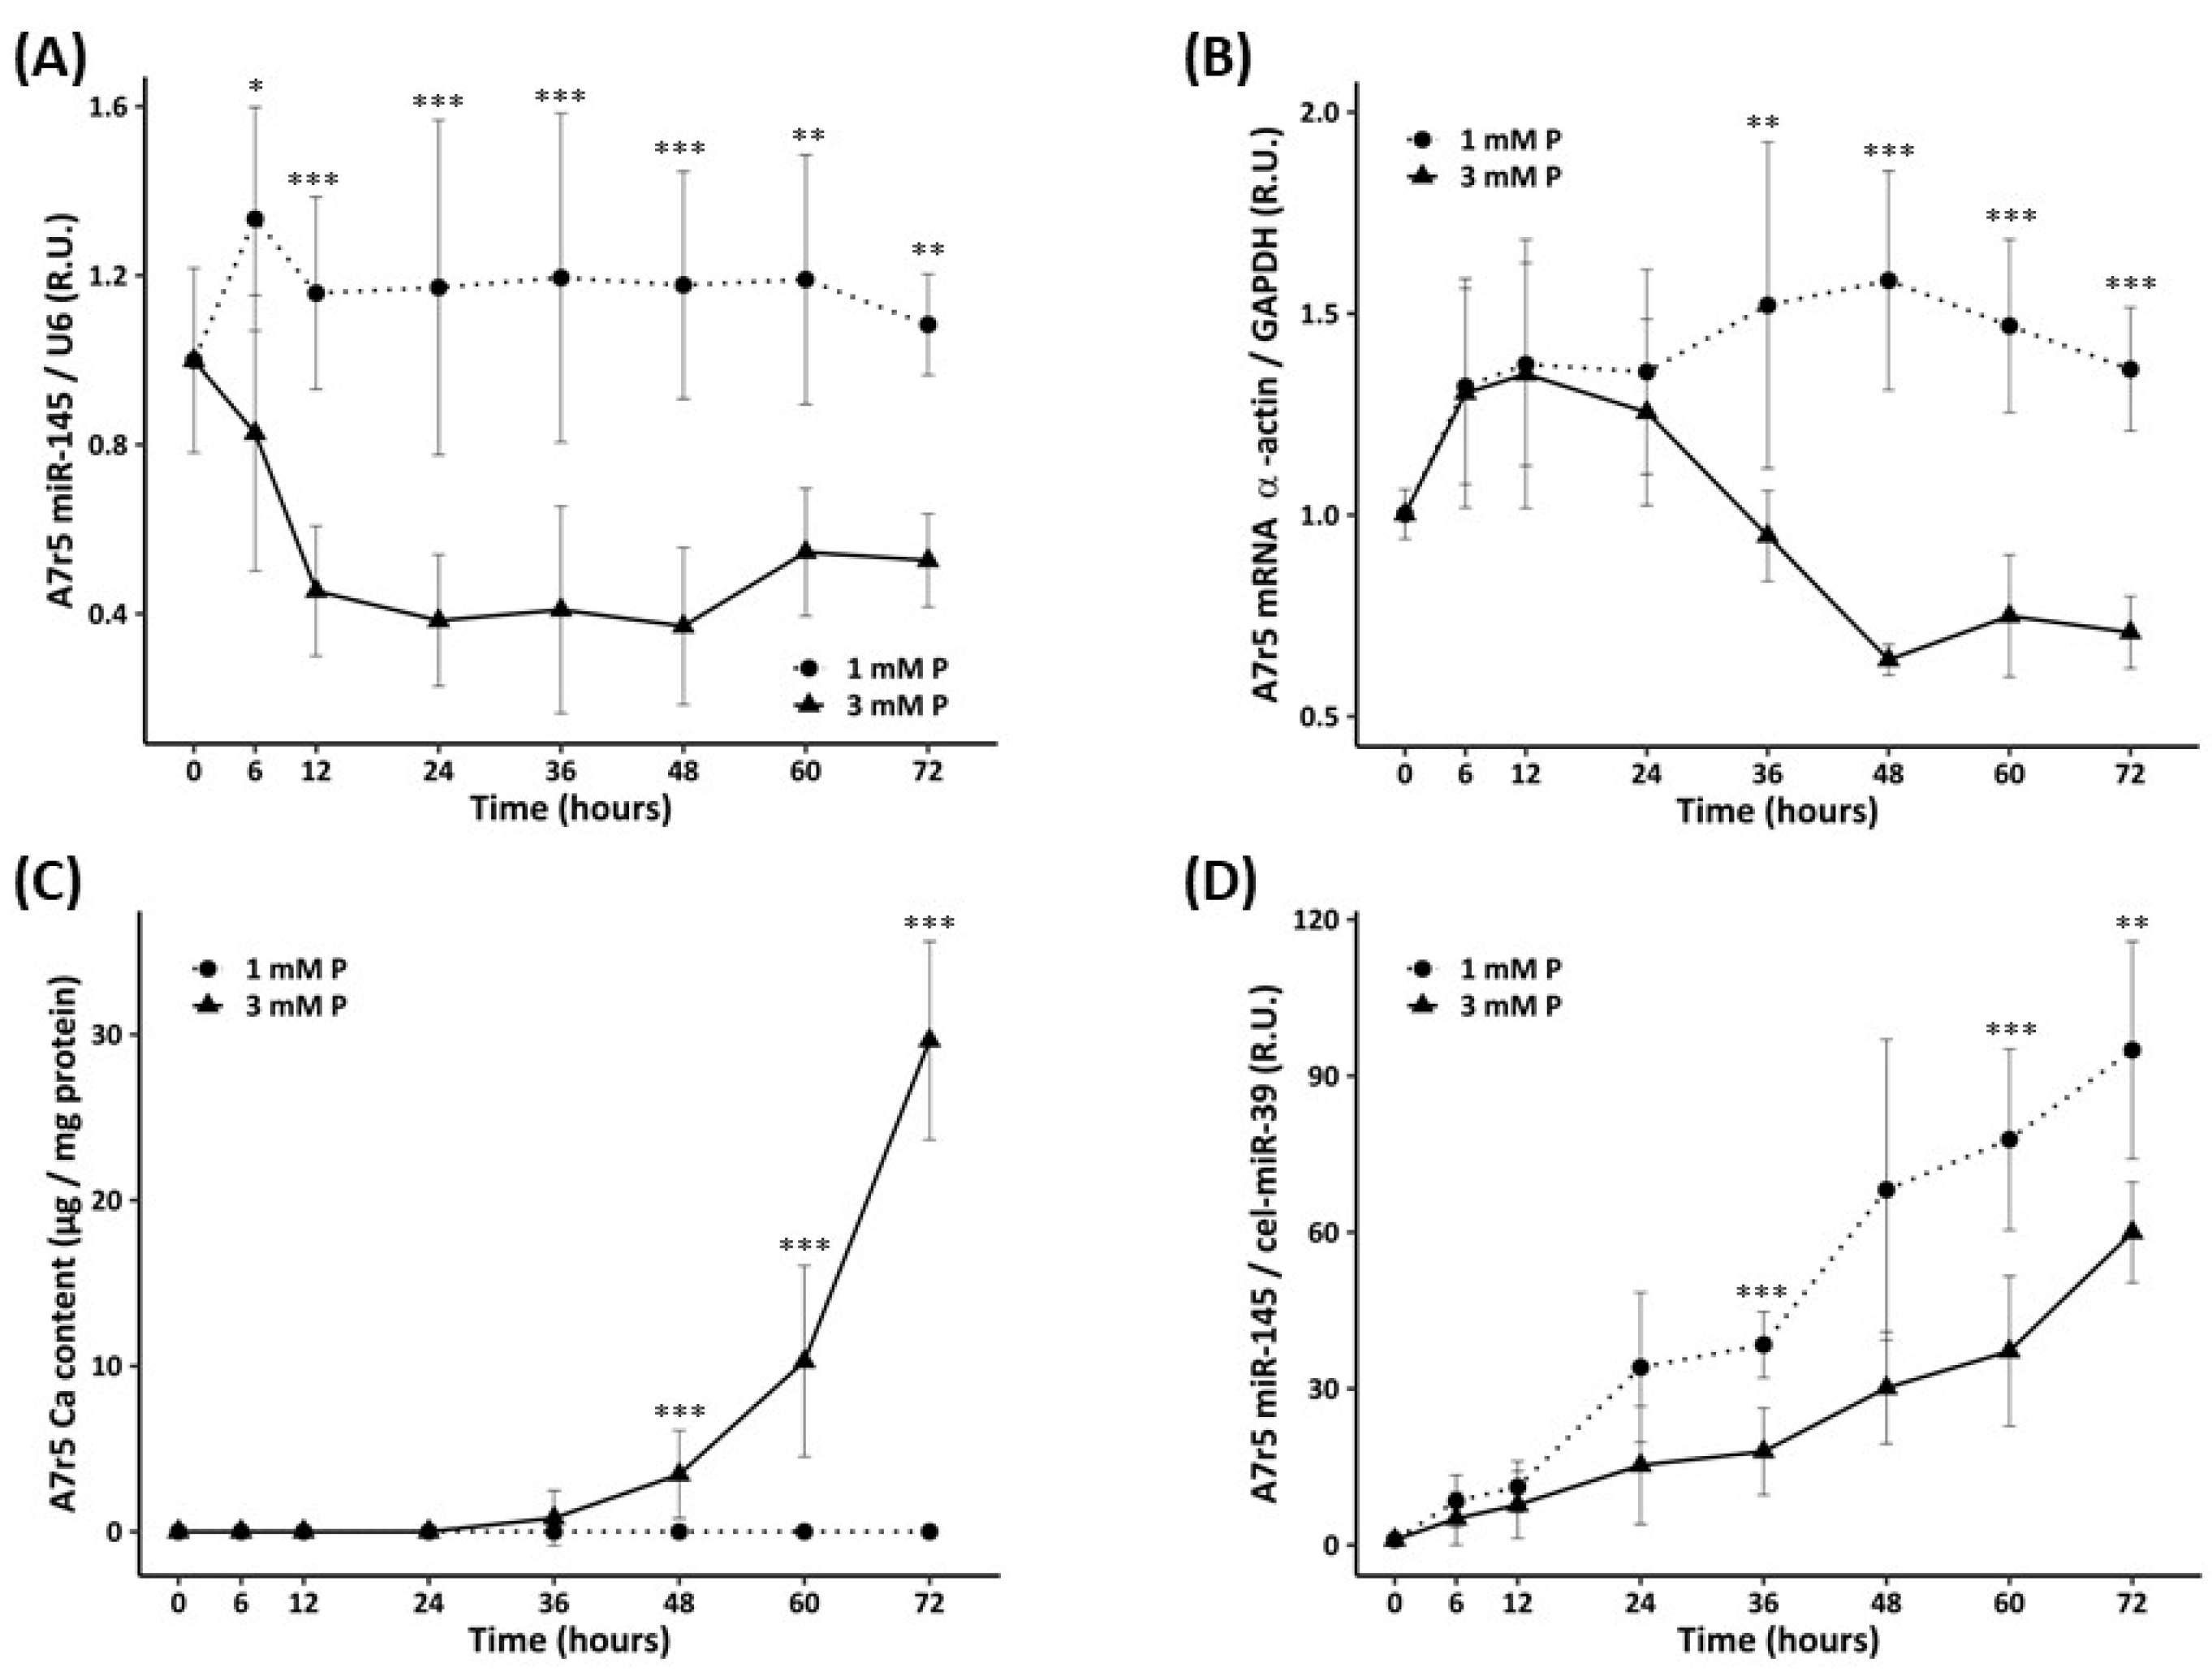
- In order to study the sequence of the changes, A7r5 cells were cultured in DMEM supplemented with 1% FBS and exposed to 1 mM P (non-calcifying medium) and 3 mM P (calcifying medium), for 0, 6, 12, 24, 36, 48, 60 and 72 h. Ca deposition and gene/miR expression in A7r5 cells and miR-145 levels in culture medium were assessed at every time point of the experiment.
- (3)
- In order to elucidate whether PTH, which is frequently associated to high P, has a direct effect on α-actin expression, miR-145 levels and Ca content in VSMCs, A7r5 cells were cultured in DMEM (supplemented with 1% FBS) and exposed to 1 mM P or 3 mM P adding in both cases PTH 1–34 at different concentrations, (from 10−9 M to 10−7 M, Sigma-Aldrich, St. Louis, MO, USA), replacing the culture medium daily. Ca deposition and gene/miR expression were assessed 3 days after the exposure to P and PTH.
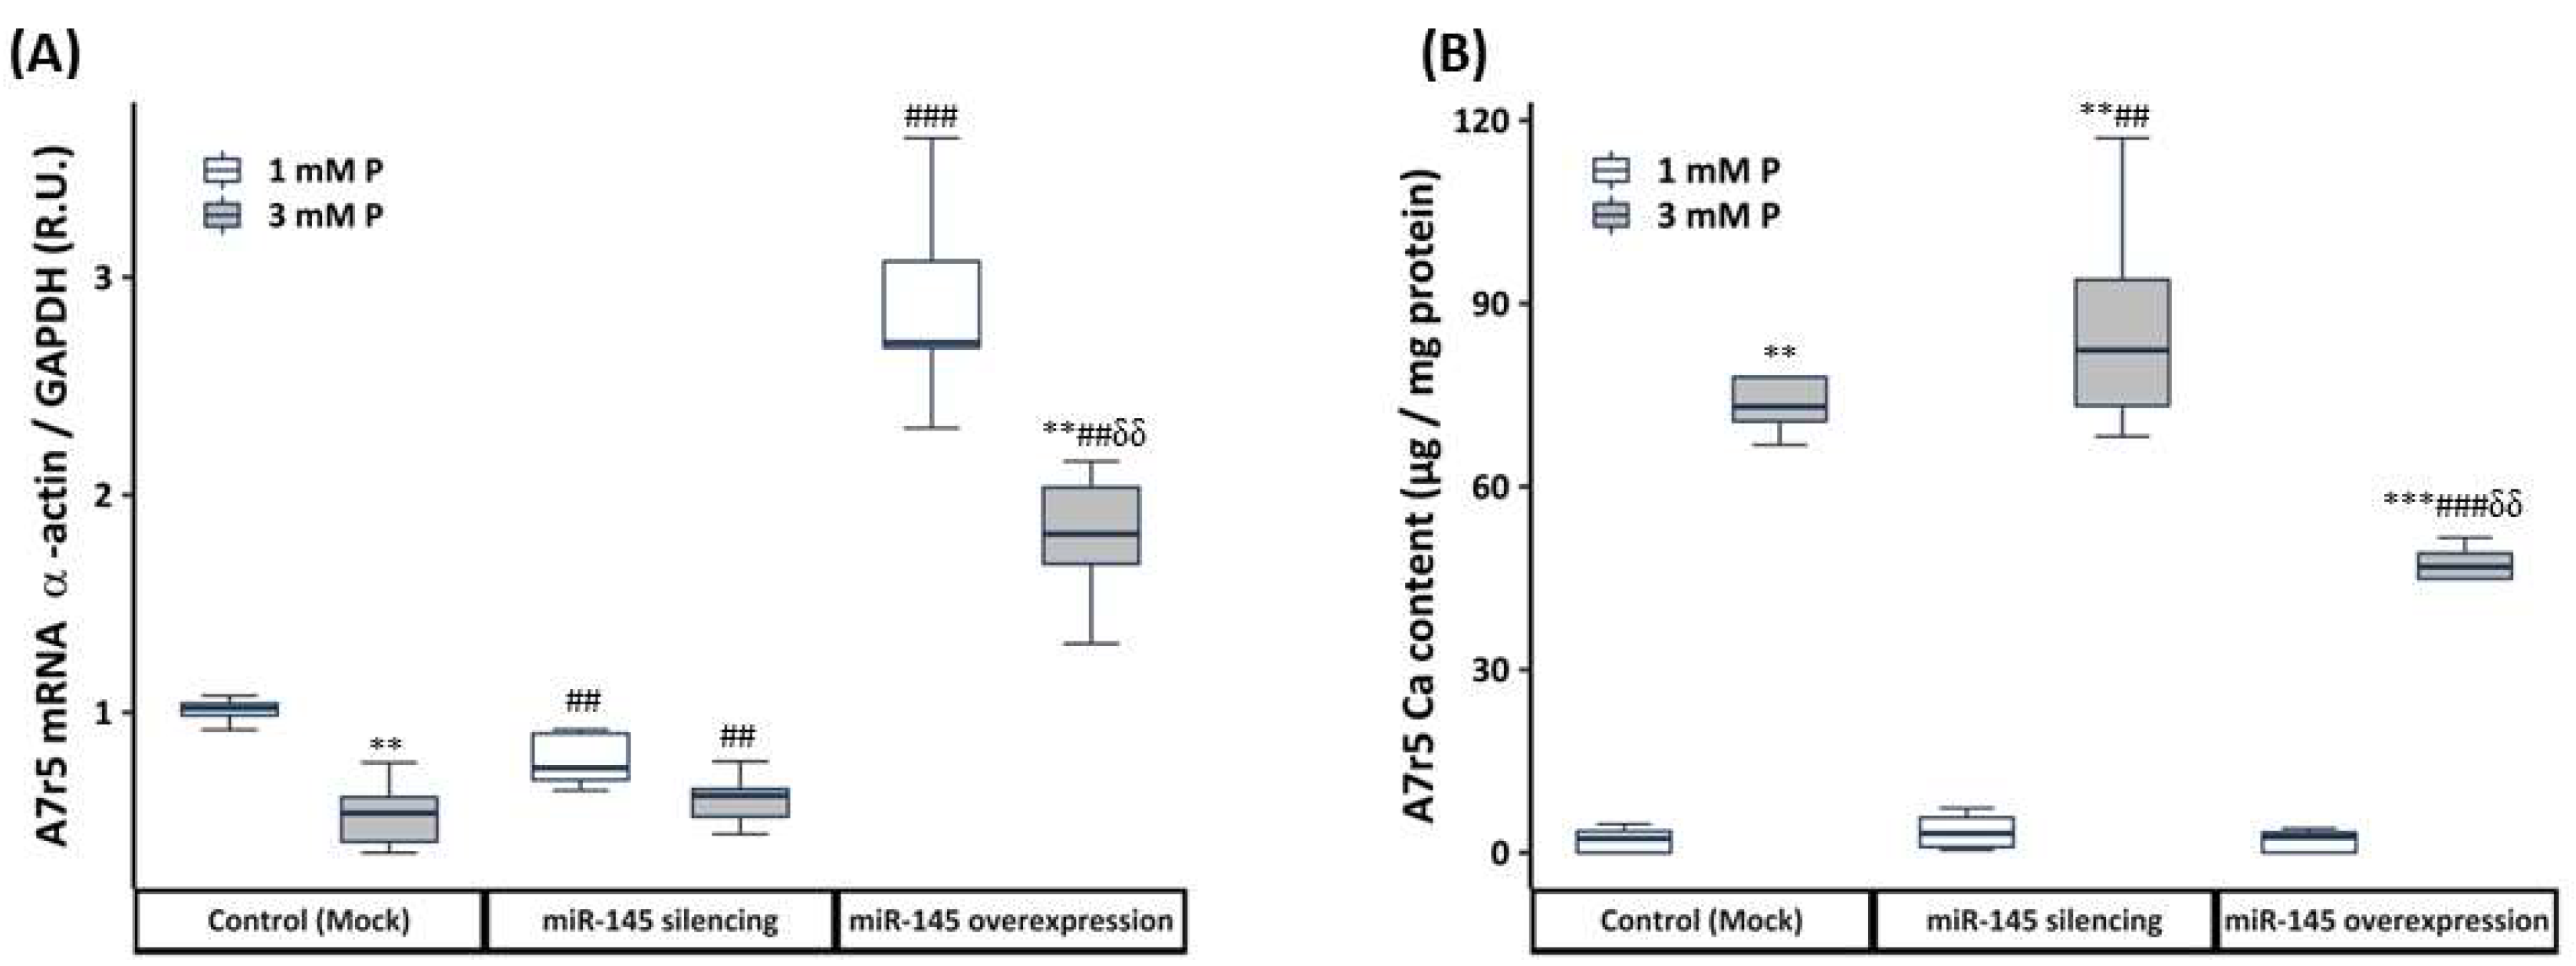
2.2.2. Transfection with Mimics or Antagomirs
2.3. Analytical and Technical Procedures
2.3.1. Quantification of Ca Content
2.3.2. Von Kossa Staining
2.3.3. RNA and MicroRNA Isolation, Retrotranscription and Quantitative PCR
2.3.4. Statistical Analyses
3. Results
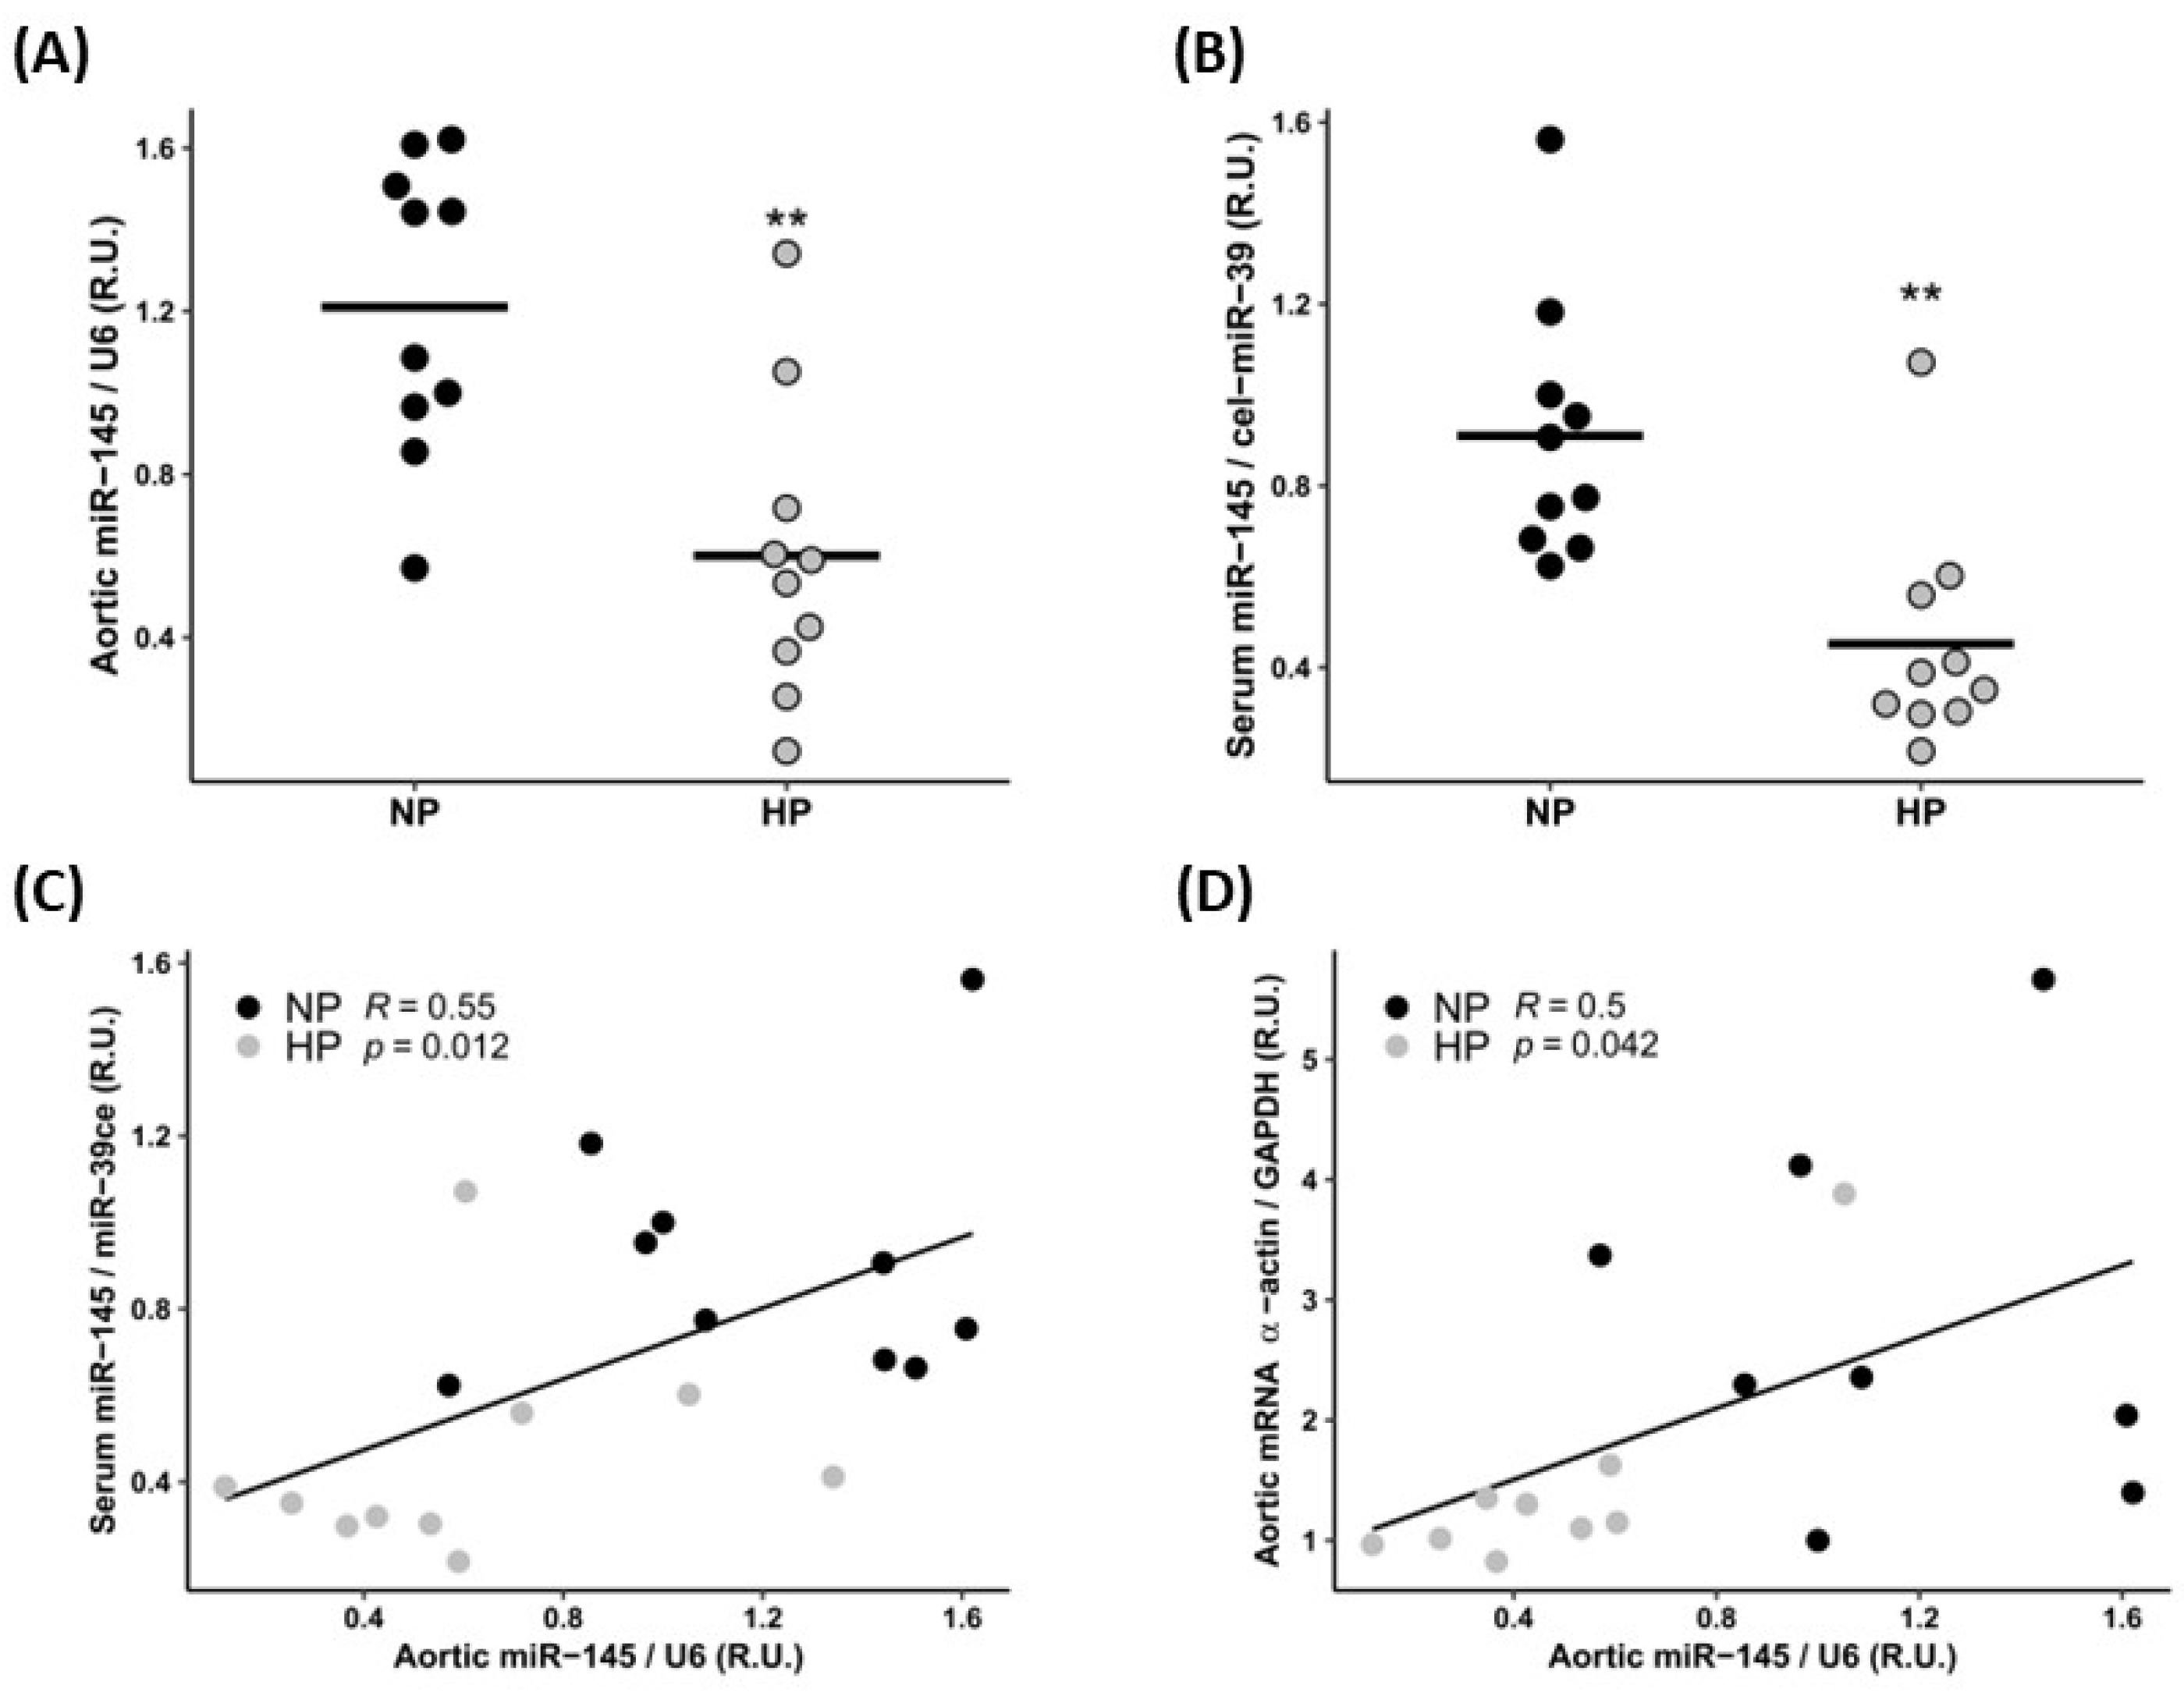
3.1. In Vivo Study
3.1.1. Biochemical Markers
3.1.2. Cardiovascular Parameters
3.2. In Vitro Study
3.2.1. Effect of Increasing the P and PTH Concentrations on miR-145 Levels, Phenotypic Marker Expression and Calcification of the VSMCs
3.2.2. Time Course of miR-145 Levels, α-Actin Expression, and Calcification of the VSMCs Exposed to Standard and High P Concentration
3.2.3. Effect of the miR-145 Silencing and Overexpression on the Phenotypic and Calcification Changes of VSMCs
4. Discussion
5. Conclusions
Supplementary Materials
Author Contributions
Funding
Institutional Review Board Statement
Informed Consent Statement
Data Availability Statement
Acknowledgments
Conflicts of Interest
References
- Calvo, M.S.; Uribarri, J. Public health impact of dietary phosphorus excess on bone and cardiovascular health in the general population. Am. J. Clin. Nutr. 2013, 98, 6–15. [Google Scholar] [CrossRef] [PubMed]
- Hernández, A.; Concepción, M.T.; Rodríguez, M.; Salido, E.; Torres, A. High phosphorus diet increases preproPTH mRNA independent of calcium and calcitriol in normal rats. Kidney Int. 1996, 50, 1872–1878. [Google Scholar] [CrossRef] [PubMed]
- Zhou, C.; Shi, Z.; Ouyang, N.; Ruan, X. Hyperphosphatemia and Cardiovascular Disease. Front. Cell Dev. Biol. 2021, 9, 644363. [Google Scholar] [CrossRef]
- Eddington, H.; Hoefield, R.; Sinha, S.; Chrysochou, C.; Lane, B.; Foley, R.N.; Hegarty, J.; New, J.; O’Donoghue, D.J.; Middleton, R.J.; et al. Serum Phosphate and Mortality in Patients with Chronic Kidney Disease. Clin. J. Am. Soc. Nephrol. 2010, 5, 2251–2257. [Google Scholar] [CrossRef]
- Vervloet, M.G.; Massy, Z.A.; Brandenburg, V.M.; Mazzaferro, S.; Cozzolino, M.; Ureña-Torres, P.; Bover, J.; Goldsmith, D. Bone: A new endocrine organ at the heart of chronic kidney disease and mineral and bone disorders. Lancet Diabetes Endocrinol. 2014, 2, 427–436. [Google Scholar] [CrossRef] [PubMed]
- Cannata-Andía, J.B.; Roman-Garcia, P.; Hruska, K. The connections between vascular calcification and bone health. Nephrol. Dial. Transplant. 2011, 26, 3429–3436. [Google Scholar] [CrossRef] [PubMed]
- Yamamoto, K.T.; Robinson-Cohen, C.; de Oliveira, M.C.; Kostina, A.; Nettleton, J.A.; Ix, J.H.; Nguyen, H.; Eng, J.; Lima, J.A.; Siscovick, D.S.; et al. Dietary phosphorus is associated with greater left ventricular mass. Kidney Int. 2013, 83, 707–714. [Google Scholar] [CrossRef]
- Chang, A.R.; Lazo, M.; Appel, L.J.; Gutiérrez, O.M.; Grams, M.E. High dietary phosphorus intake is associated with all-cause mortality: Results from NHANES III. Am. J. Clin. Nutr. 2014, 99, 320–327. [Google Scholar] [CrossRef]
- Sheridan, K.; Logomarsino, J.V. Effects of serum phosphorus on vascular calcification in a healthy, adult population: A systematic review. J. Vasc. Nurs. Off. Publ. Soc. Peripher. Vasc. Nurs. 2017, 35, 157–169. [Google Scholar] [CrossRef]
- Shroff, R.C.; Shanahan, C.M. Vascular calcification in patients with kidney disease: The Vascular Biology of Calcification. In Seminars in Dialysis; Blackwell Publishing Ltd.: Oxford, UK, 2007; Volume 20, pp. 103–109. [Google Scholar] [CrossRef]
- Mizobuchi, M.; Towler, D.; Slatopolsky, E. Vascular Calcification: The killer of patients with chronic kidney disease. J. Am. Soc. Nephrol. 2009, 20, 1453–1464. [Google Scholar] [CrossRef] [PubMed]
- Giachelli, C.M. Vascular calcification mechanisms. J. Am. Soc. Nephrol. 2004, 15, 2959–2964. [Google Scholar] [CrossRef] [PubMed]
- Moazed, D. Small RNAs in transcriptional gene silencing and genome defence. Nature 2009, 457, 413–420. [Google Scholar] [CrossRef] [PubMed]
- Panizo, S.; Naves-Díaz, M.; Carrillo-López, N.; Martínez-Arias, L.; Fernández-Martín, J.L.; Ruiz-Torres, M.P.; Cannata-Andía, J.B.; Rodríguez, I. MicroRNAs 29b, 133b, and 211 Regulate Vascular Smooth Muscle Calcification Mediated by High Phosphorus. J. Am. Soc. Nephrol. 2016, 27, 824–834. [Google Scholar] [CrossRef] [PubMed]
- Goettsch, C.; Rauner, M.; Pacyna, N.; Hempel, U.; Bornstein, S.R.; Hofbauer, L.C. miR-125b Regulates Calcification of Vascular Smooth Muscle Cells. Am. J. Pathol. 2011, 179, 1594–1600. [Google Scholar] [CrossRef]
- Goettsch, C.; Hutcheson, J.D.; Aikawa, E. MicroRNA in Cardiovascular Calcification: Focus on targets and extracellular vesicle delivery mechanisms. Circ. Res. 2013, 112, 1073–1084. [Google Scholar] [CrossRef]
- Zhang, C. MicroRNA-145 in vascular smooth muscle cell biology: A new therapeutic target for vascular disease. Cell Cycle 2009, 8, 3469–3473. [Google Scholar] [CrossRef]
- Taïbi, F.; Meuth, V.M.-L.; M’Baya-Moutoula, E.; Djelouat, M.S.E.I.; Louvet, L.; Bugnicourt, J.-M.; Poirot, S.; Bengrine, A.; Chillon, J.-M.; Massy, Z.A.; et al. Possible involvement of microRNAs in vascular damage in experimental chronic kidney disease. Biochim. et Biophys. Acta BBA Mol. Basis Dis. 2014, 1842, 88–98. [Google Scholar] [CrossRef]
- Cordes, K.R.; Sheehy, N.T.; White, M.P.; Berry, E.C.; Morton, S.U.; Muth, A.N.; Lee, T.-H.; Miano, J.M.; Ivey, K.N.; Srivastava, D. miR-145 and miR-143 regulate smooth muscle cell fate and plasticity. Nature 2009, 460, 705–710. [Google Scholar] [CrossRef]
- Cheng, Y.; Liu, X.; Yang, J.; Lin, Y.; Xu, D.Z.; Lu, Q.; Deitch, E.A.; Huo, Y.; Delphin, E.S.; Zhang, C. MicroRNA-145, a Novel Smooth Muscle Cell Phenotypic Marker and Modulator, Controls Vascular Neointimal Lesion Formation. Circ. Res. 2009, 105, 158–166. [Google Scholar] [CrossRef]
- Fernández-Villabrille, S.; Martín-Carro, B.; Martín-Vírgala, J.; Alonso-Montes, C.; Palomo-Antequera, C.; García-Castro, R.; López-Ongil, S.; Dusso, A.S.; Fernández-Martín, J.L.; Naves-Díaz, M.; et al. MicroRNA-145 and microRNA-486 are potential serum biomarkers for vascular calcification. Nephrol. Dial. Transpl. 2023, gfad027. [Google Scholar] [CrossRef]
- Livak, K.J.; Schmittgen, T.D. Analysis of relative gene expression data using real-time quantitative PCR and the 2−ΔΔCT Method. Methods 2001, 25, 402–408. [Google Scholar] [CrossRef]
- Calvo, M.S. Dietary considerations to prevent loss of bone and renal function. Nutrition 2000, 16, 564–566. [Google Scholar] [CrossRef]
- Calvo, M.S.; Moshfegh, A.J.; Tucker, K.L. Assessing the Health Impact of Phosphorus in the Food Supply: Issues and Considerations. Adv. Nutr. Int. Rev. J. 2014, 5, 104–113. [Google Scholar] [CrossRef]
- Kalantar-Zadeh, K.; Gutekunst, L.; Mehrotra, R.; Kovesdy, C.P.; Bross, R.; Shinaberger, C.S.; Noori, N.; Hirschberg, R.; Benner, D.; Nissenson, A.R.; et al. Understanding Sources of Dietary Phosphorus in the Treatment of Patients with Chronic Kidney Disease. Clin. J. Am. Soc. Nephrol. 2010, 5, 519–530. [Google Scholar] [CrossRef] [PubMed]
- Shinaberger, C.S.; Greenland, S.; Kopple, J.D.; Van Wyck, D.; Mehrotra, R.; Kovesdy, C.P.; Kalantar-Zadeh, K. Is controlling phosphorus by decreasing dietary protein intake beneficial or harmful in persons with chronic kidney disease? Am. J. Clin. Nutr. 2008, 88, 1511–1518. [Google Scholar] [CrossRef] [PubMed]
- Sawin, D.-A.; Ma, L.; Stennett, A.; Ofsthun, N.; Himmele, R.; Kossmann, R.J.; Maddux, F.W. Phosphates in medications: Impact on dialysis patients. Clin. Nephrol. 2020, 93, 163–171. [Google Scholar] [CrossRef] [PubMed]
- Kendrick, J.; Kestenbaum, B.; Chonchol, M. Phosphate and Cardiovascular Disease. Adv. Chronic Kidney Dis. 2011, 18, 113–119. [Google Scholar] [CrossRef] [PubMed]
- Foley, R.N.; Collins, A.J.; Herzog, C.A.; Ishani, A.; Kalra, P.A. Serum Phosphorus Levels Associate with Coronary Atherosclerosis in Young Adults. J. Am. Soc. Nephrol. 2009, 20, 397–404. [Google Scholar] [CrossRef]
- Bai, W.; Li, J.; Liu, J. Serum phosphorus, cardiovascular and all-cause mortality in the general population: A meta-analysis. Clin. Chim. Acta 2016, 461, 76–82. [Google Scholar] [CrossRef]
- Bozic, M.; Panizo, S.; Sevilla, M.A.; Riera, M.; Soler, M.J.; Pascual, J.; Lopez, I.; Freixenet, M.; Fernandez, E.; Valdivielso, J.M. High phosphate diet increases arterial blood pressure via a parathyroid hormone mediated increase of renin. J. Hypertens. 2014, 32, 1822–1832. [Google Scholar] [CrossRef]
- McClure, S.T.; Rebholz, C.M.; Mitchell, D.C.; Selvin, E.; Appel, L.J. The association of dietary phosphorus with blood pressure: Results from a secondary analysis of the PREMIER trial. J. Hum. Hypertens. 2020, 34, 132–142. [Google Scholar] [CrossRef]
- Palit, S. Vascular Calcification in Chronic Kidney Disease: Role of Disordered Mineral Metabolism. Curr. Pharm. Des. 2014, 20, 5829–5833. [Google Scholar] [CrossRef] [PubMed]
- Cozzolino, M.; Ciceri, P.; Galassi, A.; Mangano, M.; Carugo, S.; Capelli, I.; Cianciolo, G. The Key Role of Phosphate on Vascular Calcification. Toxins 2019, 11, 213. [Google Scholar] [CrossRef]
- Carrillo-López, N.; Martínez-Arias, L.; Alonso-Montes, C.; Martín-Carro, B.; Martín-Vírgala, J.; Ruiz-Ortega, M.; Fernández-Martín, J.L.; Dusso, A.S.; Rodriguez-García, M.; Naves-Díaz, M.; et al. The receptor activator of nuclear factor κΒ ligand receptor leucine-rich repeat-containing G-protein-coupled receptor 4 contributes to parathyroid hormone-induced vascular calcification. Nephrol. Dial. Transplant. 2021, 36, 618–631. [Google Scholar] [CrossRef]
- Carrillo-López, N.; Panizo, S.; Alonso-Montes, C.; Martínez-Arias, L.; Avello, N.; Sosa, P.; Dusso, A.S.; Cannata-Andía, J.B.; Naves-Díaz, M. High-serum phosphate and parathyroid hormone distinctly regulate bone loss and vascular calcification in experimental chronic kidney disease. Nephrol. Dial. Transplant. 2019, 34, 934–941. [Google Scholar] [CrossRef] [PubMed]
- Owens, G.K.; Kumar, M.S.; Wamhoff, B.R.; Franco, P.N.; Durrant, L.M.; Carreon, D.; Haddad, E.; Vergara, A.; Cascavita, C.; Obenaus, A.; et al. Molecular Regulation of Vascular Smooth Muscle Cell Differentiation in Development and Disease. Physiol. Rev. 2004, 84, 767–801. [Google Scholar] [CrossRef] [PubMed]
- Ji, R.; Cheng, Y.; Yue, J.; Yang, J.; Liu, X.; Chen, H.; Dean, D.B.; Zhang, C. MicroRNA Expression Signature and Antisense-Mediated Depletion Reveal an Essential Role of MicroRNA in Vascular Neointimal Lesion Formation. Circ. Res. 2007, 100, 1579–1588. [Google Scholar] [CrossRef]
- Carrillo-López, N.; Panizo, S.; Arcidiacono, M.V.; de la Fuente, S.; Martínez-Arias, L.; Ottaviano, E.; Ulloa, C.; Ruiz-Torres, M.P.; Rodríguez, I.; Cannata-Andía, J.B.; et al. Vitamin D Treatment Prevents Uremia-Induced Reductions in Aortic microRNA-145 Attenuating Osteogenic Differentiation despite Hyperphosphatemia. Nutrients 2022, 14, 2589. [Google Scholar] [CrossRef]
- Rangrez, A.Y.; M’Baya-Moutoula, E.; Metzinger-Le Meuth, V.; Hénaut, L.; Djelouat, M.S.E.I.; Benchitrit, J.; Massy, Z.A.; Metzinger, L. Inorganic Phosphate Accelerates the Migration of Vascular Smooth Muscle Cells: Evidence for the Involvement of miR-223. PLoS ONE 2012, 7, e47807. [Google Scholar] [CrossRef]
- Rangrez, A.Y.; Massy, Z.A.; Meuth, V.M.-L.; Metzinger, L. miR-143 and miR-145: Molecular keys to switch the phe-notype of vascular smooth muscle cells. Circ. Cardiovasc. Genet. 2011, 4, 197–205. [Google Scholar] [CrossRef]
- Hu, B.; Wu, Z.; Liu, T.; Ullenbruch, M.R.; Jin, H.; Phan, S.H. Gut-Enriched Krüppel-Like Factor Interaction with Smad3 Inhibits Myofibroblast Differentiation. Am. J. Respir. Cell Mol. Biol. 2007, 36, 78–84. [Google Scholar] [CrossRef] [PubMed]
- Xin, M.; Small, E.M.; Sutherland, L.B.; Qi, X.; McAnally, J.; Plato, C.F.; Richardson, J.A.; Bassel-Duby, R.; Olson, E.N. MicroRNAs miR-143 and miR-145 modulate cytoskeletal dynamics and responsiveness of smooth muscle cells to injury. Genes Dev. 2009, 23, 2166–2178. [Google Scholar] [CrossRef] [PubMed]
- Chen, X.; Liang, H.; Zhang, J.; Zen, K.; Zhang, C.-Y. Secreted microRNAs: A new form of intercellular communication. Trends Cell Biol. 2012, 22, 125–132. [Google Scholar] [CrossRef] [PubMed]


| NP | HP | p | |
|---|---|---|---|
| n | 10 | 10 | |
| Serum P (mg/dL) (median [IQR]) | 3.98 [3.58, 4.18] | 4.36 [4.12, 4.59] | 0.023 |
| Serum Ca (mg/dL) (median [IQR]) | 10.27 [10.06, 10.34] | 10.17 [9.99, 10.31] | 0.544 |
| PTH (pg/mL) (median [IQR]) | 232.62 [171.18, 289.46] | 459.62 [390.62, 618.39] | <0.001 |
| FGF23 (pg/mL) (median [IQR]) | 55.55 [44.02, 124.57] | 67.68 [40.96, 77.80] | 0.796 |
| Creatinine clearance (mL/min) (median [IQR]) | 3.00 [2.81, 3.25] | 2.72 [2.20, 3.16] | 0.151 |
| Fractional Excretion of P (%) (median [IQR]) | 0.21 [0.09, 1.05] | 21.77 [19.43, 24.77] | <0.001 |
| Fractional Excretion of Ca (%) (median [IQR]) | 0.69 [0.54, 0.87] | 0.25 [0.15, 0.30] | 0.003 |
| NP | HP | p | |
|---|---|---|---|
| n | 10 | 10 | |
| Systolic Blood Pressure (mmHg) (median [IQR]) | 118.50 [116.34, 125.18] | 125.39 [119.92, 129.14] | 0.190 |
| Diastolic Blood Pressure (mmHg) (median [IQR]) | 83.50 [78.63, 88.00] | 93.86 [91.25, 98.54] | 0.015 |
| Heart weight (g)/Body weight (g) × 100 (median [IQR]) | 0.21 [0.20, 0.22] | 0.21 [0.21, 0.21] | 0.940 |
| Aortic Calcium content (µg/mg protein) (median [IQR]) | 1.97 [1.39, 3.31] | 4.88 [1.55, 6.49] | 0.288 |
| Aortas Von Kossa staining positive (%) | 0 | 0 | |
| Aortic α-actin expression (R.U.) (median [IQR]) | 1.03 [0.76, 1.90] | 0.44 [0.37, 0.56] | 0.009 |
| Aortic Runx2 expression (R.U.) (median [IQR]) | 0.79 [0.54, 1.34] | 0.88 [0.66, 1.92] | 0.485 |
| Aortic Osx expression (R.U.) (median [IQR]) | 0.94 [0.40, 1.44] | 1.71 [1.33, 1.94] | 0.209 |
Disclaimer/Publisher’s Note: The statements, opinions and data contained in all publications are solely those of the individual author(s) and contributor(s) and not of MDPI and/or the editor(s). MDPI and/or the editor(s) disclaim responsibility for any injury to people or property resulting from any ideas, methods, instructions or products referred to in the content. |
© 2023 by the authors. Licensee MDPI, Basel, Switzerland. This article is an open access article distributed under the terms and conditions of the Creative Commons Attribution (CC BY) license (https://creativecommons.org/licenses/by/4.0/).
Share and Cite
Fernández-Villabrille, S.; Martín-Carro, B.; Martín-Vírgala, J.; Alonso-Montes, C.; Fernández-Fernández, A.; Martínez-Salgado, C.; Fernández-Martín, J.L.; Naves-Díaz, M.; Cannata-Andía, J.B.; Carrillo-López, N.; et al. Phosphorus May Induce Phenotypic Transdifferentiation of Vascular Smooth Muscle Cells through the Reduction of microRNA-145. Nutrients 2023, 15, 2918. https://doi.org/10.3390/nu15132918
Fernández-Villabrille S, Martín-Carro B, Martín-Vírgala J, Alonso-Montes C, Fernández-Fernández A, Martínez-Salgado C, Fernández-Martín JL, Naves-Díaz M, Cannata-Andía JB, Carrillo-López N, et al. Phosphorus May Induce Phenotypic Transdifferentiation of Vascular Smooth Muscle Cells through the Reduction of microRNA-145. Nutrients. 2023; 15(13):2918. https://doi.org/10.3390/nu15132918
Chicago/Turabian StyleFernández-Villabrille, Sara, Beatriz Martín-Carro, Julia Martín-Vírgala, Cristina Alonso-Montes, Alejandra Fernández-Fernández, Carlos Martínez-Salgado, José L. Fernández-Martín, Manuel Naves-Díaz, Jorge B. Cannata-Andía, Natalia Carrillo-López, and et al. 2023. "Phosphorus May Induce Phenotypic Transdifferentiation of Vascular Smooth Muscle Cells through the Reduction of microRNA-145" Nutrients 15, no. 13: 2918. https://doi.org/10.3390/nu15132918
APA StyleFernández-Villabrille, S., Martín-Carro, B., Martín-Vírgala, J., Alonso-Montes, C., Fernández-Fernández, A., Martínez-Salgado, C., Fernández-Martín, J. L., Naves-Díaz, M., Cannata-Andía, J. B., Carrillo-López, N., & Panizo, S. (2023). Phosphorus May Induce Phenotypic Transdifferentiation of Vascular Smooth Muscle Cells through the Reduction of microRNA-145. Nutrients, 15(13), 2918. https://doi.org/10.3390/nu15132918