
Food Literacy Scale: Validation through Exploratory and Confirmatory Factor Analysis in a Sample of Portuguese University Students

 , ,
, ,  and
and
Abstract
1. Introduction
2. Materials and Methods
2.1. Instrument and Data Collection
2.2. Data Analysis
- r < 0.2—very low correlation;
- 0.2 ≤ r ≤ 0.39—low correlation;
- 0.4 ≤ r ≤ 0.69—moderate correlation;
- 0.7 ≤ r ≤ 0.89—high correlation;
- 0.9 ≤ r ≤ 1—very high correlation.
2.3. Sample Characterization
3. Results
3.1. Psychometric Study of the Scale
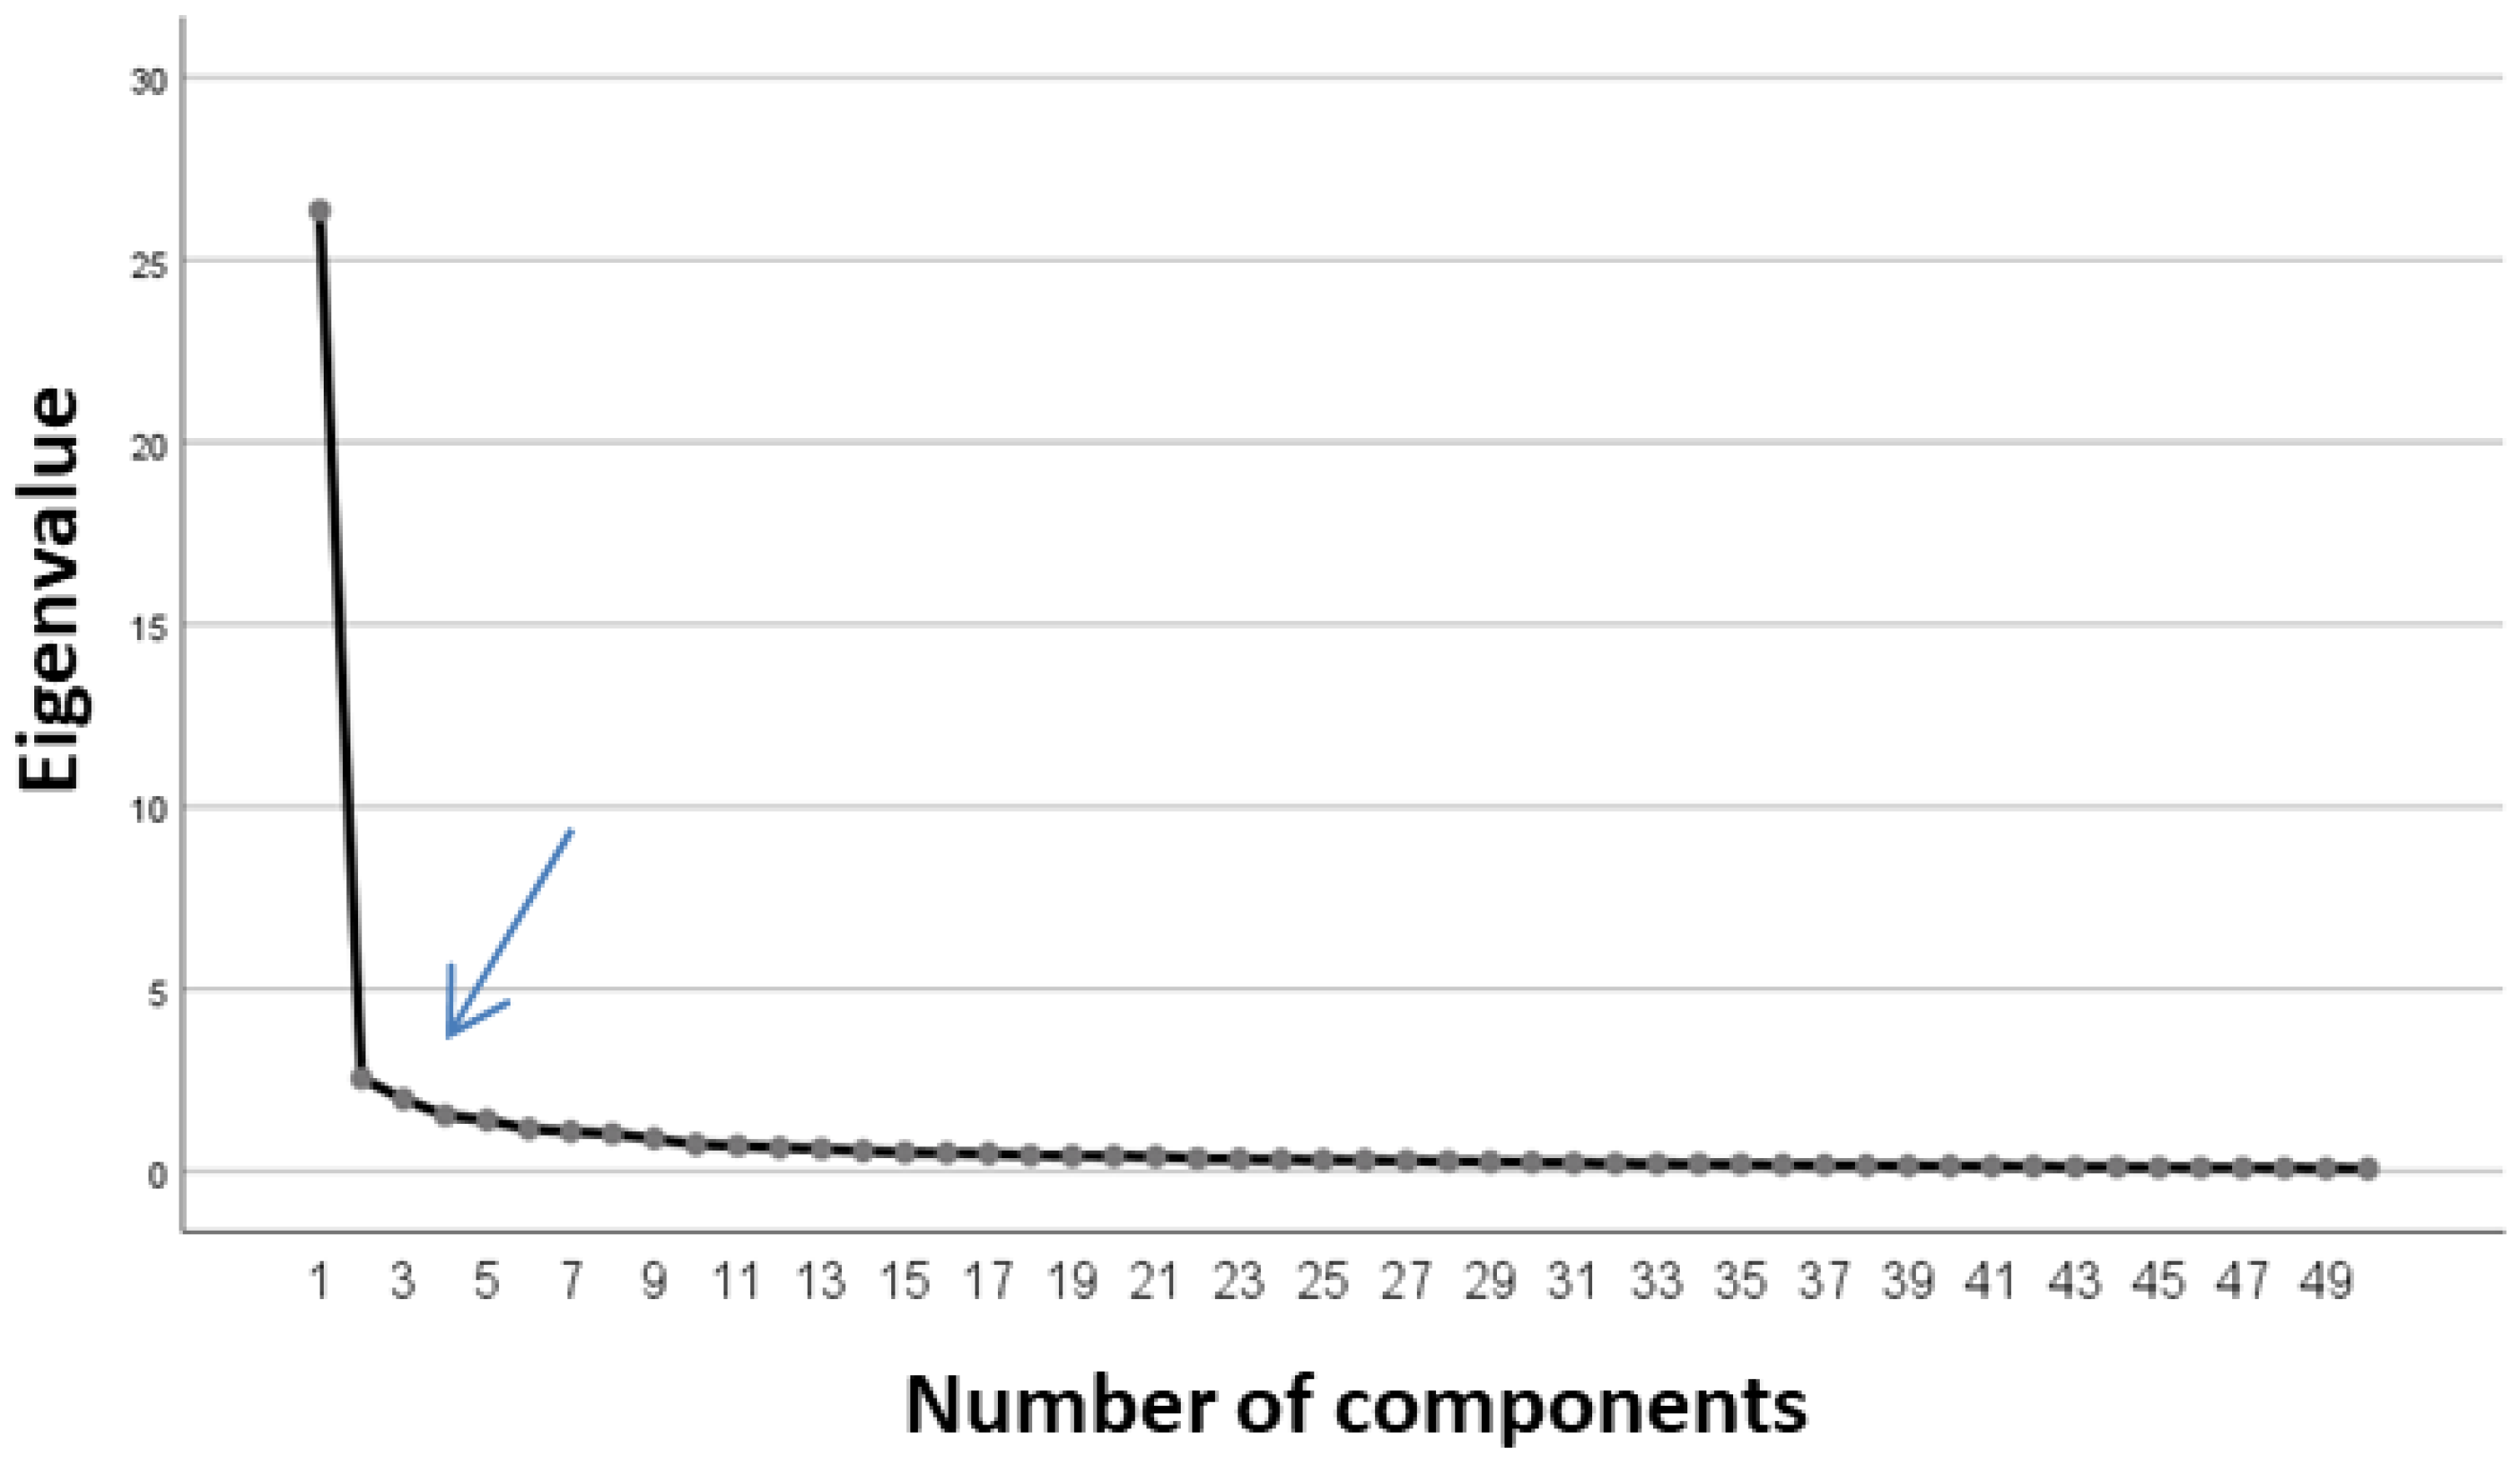
3.2. Exploratory Factor Analysis
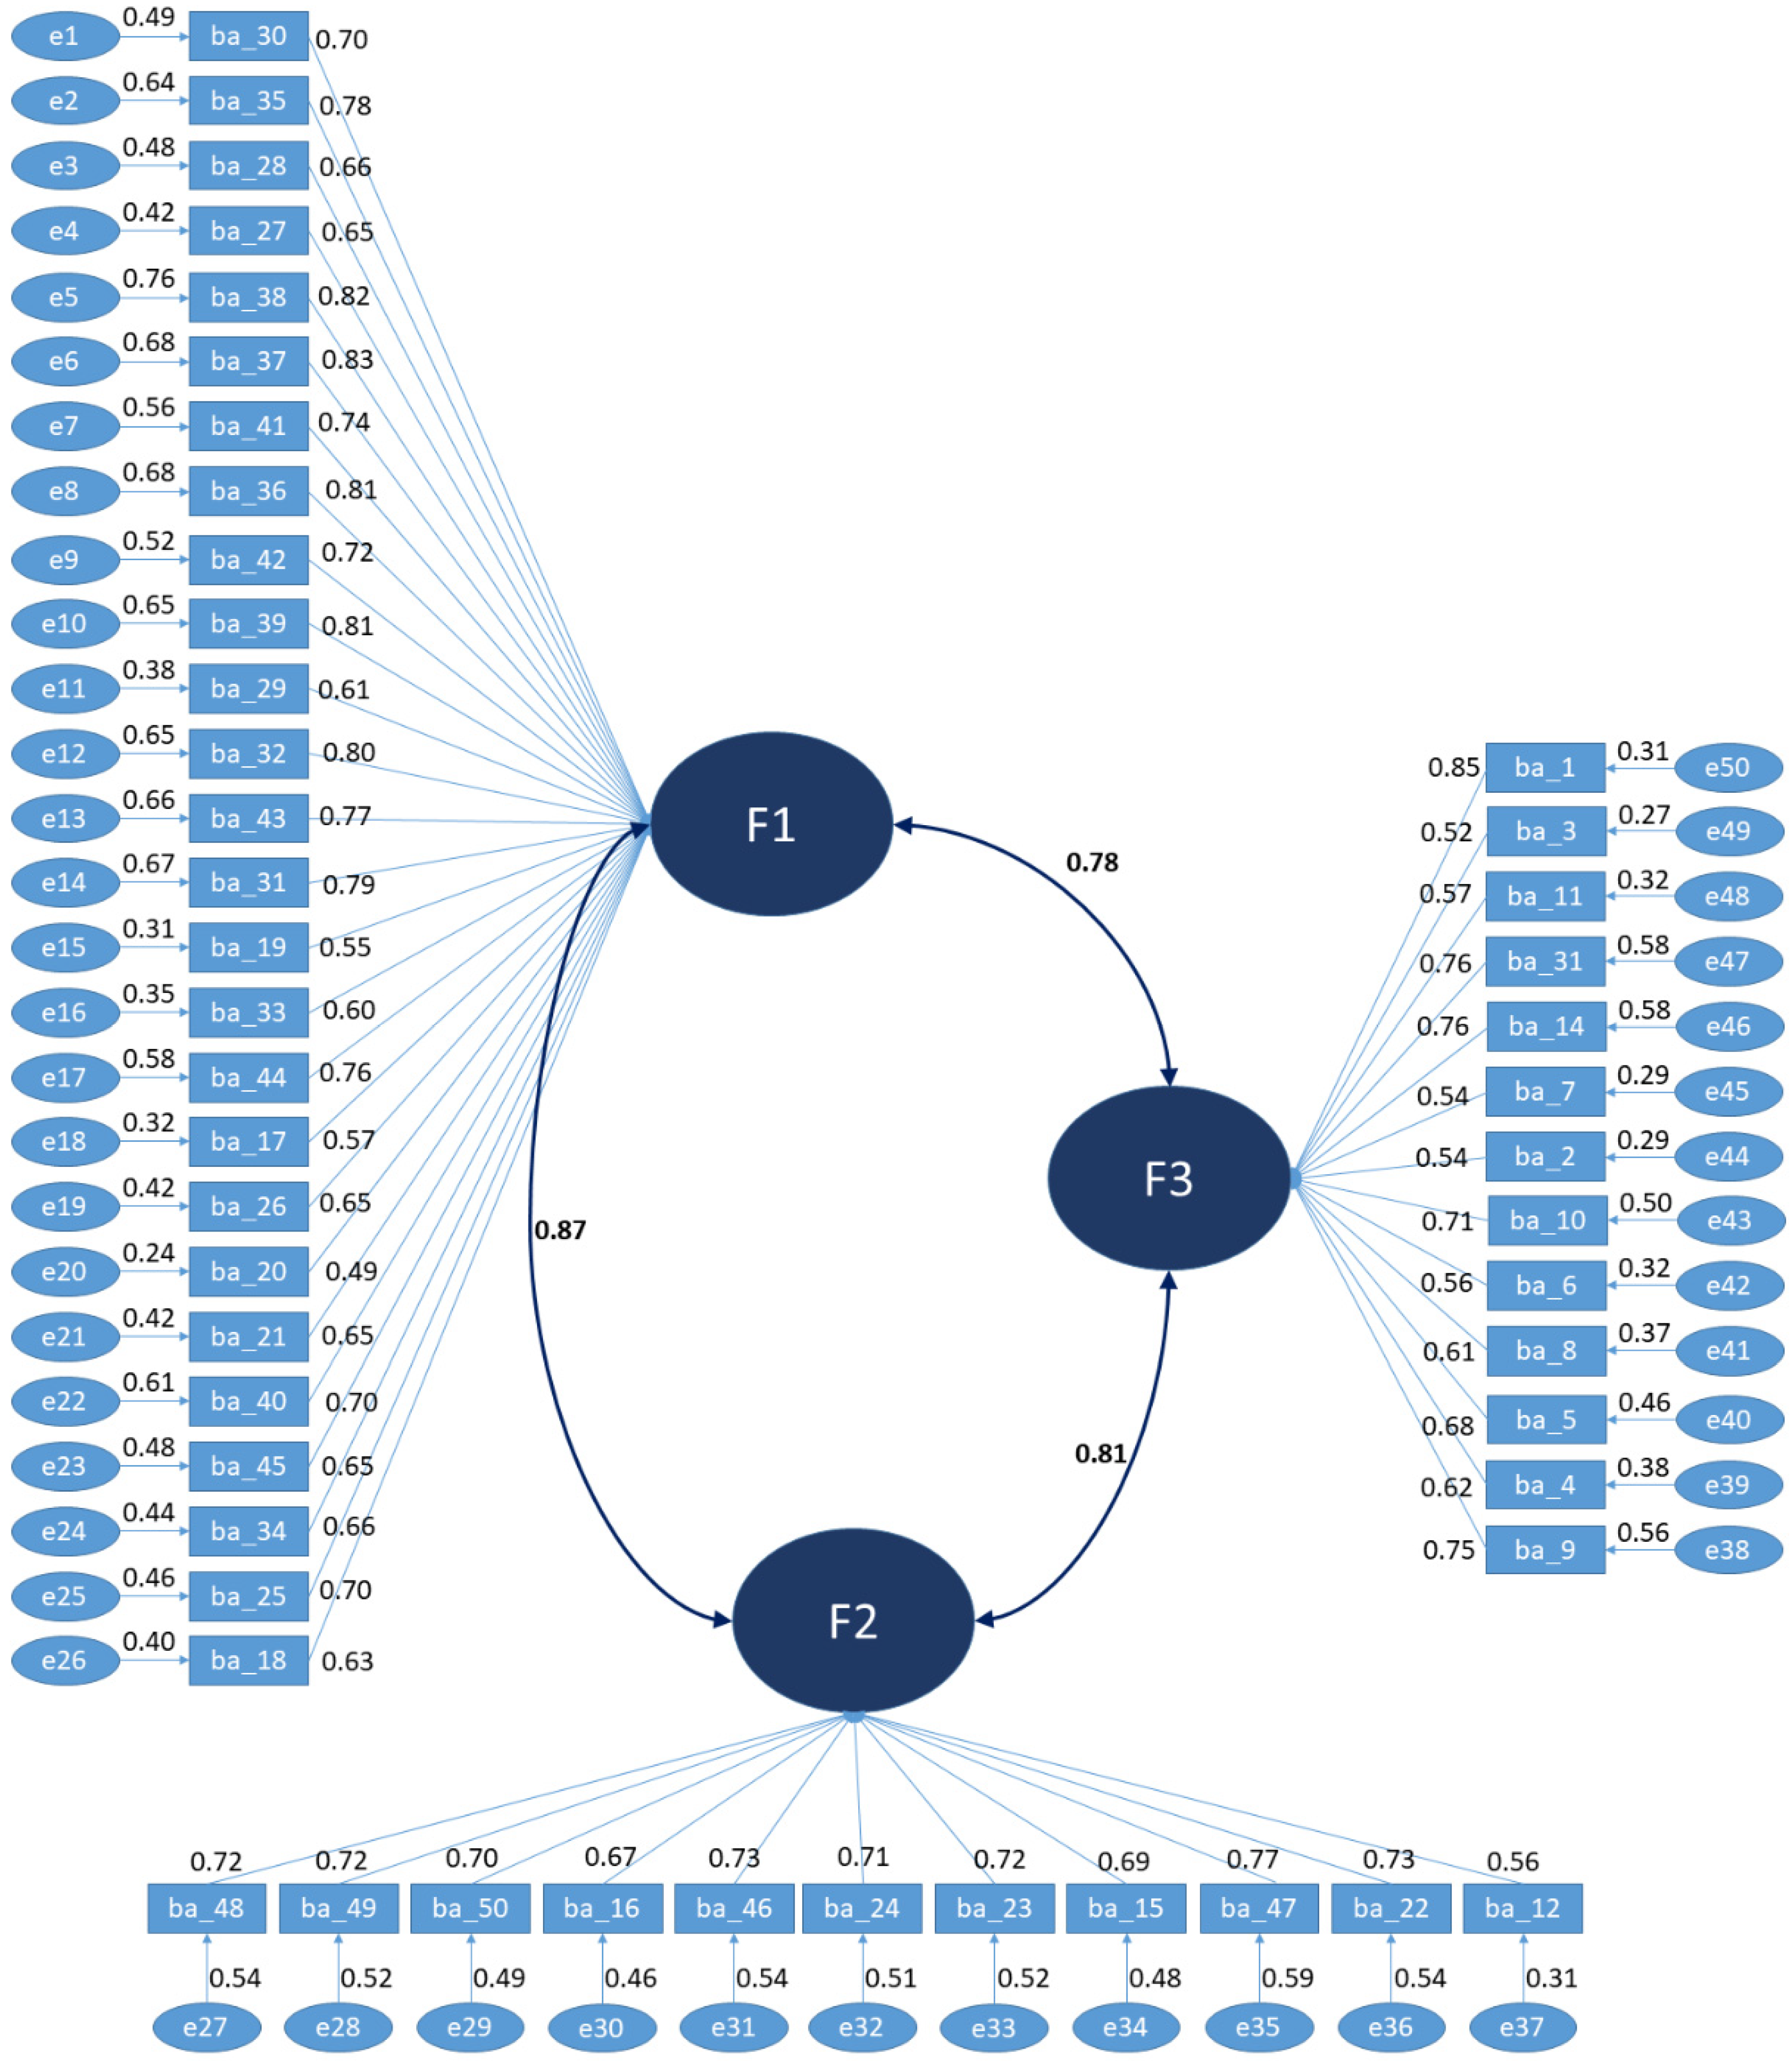
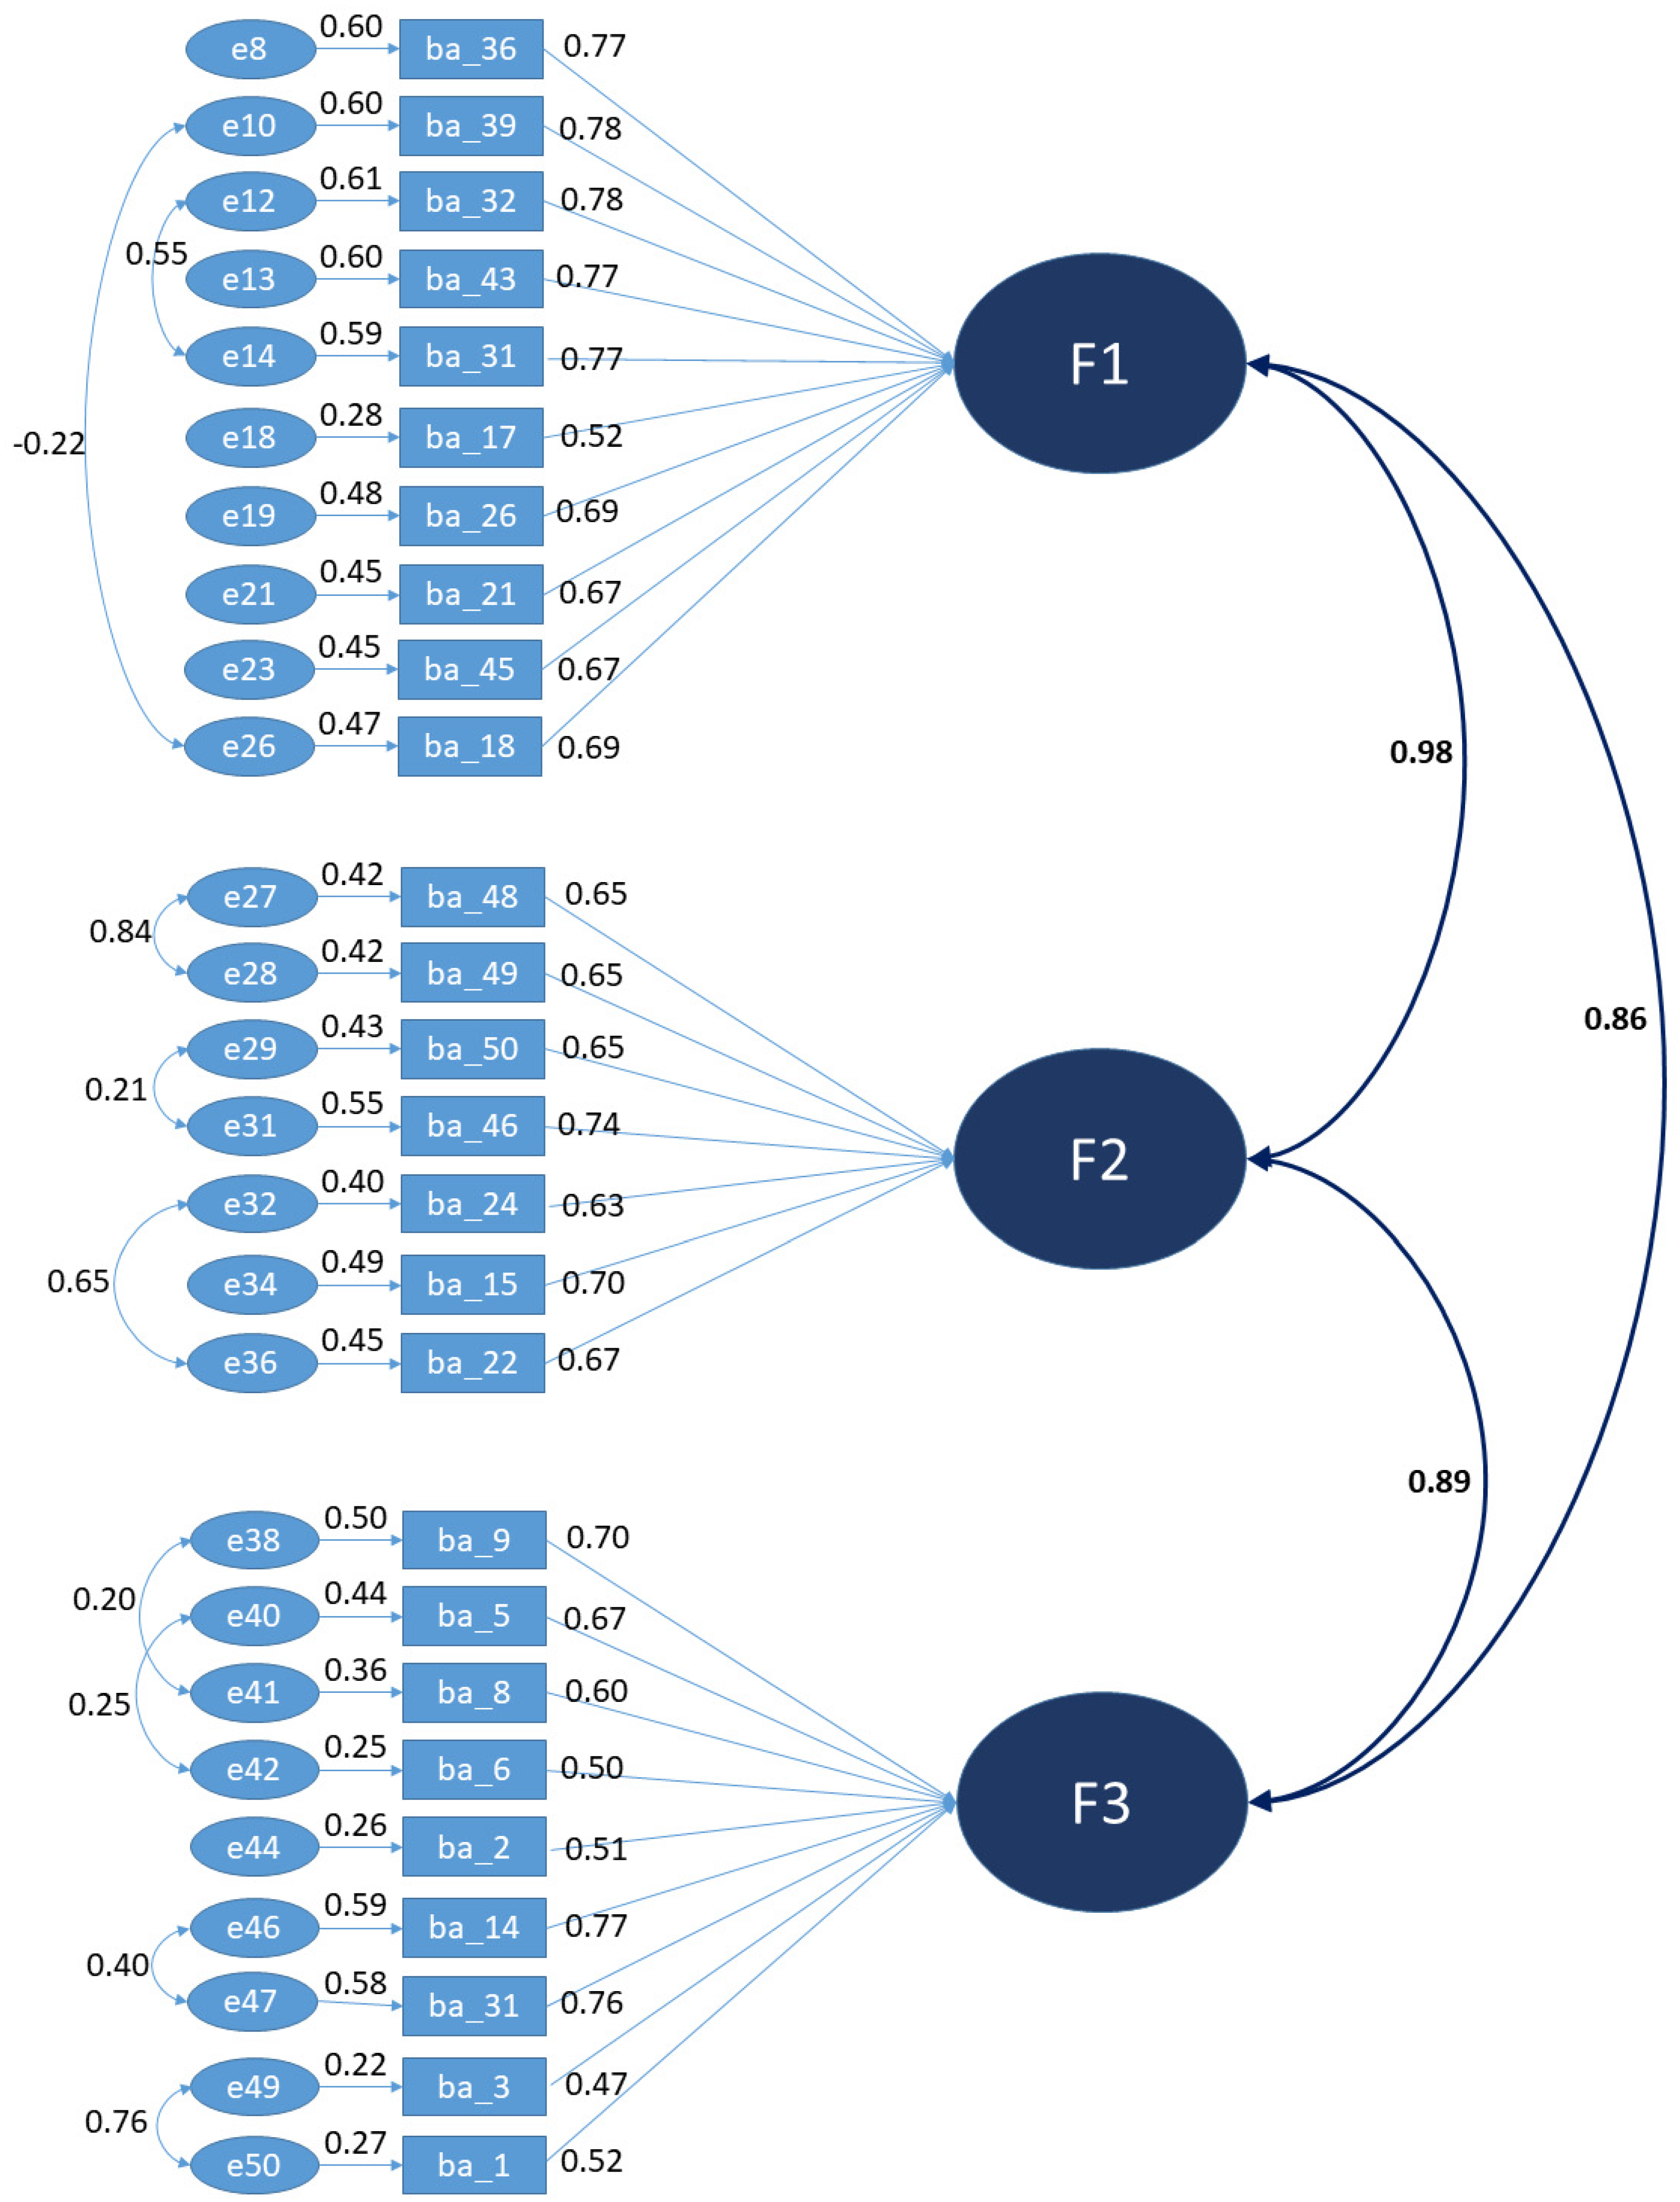
3.3. Confirmatory Factor Analysis
- Factor 1: Literacy about the nutritional composition of foods. From factor F1, we excluded items 19, 20, 25, 27, 28, 29, 30, 33, 34, 35, 37, 38, 40, 41, 42, and 44, leaving only 10 items: 17, 18, 21, 26, 31, 32, 36, 39, 43, and 45.
- Factor 2: Literacy about labelling and food choices. Items 12, 16, 23, and 47 were excluded from factor F2, leaving only 7 items: 15, 22, 24, 46, 48, 49, and 50.
- Factor 3: Literacy about healthy eating practices. Items 4, 7, 10, and 11 were excluded from factor F3, leaving it to only be constituted by 9 items: 1, 2, 3, 5, 6, 8, 9, 13, and 14.
4. Discussion
4.1. Implications and Particularities of the Higher Education Students towards Food
4.2. The Measurement of Food Lietracy
4.3. Limitations of the Study, Value, and Future Perspectives
5. Conclusions
Author Contributions
Funding
Institutional Review Board Statement
Informed Consent Statement
Data Availability Statement
Acknowledgments
Conflicts of Interest
References
- Kabir, A.; Miah, S.; Islam, A. Factors Influencing Eating Behavior and Dietary Intake among Resident Students in a Public University in Bangladesh: A Qualitative Study. PLoS ONE 2018, 13, e0198801. [Google Scholar] [CrossRef] [PubMed]
- Contento, I.R. Nutrition Education: Linking Research, Theory & Practice, 3rd ed.; Jones & Bartlett Publishers: Burlington, MA, USA, 2016. [Google Scholar]
- McWhorter, J.W.; LaRue, D.M.; Almohamad, M.; Danho, M.P.; Misra, S.; Tseng, K.C.; Weston, S.R.; Moore, L.S.; Durand, C.; Hoelscher, D.M.; et al. Training of Registered Dietitian Nutritionists to Improve Culinary Skills and Food Literacy. J. Nutr. Educ. Behav. 2022, 54, 784–793. [Google Scholar] [CrossRef] [PubMed]
- Elsborg, P.; Thorsen, A.V.; Ravn-Haren, G.; Bonde, A.H.; Andersen, S.G.; Vermund, M.C.; Klinker, C.D.; Stjernqvist, N.W. Improved Food Literacy among Schoolchildren as an Effect of a Food Camp Intervention: Results of a Controlled Effectiveness Trial. Appetite 2022, 169, 105845. [Google Scholar] [CrossRef] [PubMed]
- Rosas, R.; Pimenta, F.; Leal, I.; Schwarzer, R. FOODLIT-Tool: Development and Validation of the Adaptable Food Literacy Tool towards Global Sustainability within Food Systems. Appetite 2022, 168, 105658. [Google Scholar] [CrossRef] [PubMed]
- Kawasaki, Y.; Akamatsu, R.; Fujiwara, Y.; Omori, M.; Sugawara, M.; Yamazaki, Y.; Matsumoto, S.; Iwakabe, S.; Kobayashi, T. Association of Healthy Eating Literacy and Resident Status with Energy, Nutrients, and Food Consumption among Lean and Normal-Weight Female University Students. Clin. Nutr. ESPEN 2022, 51, 419–423. [Google Scholar] [CrossRef]
- Mattes, R.; Foster, G.D. Food Environment and Obesity. Obesity 2014, 22, 2459–2461. [Google Scholar] [CrossRef]
- Boustani, N.M.; Guiné, R.P.F. Food Choice Motivations and Perception of a Healthy Diet in a Developing Mediterranean Country. Open Agric. 2020, 5, 485–495. [Google Scholar] [CrossRef]
- Ferreira, V.A.; Lopes, A.C.S.; Guiné, R.d.P.F.; Ribeiro, M.C.; Pires, I.S.C.; Miranda, L.S.; Magalhães, R. Perception of Healthy Eating among Adults Participating in the Eat-Mot Survey in Brazil. Res. Soc. Dev. 2021, 10, e50110212601. [Google Scholar] [CrossRef]
- Guiné, R.P.F.; Bartkiene, E.; Szűcs, V.; Tarcea, M.; Ljubičić, M.; Černelič-Bizjak, M.; Isoldi, K.; EL-Kenawy, A.; Ferreira, V.; Straumite, E.; et al. Study about Food Choice Determinants According to Six Types of Conditioning Motivations in a Sample of 11,960 Participants. Foods 2020, 9, 888. [Google Scholar] [CrossRef]
- Malan, H.; Watson, T.D.; Slusser, W.; Glik, D.; Rowat, A.C.; Prelip, M. Challenges, Opportunities, and Motivators for Developing and Applying Food Literacy in a University Setting: A Qualitative Study. J. Acad. Nutr. Diet 2020, 120, 33–44. [Google Scholar] [CrossRef]
- Hill, M.M.; Hill, A. Investigação Por Questionário, 2nd ed.; Edições Sílabo: Lisboa, Portugal, 2009. [Google Scholar]
- Guiné, R.P.F.; Florença, S.G.; Villalobos Moya, K.; Anjos, O. Edible Flowers, Old Tradition or New Gastronomic Trend: A First Look at Consumption in Portugal versus Costa Rica. Foods 2020, 9, 977. [Google Scholar] [CrossRef] [PubMed]
- Guiné, R.P.F.; Florença, S.G.; Barroca, M.J.; Anjos, O. The Link between the Consumer and the Innovations in Food Product Development. Foods 2020, 9, 1317. [Google Scholar] [CrossRef] [PubMed]
- Macena, M.W.; Carvalho, R.; Cruz-Lopes, L.P.; Guiné, R.P.F. Perceptions and Knowledge Regarding Quality and Safety of Plastic Materials Used for Food Packaging. Open Agric. 2022, 7, 132–146. [Google Scholar] [CrossRef]
- Triola, M.F.; Flores, V.R.L.F. Instrodução ÀEstatística, 12th ed.; LTC: Rio de Janeiro, Brasil, 2017. [Google Scholar]
- Levin, J.; Fox, J.A. Estatística Para Ciências Humanas, 9th ed.; Pearson: Rio de Janeiro, Brasil, 2004. [Google Scholar]
- Base de Dados de Portugal | Pordata. Available online: https://www.pordata.pt/Portugal (accessed on 26 December 2022).
- Alunos Matriculados No Ensino Superior: Total e Por Sexo. Available online: https://www.pordata.pt/Portugal/Alunos+matriculados+no+ensino+superior+total+e+por+sexo-1048 (accessed on 26 December 2022).
- Cochran, W.G. Sampling Techniques, 3rd ed.; John Wiley & Sons: New York, NY, USA, 1977. [Google Scholar]
- Levine, D.M.; Stephan, D.F.; Krehbiel, T.C.; Berenson, M.L. Estatistica Teoria E Aplicacoes Usando O Microsoft Excel Em Portugues, 5th ed.; LTC: Rio de Janeiro, Brasil, 2008; ISBN 978-85-216-1634-4. [Google Scholar]
- Florença, S.G.; Correia, P.M.R.; Costa, C.A.; Guiné, R.P.F. Edible Insects: Preliminary Study about Perceptions, Attitudes, and Knowledge on a Sample of Portuguese Citizens. Foods 2021, 10, 709. [Google Scholar] [CrossRef]
- Maroco, J.; Garcia-Marques, T. Qual a Fiabilidade Do Alfa de Cronbach? Questões Antigas e Soluções Modernas? Laboratório de Psicol. 2006, 4, 65–90. [Google Scholar] [CrossRef]
- Martins, M.E.G. Coeficiente de Correlação Amostral. Rev. De Ciência Elem. 2014, 2, 34–36. [Google Scholar]
- Pestana, M.H.; Gageiro, J.N. Análise de Dados Para Ciências Sociais—A Complementaridade Do SPSS, 6th ed.; Edições Sílabo: Lisbon, Portugal, 2014. [Google Scholar]
- Dini, A.P.; Alves, D.F.d.S.; Oliveira, H.C.; Guirardello, E.d.B. Validade e confiabilidade de um instrumento de classificação de pacientes pediátricos. Rev. Latino-Am. Enfermagem 2014, 22, 598–603. [Google Scholar] [CrossRef] [PubMed]
- Marôco, J. Análise Estatística Com o SPSS Statistics, 7th ed.; ReportNumber: Lisbon, Portugal, 2018. [Google Scholar]
- Hair, J.F.; Black, W.C.; Babin, B.J.; Anderson, R.E. Multivariate Data Analysis, 7th ed.; Prentice Hall: Upper Saddle River, NJ, USA, 2009; ISBN 978-0-13-813263-7. [Google Scholar]
- Marôco, J. Análise de Equações Estruturais. Fundamentos Teóricos, Software e Aplicações; ReportNumber: Lisboa, Portugal, 2014. [Google Scholar]
- Flora, D.; LaBrish, C.; Chalmers, R. Old and New Ideas for Data Screening and Assumption Testing for Exploratory and Confirmatory Factor Analysis. Front. Psychol. 2012, 3, 55. [Google Scholar] [CrossRef]
- Can, S.; van de Schoot, R.; Hox, J. Collinear Latent Variables in Multilevel Confirmatory Factor Analysis: A Comparison of Maximum Likelihood and Bayesian Estimations. Educ. Psychol. Meas. 2015, 75, 406–427. [Google Scholar] [CrossRef]
- Florença, S.G.; Ferrão, A.C.; Ferreira, M.; Duarte, J.; Nunes, B.; Morais, P.; Sanches, R.; Abrantes, R.; Guiné, R. Study about Eating Habits of Higher Education Students. In Proceedings of the Food and Nutrition Congress, Porto, Portugal, 16–17 May 2019. [Google Scholar]
- Galvão, A.; Pina, A. Atitudes, Comportamentos de Saúde, Vivências Académicas e Literacia de Estudantes Do Ensino Superior: Estudo Empírico. In Literacia em Saúde e Autocuidados: Evidências que Projetam a Prática; Euromédice, Edições Médicas: Algés, Portugal, 2021; pp. 197–210. [Google Scholar]
- Sprake, E.F.; Russell, J.M.; Cecil, J.E.; Cooper, R.J.; Grabowski, P.; Pourshahidi, L.K.; Barker, M.E. Dietary Patterns of University Students in the UK: A Cross-Sectional Study. Nutr. J. 2018, 17, 90. [Google Scholar] [CrossRef]
- Bica, M.S. Alimentação Adequada e Estudantes Universitários: Uma Proposta de Intervenção; Faculdade de Ciências da Nutrição e Alimentação da Universidade do Porto: Porto, Portugal, 2018. [Google Scholar]
- Burriel, F.C.; Urrea, R.S.; García, C.V.; Tobarra, M.M.; Meseguer, M.J.G. Food Habits and Nutritional Assessment in a University Population. Nutr. Hosp. 2013, 28, 438–446. [Google Scholar] [CrossRef]
- Nelson, M.C.; Story, M.; Larson, N.I.; Neumark-Sztainer, D.; Lytle, L.A. Emerging Adulthood and College-Aged Youth: An Overlooked Age for Weight-Related Behavior Change. Obesity 2008, 16, 2205–2211. [Google Scholar] [CrossRef] [PubMed]
- Larson, N.I.; Nelson, M.C.; Neumark-Sztainer, D.; Story, M.; Hannan, P.J. Making Time for Meals: Meal Structure and Associations with Dietary Intake in Young Adults. J. Am. Diet. Assoc. 2009, 109, 72–79. [Google Scholar] [CrossRef] [PubMed]
- Papadaki, A.; Hondros, G.; Scott, J.A.; Kapsokefalou, M. Eating Habits of University Students Living at, or Away from Home in Greece. Appetite 2007, 49, 169–176. [Google Scholar] [CrossRef] [PubMed]
- Serra-Majem, L.; Román-Viñas, B.; Sanchez-Villegas, A.; Guasch-Ferré, M.; Corella, D.; La Vecchia, C. Benefits of the Mediterranean Diet: Epidemiological and Molecular Aspects. Mol. Asp. Med. 2019, 67, 1–55. [Google Scholar] [CrossRef]
- Román, G.C.; Jackson, R.E.; Gadhia, R.; Román, A.N.; Reis, J. Mediterranean Diet: The Role of Long-Chain ω-3 Fatty Acids in Fish; Polyphenols in Fruits, Vegetables, Cereals, Coffee, Tea, Cacao and Wine; Probiotics and Vitamins in Prevention of Stroke, Age-Related Cognitive Decline, and Alzheimer Disease. Rev. Neurol. 2019, 175, 724–741. [Google Scholar] [CrossRef] [PubMed]
- Altun, A.; Brown, H.; Szoeke, C.; Goodwill, A.M. The Mediterranean Dietary Pattern and Depression Risk: A Systematic Review. Neurol. Psychiatry Brain Res. 2019, 33, 1–10. [Google Scholar] [CrossRef]
- Hidalgo-Mora, J.J.; García-Vigara, A.; Sánchez-Sánchez, M.L.; García-Pérez, M.-Á.; Tarín, J.; Cano, A. The Mediterranean Diet: A Historical Perspective on Food for Health. Maturitas 2020, 132, 65–69. [Google Scholar] [CrossRef]
- Picard, K.; Senior, P.A.; Adame Perez, S.; Jindal, K.; Richard, C.; Mager, D.R. Low Mediterranean Diet Scores Are Associated with Reduced Kidney Function and Health Related Quality of Life but Not Other Markers of Cardiovascular Risk in Adults with Diabetes and Chronic Kidney Disease. Nutr. Metab. Cardiovasc. Dis. 2021, 31, 1445–1453. [Google Scholar] [CrossRef]
- Delgado-Lista, J.; Alcala-Diaz, J.F.; Torres-Peña, J.D.; Quintana-Navarro, G.M.; Fuentes, F.; Garcia-Rios, A.; Ortiz-Morales, A.M.; Gonzalez-Requero, A.I.; Perez-Caballero, A.I.; Yubero-Serrano, E.M.; et al. Long-Term Secondary Prevention of Cardiovascular Disease with a Mediterranean Diet and a Low-Fat Diet (CORDIOPREV): A Randomised Controlled Trial. Lancet 2022, 399, 1876–1885. [Google Scholar] [CrossRef]
- Asbaghi, O.; Choghakhori, R.; Ashtary-Larky, D.; Abbasnezhad, A. Effects of the Mediterranean Diet on Cardiovascular Risk Factors in Non-Alcoholic Fatty Liver Disease Patients: A Systematic Review and Meta-Analysis. Clin. Nutr. ESPEN 2020, 37, 148–156. [Google Scholar] [CrossRef] [PubMed]
- Cervo, M.M.C.; Scott, D.; Seibel, M.J.; Cumming, R.G.; Naganathan, V.; Blyth, F.M.; Le Couteur, D.G.; Handelsman, D.J.; Ribeiro, R.V.; Waite, L.M.; et al. Adherence to Mediterranean Diet and Its Associations with Circulating Cytokines, Musculoskeletal Health and Incident Falls in Community-Dwelling Older Men: The Concord Health and Ageing in Men Project. Clin. Nutr. 2021, 40, 5753–5763. [Google Scholar] [CrossRef] [PubMed]
- Maggi, S.; Rogoli, D.; Ecarnot, F. Healthy Aging in the Context of the Mediterranean Diet–Health-Environment Trilemma. Aging Health Res. 2021, 1, 100015. [Google Scholar] [CrossRef]
- González-Sosa, S.; Ruiz-Hernández, J.J.; Domínguez-Rivero, S.; Águila-Fernández, E.; Godoy-Díaz, D.; Santana-Báez, S.; Puente-Fernández, A.; Conde-Martel, A. Adherence to the Mediterranean Diet in Health Personnel from the Province of Las Palmas. Rev. Clínica Española 2021, 221, 569–575. [Google Scholar] [CrossRef]
- Cano, A.; Marshall, S.; Zolfaroli, I.; Bitzer, J.; Ceausu, I.; Chedraui, P.; Durmusoglu, F.; Erkkola, R.; Goulis, D.G.; Hirschberg, A.L.; et al. The Mediterranean Diet and Menopausal Health: An EMAS Position Statement. Maturitas 2020, 139, 90–97. [Google Scholar] [CrossRef]
- Pérez-Martínez, P.; Huelgas, R.G.; Pérez-Jiménez, F. Planetary Health Diet: Do We Have to Reconsider the Recommendations Based on the Mediterranean Diet? Clínica E Investig. En Arterioscler. 2019, 31, 218–221. [Google Scholar] [CrossRef]
- Sánchez-Sánchez, M.L.; García-Vigara, A.; Hidalgo-Mora, J.J.; García-Pérez, M.-Á.; Tarín, J.; Cano, A. Mediterranean Diet and Health: A Systematic Review of Epidemiological Studies and Intervention Trials. Maturitas 2020, 136, 25–37. [Google Scholar] [CrossRef]
- Grove, J. Times Higher Education Magazine; Sodexo: London, UK, 2013. [Google Scholar]
- Liao, L.-L.; Lai, I.-J.; Chang, L.-C. Nutrition Literacy Is Associated with Healthy-Eating Behaviour among College Students in Taiwan. Health Educ. J. 2019, 78, 756–769. [Google Scholar] [CrossRef]
- Zwierczyk, U.; Kobryn, M.; Duplaga, M. Validation of the Short Food Literacy Questionnaire in the Representative Sample of Polish Internet Users. Int. J. Environ. Res. Public Health 2022, 19, 9710. [Google Scholar] [CrossRef]
- Luque, B.; Villaécija, J.; Ramallo, A.; de Matos, M.G.; Castillo-Mayén, R.; Cuadrado, E.; Tabernero, C. Spanish Validation of the Self-Perceived Food Literacy Scale: A Five-Factor Model Proposition. Nutrients 2022, 14, 2902. [Google Scholar] [CrossRef]
- Barros, L.S.; Rêgo, M.C.; Montel, D.C.; Santos, G.F.F.S.; Paiv, T.V. Entendimento e Uso Da Rotulagem Nutricional de Alimentos Por Estudantes. Avanços Em Ciência E Tecnol. De Aliment. 2021, 4, 468–479. [Google Scholar]
- Silva, B.; Lima, J.P.M.; Baltazar, A.L.; Pinto, E.; Fialho, S. Perception of Portuguese Consumers Regarding Food Labeling. Nutrients 2022, 14, 2944. [Google Scholar] [CrossRef] [PubMed]
- Andrews, J.C.; Netemeyer, R.; Burton, S.; Kees, J. What Consumers Actually Know: The Role of Objective Nutrition Knowledge in Processing Stop Sign and Traffic Light Front-of-Pack Nutrition Labels. J. Bus. Res. 2021, 128, 140–155. [Google Scholar] [CrossRef]
- Panzone, L.A.; Sniehotta, F.F.; Comber, R.; Lemke, F. The Effect of Traffic-Light Labels and Time Pressure on Estimating Kilocalories and Carbon Footprint of Food. Appetite 2020, 155, 104794. [Google Scholar] [CrossRef] [PubMed]
- Osman, M.; Thornton, K. Traffic Light Labelling of Meals to Promote Sustainable Consumption and Healthy Eating. Appetite 2019, 138, 60–71. [Google Scholar] [CrossRef]
- Sonnenberg, L.; Gelsomin, E.; Levy, D.E.; Riis, J.; Barraclough, S.; Thorndike, A.N. A Traffic Light Food Labeling Intervention Increases Consumer Awareness of Health and Healthy Choices at the Point-of-Purchase. Prev. Med. 2013, 57, 253–257. [Google Scholar] [CrossRef]
- DGS. DGS Sugere Descodificador de Rótulos. Available online: https://www.dgs.pt/em-destaque/dgs-lanca-descodificador-de-rotulos.aspx (accessed on 7 August 2022).
- PNPAS. Semáforo Nutricional Tags • Nutrimento. Available online: https://nutrimento.pt/tag/semaforo-nutricional/ (accessed on 7 August 2022).
- Semáforo Nutricional em Produtos: É uma boa Ideia? Available online: https://www.asbran.org.br/noticias/semaforo-nutricional-em-produtos-e-uma-boa-ideia (accessed on 7 August 2022).
- Hagmann, D.; Siegrist, M. Nutri-Score, Multiple Traffic Light and Incomplete Nutrition Labelling on Food Packages: Effects on Consumers’ Accuracy in Identifying Healthier Snack Options. Food Qual. Prefer. 2020, 83, 103894. [Google Scholar] [CrossRef]
- Islam, M.N.; Hassan, H.F.; Amin, M.B.; Madilo, F.K.; Rahman, M.A.; Haque, M.R.; Aktarujjaman, M.; Farjana, N.; Roy, N. Food Safety and Handling Knowledge and Practices among University Students of Bangladesh: A Cross-Sectional Study. Heliyon 2022, 8, e11987. [Google Scholar] [CrossRef]
- De Backer, C.J.S. Family Meal Traditions. Comparing Reported Childhood Food Habits to Current Food Habits among University Students. Appetite 2013, 69, 64–70. [Google Scholar] [CrossRef]
- Liu, S.; Wang, J.; He, G.; Chen, B.; Jia, Y. Evaluation of Dietary Quality Based on Intelligent Ordering System and Chinese Healthy Eating Index in College Students from a Medical School in Shanghai, China. Nutrients 2022, 14, 1012. [Google Scholar] [CrossRef]
- Ljubičić, M.; Sarić, M.M.; Klarin, I.; Rumbak, I.; Barić, I.C.; Ranilović, J.; EL-Kenawy, A.; Papageorgiou, M.; Vittadini, E.; Bizjak, M.Č.; et al. Motivation for Health Behaviour: A Predictor of Adherence to Balanced and Healthy Food across Different Coastal Mediterranean Countries. J. Funct. Foods 2022, 91, 105018. [Google Scholar] [CrossRef]
- Keczeli, V.; Máté, O.; Gubicskóné Kisbenedek, A.; Pakai, A.; Horváth, L.; Bálint, C.; Boncz, I.; Verzár, Z. EPH78 In the Crosshairs: Eating and Fluid Consumption Habits of the Students of the International Bachelor Program at the University of Pécs. Value Health 2022, 25, S206. [Google Scholar] [CrossRef]
- Al-Awwad, N.J.; Al-Sayyed, H.F.; Zeinah, Z.A.; Tayyem, R.F. Dietary and Lifestyle Habits among University Students at Different Academic Years. Clin. Nutr. ESPEN 2021, 44, 236–242. [Google Scholar] [CrossRef] [PubMed]
- Lee, Y.; Kim, T.; Jung, H. Effects of University Students’ Perceived Food Literacy on Ecological Eating Behavior towards Sustainability. Sustainability 2022, 14, 5242. [Google Scholar] [CrossRef]
- Suwalska, J.; Kolasińska, K.; Łojko, D.; Bogdański, P. Eating Behaviors, Depressive Symptoms and Lifestyle in University Students in Poland. Nutrients 2022, 14, 1106. [Google Scholar] [CrossRef]
- Ferreira, C.J.; Russo, A.; Mariano, A.; Camilo, M.E.; Ravasco, P. PP190-MON the diet of university students in Portugal: What are the food habits? Clin. Nutr. 2013, 32, S193. [Google Scholar] [CrossRef]
- Stanojević, S.P.; Pešić, M.M.; Milinčić, D.D.; Kostić, A.Ž.; Pešić, M.B. Nutritional Behavior and Motives of College Students for the Choice of Traditional Food in the Republic of Serbia. Heliyon 2022, 8, e11002. [Google Scholar] [CrossRef]
- Muñoz-Rodríguez, J.R.; Luna-Castro, J.; Ballesteros-Yáñez, I.; Pérez-Ortiz, J.M.; Gómez-Romero, F.J.; Redondo-Calvo, F.J.; Alguacil, L.F.; Castillo, C.A. Influence of Biomedical Education on Health and Eating Habits of University Students in Spain. Nutrition 2021, 86, 111181. [Google Scholar] [CrossRef]
- Alolabi, H.; Alchallah, M.O.; Mohsen, F.; Marrawi, M.; Alourfi, Z. Social and Psychosocial Factors Affecting Eating Habits among Students Studying at the Syrian Private University: A Questionnaire Based Cross-Sectional Study. Heliyon 2022, 8, e09451. [Google Scholar] [CrossRef]
- Rhea, K.C.; Cater, M.W.; McCarter, K.; Tuuri, G. Psychometric Analyses of the Eating and Food Literacy Behaviors Questionnaire with University Students. J. Nutr. Educ. Behav. 2020, 52, 1008–1017. [Google Scholar] [CrossRef]
- Isotalo, J. Basics of Statistics; University of Tampere: Tampere, Finland, 2001. [Google Scholar]
- Tanaka, K.; Akechi, T.; Okuyama, T.; Nishiwaki, Y.; Uchitomi, Y. Development and Validation of the Cancer Dyspnoea Scale: A Multidimensional, Brief, Self-Rating Scale. Br. J. Cancer 2000, 82, 800–805. [Google Scholar] [CrossRef] [PubMed]
- Guiné, R.P.F.; Florença, S.G.; Costa, D.T.V.A.; Çelik, S.; Ferreira, M.; Cardoso, A.P.; Çetin, S.; Costa, C.A. Comparative Study about the Consumption of Organic Food Products on Samples of Portuguese and Turkish Consumers under the COVID-19 Pandemic Context. Agronomy 2022, 12, 1385. [Google Scholar] [CrossRef]
- Sexton, M. Convenience Sampling and Student Workers: Ethical and Methodological Considerations for Academic Libraries. J. Acad. Librariansh. 2022, 48, 102539. [Google Scholar] [CrossRef]
- Rowland, D.L.; Oosterhouse, L.B.; Kneusel, J.A.; Hevesi, K. Comorbidities Among Sexual Problems in Men: Results from an Internet Convenience Sample. Sex. Med. 2021, 9, 100416. [Google Scholar] [CrossRef]
- Sharma, S.K.; Telles, S.; Gandharva, K.; Balkrishna, A. Yoga Instructors’ Reported Benefits and Disadvantages Associated with Functioning Online: A Convenience Sampling Survey. Complement. Ther. Clin. Pract. 2022, 46, 101509. [Google Scholar] [CrossRef]
- Peterson, R.A.; Merunka, D.R. Convenience Samples of College Students and Research Reproducibility. J. Bus. Res. 2014, 67, 1035–1041. [Google Scholar] [CrossRef]
- LeCroy, C.W.; Milligan-LeCroy, S. Public Perceptions of Child Maltreatment: A National Convenience Sample. Child. Youth Serv. Rev. 2020, 119, 105677. [Google Scholar] [CrossRef]
- Brodaty, H.; Mothakunnel, A.; de Vel-Palumbo, M.; Ames, D.; Ellis, K.A.; Reppermund, S.; Kochan, N.A.; Savage, G.; Trollor, J.N.; Crawford, J.; et al. Influence of Population versus Convenience Sampling on Sample Characteristics in Studies of Cognitive Aging. Ann. Epidemiol. 2014, 24, 63–71. [Google Scholar] [CrossRef]
- Martinho, V.J.; Bartkiene, E.; Djekic, I.; Tarcea, M.; Barić, I.C.; Černelič-Bizjak, M.; Szűcs, V.; Sarcona, A.; El-Kenawy, A.; Ferreira, V.; et al. Determinants of Economic Motivations for Food Choice: Insights for the Understanding of Consumer Behaviour. Int. J. Food Sci. Nutr. 2022, 73, 127–139. [Google Scholar] [CrossRef]
- Bădileanu, M.; Ionel, I.P.; Aurelian, J.; Cristian, D.A.; Jude, C.; Georgescu, L.-I.; Răpan, I. Perception and Deception in Nurses’ Clinical and Work-Related Professional Autonomy: Case Study for a Hospital in Romania. Sustainability 2023, 15, 355. [Google Scholar] [CrossRef]
- Keske, Ş.; Mutters, N.T.; Tsioutis, C.; Ergönül, Ö. Influenza Vaccination among Infection Control Teams: A EUCIC Survey Prior to COVID-19 Pandemic. Vaccine 2020, 38, 8357–8361. [Google Scholar] [CrossRef] [PubMed]
- Liang, C.; Lee, P.-F.; Yeh, P.-C. Relationship between Regular Leisure-Time Physical Activity and Underweight and Overweight Status in Taiwanese Young Adults: A Cross-Sectional Study. Int. J. Environ. Res. Public Health 2023, 20, 284. [Google Scholar] [CrossRef]
- Nishimoto, D.; Kodama, S.; Nishio, I.; Makizako, H. KU-OHL Project Team Association between the Perception of Behavior Change and Habitual Exercise during COVID-19: A Cross-Sectional Online Survey in Japan. Int. J. Environ. Res. Public Health 2023, 20, 356. [Google Scholar] [CrossRef]


| Statistic Indices | Reference Values |
|---|---|
| Qui-square/degrees of freedom | Value > 5—unacceptable fit Value (2; 5)—acceptable fit Value (1; 2)—good fit Value < 1—very good fit |
| CFI (Comparative Fit Index) and GFI (Goodness-of-Fit Index) | Value < 0.8—unacceptable fit Value (0.8; 0.9)—acceptable fit Value (0.9; 0.95)—good fit Value ≥ 0.95—very good fit |
| RMSEA (Root Mean Square Error of Approximation) | Value > 0.10—unacceptable fit Value (0.05; 0.10)—good fit Value ≤ 0.05—very good fit |
| RMR (Root Mean Square Residual) | Models with good fit have small values of RMR The lower the value, the better if the fit A perfect fit has RMR = 0 |
| SRMR (Standardized Root Mean Square Residual) | Values ≤ 0.08 are desirable Value < 0.10 indicates an adequate fit SRMR = 0 indicates a perfect fit |
| Sex | n | Minimum (Years) | Maximum (Years) | Mean | Standard Deviation | Coefficient of Variation |
|---|---|---|---|---|---|---|
| Female | 736 | 18 | 57 | 21.89 | 5.37 | 24.53% |
| Male | 188 | 18 | 70 | 24.14 | 8.17 | 33.84% |
| Variables | Women | Men | Total | |||
|---|---|---|---|---|---|---|
| n | % | n | % | n | % | |
| Age | ||||||
| ≤19 years | 266 | 28.8 | 47 | 5.1 | 313 | 33.9 |
| 20–21 years | 240 | 26.0 | 55 | 6.0 | 295 | 31.9 |
| ≥22 years | 230 | 24.9 | 86 | 9.3 | 316 | 34.2 |
| Type of course | ||||||
| CTESP 1 | 5 | 0.5 | 14 | 1.5 | 19 | 2.1 |
| License degree (graduation) | 574 | 62.1 | 119 | 12.9 | 693 | 75.0 |
| Master degree | 123 | 13.3 | 38 | 4.1 | 161 | 17.4 |
| Other | 34 | 3.7 | 17 | 1.8 | 51 | 5.5 |
| Global | 736 | 79.7 | 188 | 20.3 | 924 | 100.0 |
| n | Item | Mean 1 | Standard Deviation | Correlation Item-Total | Cronbach’s Alpha 2 |
|---|---|---|---|---|---|
| 1 | Find information on healthy eating (website of the General Health Directory—DGS)—official Portuguese website) | 3.92 | 1.28 | 0.472 | 0.981 |
| 2 | Find information on healthy eating (internet; television; books/magazines) | 4.36 | 0.88 | 0.523 | 0.981 |
| 3 | Understand information on healthy eating (DGS website) | 3.95 | 1.24 | 0.502 | 0.981 |
| 4 | Understand information on healthy eating (internet; television; books/magazines) | 4.28 | 08.4 | 0.657 | 0.980 |
| 5 | Find information on daily meal frequency | 4.15 | 09.6 | 0.621 | 0.980 |
| 6 | Understand the importance of eating several times a day | 4.37 | 0.83 | 0.542 | 0.981 |
| 7 | Eat the recommended meals throughout the day, such as always having breakfast | 4.18 | 09.1 | 0.433 | 0.981 |
| 8 | Find information on diets and regimes (calorie restriction; vegetarian/vegan; organic; diets suitable for certain diseases/intolerances (e.g., gluten-free)) | 3.99 | 1.02 | 0.605 | 0.980 |
| 9 | Understand the information about diets found on the internet | 4.05 | 09.7 | 0.686 | 0.980 |
| 10 | Understand the information about diets found in books/magazines | 3.95 | 1.09 | 0.652 | 0.980 |
| 11 | Practice a diet that fits the principles of healthy eating | 3.77 | 0.99 | 0.642 | 0.980 |
| 12 | Change your diet to a diet or diet suitable for certain diseases/intolerances | 3.59 | 1.10 | 0.614 | 0.980 |
| 13 | Find information on recommended portion sizes for each type of food | 3.95 | 1.03 | 0.696 | 0.980 |
| 14 | Understand recommendations on the amounts of food that should be consumed, when presented in portions | 3.98 | 0.99 | 0.758 | 0.980 |
| 15 | Understand the recommendations on the amounts of food that should be consumed, when presented in mass (grams) | 3.90 | 1.06 | 0.762 | 0.980 |
| 16 | Use the information to confirm that in your daily practice you consume the recommended amounts for your age and sex of the main food groups | 3.70 | 1.09 | 0.719 | 0.980 |
| 17 | Understand the information contained in the Portuguese Food Wheel | 4.35 | 0.88 | 0.714 | 0.980 |
| 18 | Find information on the nutritional quality of beverages | 4.02 | 1.02 | 0.715 | 0.980 |
| 19 | Understand the warnings about sugary drinks/soda consumption | 4.32 | 0.93 | 0.686 | 0.980 |
| 20 | Understand information about energy drinks (such as Red Bull) | 4.17 | 1.06 | 0.670 | 0.980 |
| 21 | Use the information to match your daily fluid intake needs | 4.10 | 0.98 | 0.738 | 0.980 |
| 22 | Find information about the Mediterranean Diet | 3.91 | 1.19 | 0.728 | 0.980 |
| 23 | Understand the assumptions of the Mediterranean Diet | 3.83 | 1.21 | 0.732 | 0.980 |
| 24 | Practice eating habits that conform to the standards of the Mediterranean Diet | 3.65 | 1.20 | 0.677 | 0.980 |
| 25 | Understand the benefits and risks associated with taking dietary supplements | 3.88 | 1.16 | 0.718 | 0.980 |
| 26 | Understand the usefulness of taking food supplements (Multivitamins, vitamins, calcium, Omega 3, etc.) | 3.94 | 1.12 | 0.713 | 0.980 |
| 27 | Find information on the use of salt in food | 4.21 | 0.98 | 0.780 | 0.980 |
| 28 | Understand the risks of excessive use of salt in food | 4.30 | 0.94 | 0.776 | 0.980 |
| 29 | Use the information to control the use of salt in your diet | 4.10 | 1.03 | 0.751 | 0.980 |
| 30 | Find information on the role of fats in food | 4.20 | 0.99 | 0.782 | 0.980 |
| 31 | Find information on the differences between saturated and unsaturated fats | 3.94 | 1.12 | 0.807 | 0.980 |
| 32 | Understand the effects resulting from the consumption of saturated and unsaturated fats | 3.97 | 1.14 | 0.781 | 0.980 |
| 33 | Moderate the use of fat in your diet | 3.92 | 1.02 | 0.753 | 0.980 |
| 34 | Avoid the use of saturated fats in your diet | 3.83 | 1.07 | 0.734 | 0.980 |
| 35 | Find information on the role of carbohydrates in food (rice; potato, pasta…) | 4.21 | 1.00 | 0.778 | 0.980 |
| 36 | Understand the type of carbohydrates you eat in your diet | 4.01 | 1.05 | 0.797 | 0.980 |
| 37 | Find information on the role of dietary fiber in health | 4.09 | 1.05 | 0.806 | 0.980 |
| 38 | Understand the benefits of consuming dietary fiber | 4.09 | 1.05 | 0.786 | 0.980 |
| 39 | Understand the benefits or drawbacks of excessive consumption of dietary fiber | 3.96 | 1.11 | 0.792 | 0.980 |
| 40 | Practice a diet that contains the recommended amounts of dietary fiber | 3.77 | 1.08 | 0.778 | 0.980 |
| 41 | Find information on the importance of adequate protein consumption in food (meat; fish; beans…) | 4.13 | 1.03 | 0.797 | 0.980 |
| 42 | Find information on animal and plant protein sources | 4.08 | 1.05 | 0.808 | 0.980 |
| 43 | Understand the recommended amounts for protein intake | 3.93 | 1.15 | 0.812 | 0.980 |
| 44 | Understand the effects of excessive protein consumption | 3.90 | 1.16 | 0.765 | 0.980 |
| 45 | Moderate your protein intake | 3.81 | 1.06 | 0.730 | 0.980 |
| 46 | Find information on how to interpret food labels | 3.93 | 1.12 | 0.795 | 0.980 |
| 47 | Understand the information conveyed on food labels | 3.90 | 1.06 | 0.757 | 0.980 |
| 48 | Find information about the nutritional semaphore on food labels | 3.55 | 1.37 | 0.666 | 0.980 |
| 49 | Understand the nutritional semaphore on food labels | 3.57 | 1.36 | 0.633 | 0.981 |
| 50 | Use food labelling to help make healthier food choices | 3.84 | 1.10 | 0.694 | 0.980 |
| Factor Number and Name | Item Number (Corresponding Input Weight) |
|---|---|
| F1 Literacy about the nutritional composition of foods | 17 (0.602), 18 (0.460), 19 (0.633), 20 (0.573), 21 (0.571), 25 (0.520), 26 (0.586), 27 (0.745), 28 (0.755), 29 (0.700), 30 (0.781), 31 (0.650), 32 (0.656), 33 (0.625), 34 (0.527), 35 (0.770), 36 (0.724), 37 (0.740), 38 (0.744), 39 (0.708), 40 (0.561), 41 (0.733), 42 (0.721), 43 (0.654), 44 (0.602), 45 (0.547) |
| F2 Literacy about food labelling | 12 (0.478), 15 (0.553), 16 (0.596), 22 (0.522), 23 (0.558), 24 (0.573), 46 (0.576), 47 (0.547), 48 (0.775), 49 (0.772), 50 (0.605) |
| F3 Literacy about healthy eating practices | 1 (0.411), 2 (0.612), 3 (0.479), 4 (0.709), 5 (0.683), 6 (0.655), 7 (0.594), 8 (0.657), 9 (0.718), 10 (0.619), 11 (0.519), 13 (0.533), 14 (0.545) |
| Items | Estimate (Lambda Coefficient) | Standard Error | Critical Ratio | p-Value |
|---|---|---|---|---|
| ba_17 ← F1 | 0.763 | 0.064 | 11.982 | *** |
| ba_18 ← F1 | 1.027 | 0.077 | 13.266 | *** |
| ba_19 ← F1 | 0.643 | 0.055 | 11.627 | *** |
| ba_20 ← F1 | 0.773 | 0.075 | 10.297 | *** |
| ba_21 ← F1 | 1.028 | 0.076 | 13.533 | *** |
| ba_25 ← F1 | 1.251 | 0.086 | 14.547 | *** |
| ba_26 ← F1 | 1.209 | 0.089 | 13.534 | *** |
| ba_27 ← F1 | 1.031 | 0.075 | 13.688 | *** |
| ba_28 ← F1 | 0.835 | 0.060 | 13.851 | *** |
| ba_29 ← F1 | 0.909 | 0.070 | 12.906 | *** |
| ba_30 ← F1 | 1.000 | *** | ||
| ba_31 ← F1 | 1.353 | 0.082 | 16.520 | *** |
| ba_32 ← F1 | 1.457 | 0.087 | 16.755 | *** |
| ba_33 ← F1 | 0.966 | 0.077 | 12.619 | *** |
| ba_34 ← F1 | 1.194 | 0.087 | 13.802 | *** |
| ba_35 ← F1 | 1.171 | 0.072 | 16.298 | *** |
| ba_36 ← F1 | 1.330 | 0.079 | 16.840 | *** |
| ba_37 ← F1 | 1.414 | 0.082 | 17.324 | *** |
| ba_38 ← F1 | 1.412 | 0.082 | 17.298 | *** |
| ba_39 ← F1 | 1.512 | 0.090 | 16.738 | *** |
| ba_40 ← F1 | 1.426 | 0.088 | 16.178 | *** |
| ba_41 ← F1 | 1.104 | 0.071 | 15.533 | *** |
| ba_42 ← F1 | 1.086 | 0.072 | 15.062 | *** |
| ba_43 ← F1 | 1.381 | 0.086 | 16.078 | *** |
| ba_44 ← F1 | 1.433 | 0.090 | 15.915 | *** |
| ba_45 ← F1 | 1.218 | 0.084 | 14.426 | *** |
| ba_12 ← F2 | 0.610 | 0.053 | 11.446 | *** |
| ba_15 ← F2 | 0.659 | 0.046 | 14.197 | *** |
| ba_16 ← F2 | 0.719 | 0.052 | 13.878 | *** |
| ba_22 ← F2 | 0.888 | 0.060 | 14.812 | *** |
| ba_23 ← F2 | 0.893 | 0.061 | 14.714 | *** |
| ba_24 ← F2 | 0.885 | 0.061 | 14.523 | *** |
| ba_46 ← F2 | 0.816 | 0.053 | 15.347 | *** |
| ba_47 ← F2 | 0.780 | 0.049 | 16.072 | *** |
| ba_48 ← F2 | 1.000 | *** | ||
| ba_49 ← F2 | 0.967 | 0.062 | 15.602 | *** |
| ba_50 ← F2 | 0.759 | 0.052 | 14.636 | *** |
| ba_01 ← F3 | 1.069 | 0.092 | 11.589 | *** |
| ba_02 ← F3 | 0.674 | 0.059 | 11.388 | *** |
| ba_03 ← F3 | 0.975 | 0.090 | 10.819 | *** |
| n | Item | Parameters 1 | |||
|---|---|---|---|---|---|
| Mean | SD | r | α | ||
| F1 | Literacy about the nutritional composition of foods | ||||
| 17 | Understand the information contained in the Portuguese Food Wheel | 104.99 | 194.47 | 0.679 | 0.961 |
| 18 | Find information on the nutritional quality of beverages | 105.26 | 190.98 | 0.722 | 0.961 |
| 21 | Use the information to match your daily fluid intake needs | 105.19 | 192.73 | 0.685 | 0.961 |
| 26 | Understand the usefulness of taking food supplements (Multivitamins, vitamins, calcium, Omega 3, etc.) | 105.23 | 191.39 | 0.722 | 0.961 |
| 31 | Find information on the differences between saturated and unsaturated fats | 105.22 | 190.25 | 0.767 | 0.961 |
| 32 | Understand the effects resulting from the consumption of saturated and unsaturated fats | 105.19 | 190.40 | 0.759 | 0.961 |
| 36 | Understand the type of carbohydrates you eat in your diet | 105.22 | 190.98 | 0.750 | 0.961 |
| 39 | Understand the benefits or drawbacks of excessive consumption of dietary fiber | 105.20 | 190.98 | 0.756 | 0.961 |
| 43 | Understand the recommended amounts for protein intake | 105.23 | 190.22 | 0.762 | 0.961 |
| 45 | Moderate your protein intake | 105.42 | 192.27 | 0.659 | 0.962 |
| F2 | Literacy about labelling and food choices | ||||
| 15 | Understand the recommendations on the amounts of food that should be consumed, when presented in mass (grams) | 105.39 | 190.58 | 0.712 | 0.961 |
| 22 | Find information about the Mediterranean Diet | 105.17 | 191.05 | 0.727 | 0.961 |
| 24 | Practice eating habits that conform to the standards of the Mediterranean Diet | 105.35 | 192.32 | 0.633 | 0.962 |
| 46 | Find information on how to interpret food labels | 105.28 | 189.61 | 0.748 | 0.961 |
| 48 | Find information about the nutritional semaphore on food labels | 105.30 | 189.36 | 0.698 | 0.961 |
| 49 | Understand the nutritional semaphore on food labels | 105.31 | 189.95 | 0.683 | 0.961 |
| 50 | Use food labelling to help make healthier food choices | 105.39 | 191.00 | 0.667 | 0.962 |
| F3 | Literacy about healthy eating practices | ||||
| 1 | Find information on healthy eating (website of the General Health Directory—DGS)—official Portuguese website) | 105.02 | 195.30 | 0.612 | 0.962 |
| 2 | Find information on healthy eating (internet; television; books/magazines) | 104.99 | 195.92 | 0.573 | 0.962 |
| 3 | Understand information on healthy eating (DGS website) | 105.04 | 195.00 | 0.635 | 0.962 |
| 5 | Find information on daily meal frequency | 105.13 | 193.44 | 0.677 | 0.961 |
| 6 | Understand the importance of eating several times a day | 105.01 | 195.73 | 0.588 | 0.962 |
| 8 | Find information on diets and regimes (calorie restriction; vegetarian/vegan; organic; diets suitable for certain diseases/intolerances (e.g., gluten-free)) | 105.29 | 192.05 | 0.651 | 0.962 |
| 9 | Understand the information about diets found on the internet | 105.29 | 191.61 | 0.715 | 0.961 |
| 13 | Find information on recommended portion sizes for each type of food | 105.35 | 190.61 | 0.710 | 0.961 |
| 14 | Understand recommendations on the amounts of food that should be consumed, when presented in portions | 105.33 | 191.04 | 0.724 | 0.961 |
| n | Item | Parameters 1 | ||||
|---|---|---|---|---|---|---|
| Mean | SD | r | r2 | α | ||
| F1 | Literacy about the nutritional composition of foods | 0.931 | ||||
| 17 | Understand the information contained in the Portuguese Food Wheel | 4.44 | 0.65 | 0.653 | 0.443 | 0.928 |
| 18 | Find information on the nutritional quality of beverages | 4.17 | 0.79 | 0.692 | 0.507 | 0.926 |
| 21 | Use the information to match your daily fluid intake needs | 4.24 | 0.73 | 0.681 | 0.483 | 0.927 |
| 26 | Understand the usefulness of taking food supplements (multivitamins, vitamins, calcium, Omega 3, etc.) | 4.20 | 0.76 | 0.700 | 0.495 | 0.926 |
| 31 | Find information on the differences between saturated and unsaturated fats | 4.21 | 0.78 | 0.795 | 0.733 | 0.921 |
| 32 | Understand the effects resulting from the consumption of saturated and unsaturated fats | 4.24 | 0.78 | 0.792 | 0.725 | 0.921 |
| 36 | Understand the type of carbohydrates you eat in your diet | 4.21 | 0.76 | 0.778 | 0.633 | 0.922 |
| 39 | Understand the benefits or drawbacks of excessive consumption of dietary fiber | 4.23 | 0.75 | 0.784 | 0.649 | 0.922 |
| 43 | Understand the recommended amounts for protein intake | 4.20 | 0.78 | 0.767 | 0.611 | 0.922 |
| 45 | Moderate your protein intake | 4.02 | 0.79 | 0.659 | 0.476 | 0.928 |
| F2 | Literacy about labelling and food choices | 0.897 | ||||
| 15 | Understand the recommendations on the amounts of food that should be consumed, when presented in mass (grams) | 4.04 | 0.81 | 0.603 | 0.392 | 0.892 |
| 22 | Find information about the Mediterranean Diet | 4.26 | 0.78 | 0.674 | 0.561 | 0.885 |
| 24 | Practice eating habits that conform to the standards of the Mediterranean Diet | 4.08 | 0.81 | 0.635 | 0.539 | 0.889 |
| 46 | Find information on how to interpret food labels | 4.15 | 0.82 | 0.721 | 0.567 | 0.879 |
| 48 | Find information about the nutritional semaphore on food labels | 4.13 | 0.89 | 0.770 | 0.764 | 0.873 |
| 49 | Understand the nutritional semaphore on food labels | 4.12 | 0.88 | 0.766 | 0.766 | 0.873 |
| 50 | Use food labelling to help make healthier food choices | 4.04 | 0.84 | 0.725 | 0.563 | 0.879 |
| F3 | Literacy about healthy eating practices | 0.908 | ||||
| 1 | Find information on healthy eating (website of the General Health Directory—DGS—official Portuguese website) | 4.42 | 0.67 | 0.680 | 0.504 | 0.898 |
| 2 | Find information on healthy eating (internet; television; books/magazines) | 4.44 | 0.68 | 0.650 | 0.504 | 0.900 |
| 3 | Understand information on healthy eating (DGS website) | 4.39 | 0.67 | 0.698 | 0.609 | 0.897 |
| 5 | Find information on daily meal frequency | 4.30 | 0.71 | 0.738 | 0.563 | 0.894 |
| 6 | Understand the importance of eating several times a day | 4.42 | 0.67 | 0.637 | 0.430 | 0.901 |
| 8 | Find information on diets and regimes (calorie restriction; vegetarian/vegan; organic; diets suitable for certain diseases/intolerances (e.g., gluten-free)) | 4.14 | 0.81 | 0.682 | 0.537 | 0.898 |
| 9 | Understand the information about diets found on the internet | 4.15 | 0.76 | 0.730 | 0.592 | 0.894 |
| 13 | Find information on recommended portion sizes for each type of food | 4.08 | 0.82 | 0.696 | 0.629 | 0.897 |
| 14 | Understand recommendations on the amounts of food that should be consumed, when presented in portions | 4.10 | 0.78 | 0.672 | 0.617 | 0.898 |
| Factor F1 | Factor F2 | Factor F3 | Factor global (F4) | |
|---|---|---|---|---|
| Factor F1 | 1 | 0.849 *** | 0.780 *** | 0.954 *** |
| Factor F2 | 1 | 0.725 *** | 0.921 *** | |
| Factor F3 | 1 | 0.900 *** | ||
| Factor Global (F4) | 1 |
Disclaimer/Publisher’s Note: The statements, opinions and data contained in all publications are solely those of the individual author(s) and contributor(s) and not of MDPI and/or the editor(s). MDPI and/or the editor(s) disclaim responsibility for any injury to people or property resulting from any ideas, methods, instructions or products referred to in the content. |
© 2022 by the authors. Licensee MDPI, Basel, Switzerland. This article is an open access article distributed under the terms and conditions of the Creative Commons Attribution (CC BY) license (https://creativecommons.org/licenses/by/4.0/).
Share and Cite
Guiné, R.P.F.; Florença, S.G.; Aparício, G.; Cardoso, A.P.; Ferreira, M. Food Literacy Scale: Validation through Exploratory and Confirmatory Factor Analysis in a Sample of Portuguese University Students. Nutrients 2023, 15, 166. https://doi.org/10.3390/nu15010166
Guiné RPF, Florença SG, Aparício G, Cardoso AP, Ferreira M. Food Literacy Scale: Validation through Exploratory and Confirmatory Factor Analysis in a Sample of Portuguese University Students. Nutrients. 2023; 15(1):166. https://doi.org/10.3390/nu15010166
Chicago/Turabian StyleGuiné, Raquel P. F., Sofia G. Florença, Graça Aparício, Ana Paula Cardoso, and Manuela Ferreira. 2023. "Food Literacy Scale: Validation through Exploratory and Confirmatory Factor Analysis in a Sample of Portuguese University Students" Nutrients 15, no. 1: 166. https://doi.org/10.3390/nu15010166
APA StyleGuiné, R. P. F., Florença, S. G., Aparício, G., Cardoso, A. P., & Ferreira, M. (2023). Food Literacy Scale: Validation through Exploratory and Confirmatory Factor Analysis in a Sample of Portuguese University Students. Nutrients, 15(1), 166. https://doi.org/10.3390/nu15010166