
Effect of Vitamin D and Docosahexaenoic Acid Co-Supplementation on Vitamin D Status, Body Composition, and Metabolic Markers in Obese Children: A Randomized, Double Blind, Controlled Study

 , ,
, , 

Abstract
:
1. Introduction
2. Methods
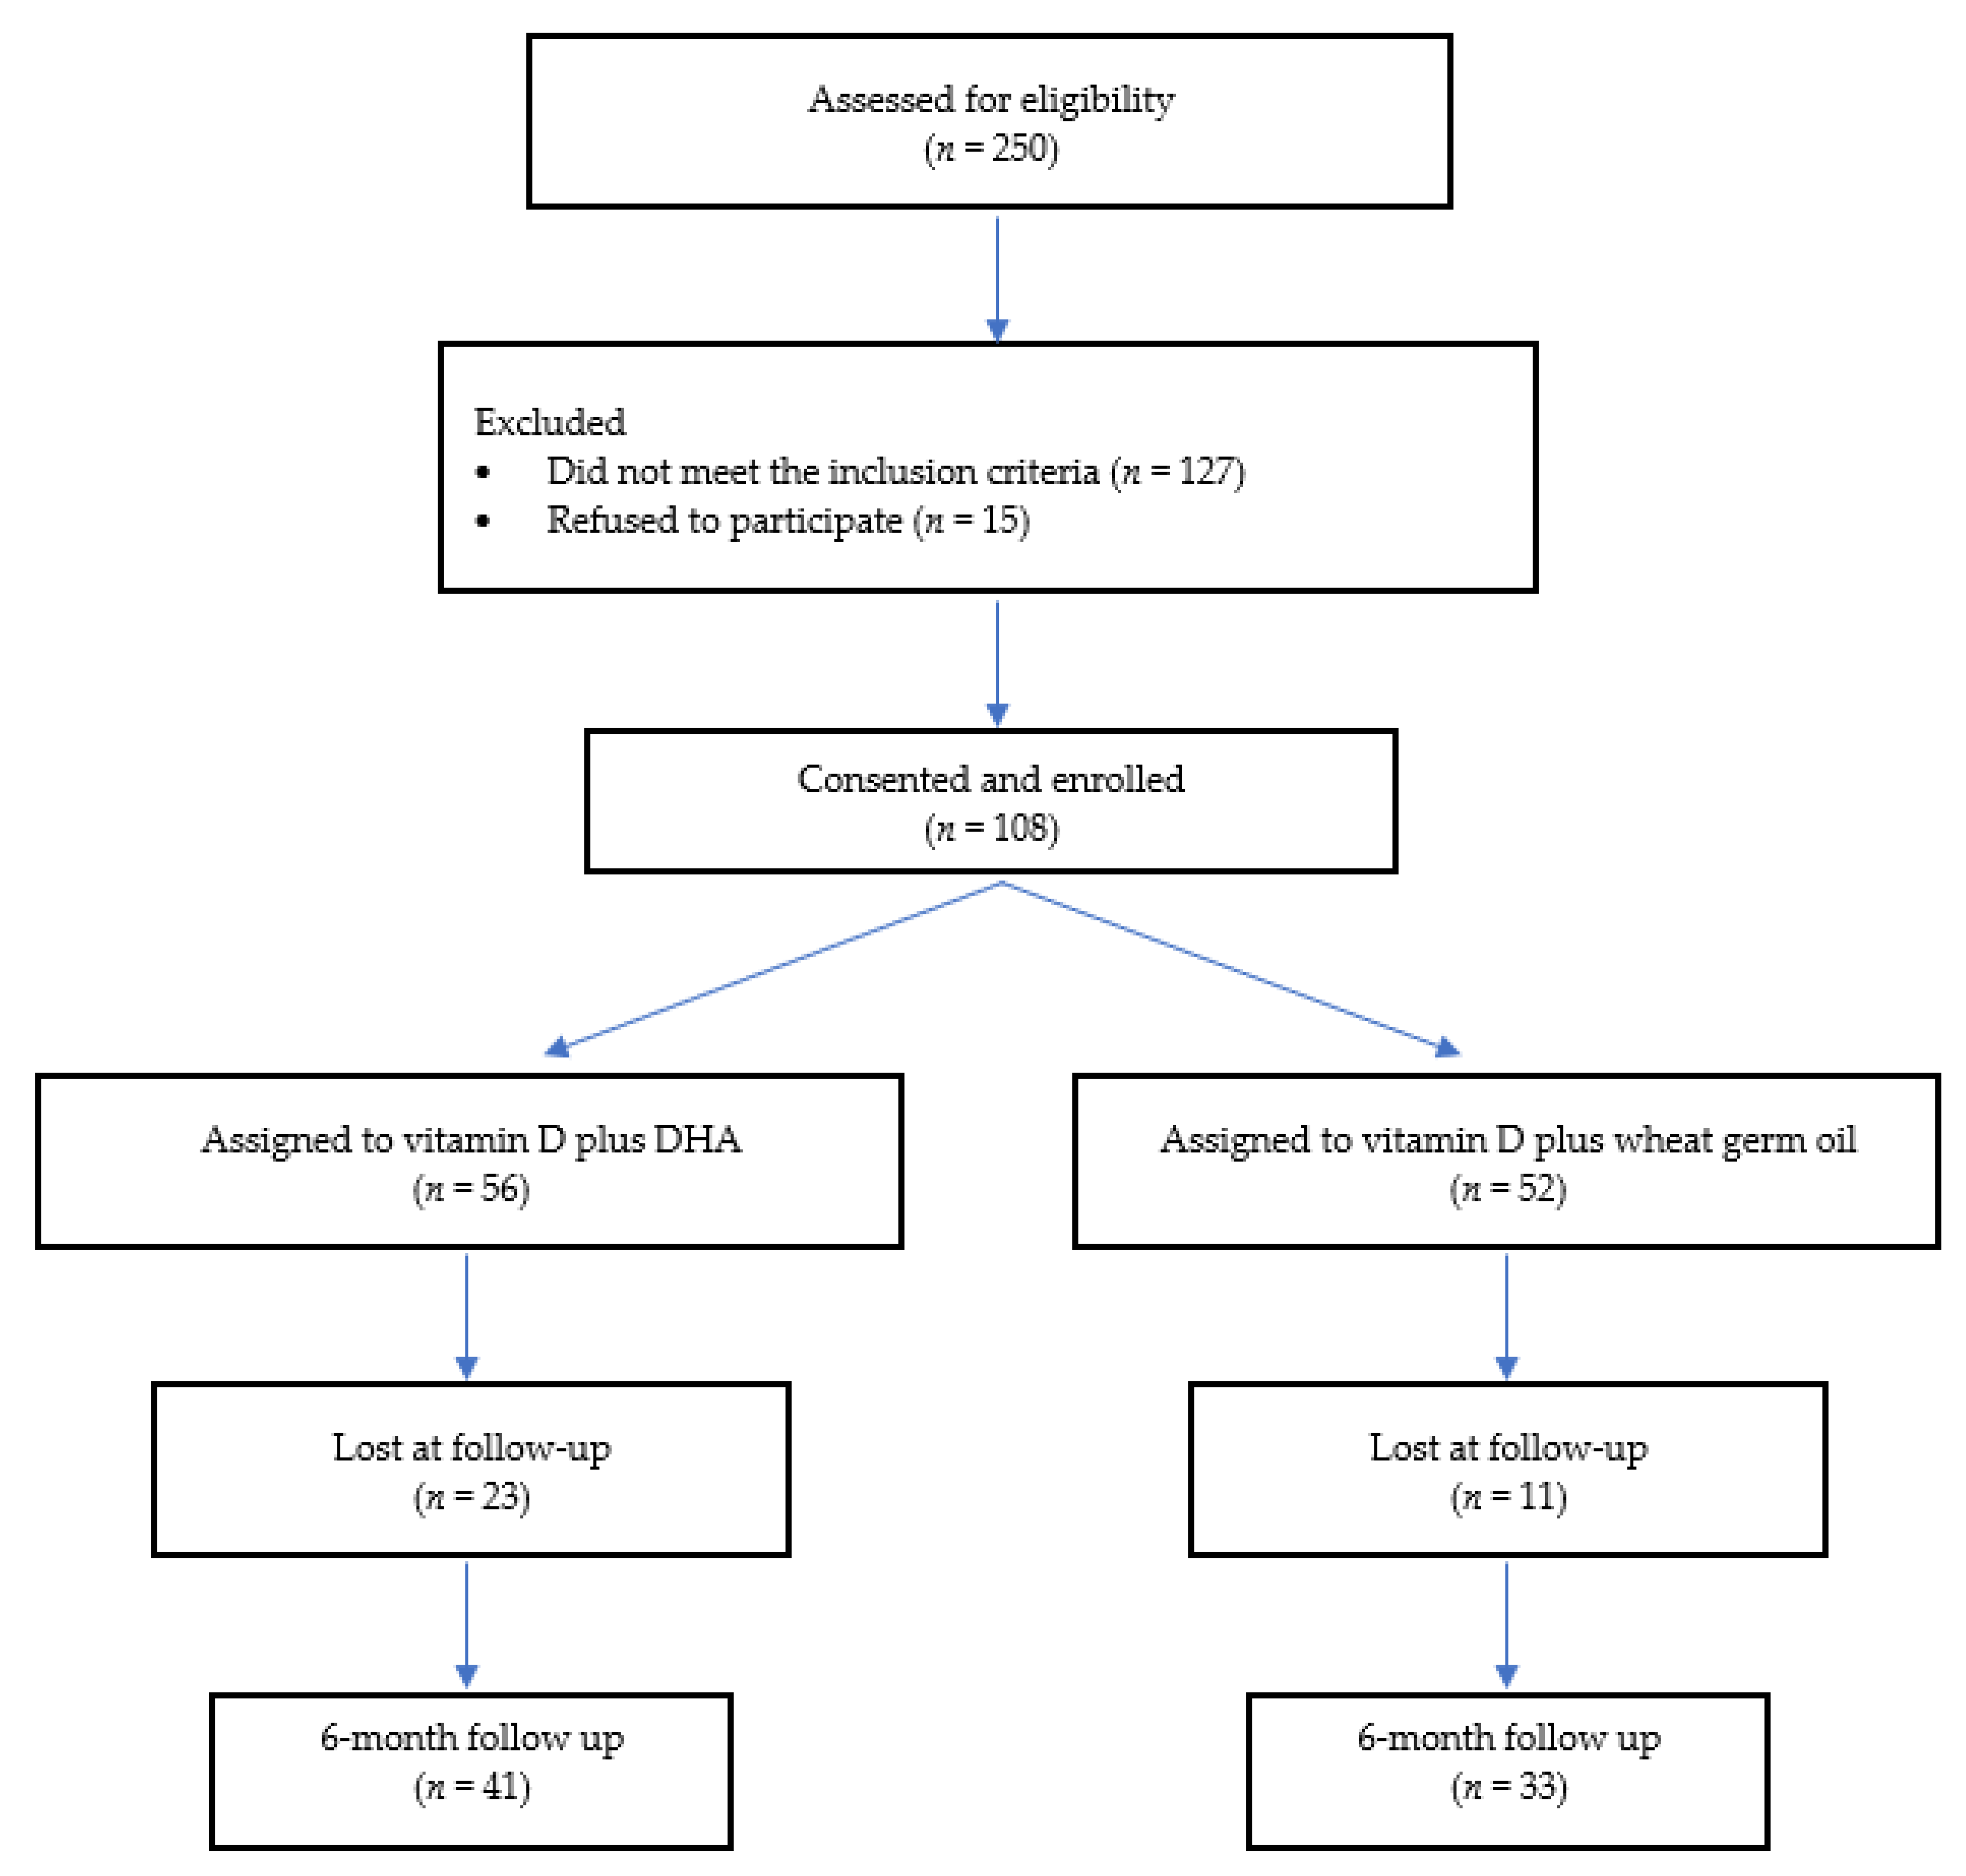
2.1. Study Design
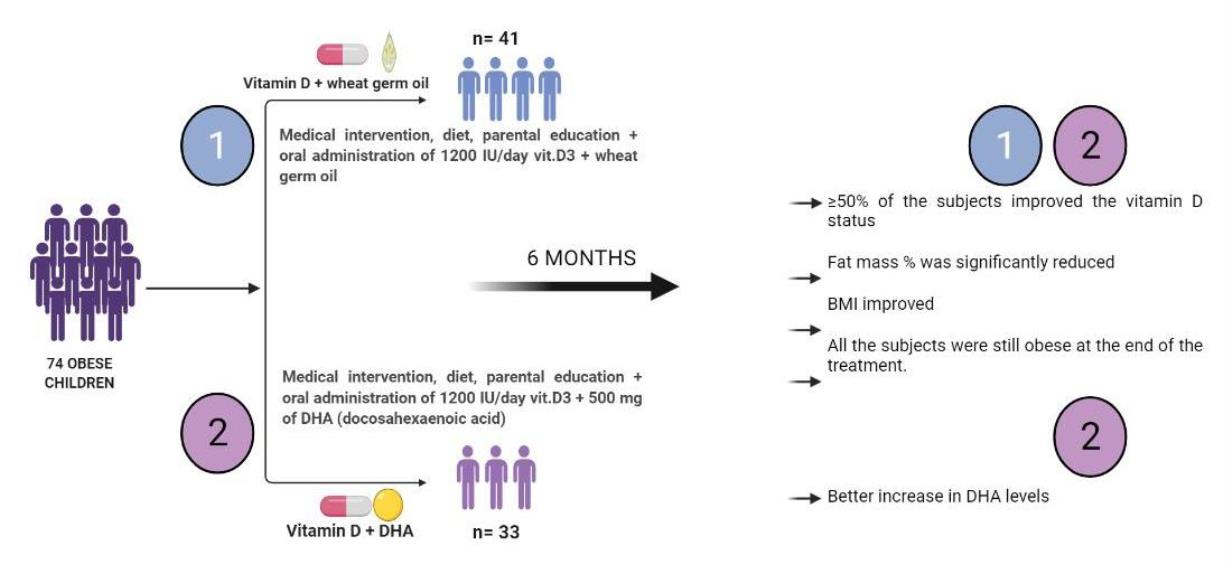
2.2. Intervention
- GROUP I (vitamin D + DHA): oral administration of vitamin D3 (1200 IU daily) + 500 mg of DHA for 6 months.
- GROUP II (vitamin D + wheat germ oil): oral administration of vitamin D3 (1200 IU daily) + wheat germ oil capsules for 6 months.
2.3. History, Anthropometric, and Laboratory Parameters
2.4. Statistical Analysis
3. Results
3.1. Baseline Characteristics
3.2. Anthropometric, Clinical, and Laboratory Parameters
3.3. Fatty Acids
3.4. TNF-α
4. Discussion
5. Conclusions
Supplementary Materials
Author Contributions
Funding
Institutional Review Board Statement
Informed Consent Statement
Data Availability Statement
Acknowledgments
Conflicts of Interest
References
- Fiamenghi, V.I.; Mello, E.D. Vitamin D deficiency in children and adolescents with obesity: A meta-analysis. J. Pediatr. 2021, 97, 273–279. [Google Scholar] [CrossRef] [PubMed]
- Rabufetti, A.; Milani, G.P.; Lava, S.A.G.; Edefonti, V.; Bianchetti, M.G.; Stettbacher, A.; Muggli, F.; Simonetti, G. Vitamin D Status Among Male Late Adolescents Living in Southern Switzerland: Role of Body Composition and Lifestyle. Nutrients 2019, 11, 2727. [Google Scholar] [CrossRef] [PubMed] [Green Version]
- Migliaccio, S.; Di Nisio, A.; Mele, C.; Scappaticcio, L.; Savastano, S.; Colao, A.; Obesity Programs of nutrition, E.R.; Assessment, G. Obesity and hypovitaminosis D: Causality or casualty? Int. J. Obes. Suppl. 2019, 9, 20–31. [Google Scholar] [CrossRef] [PubMed]
- Drincic, A.T.; Armas, L.A.; Van Diest, E.E.; Heaney, R.P. Volumetric dilution, rather than sequestration best explains the low vitamin D status of obesity. Obesity 2012, 20, 1444–1448. [Google Scholar] [CrossRef]
- Park, C.Y.; Han, S.N. The Role of Vitamin D in Adipose Tissue Biology: Adipocyte Differentiation, Energy Metabolism, and Inflammation. J. Lipid Atheroscler. 2021, 10, 130–144. [Google Scholar] [CrossRef]
- Ding, C.; Gao, D.; Wilding, J.; Trayhurn, P.; Bing, C. Vitamin D signalling in adipose tissue. Br. J. Nutr. 2012, 108, 1915–1923. [Google Scholar] [CrossRef] [Green Version]
- Landrier, J.F.; Karkeni, E.; Marcotorchino, J.; Bonnet, L.; Tourniaire, F. Vitamin D modulates adipose tissue biology: Possible consequences for obesity? Proc. Nutr. Soc. 2016, 75, 38–46. [Google Scholar] [CrossRef] [Green Version]
- Berridge, M.J. Vitamin D deficiency and diabetes. Biochem. J. 2017, 474, 1321–1332. [Google Scholar] [CrossRef]
- Corica, D.; Zusi, C.; Olivieri, F.; Marigliano, M.; Piona, C.; Fornari, E.; Morandi, A.; Corradi, M.; Miraglia Del Giudice, E.; Gatti, D.; et al. Vitamin D affects insulin sensitivity and beta-cell function in obese non-diabetic youths. Eur. J. Endocrinol. 2019, 181, 439–450. [Google Scholar] [CrossRef]
- Virdis, A.; Colucci, R.; Bernardini, N.; Blandizzi, C.; Taddei, S.; Masi, S. Microvascular Endothelial Dysfunction in Human Obesity: Role of TNF-α. J. Clin. Endocrinol. Metab. 2019, 104, 341–348. [Google Scholar] [CrossRef] [Green Version]
- Lotfi-Dizaji, L.; Mahboob, S.; Aliashrafi, S.; Vaghef-Mehrabany, E.; Ebrahimi-Mameghani, M.; Morovati, A. Effect of vitamin D supplementation along with weight loss diet on meta-inflammation and fat mass in obese subjects with vitamin D deficiency: A double-blind placebo-controlled randomized clinical trial. Clin. Endocrinol. 2019, 90, 94–101. [Google Scholar] [CrossRef] [PubMed] [Green Version]
- Cadario, F.; Pozzi, E.; Rizzollo, S.; Stracuzzi, M.; Beux, S.; Giorgis, A.; Carrera, D.; Fullin, F.; Riso, S.; Rizzo, A.M. Vitamin D and ω-3 supplementations in mediterranean diet during the 1st year of overt type 1 diabetes: A cohort study. Nutrients 2019, 11, 2158. [Google Scholar] [CrossRef] [PubMed] [Green Version]
- Talari, H.R.; Najafi, V.; Raygan, F.; Mirhosseini, N.; Ostadmohammadi, V.; Amirani, E.; Taghizadeh, M.; Hajijafari, M.; Shafabakhash, R.; Asemi, Z. Long-term Vitamin D and high-dose n-3 fatty acids’ supplementation improve markers of cardiometabolic risk in type 2 diabetic patients with CHD. Br. J. Nutr. 2019, 122, 423–430. [Google Scholar] [CrossRef] [PubMed]
- Venter, C.; Meyer, R.W.; Nwaru, B.I.; Roduit, C.; Untersmayr, E.; Adel-Patient, K.; Agache, I.; Agostoni, C.; Akdis, C.A.; Bischoff, S.C. EAACI position paper: Influence of dietary fatty acids on asthma, food allergy, and atopic dermatitis. Allergy 2019, 74, 1429–1444. [Google Scholar] [CrossRef] [Green Version]
- WHO. WHO Global Strategy on Diet, Physical Activity and Health. In Childhood Overweight and Obesity; Publications of the World Health Organization: Geneva, Switzerland, 2014. [Google Scholar]
- Matthews, D.R.; Hosker, J.; Rudenski, A.; Naylor, B.; Treacher, D.; Turner, R. Homeostasis model assessment: Insulin resistance and β-cell function from fasting plasma glucose and insulin concentrations in man. Diabetologia 1985, 28, 412–419. [Google Scholar] [CrossRef] [Green Version]
- Marangoni, F.; Colombo, C.; Martiello, A.; Negri, E.; Galli, C. The fatty acid profiles in a drop of blood from a fingertip correlate with physiological, dietary and lifestyle parameters in volunteers. Prostaglandins Leukot. Essent. Fat. Acids 2007, 76, 87–92. [Google Scholar] [CrossRef]
- Sears, B. Omega-3 fatty acids and cardiovascular disease: Dose and AA/EPA ratio determine the therapeutic outcome. CellR4 2018, 6, e2531. [Google Scholar]
- Davinelli, S.; Intrieri, M.; Corbi, G.; Scapagnini, G. Metabolic indices of polyunsaturated fatty acids: Current evidence, research controversies, and clinical utility. Crit. Rev. Food Sci. Nutr. 2021, 61, 259–274. [Google Scholar] [CrossRef]
- Durazo-Arvizu, R.A.; Tian, L.; Brooks, S.P.J.; Sarafin, K.; Cashman, K.D.; Kiely, M.; Merkel, J.; Myers, G.L.; Coates, P.M.; Sempos, C.T. The Vitamin D Standardization Program (VDSP) Manual for Retrospective Laboratory Standardization of Serum 25-Hydroxyvitamin D Data. J. AOAC Int. 2017, 100, 1234–1243. [Google Scholar] [CrossRef]
- Burdette, C.Q.; Camara, J.E.; Nalin, F.; Pritchett, J.; Sander, L.C.; Carter, G.D.; Jones, J.; Betz, J.M.; Sempos, C.T.; Wise, S.A. Establishing an Accuracy Basis for the Vitamin D External Quality Assessment Scheme (DEQAS). J. AOAC Int. 2017, 100, 1277–1287. [Google Scholar] [CrossRef]
- Milani, G.P.; Simonetti, G.D.; Edefonti, V.; Lava, S.A.G.; Agostoni, C.; Curti, M.; Stettbacher, A.; Bianchetti, M.G.; Muggli, F. Seasonal variability of the vitamin D effect on physical fitness in adolescents. Sci. Rep. 2021, 11, 182. [Google Scholar] [CrossRef] [PubMed]
- Asghari, G.; Yuzbashian, E.; Wagner, C.L.; Park, Y.; Mirmiran, P.; Hosseinpanah, F. Daily vitamin D(3) in overweight and obese children and adolescents: A randomized controlled trial. Eur. J. Nutr. 2021, 60, 2831–2840. [Google Scholar] [CrossRef] [PubMed]
- Rajakumar, K.; Moore, C.G.; Khalid, A.T.; Vallejo, A.N.; Virji, M.A.; Holick, M.F.; Greenspan, S.L.; Arslanian, S.; Reis, S.E. Effect of vitamin D3 supplementation on vascular and metabolic health of vitamin D–deficient overweight and obese children: A randomized clinical trial. Am. J. Clin. Nutr. 2020, 111, 757–768. [Google Scholar] [CrossRef] [PubMed]
- Castaneda, R.A.; Nader, N.; Weaver, A.; Singh, R.; Kumar, S. Response to vitamin D3 supplementation in obese and non-obese Caucasian adolescents. Horm. Res. Paediatr. 2012, 78, 226–231. [Google Scholar] [CrossRef] [PubMed] [Green Version]
- Natale, R.A.; Messiah, S.E.; Asfour, L.S.; Uhlhorn, S.B.; Englebert, N.E.; Arheart, K.L. Obesity Prevention Program in Childcare Centers: Two-Year Follow-Up. Am. J. Health Promot. 2017, 31, 502–510. [Google Scholar] [CrossRef] [PubMed]
- Brzeziński, M.; Jankowska, A.; Słomińska-Frączek, M.; Metelska, P.; Wiśniewski, P.; Socha, P.; Szlagatys-Sidorkiewicz, A. Long-Term Effects of Vitamin D Supplementation in Obese Children During Integrated Weight–Loss Programme—A Double Blind Randomized Placebo–Controlled Trial. Nutrients 2020, 12, 1093. [Google Scholar] [CrossRef] [PubMed] [Green Version]
- Nobili, V.; Alisi, A.; Della Corte, C.; Risé, P.; Galli, C.; Agostoni, C.; Bedogni, G. Docosahexaenoic acid for the treatment of fatty liver: Randomised controlled trial in children. Nutr. Metab. Cardiovasc. Dis. 2013, 23, 1066–1070. [Google Scholar] [CrossRef] [PubMed]
- Pacifico, L.; Bonci, E.; Di Martino, M.; Versacci, P.; Andreoli, G.; Silvestri, L.; Chiesa, C. A double-blind, placebo-controlled randomized trial to evaluate the efficacy of docosahexaenoic acid supplementation on hepatic fat and associated cardiovascular risk factors in overweight children with nonalcoholic fatty liver disease. Nutr. Metab. Cardiovasc. Dis. 2015, 25, 734–741. [Google Scholar] [CrossRef]
- López-Alarcón, M.; Inda-Icaza, P.; Márquez-Maldonado, M.; Armenta-Álvarez, A.; Barbosa-Cortés, L.; Maldonado-Hernández, J.; Piña-Aguero, M.; Barradas-Vázquez, A.; Núñez-García, B.; Rodríguez-Cruz, M. A randomized control trial of the impact of LCPUFA-ω3 supplementation on body weight and insulin resistance in pubertal children with obesity. Pediatric Obes. 2019, 14, e12499. [Google Scholar] [CrossRef]
- Zuk, A.; Fitzpatrick, T.; Rosella, L.C. Effect of vitamin D3 supplementation on inflammatory markers and glycemic measures among overweight or obese adults: A systematic review of randomized controlled trials. PLoS ONE 2016, 11, e0154215. [Google Scholar] [CrossRef] [Green Version]
- Barker, T.; Martins, T.B.; Hill, H.R.; Kjeldsberg, C.R.; Dixon, B.M.; Schneider, E.D.; Henriksen, V.T.; Weaver, L.K. Circulating pro-inflammatory cytokines are elevated and peak power output correlates with 25-hydroxyvitamin D in vitamin D insufficient adults. Eur. J. Appl. Physiol. 2013, 113, 1523–1534. [Google Scholar] [CrossRef] [PubMed]
- Peterson, C.A.; Heffernan, M.E. Serum tumor necrosis factor-alpha concentrations are negatively correlated with serum 25(OH)D concentrations in healthy women. J. Inflamm. 2008, 5, 10. [Google Scholar] [CrossRef] [PubMed] [Green Version]
- Jablonski, K.L.; Chonchol, M.; Pierce, G.L.; Walker, A.E.; Seals, D.R. 25-Hydroxyvitamin D deficiency is associated with inflammation-linked vascular endothelial dysfunction in middle-aged and older adults. Hypertension 2011, 57, 63–69. [Google Scholar] [CrossRef] [PubMed] [Green Version]
- Tarcin, O.; Yavuz, D.G.; Ozben, B.; Telli, A.; Ogunc, A.V.; Yuksel, M.; Toprak, A.; Yazici, D.; Sancak, S.; Deyneli, O.; et al. Effect of vitamin D deficiency and replacement on endothelial function in asymptomatic subjects. J. Clin. Endocrinol. Metab. 2009, 94, 4023–4030. [Google Scholar] [CrossRef] [PubMed] [Green Version]
- Zimmermann, M.B.; Aeberli, I. Dietary determinants of subclinical inflammation, dyslipidemia and components of the metabolic syndrome in overweight children: A review. Int. J. Obes. 2008, 32 (Suppl. 6), S11–S18. [Google Scholar] [CrossRef] [Green Version]
- Aeberli, I.; Molinari, L.; Spinas, G.; Lehmann, R.; l’Allemand, D.; Zimmermann, M.B. Dietary intakes of fat and antioxidant vitamins are predictors of subclinical inflammation in overweight Swiss children. Am. J. Clin. Nutr. 2006, 84, 748–755. [Google Scholar] [CrossRef] [Green Version]
- Rallidis, L.S.; Paschos, G.; Liakos, G.K.; Velissaridou, A.H.; Anastasiadis, G.; Zampelas, A. Dietary alpha-linolenic acid decreases C-reactive protein, serum amyloid A and interleukin-6 in dyslipidaemic patients. Atherosclerosis 2003, 167, 237–242. [Google Scholar] [CrossRef]
- Valle, M.; Mitchell, P.L.; Pilon, G.; St-Pierre, P.; Varin, T.; Richard, D.; Vohl, M.C.; Jacques, H.; Delvin, E.; Levy, E.; et al. Cholecalciferol Supplementation Does Not Prevent the Development of Metabolic Syndrome or Enhance the Beneficial Effects of Omega-3 Fatty Acids in Obese Mice. J. Nutr. 2021, 151, 1175–1189. [Google Scholar] [CrossRef]
- Saggese, G.; Vierucci, F.; Prodam, F.; Cardinale, F.; Cetin, I.; Chiappini, E.; De’ Angelis, G.L.; Massari, M.; Miraglia Del Giudice, E.; Miraglia Del Giudice, M.; et al. Vitamin D in pediatric age: Consensus of the Italian Pediatric Society and the Italian Society of Preventive and Social Pediatrics, jointly with the Italian Federation of Pediatricians. Ital. J. Pediatr. 2018, 44, 51. [Google Scholar] [CrossRef] [Green Version]

| Group | Baseline | 6 Months | |
|---|---|---|---|
| Sex (M/F) | 45/29 | ||
| Age, years | I | 11.9 (3.1) | 12.0 (3.1) |
| II | 11.0 (3.5) | 11.6 (3.1) | |
| Gestational Age, weeks | I | 37.0 (3.0) | |
| II | 37.0 (3.0) | ||
| Birth weight, g | I | 3250 (767.5) | |
| II | 3300.0 (730.0) | ||
| Age at obesity diagnosis, years | I | 7 (2.0) | |
| II | 6.5 (3.8) | ||
| Body height, cm | I | 150.0 (15.8) | 154.0 (15.0) *** |
| II | 145.0 (15.3) | 149.2 (15.0) *** | |
| Body weight, kg | I | 61.5 (24.0) | 64.7 (23.9) * |
| II | 56.0 (19.4) | 58.5 (20.4) ** | |
| SDS BMI | I | 2.53 (0.64) | 2.5 (0.6) |
| II | 2.63 (0.70) | 2.5 (0.7) ** | |
| AM, cm | I | 28.3 (3.9) | 28.5 (5.0) |
| II | 27.0 (3.8) | 28.0 (4.0) | |
| WC, cm | I | 84.3 (16.6) | 84.0 (17.0) |
| II | 81.5 (12.4) | 83.0 (10.0) | |
| Biceps skinfold, mm | I | 19.8 (8.0) | 19.0 (5.3) |
| II | 19.5 (6.8) | 20.0 (6.6) | |
| Triceps skinfold, mm | I | 26.0 (7.1) | 26.0 (4.6) |
| II | 24.3 (7.8) | 24.0 (4.5) | |
| Sovrailiac skinfold, mm | I | 26.0 (7.0) | 25.0 (7.5) |
| II | 24.2 (7.6) | 25.0 (8.0) | |
| Subscapular skinfold, mm | I | 23.6 (10.7) | 21.0 (12.0) |
| II | 23.3 (6.4) | 23.0 (9.0) | |
| Fat Mass, % | I | 35.0 (8.3) | 35.4 (8.4) |
| II | 35.3 (5.5) | 33.4 (7.5) | |
| Fat Mass SDS, % | I | 5.87 (2.45) | 1.42 (0.85) *** |
| II | 6.38 (3.05) | 1.36 (0.58) *** | |
| FFM, kg | I | 37.7 (11.6) | 41.4 (12.8) *** |
| II | 35.1 (13.2) | 39.1 (12.2) *** |
| OR | 95% CI | p-Value | ||
|---|---|---|---|---|
| Follow-Up | ||||
| 22:6n3 | 1.65 | 0.85 | 3.21 | 0.138 |
| Fat % | 1.11 | 1.01 | 1.21 | 0.037 |
| BMI SDS | 0.78 | 0.22 | 2.70 | 0.694 |
| Group II | 1.42 | 0.46 | 4.40 | 0.548 |
| Group | Baseline | 6 Months | |
|---|---|---|---|
| Glucose, mg/dL | I | 85.0 (12.0) | 87.0 (10.0) |
| II | 86.0 (5.0) | 85.0 (8.8) | |
| Insulin, mg/dL | I | 15.5 (17.5) | 17.8 (15.6) |
| II | 15.7 (9.7) | 15.4 (12.0) | |
| HOMA | I | 3.0 (4.0) | 3.5 (3.3) |
| II | 3.1 (2.4) | 3.2 (2.5) | |
| HbA1c (%) | I | 5.3 (0.4) | 5.2 (0.4) |
| II | 5.3 (0.3) | 5.3 (0.3) | |
| TC (mg/dL) | I | 153.5 (40.8) | 154.0 (32.0) |
| II | 158.0 (31.0) | 158.0 (36.5) | |
| HDL-c (mg/dL) | I | 51.0 (17.3) | 49.0 (17.0) |
| II | 50.0 (16.0) | 49.0 (17.8) | |
| TG (mg/dL) | I | 78.5 (60.8) | 66.0 (33.0) |
| II | 69.0 (59.0) | 73.5 (57.8) | |
| LDL-c (mg/dL) | I | 84.0 (28.0) | 83.0 (33.0) |
| II | 88.0 (35.1) | 89.0 (36.7) | |
| ALT (UI/L) | I | 21.5 (8.5) | 23.5 (10.0) |
| II | 19.0 (15.5) | 26.0 (17.0) | |
| AST (UI/L) | I | 23.0 (7.5) | 26.0 (6.8) |
| II | 25.0 (7.5) | 28.0 (10.0) | |
| GGT (UI/L) | I | 13.0 (8.0) | 15.5 (10.8) |
| II | 13.0 (8.5) | 14.5 (7.5) | |
| ApoA (mg/dL) | I | 138.5 (25.0) | 132.0 (29.0) * |
| II | 137.0 (25.5) | 130.0 (26.3) | |
| ApoB (mg/dL) | I | 81.0 (24.5) | 79.0 (30.0) |
| II | 77.0 (26.5) | 81.5 (24.5) | |
| B/A | I | 0.59 (0.19) | 0.58 (0.19) * |
| II | 0.55 (0.15) | 0.57 (0.23) * | |
| PTH (pg/mL) | I | 28.1 (27.0) | 33.6 (24.8) |
| II | 36.5 (25.5) | 31.8 (24.9) | |
| Calcium (mg/dL) | I | 9.76 (0.40) | 9.71 (0.37) |
| II | 9.74 (0.50) | 9.73 (0.54) | |
| 25OHD (ng/mL) | I | 14.0 (7.2) | 21.99 (11.8) |
| II | 15.3 (8.4) | 23.4 (8.8) *** |
| % of Total Fatty Acids | Baseline | 6 Months | ||
|---|---|---|---|---|
| GROUP I | GROUP II | GROUP I | GROUP II | |
| 16:00 | 23.65 (1.89) | 23.61 (1.98) | 23.53 (1.75) | 23.23 (1.64) * |
| 18:00 | 11.90 (2.10) | 11.74 (1.75) | 11.58 (2.30) | 11.43 (2.19) |
| 16:1n7 | 1.42 (0.67) | 1.41 (0.69) | 1.18 (0.59) * | 1.22 (0.81) |
| 18:1n9 | 18.36 (3.43) | 18.60 (3.14) | 18.30 (2.56) | 17.96 (2.93) |
| 18:1n7 | 1.30 (0.26) | 1.30 (0.27) | 1.31 (0.38) | 1.31 (0.22) |
| 18:2n6 | 21.07 (3.24) | 21.31 (2.88) | 21.34 (3.36) | 20.86 (3.80) |
| 20:3n6 | 1.60 (0.40) | 1.59 (0.29) | 1.56 (0.31) | 1.57 (0.45) |
| 20:4n6 | 9.41 (3.05) | 9.61 (2.24) | 9.38 (1.99) | 9.89 (1.77) |
| 22:4n6 | 1.20 (0.56) | 1.19 (0.56) | 1.02 (0.45) | 1.23 (0.49) |
| 18:3n3 | 0.19 (0.08) | 0.19 (0.08) | 0.17 (0.08) | 0.20 (0.09) |
| 20:5n3 | 0.30 (0.27) | 0.23 (0.19) | 0.26 (0.17) | 0.29 (0.20) |
| 22:5n3 | 0.54 (0.24) | 0.58 (0.31) | 0.47 (0.26) | 0.57 (0.20) |
| 22:6n3 | 1.64 (0.81) | 1.65 (0.71) | 2.59 (1.15) *** | 2.06 (1.35) *** ° |
| Total SFA | 39.68 (1.96) | 38.56 (3.92) | 38.73 (4.53) | 38.21 (3.34) |
| Total MUFA | 23.35 (3.20) | 23.21 (3.45) | 22.97 (2.47) * | 22.78 (3.44) |
| Total PUFA | 36.90 (4.16) | 37.61 (6.38) | 37.49 (6.19) | 37.80 |
| Total n6-PUFA | 34.14 (3.80) | 35.10 (5.69) | 34.19 (5.18) | 34.81 (5.27) |
| Total n3-PUFA | 2.84 (1.02) | 2.67 (0.88) | 3.71 (0.99) *** | 3.14 (1.68) *** ° |
| LCPUFA | 14.97 (4.59) | 15.57 (2.40) | 15.91 (2.34)* | 15.73 (3.19) |
| PUFA balance | 5.50 (2.27) | 5.25 (2.00) | 7.87 (2.71) *** | 5.87 (4.01) *** ° |
| AA/EPA | 29.91 (27.15) | 35.56 (22.59) | 4.16 (25.94) *** | 7.78 (23.89) *** |
| AA/DHA | 5.43 (2.73) | 5.76 (2.09) | 3.40 (1.72) *** | 4.75 (4.75) *** ° |
| n6/n3 | 21.85 (30.05) | 21.05 (33.44) | 9.35 (3.00) *** | 11.00 (4.95) *** |
| n6-derivates/LA | 1.59 (0.22) | 1.62 (0.13) | 1.60 (0.16) | 1.65 (0.15) |
| n3-derivates/ALA | 15.05 (6.49) | 14.70 (6.56) | 22.37 (12.03) *** | 17.51 (9.33) ° |
| DGLA/LA (FADS2) | 0.07 (0.03) | 0.07 (0.03) | 0.07 (0.02) | 0.08 (0.03) |
| ARA/DGLA (FADS1) | 5.64 (1.54) | 5.89 (1.79) | 5.89 (1.42) | 6.11 (2.18) |
| ARA/LA | 0.42 (0.16) | 0.45 (0.09) | 0.44 (0.13) | 0.48 (0.13) |
| EPA/ALA | 1.53 (1.38) | 1.39 (1.12) | 1.65 (1.14) *** | 1.44 (1.00) |
| DHA/EPA | 5.55 (4.48) | 5.63 (4.50) | 10.22 (8.17) *** | 7.69 (4.16) *** ° |
| DHA/ALA | 9.11 (4.23) | 9.33 (4.44) | 17.27 (10.69) *** | 12.03 (6.68) *** ° |
| SCD(16) | 0.06 (0.03) | 0.06 (0.03) | 0.05 (0.02) * | 0.05 (0.03) |
| SCD(18) | 1.55 (0.42) | 1.63 (0.39) | 1.55 (0.42) | 1.55 (0.37) |
| EPA+DHA | 2.01 (0.97) | 1.88 (0.83) | 2.84 (1.17) *** | 2.28 (1.41) *** ° |
Publisher’s Note: MDPI stays neutral with regard to jurisdictional claims in published maps and institutional affiliations. |
© 2022 by the authors. Licensee MDPI, Basel, Switzerland. This article is an open access article distributed under the terms and conditions of the Creative Commons Attribution (CC BY) license (https://creativecommons.org/licenses/by/4.0/).
Share and Cite
De Cosmi, V.; Mazzocchi, A.; D’Oria, V.; Re, A.; Spolidoro, G.C.I.; Milani, G.P.; Berti, C.; Scaglioni, S.; Giavoli, C.; Bergamaschi, S.; et al. Effect of Vitamin D and Docosahexaenoic Acid Co-Supplementation on Vitamin D Status, Body Composition, and Metabolic Markers in Obese Children: A Randomized, Double Blind, Controlled Study. Nutrients 2022, 14, 1397. https://doi.org/10.3390/nu14071397
De Cosmi V, Mazzocchi A, D’Oria V, Re A, Spolidoro GCI, Milani GP, Berti C, Scaglioni S, Giavoli C, Bergamaschi S, et al. Effect of Vitamin D and Docosahexaenoic Acid Co-Supplementation on Vitamin D Status, Body Composition, and Metabolic Markers in Obese Children: A Randomized, Double Blind, Controlled Study. Nutrients. 2022; 14(7):1397. https://doi.org/10.3390/nu14071397
Chicago/Turabian StyleDe Cosmi, Valentina, Alessandra Mazzocchi, Veronica D’Oria, Alessandro Re, Giulia Carla Immacolata Spolidoro, Gregorio P. Milani, Cristiana Berti, Silvia Scaglioni, Claudia Giavoli, Silvia Bergamaschi, and et al. 2022. "Effect of Vitamin D and Docosahexaenoic Acid Co-Supplementation on Vitamin D Status, Body Composition, and Metabolic Markers in Obese Children: A Randomized, Double Blind, Controlled Study" Nutrients 14, no. 7: 1397. https://doi.org/10.3390/nu14071397
APA StyleDe Cosmi, V., Mazzocchi, A., D’Oria, V., Re, A., Spolidoro, G. C. I., Milani, G. P., Berti, C., Scaglioni, S., Giavoli, C., Bergamaschi, S., Rodari, G., Profka, E., Colombo, R., & Agostoni, C. (2022). Effect of Vitamin D and Docosahexaenoic Acid Co-Supplementation on Vitamin D Status, Body Composition, and Metabolic Markers in Obese Children: A Randomized, Double Blind, Controlled Study. Nutrients, 14(7), 1397. https://doi.org/10.3390/nu14071397