
Comparison of Plate Waste between Vegetarian and Meat-Containing Meals in a Hospital Setting: Environmental and Nutritional Considerations


Highlights
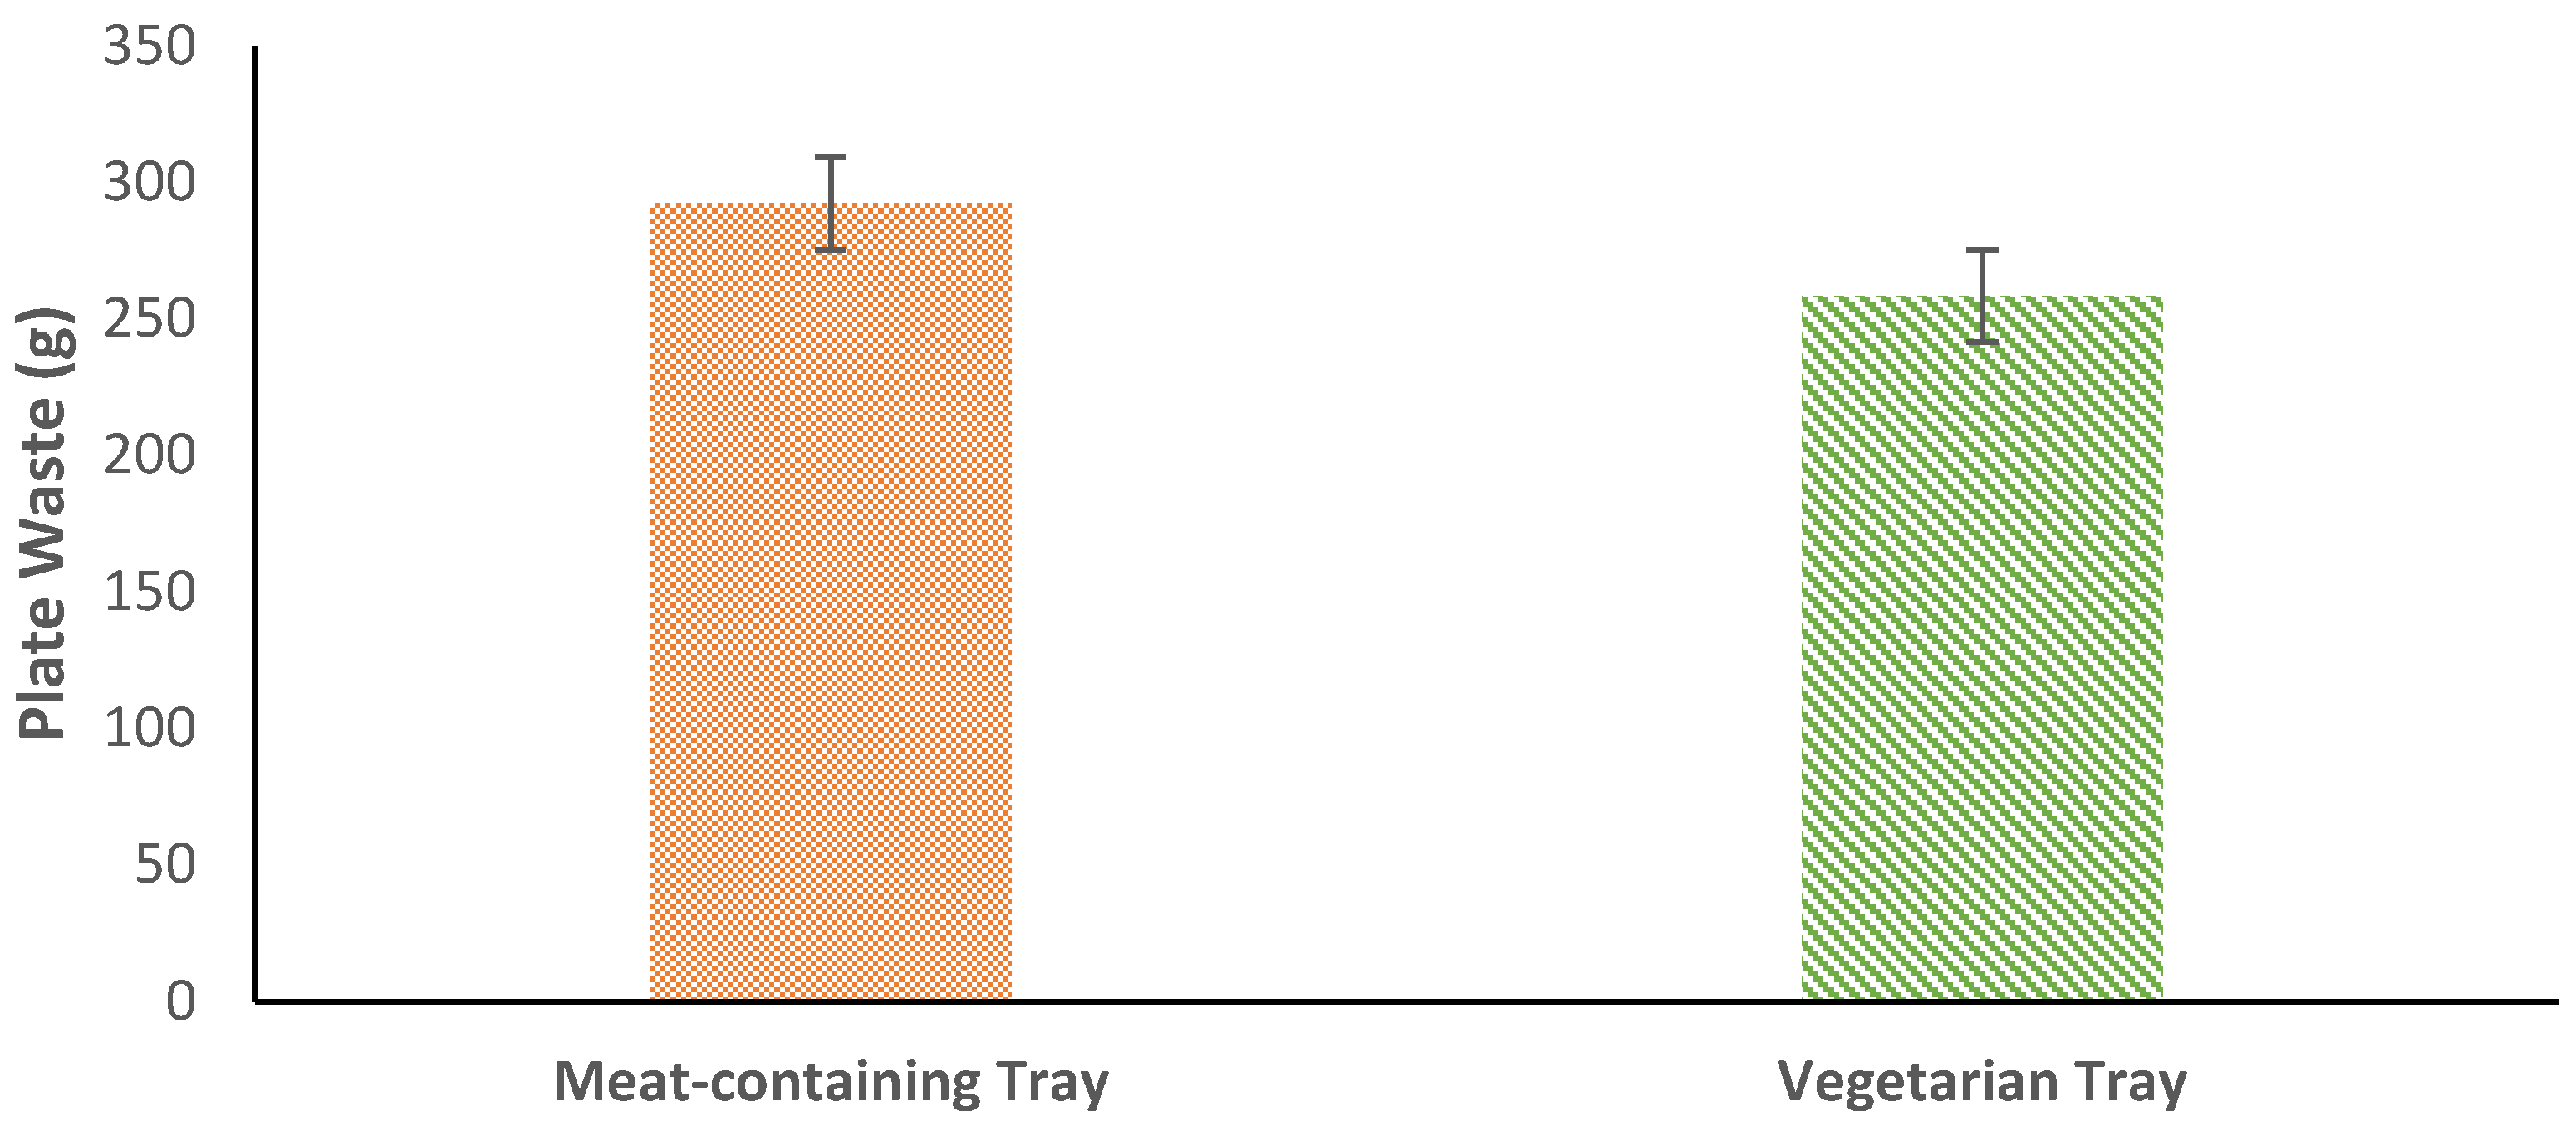
- The mean total food waste and associated greenhouse gas emissions were higher from meat-containing meals than vegetarian meals.
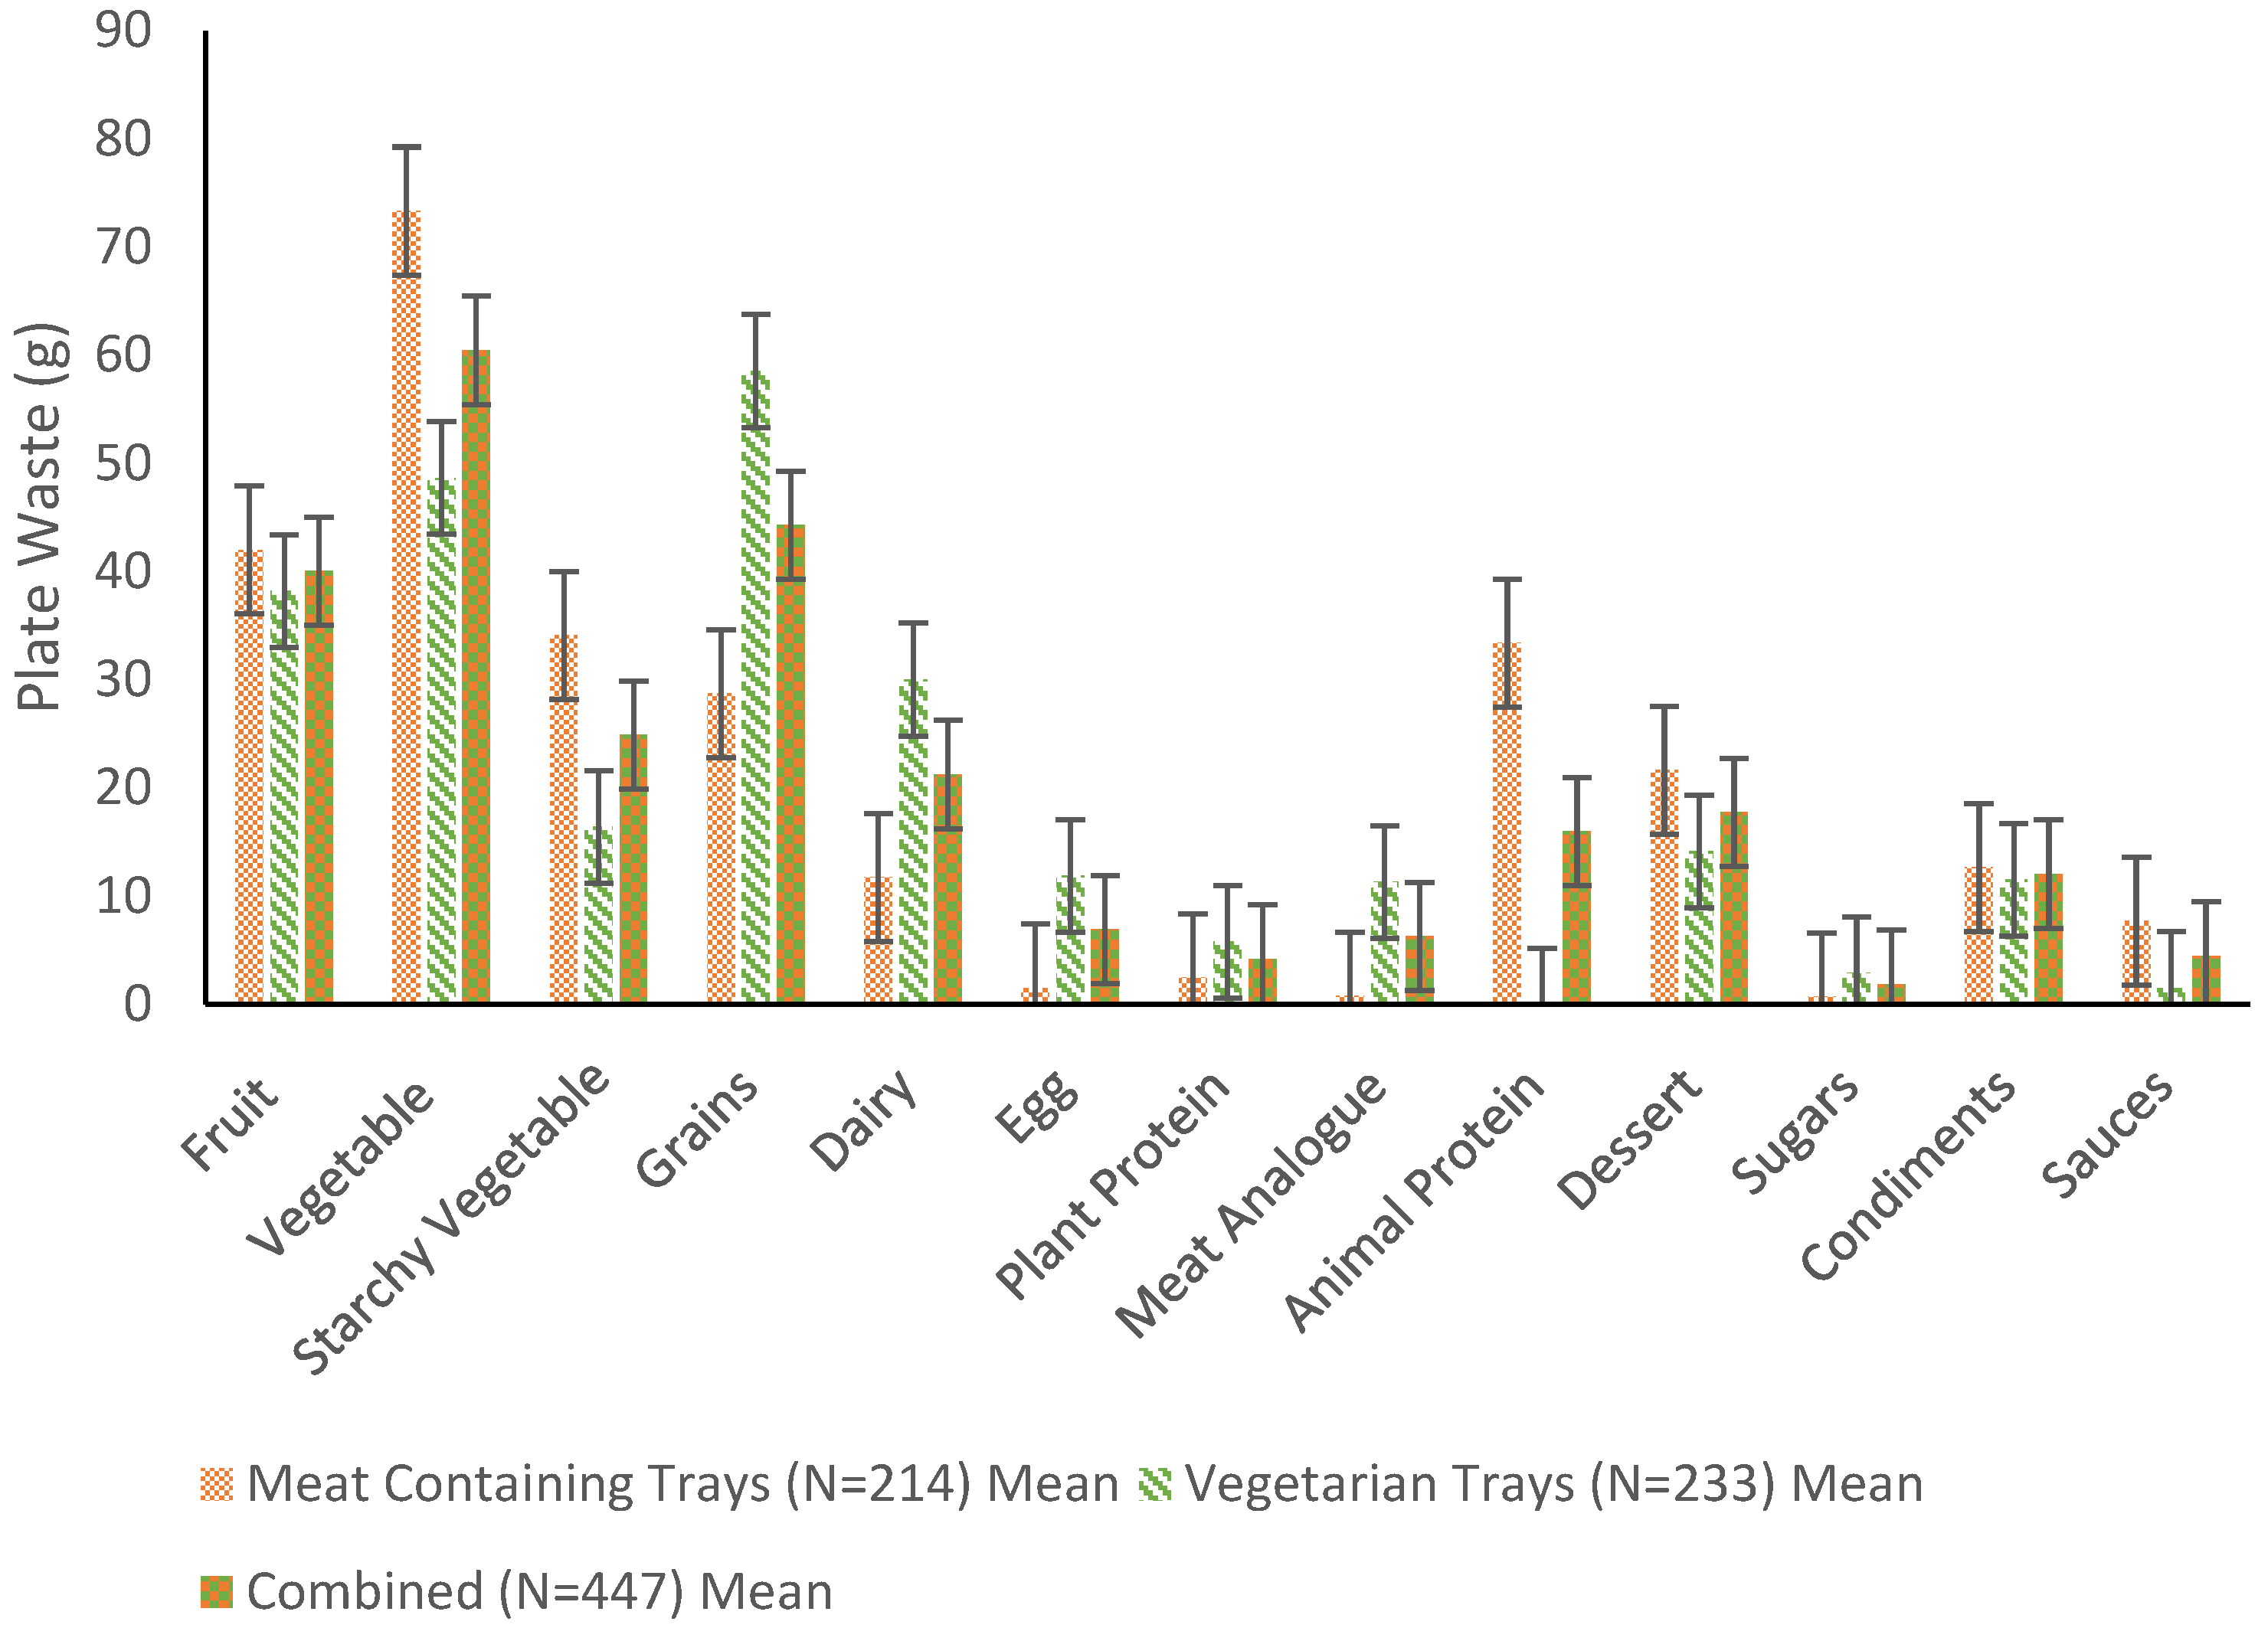
- Vegetable and dessert food waste was greater among meat-containing meals, while grains, dairy, egg, and plant protein food waste was greater among vegetarian meals.
- Serving vegetarian meals by default improves performance both in terms of reducing food waste and reducing greenhouse gas emissions.
- There was no evidence to support the idea that providing vegetarian meals by default would increase food waste and the associated greenhouse gas emissions.
Abstract
1. Introduction
2. Materials and Methods
3. Results
3.1. Food Waste
3.1.1. Descriptive Statistics
3.1.2. Exploratory Analyses
3.2. Global Warming Potential
4. Discussion
5. Conclusions
Author Contributions
Funding
Institutional Review Board Statement
Informed Consent Statement
Data Availability Statement
Acknowledgments
Conflicts of Interest
Appendix A

| Food Category | Meat-Containing Meals | Vegetarian Meals | Total | ||||||
|---|---|---|---|---|---|---|---|---|---|
| (N = 214) | (N = 233) | (N = 447) | |||||||
| Fruit | 42.00 | ± | 50.78 | 38.21 | ± | 49.69 | 40.03 | ± | 50.19 |
| Vegetable | 73.33 | ± | 77.09 | 48.64 | ± | 80.20 | 60.46 | ± | 79.60 |
| Starchy Vegetable | 34.12 | ± | 46.64 | 16.42 | ± | 37.06 | 24.90 | ± | 42.80 |
| Grains | 28.74 | ± | 36.74 | 58.54 | ± | 63.97 | 44.27 | ± | 54.73 |
| Dairy | 11.72 | ± | 32.52 | 30.02 | ± | 53.68 | 21.26 | ± | 45.69 |
| Egg | 1.51 | ± | 8.23 | 11.86 | ± | 22.24 | 6.90 | ± | 17.79 |
| Plant Protein | 2.45 | ± | 11.75 | 5.80 | ± | 22.09 | 4.20 | ± | 17.96 |
| Meat Analogue | 0.79 | ± | 9.46 | 11.32 | ± | 27.24 | 6.28 | ± | 21.36 |
| Animal Protein | 33.39 | ± | 36.41 | 0.00 | ± | 0.00 | 15.98 | ± | 30.20 |
| Dessert | 21.64 | ± | 38.00 | 14.16 | ± | 32.79 | 17.74 | ± | 35.54 |
| Sugars | 0.72 | ± | 4.59 | 2.91 | ± | 9.04 | 1.86 | ± | 7.33 |
| Condiments | 12.67 | ± | 15.22 | 11.50 | ± | 10.27 | 12.06 | ± | 12.88 |
| Sauces | 7.72 | ± | 14.77 | 1.50 | ± | 4.53 | 4.48 | ± | 11.16 |
| Total Plate Waste | 292.51 | ± | 180.77 | 258.46 | ± | 186.09 | 274.76 | ± | 181.15 |
| GHGE by Food Category | Meat-Containing Meals | Vegetarian Meals | Total | ||||||
|---|---|---|---|---|---|---|---|---|---|
| (N = 214) | (N = 233) | (N = 447) | |||||||
| Fruit | 20.87 | ± | 32.00 | 18.36 | ± | 49.69 | 19.56 | ± | 29.32 |
| Vegetable | 26.95 | ± | 32.05 | 18.05 | ± | 28.79 | 22.31 | ± | 30.74 |
| Starchy Vegetable | 9.47 | ± | 13.40 | 4.66 | ± | 10.94 | 6.96 | ± | 12.43 |
| Grains | 30.04 | ± | 45.03 | 52.24 | ± | 59.81 | 41.61 | ± | 54.44 |
| Dairy | 47.87 | ± | 122.28 | 105.37 | ± | 185.29 | 77.84 | ± | 161.04 |
| Egg | 5.12 | ± | 27.79 | 40.20 | ± | 75.08 | 23.40 | ± | 60.18 |
| Plant Protein | 2.95 | ± | 12.95 | 7.50 | ± | 24.42 | 5.32 | ± | 19.93 |
| Meat Analogue | 1.315 | ± | 15.84 | 20.92 | ± | 51.04 | 11.54 | ± | 39.71 |
| Animal Protein | 285.01 | ± | 398.24 | 0.00 | ± | 0.00 | 136.45 | ± | 310.83 |
| Dessert | 150.53 | ± | 380.48 | 69.09 | ± | 254.16 | 108.08 | ± | 323.83 |
| Sugars | 0.55 | ± | 3.47 | 2.22 | ± | 7.10 | 1.42 | ± | 5.72 |
| Condiments | 22.21 | ± | 40.88 | 16.68 | ± | 31.06 | 19.33 | ± | 1.35 |
| Sauces | 1.31 | ± | 2.45 | 1.50 | ± | 4.53 | 1.37 | ± | 4.21 |
| Total | 604.21 | ± | 643.45 | 356.66 | ± | 374.98 | 475.17 | ± | 536.09 |
References
- Rockström, J.; Steffen, W.; Noone, K. A safe operating space for humanity. Nature 2009, 461, 472–475. [Google Scholar] [CrossRef] [PubMed]
- Atwoli, L.; Baqui, A.H.; Benfield, T.; Bosurgi, R.; Godlee, F.; Hancocks, S.; Horton, R.; Laybourn-Langton, L.; Monteiro, C.A.; Norman, I.; et al. Call for emergency action to limit global temperature increases, restore biodiversity and protect health. Allergy 2022, 77, 730–733. [Google Scholar] [CrossRef] [PubMed]
- Vermeulen, S.J.; Campbell, B.M.; Ingram, J.S.I. Climate Change and Food Systems. Annu. Rev. Environ. Resour. 2012, 37, 195–222. [Google Scholar] [CrossRef]
- Rosenzweig, C.; Mbow, C.; Barioni, L.G.; Benton, T.G.; Herrero, M.; Krishnapillai, M.; Liwenga, E.T.; Pradhan, P.; Rivera-Ferre, M.G.; Sapkota, T.; et al. Climate change responses benefit from a global food system approach. Nat. Food 2020, 1, 94–97. [Google Scholar] [CrossRef]
- Crippa, M.; Solazzo, E.; Guizzardi, D.; Monforti-Ferrario, F.; Tubiello, F.N.; Leip, A. Food systems are responsible for a third of global anthropogenic GHG emissions. Nat. Food 2021, 2, 198–209. [Google Scholar] [CrossRef]
- FAO; IFAD; UNICEF; WFP; WHO. The State of Food Security and Nutrition in the World 2017: Building Resilience for Peace and Food Security; FAO: Rome, Italy, 2017. [Google Scholar]
- Hasegawa, T.; Havlík, P.; Frank, S.; Palazzo, A.; Valin, H. Tackling food consumption inequality to fight hunger without pressuring the environment. Nat. Sustain. 2019, 2, 826–833. [Google Scholar] [CrossRef]
- Godfray, H.C.J.; Beddington, J.R.; Crute, I.R.; Haddad, L.; Lawrence, D.; Muir, J.F.; Pretty, J.; Robinson, S.; Thomas, S.M.; Toulmin, C. Food security: The challenge of feeding 9 billion people. Science 2010, 327, 812–818. [Google Scholar] [CrossRef] [PubMed]
- Heller, M.; Keoleian, G.; Rose, D. Implications of Future Us Diet Scenarios on Greenhouse Gas Emissions. 2020, p. 34. Available online: https://habitsofwaste.org/wp-content/uploads/2020/11/2020-CSS20-01-v3.pdf (accessed on 22 February 2022).
- Stylianou, K.S.; Fulgoni, V.L.; Jolliet, O. Small targeted dietary changes can yield substantial gains for human and environmental health. Nat. Food 2021, 2, 616–627. [Google Scholar] [CrossRef]
- Kustar, A.; Patino-echeverri, D. A Review of Environmental Life Cycle Assessments of Diets: Plant-Based Solutions Are Truly Sustainable, even in the Form of Fast Foods. Sustainability 2021, 13, 9926. [Google Scholar] [CrossRef]
- Fresán, U.; Sabaté, J. Vegetarian Diets: Planetary Health and Its Alignment with Human Health. Adv. Nutr. 2019, 10, S380–S388. [Google Scholar] [CrossRef] [PubMed]
- Melina, V.; Craig, W.; Levin, S. Position of the Academy of Nutrition and Dietetics: Vegetarian Diets. J. Acad. Nutr. Diet. 2016, 116, 1970–1980. [Google Scholar] [CrossRef] [PubMed]
- Barnard, N.D.; Kahleova, H.; Levin, S.M. The Use of Plant-Based Diets for Obesity Treatment. Int. J. Dis. Reversal Prev. 2019, 1, 12. [Google Scholar] [CrossRef]
- Sofi, F.; Dinu, M.; Pagliai, G.; Cesari, F.; Gori, A.M.; Sereni, A.; Becatti, M.; Fiorillo, C.; Marcucci, R.; Casini, A. Low-calorie vegetarian versus mediterranean diets for reducing body weight and improving cardiovascular risk profile. Circulation 2018, 137, 1103–1113. [Google Scholar] [CrossRef] [PubMed]
- Lee, K.W.; Loh, H.C.; Ching, S.M.; Devaraj, N.K.; Hoo, F.K. Effects of vegetarian diets on blood pressure lowering: A systematic review with meta-analysis and trial sequential analysis. Nutrients 2020, 12, 1604. [Google Scholar] [CrossRef] [PubMed]
- Lee, Y.; Park, K. Adherence to a vegetarian diet and diabetes risk: A systematic review and meta-analysis of observational studies. Nutrients 2017, 9, 603. [Google Scholar] [CrossRef] [PubMed]
- Rizzo, N.S.; Sabaté, J.; Jaceldo-Siegl, K.; Fraser, G.E. Vegetarian dietary patterns are associated with a lower risk of metabolic syndrome: The Adventist Health Study 2. Diabetes Care 2011, 34, 1225–1227. [Google Scholar] [CrossRef] [PubMed]
- Clarys, P.; Deliens, T.; Huybrechts, I.; Deriemaeker, P.; Vanaelst, B.; De Keyzer, W.; Hebbelinck, M.; Mullie, P. Comparison of nutritional quality of the vegan, vegetarian, semi-vegetarian, pesco-vegetarian and omnivorous diet. Nutrients 2014, 6, 1318–1332. [Google Scholar] [CrossRef] [PubMed]
- Lynch, H.; Johnston, C.; Wharton, C. Plant-based diets: Considerations for environmental impact, protein quality, and exercise performance. Nutrients 2018, 10, 1841. [Google Scholar] [CrossRef] [PubMed]
- Leischik, R.; Spelsberg, N. Vegan Triple-Ironman (Raw Vegetables/Fruits). Case Reports Cardiol. 2014, 2014, 317246. [Google Scholar] [CrossRef][Green Version]
- Wirnitzer, K.C.; Kornexl, E. Energy and Macronutrient Intake of a Female Vegan Cyclist During an 8-Day Mountain Bike Stage Race. Baylor Univ. Med. Cent. Proc. 2014, 27, 42–45. [Google Scholar] [CrossRef]
- Trumbo, P.; Yates, A.; Schlicker, S.; Poos, M. Dietary Reference Intakes: Vitamin A, Vitamin K, Arsenic, Boron, Chromium, Copper, Iodine, Iron, Manganese, Molybdenum, Nickel, Silicon, Vanadium, and Zinc. J. Am. Diet. Assoc. 2001, 101, 294–301. [Google Scholar] [CrossRef]
- Holick, M. Vitamin D Deficiency. N. Engl. J. Med. 2007, 357, 266–281. [Google Scholar] [CrossRef] [PubMed]
- Conrad, Z.; Niles, M.T.; Neher, D.A.; Roy, E.D.; Tichenor, N.E.; Jahns, L. Relationship between food waste, diet quality, and environmental sustainability. PLoS ONE 2018, 13, e0195405. [Google Scholar] [CrossRef] [PubMed]
- Lipinski, B.; Hanson, C.; Lomax, J.; Kitinoja, L.; Waite, R.; Searchinger, T. Toward a Sustainable Food System Reducing Food Loss and Waste; World Resources Institute: Washington, DC, USA, 2016. [Google Scholar]
- Food and Agriculture Organization of the United Nations. Food Wastage Footprint. Impacts on Natural Resources. Summary Report; FAO: Rome, Italy, 2013; ISBN 9789251077528. [Google Scholar]
- Chen, C.; Chaudhary, A.; Mathys, A. Nutritional and environmental losses embedded in global food waste. Resour. Conserv. Recycl. 2020, 160, 104912. [Google Scholar] [CrossRef]
- Williams, P.; Walton, K. Plate waste in hospitals and strategies for change. e-SPEN 2011, 6, e235–e241. [Google Scholar] [CrossRef]
- McCray, S.; Maunder, K.; Krikowa, R.; MacKenzie-Shalders, K. Room Service Improves Nutritional Intake and Increases Patient Satisfaction While Decreasing Food Waste and Cost. J. Acad. Nutr. Diet. 2018, 118, 284–293. [Google Scholar] [CrossRef] [PubMed]
- Vidal, R.; Moliner, E.; Pikula, A.; Mena-Nieto, A.; Ortega, A. Comparison of the carbon footprint of different patient diets in a Spanish hospital. J. Health Serv. Res. Policy 2015, 20, 39–44. [Google Scholar] [CrossRef] [PubMed]
- Dias-Ferreira, C.; Santos, T.; Oliveira, V. Hospital food waste and environmental and economic indicators-A Portuguese case study. Waste Manag. 2015, 46, 146–154. [Google Scholar] [CrossRef] [PubMed]
- Berardy, A.; Fresán, U.; Matos, R.A.; Clarke, A.; Mejia, A.; Jaceldo-Siegl, K.; Sabaté, J. Environmental impacts of foods in the adventist health study-2 dietary questionnaire. Sustainability 2020, 12, 267. [Google Scholar] [CrossRef]
- Mejia, A.; Harwatt, H.; Jaceldo-Siegl, K.; Sranacharoenpong, K.; Soret, S.; Sabaté, J. Greenhouse Gas Emissions Generated by Tofu Production: A Case Study. J. Hunger Environ. Nutr. 2018, 13, 131–142. [Google Scholar] [CrossRef]
- Clune, S.; Crossin, E.; Verghese, K. Systematic review of greenhouse gas emissions for different fresh food categories. J. Clean. Prod. 2017, 140, 766–783. [Google Scholar] [CrossRef]
- Carlsson-Kanyama, A.; González, A.D. Potential contributions of food consumption patterns to climate change. Am. J. Clin. Nutr. 2009, 89, 1704S–1709S. [Google Scholar] [CrossRef] [PubMed]
- González, A.D.; Frostell, B.; Carlsson-Kanyama, A. Protein efficiency per unit energy and per unit greenhouse gas emissions: Potential contribution of diet choices to climate change mitigation. Food Policy 2011, 36, 562–570. [Google Scholar] [CrossRef]
- Alharbi, N.S.; Qattan, M.Y.; Alhaji, J.H. Towards sustainable food services in hospitals: Expanding the concept of “plate waste” to “tray waste”. Sustainability 2020, 12, 6872. [Google Scholar] [CrossRef]
- Keller, R.L.; Muir, K.; Roth, F.; Jattke, M.; Stucki, M. From bandages to buildings: Identifying the environmental hotspots of hospitals. J. Clean. Prod. 2021, 319, 128479. [Google Scholar] [CrossRef]
- Thibault, R.; Abbasoglu, O.; Ioannou, E.; Meija, L.; Ottens-Oussoren, K.; Pichard, C.; Rothenberg, E.; Rubin, D.; Siljamäki-Ojansuu, U.; Vaillant, M.F.; et al. ESPEN guideline on hospital nutrition. Clin. Nutr. 2021, 40, 5684–5709. [Google Scholar] [CrossRef] [PubMed]
- California Senate. Senate Bill No. 1138. 2018. Available online: https://leginfo.legislature.ca.gov/faces/billTextClient.xhtml?bill_id=201720180SB1138 (accessed on 22 February 2022).
- California Senate. Senate Bill No. 1383. 2016. Available online: https://leginfo.legislature.ca.gov/faces/billNavClient.xhtml?bill_id=201520160SB1383 (accessed on 22 February 2022).
- American Medical Association Healthy Food Options in Hospitals H-150.949. Available online: https://policysearch.ama-assn.org/policyfinder/detail/HealthyFoodOptionsinHospitalsH-150.949?uri=%2FAMADoc%2FHOD.xml-0-627.xml (accessed on 16 February 2022).
- Code of Federal Regulations. Title 42: Public Health; National Archives and Records Administration: Washington, DC, USA, 2011; pp. 1–871.
- Calder, P.C.; Carr, A.C.; Gombart, A.F.; Eggersdorfer, M. Optimal nutritional status for a well-functioning immune system is an important factor to protect against viral infections. Nutrients 2020, 12, 2326. [Google Scholar] [CrossRef] [PubMed]
- Merino, J.; Joshi, A.D.; Nguyen, L.H.; Leeming, E.R.; Mazidi, M.; Drew, D.A.; Gibson, R.; Graham, M.S.; Lo, C.-H.; Capdevila, J.; et al. Diet quality and risk and severity of COVID-19: A prospective cohort study. Gut 2021, 70, 2096–2104. [Google Scholar] [CrossRef] [PubMed]
- Kim, H.; Rebholz, C.M.; Hegde, S.; Lafiura, C.; Raghavan, M.; Lloyd, J.F.; Cheng, S.; Seidelmann, S.B. Plant-based diets, pescatarian diets and COVID-19 severity: A population-based case-control study in six countries. BMJ Nutr. Prev. Health 2021, 4, 257–266. [Google Scholar] [CrossRef]


| Food Waste (g/plate) | Total | ||||||
|---|---|---|---|---|---|---|---|
| (N = 447) | |||||||
| M | ± | SD | SE | t-Statistic | p-Value | Hedges’ g | |
| Fruit | 40.03 | ± | 50.19 | 2.37 | 0.80 | 0.43 | 0.08 |
| Vegetable 1 | 140.06 | ± | 65.51 | 3.10 | 4.60 | <0.001 | 0.44 |
| Grains | 44.27 | ± | 54.73 | 2.59 | 6.10 | <0.001 | 0.57 |
| Dairy | 21.26 | ± | 45.69 | 2.16 | 4.40 | <0.001 | 0.41 |
| Egg | 6.90 | ± | 17.79 | 0.84 | 6.62 | <0.001 | 0.61 |
| Plant Protein 2 | 4.20 | ± | 17.96 | 0.85 | 2.03 | 0.049 | 0.19 |
| Dessert | 17.74 | ± | 35.54 | 1.68 | 2.22 | 0.03 | 0.21 |
| GHGE (g CO2 eq/plate) | |||||||
| Fruit | 19.56 | ± | 29.32 | 1.39 | 0.90 | 0.38 | 0.09 |
| Vegetable 1 | 30.27 | ± | 33.16 | 1.57 | 4.17 | <0.001 | 0.39 |
| Grains | 41.61 | ± | 54.44 | 2.57 | 4.38 | <0.001 | 0.41 |
| Dairy | 77.84 | ± | 161.04 | 7.62 | 3.82 | <0.001 | 0.36 |
| Egg | 23.40 | ± | 60.18 | 2.85 | 6.14 | <0.001 | 0.61 |
| Plant Protein 2 | 5.32 | ± | 19.93 | 0.94 | 2.42 | 0.008 | 0.23 |
| Dessert | 108.08 | ± | 323.83 | 15.32 | 2.67 | 0.004 | 0.25 |
Publisher’s Note: MDPI stays neutral with regard to jurisdictional claims in published maps and institutional affiliations. |
© 2022 by the authors. Licensee MDPI, Basel, Switzerland. This article is an open access article distributed under the terms and conditions of the Creative Commons Attribution (CC BY) license (https://creativecommons.org/licenses/by/4.0/).
Share and Cite
Berardy, A.; Egan, B.; Birchfield, N.; Sabaté, J.; Lynch, H. Comparison of Plate Waste between Vegetarian and Meat-Containing Meals in a Hospital Setting: Environmental and Nutritional Considerations. Nutrients 2022, 14, 1174. https://doi.org/10.3390/nu14061174
Berardy A, Egan B, Birchfield N, Sabaté J, Lynch H. Comparison of Plate Waste between Vegetarian and Meat-Containing Meals in a Hospital Setting: Environmental and Nutritional Considerations. Nutrients. 2022; 14(6):1174. https://doi.org/10.3390/nu14061174
Chicago/Turabian StyleBerardy, Andrew, Brianna Egan, Natasha Birchfield, Joan Sabaté, and Heidi Lynch. 2022. "Comparison of Plate Waste between Vegetarian and Meat-Containing Meals in a Hospital Setting: Environmental and Nutritional Considerations" Nutrients 14, no. 6: 1174. https://doi.org/10.3390/nu14061174
APA StyleBerardy, A., Egan, B., Birchfield, N., Sabaté, J., & Lynch, H. (2022). Comparison of Plate Waste between Vegetarian and Meat-Containing Meals in a Hospital Setting: Environmental and Nutritional Considerations. Nutrients, 14(6), 1174. https://doi.org/10.3390/nu14061174