
The Arabic Version of the Adult Eating Behavior Questionnaire among Saudi Population: Translation and Validation
 , and
, and
Abstract
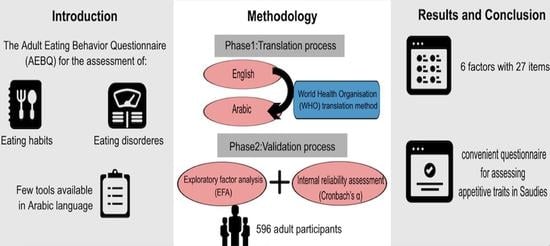
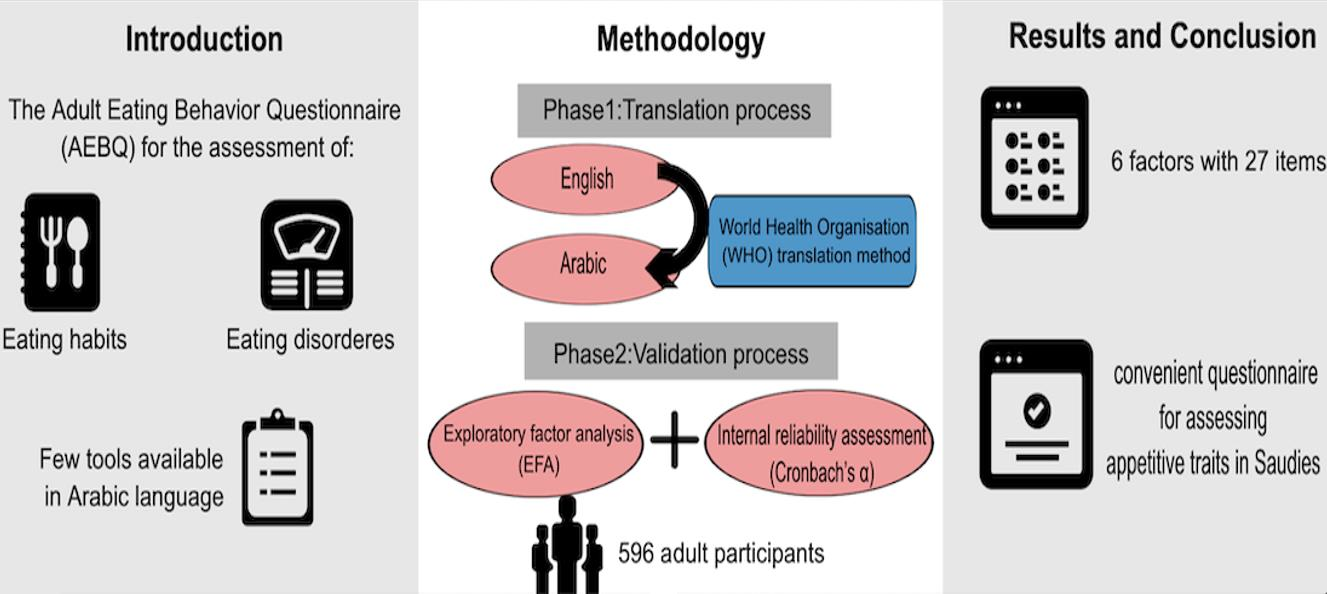
1. Introduction
2. Materials and Methods
2.1. Translation Process
2.1.1. Forward Translation
2.1.2. Back-Translation
2.1.3. Pilot Testing
2.1.4. Final Version
2.1.5. Content Validity and Experts’ Evaluation
2.2. Validation Process
2.2.1. Sample Size Calculation
2.2.2. Participants
2.2.3. Statistical Analysis
2.2.4. Ethical Considerations
3. Results and Discussion
3.1. Content Validity
3.2. Characteristic of Study Participants
3.3. Reliability Analysis
3.4. Factor Analysis
4. Conclusions
Author Contributions
Funding
Institutional Review Board Statement
Informed Consent Statement
Data Availability Statement
Conflicts of Interest
Appendix A

| Expert 1 | Expert 2 | Expert 3 | Expert 4 | Expert 5 | Expert 6 | Expert 7 | Expert 8 | Expert 9 | Expert 10 | Expert 11 | Experts in Agreement | I-CVI | UA | ||
|---|---|---|---|---|---|---|---|---|---|---|---|---|---|---|---|
| Item | |||||||||||||||
| Q1 | 1 | 1 | 1 | 1 | 1 | 1 | 1 | 1 | 0 | 1 | 1 | 10 | 0.9 | 0 | |
| Q2 | 1 | 1 | 1 | 1 | 1 | 1 | 1 | 1 | 1 | 1 | 1 | 11 | 1 | 1 | |
| Q3 | 1 | 1 | 1 | 1 | 1 | 1 | 1 | 1 | 1 | 1 | 1 | 11 | 1 | 1 | |
| Q4 | 1 | 1 | 1 | 1 | 1 | 0 | 1 | 1 | 1 | 1 | 1 | 10 | 0.9 | 0 | |
| Q5 | 1 | 1 | 1 | 1 | 1 | 1 | 1 | 1 | 1 | 1 | 1 | 11 | 1 | 1 | |
| Q6 | 1 | 1 | 1 | 1 | 0 | 0 | 1 | 1 | 0 | 1 | 1 | 8 | 0.73 | 0 | |
| Q7 | 1 | 1 | 1 | 1 | 1 | 1 | 1 | 1 | 1 | 1 | 1 | 11 | 1 | 1 | |
| Q8 | 1 | 1 | 1 | 1 | 1 | 1 | 1 | 1 | 1 | 1 | 1 | 11 | 1 | 1 | |
| Q9 | 1 | 1 | 1 | 1 | 1 | 1 | 1 | 1 | 1 | 1 | 1 | 11 | 1 | 1 | |
| Q10 | 0 | 1 | 1 | 1 | 1 | 1 | 1 | 1 | 1 | 1 | 1 | 10 | 0.9 | 0 | |
| Q11 | 1 | 1 | 1 | 1 | 1 | 0 | 1 | 1 | 1 | 1 | 1 | 10 | 0.9 | 0 | |
| Q12 | 0 | 1 | 1 | 1 | 1 | 1 | 1 | 1 | 1 | 1 | 1 | 10 | 0.9 | 0 | |
| Q13 | 1 | 1 | 1 | 1 | 1 | 1 | 1 | 1 | 1 | 1 | 1 | 11 | 1 | 1 | |
| Q14 | 1 | 1 | 1 | 1 | 1 | 1 | 1 | 1 | 1 | 1 | 1 | 11 | 1 | 1 | |
| Q15 | 1 | 1 | 1 | 1 | 1 | 1 | 1 | 1 | 1 | 1 | 1 | 11 | 1 | 1 | |
| Q16 | 0 | 1 | 1 | 1 | 1 | 1 | 1 | 1 | 1 | 1 | 1 | 10 | 0.9 | 0 | |
| Q17 | 1 | 1 | 1 | 0 | 1 | 1 | 1 | 1 | 1 | 1 | 1 | 10 | 0.9 | 0 | |
| Q18 | 1 | 1 | 1 | 1 | 1 | 1 | 1 | 1 | 1 | 1 | 1 | 11 | 1 | 1 | |
| Q19 | 0 | 1 | 1 | 1 | 1 | 1 | 1 | 1 | 1 | 1 | 1 | 10 | 0.9 | 0 | |
| Q20 | 0 | 1 | 1 | 1 | 1 | 1 | 1 | 1 | 1 | 1 | 1 | 10 | 0.9 | 0 | |
| Q21 | 1 | 1 | 1 | 1 | 1 | 1 | 1 | 1 | 1 | 1 | 1 | 11 | 1 | 1 | |
| Q22 | 1 | 1 | 1 | 1 | 1 | 1 | 1 | 1 | 1 | 1 | 1 | 11 | 1 | 1 | |
| Q23 | 1 | 1 | 1 | 1 | 1 | 1 | 1 | 1 | 1 | 1 | 1 | 11 | 1 | 1 | |
| Q24 | 1 | 1 | 1 | 1 | 1 | 1 | 1 | 1 | 1 | 1 | 1 | 11 | 1 | 1 | |
| Q25 | 1 | 1 | 1 | 1 | 1 | 1 | 1 | 1 | 1 | 1 | 1 | 11 | 1 | 1 | |
| Q26 | 1 | 1 | 1 | 1 | 1 | 1 | 1 | 0 | 1 | 1 | 1 | 10 | 0.9 | 0 | |
| Q27 | 1 | 1 | 1 | 1 | 1 | 1 | 1 | 1 | 1 | 1 | 1 | 11 | 1 | 1 | |
| Q28 | 1 | 1 | 1 | 1 | 1 | 0 | 1 | 1 | 1 | 1 | 1 | 10 | 0.9 | 0 | |
| Q29 | 0 | 1 | 1 | 1 | 1 | 1 | 1 | 1 | 1 | 1 | 1 | 10 | 0.9 | 0 | |
| Q30 | 1 | 1 | 1 | 1 | 1 | 1 | 1 | 1 | 1 | 1 | 1 | 11 | 0.9 | 1 | |
| Q31 | 1 | 1 | 1 | 1 | 1 | 1 | 1 | 1 | 1 | 1 | 1 | 10 | 1 | 0 | |
| Q32 | 1 | 1 | 1 | 0 | 1 | 1 | 1 | 1 | 1 | 1 | 1 | 10 | 0.9 | 0 | |
| Q33 | 1 | 1 | 1 | 1 | 1 | 1 | 1 | 1 | 1 | 1 | 1 | 11 | 1 | 1 | |
| Q34 | 1 | 1 | 1 | 0 | 1 | 1 | 1 | 1 | 1 | 1 | 1 | 10 | 1 | 0 | |
| Q35 | 0 | 1 | 1 | 1 | 1 | 1 | 1 | 1 | 1 | 1 | 1 | 10 | 0.9 | 0 | |
| S-CVI/Ave | 0.95 | ||||||||||||||
| Proportion relevance | 0.8 | 1 | 1 | 0.91 | 0.97 | 0.89 | 1 | 0.97 | 0.94 | 1 | 1 | S-CVI/UA | 0.51 | ||
| Average proportion of items judged as relevance across the 11 experts | 0.95 | ||||||||||||||
| Mean | SD | Rank | ||
|---|---|---|---|---|
| FOOD ENJOYMENT | ||||
| EF 1 | I love food | 4.2 | 0.71 | 2 |
| EF 3 | I enjoy eating | 4.24 | 0.7 | 1 |
| EF 4 | I look forward to mealtimes | 3.29 | 1 | 3 |
| EMOTIONAL OVER-EATING | ||||
| EOE 5 | I eat more When I’m annoyed | 2.64 | 1.25 | 1 |
| EOE 8 | I eat more When I’m worried | 2.47 | 1.23 | 3 |
| EOE 10 | I eat more When I’m upset | 2.53 | 1.21 | 2 |
| EOE 16 | I eat more When I’m anxious | 2.44 | 1.14 | 4 |
| EOE 21 | I eat more When I’m angry | 2.28 | 0.99 | 5 |
| EMOTIONAL UNDER-EATING | ||||
| EUE 15 | I eat less When I’m worried | 3.58 | 1.13 | 1 |
| EUE 18 | I eat less When I’m angry | 3.42 | 1.19 | 5 |
| EUE 20 | I eat less When I’m upset | 3.56 | 1.1 | 3 |
| EUE 27 | I eat less When I’m annoyed | 3.53 | 1.08 | 4 |
| EUE 35 | I eat less When I’m anxious | 3.57 | 1.09 | 2 |
| FOOD FUSSINESS | ||||
| FF 21 | I often decide that I don’t like a food, before tasting it | 3.03 | 1.2 | 4 |
| FF 7 | I refuse new foods at first | 2.95 | 1.18 | 5 |
| FF 12 | I enjoy tasting new foods | 3.64 | 0.92 | 2 |
| FF 19 | I am interested in tasting new food I haven’t tasted before | 3.44 | 1.03 | 3 |
| FF 24 | I enjoy a wide variety of foods | 4.01 | 0.78 | 1 |
| FOOD RESPONSIVENESS | ||||
| FR 13 | I often feel hungry when I’m with someone who is eating | 3.14 | 1.06 | 2 |
| FR 17 | Given the choice, I would eat most if the time | 2.43 | 1.14 | 4 |
| FR 22 | I am always thinking about food | 2.68 | 1 | 3 |
| FR 33 | When I see or smell food that I like, it makes me want to eat | 3.77 | 0.9 | 1 |
| HUNGER | ||||
| H 6 | I often notice my stomach rumbling | 3.44 | 1.08 | 1 |
| H 9 | If I miss a meal I get irritable | 2.68 | 1.14 | 4 |
| H 28 | I often feel so hungry that I have to eat something right away | 3.16 | 1.12 | 2 |
| H 32 | I often feel hungry | 3.06 | 0.99 | 3 |
| H 34 | If my meals are delayed I get light-headed | 2.4 | 1.04 | 5 |
| SLOWNESS IN EATING | ||||
| SE 14 | I often finish my meals quickly | 3.5 | 1.17 | 1 |
| SE 25 | I am often last at finishing a meal | 2.72 | 1.16 | 3 |
| SE 26 | I eat more and more slowly during the course of a meal | 2.65 | 1.06 | 4 |
| SE 29 | I eat slowly | 2.77 | 1.09 | 2 |
| SATIETY RESPONSIVENESS | ||||
| SR 11 | I often leave food on my plate at the end of the meal | 2.54 | 1.17 | 4 |
| SR 23 | I often get full before my meal is finished | 3.25 | 1.02 | 3 |
| SR 30 | I cannot eat a meal if I have had a snack just before | 3.36 | 1.06 | 1 |
| SR 31 | I get full up easily | 3.31 | 1.03 | 2 |
References
- Arroyo-Johnson, C.; Mincey, K.D. Obesity Epidemiology Trends by Race/Ethnicity, Gender, and Education. Gastroenterol. Clin. N. Am. 2016, 45, 571–579. [Google Scholar] [CrossRef] [PubMed]
- Dietary Guidelines Advisory Committee. Scientific Report of the 2020 Dietary Guidelines Advisory Committee: Advisory Report to the Secretary of Agriculture and the Secretary of Health and Human Services; U.S. Department of Agriculture, Agricultural Research Service: Washington, DC, USA, 2020.
- Interagency Committee on Human Nutrition Research. National Nutrition Research Roadmap Advancing Nutrition Research to Improve and Sustain Health; Interagency Committee on Human Nutrition Research: Washington, DC, USA, 2016; p. 176. [Google Scholar]
- Silventoinen, K.; Konttinen, H. Obesity and Eating Behavior from the Perspective of Twin and Genetic Research. Neurosci. Biobehav. Rev. 2020, 109, 150–165. [Google Scholar] [CrossRef] [PubMed]
- Llewellyn, C.; Wardle, J. Behavioral Susceptibility to Obesity: Gene-Environment Interplay in the Development of Weight. Physiol. Behav. 2015, 152, 494–501. [Google Scholar] [CrossRef]
- Gellman, M.D. Encyclopedia of Behavioral Medicine; Springer International Publishing: Cham, Switzerland, 2020. [Google Scholar] [CrossRef]
- Jacob, R.; Tremblay, A.; Fildes, A.; Llewellyn, C.; Beeken, R.J.; Panahi, S.; Provencher, V.; Drapeau, V. Validation of the Adult Eating Behaviour Questionnaire Adapted for the French-Speaking Canadian Population. Eat. Weight Disord. 2022, 27, 1163–1179. [Google Scholar] [CrossRef]
- He, J.; Sun, S.; Zickgraf, H.; Ellis, J.; Fan, X. Assessing Appetitive Traits Among Chinese Young Adults Using the Adult Eating Behavior Questionnaire: Factor Structure, Gender Invariance and Latent Mean Differences, and Associations With BMI. Assessment 2021, 28, 877–889. [Google Scholar] [CrossRef]
- Mallan, K.M.; Fildes, A.; de la Piedad Garcia, X.; Drzezdzon, J.; Sampson, M.; Llewellyn, C. Appetitive Traits Associated with Higher and Lower Body Mass Index: Evaluating the Validity of the Adult Eating Behaviour Questionnaire in an Australian Sample. Int. J. Behav. Nutr. Phys. Act. 2017, 14, 130. [Google Scholar] [CrossRef]
- Wardle, J. Eating Style: A Validation Study of the Dutch Eating Behaviour Questionnaire in Normal Subjects and Women with Eating Disorders. J. Psychosom. Res. 1987, 31, 161–169. [Google Scholar] [CrossRef]
- French, S.A.; Epstein, L.H.; Jeffery, R.W.; Blundell, J.E.; Wardle, J. Eating Behavior Dimensions: Associations With Energy Intake And Body Weight: A Review. Appetite 2012, 59, 541–549. [Google Scholar] [CrossRef]
- French, S.A.; Mitchell, N.R.; Wolfson, J.; Finlayson, G.; Blundell, J.E.; Jeffery, R.W. Questionnaire and Laboratory Measures of Eating Behavior: Associations with Energy Intake and BMI in a Community Sample of Working Adults. Appetite 2014, 72, 50–58. [Google Scholar] [CrossRef]
- Stunkard, A.J.; Messick, S. The Three-Factor Eating Questionnaire to Measure Dietary Restraint, Disinhibition and Hunger. J. Psychosom. Res. 1985, 29, 71–83. [Google Scholar] [CrossRef]
- Van Strien, T.; Frijters, J.; Bergers, G.; Defares, P. The Dutch Eating Behavior Questionnaire (DEBQ) for Assessment of Restrained, Emotional and External Eating Behavio. Int. J. Eat. Disord. 1986, 5, 295–315. [Google Scholar] [CrossRef]
- Hunot, C.; Fildes, A.; Croker, H.; Llewellyn, C.H.; Wardle, J.; Beeken, R.J. Appetitive Traits and Relationships with BMI in Adults: Development of the Adult Eating Behaviour Questionnaire. Appetite 2016, 105, 356–363. [Google Scholar] [CrossRef] [PubMed]
- Hunot-Alexander, C.; Beeken, R.J.; Goodman, W.; Fildes, A.; Croker, H.; Llewellyn, C.; Steinsbekk, S. Confirmation of the Factor Structure and Reliability of the ‘Adult Eating Behavior Questionnaire’ in an Adolescent Sample. Front. Psychol. 2019, 10, 1991. [Google Scholar] [CrossRef]
- Guzek, D.; Skolmowska, D.; Głąbska, D. Appetitive Traits in a Population-Based Study of Polish Adolescents within the Place-19 Study: Validation of the Adult Eating Behavior Questionnaire. Nutrients 2020, 12, 3889. [Google Scholar] [CrossRef]
- Warkentin, S.; Costa, A.; Oliveira, A. Validity of the Adult Eating Behavior Questionnaire and Its Relationship with Parent-Reported Eating Behaviors among Adolescents in Portugal. Nutrients 2022, 14, 1301. [Google Scholar] [CrossRef]
- Cohen, T.R.; Kakinami, L.; Plourde, H.; Hunot-Alexander, C.; Beeken, R.J. Concurrent Validity of the Adult Eating Behavior Questionnaire in a Canadian Sample. Front. Psychol. 2021, 12, 5523. [Google Scholar] [CrossRef]
- Hunot-Alexander, C.; Arellano-Gómez, L.P.; Smith, A.D.; Kaufer-Horwitz, M.; Vásquez-Garibay, E.M.; Romero-Velarde, E.; Fildes, A.; Croker, H.; Llewellyn, C.H.; Beeken, R.J. Examining the Validity and Consistency of the Adult Eating Behaviour Questionnaire-Español (AEBQ-Esp) and Its Relationship to BMI in a Mexican Population. Eat. Weight Disord. 2022, 27, 651–663. [Google Scholar] [CrossRef]
- Hristova, V. Psychometric Properties of Bulgarian Version of Adult Eating Behaviour Questionnaire (AEBQ): A Preliminary Study. Int. Themat Proceedia 2018, 18, 89–100. [Google Scholar]
- World Health Organization. WHO Guidelines on Translation and Adaptation of Instruments; World Health Organization: Geneva, Switzerland, 2018. [Google Scholar]
- Sherbini, L.E. Glossary of Psychiatry Terms; Health Sciences Arabization Center: Kuwait, 2003. [Google Scholar]
- Sousa, V.D.; Rojjanasrirat, W. Translation, Adaptation and Validation of Instruments or Scales for Use in Cross-Cultural Health Care Research: A Clear and User-Friendly Guideline. J. Eval. Clin. Pract. 2011, 17, 268–274. [Google Scholar] [CrossRef]
- Yusoff, M.S.B. ABC of Content Validation and Content Validity Index Calculation. Educ. Med. J. 2019, 11, 49–54. [Google Scholar] [CrossRef]
- Lynn, M.R. Determination and Quantification of Content Validity. Nurs. Res. 1986, 35, 382–386. [Google Scholar] [CrossRef] [PubMed]
- Polit, D.; Beck, C.; Owen, S. Is the CVI an Acceptable Indicator of Content Validity? Appraisal and Recommendations. Res. Nurs. Health 2007, 30, 459–467. [Google Scholar] [CrossRef]
- Pedhazur, E.J.; Kerlinger, F.N. Multiple Regression in Behavioral Research: Explanation and Prediction, 2nd ed.; Holt, Rinehart, and Winston: New York, NY, USA, 1982. [Google Scholar]
- Soper, D. A-Priori Sample Size Calculator for Structural Equation Models [Software]. Available online: https://www.danielsoper.com/statcalc (accessed on 29 May 2022).
- Ferrando, P.J.; Lorenzo-Seva, U. 10 Años Del Programa FACTOR: Una Revisión Crítica de Sus Orígenes, Desarrollo y Líneas Futuras. Psicothema 2017, 29, 236–240. [Google Scholar] [CrossRef]
- Avvisati, F. The Measure of Socio-Economic Status in PISA: A Review and Some Suggested Improvements. Large-Scale Assess. Educ. 2020, 8, 8. [Google Scholar] [CrossRef]
- Boulianne, S. Examining the Gender Effects of Different Incentive Amounts in a Web Survey. Field Methods 2013, 25, 91–104. [Google Scholar] [CrossRef]
- Cull, W.L.; O’Connor, K.G.; Sharp, S.; Tang, S.F.S. Response Rates and Response Bias for 50 Surveys of Pediatricians. Health Serv. Res. 2005, 40, 213–226. [Google Scholar] [CrossRef]
- Smith, W.G. Does Gender Influence Online Survey Participation? A Record-Linkage Analysis of University Faculty Online Survey Response Behavior. ERIC Document Reproduction Service No. ED 501717. 2008. Available online: https://works.bepress.com/grinell_smith/5/ (accessed on 12 October 2022).

| Frequency | Percentage | |
|---|---|---|
| Sex | ||
| Male | 161 | 28 |
| Female | 415 | 72 |
| Age (years), mean (SD) | 35.61 (12.85) | |
| Age group | ||
| 20–30 years | 278 | 48.3 |
| 31–40 years | 117 | 20.3 |
| 41–50 years | 94 | 16.3 |
| 51–60 years | 67 | 11.6 |
| ≥61 years | 20 | 3.5 |
| Body weight (kg), mean (SD) | 70.21 (18.78) | |
| Body Height (centimeters), mean (SD) | 163.10 (9.10) | |
| Body Mass Index, mean (SD) | 26.29 (6.23) | |
| Body Mass Index Level | ||
| Underweight | 63 | 10.9 |
| Normal | 210 | 36.5 |
| Over-weight | 177 | 30.7 |
| Obese Class I | 91 | 15.8 |
| Obese Class II | 35 | 6.1 |
| Marital state | ||
| Never married | 248 | 43.1 |
| Ever married | 328 | 56.9 |
| Educational Level | ||
| High school or less | 66 | 11.5 |
| Diploma Degree | 63 | 10.9 |
| University Degree | 373 | 64.8 |
| Higher studies | 74 | 12.8 |
| Employment state | ||
| Student | 97 | 16.8 |
| Unemployed | 134 | 23.3 |
| Retired | 76 | 13.2 |
| Employed | 269 | 46.7 |
| Households size (family members), mean (SD) | Mdn = 6 | 5.86 (2.21) |
| Family size (Households size) | ||
| 1–3 members | 75 | 13 |
| 4–6 members | 279 | 48.4 |
| 7–10 members | 209 | 36.3 |
| ≥11 members | 13 | 2.3 |
| Households monthly Income Level | ||
| Less than 5000 SAR | 43 | 7.5 |
| Between 5000 to 9999 SAR | 108 | 18.8 |
| Between 10,000 to 14,999 SAR | 132 | 22.9 |
| Between 15,000 to 20,000 SAR | 97 | 16.8 |
| More than 20,000 SAR | 196 | 34 |
| Living region | ||
| Central region | 489 | 84.9 |
| Northern region | 17 | 3 |
| Southern region | 11 | 1.9 |
| Western region | 33 | 5.7 |
| Eastern region | 26 | 4.5 |
| Number of Items | Cronbach’s α | |
|---|---|---|
| Adult Eating Behavior Questionnaire-Arabic (AEBQ-Ar) | 35 | 0.720 |
| Food Approach Subscales | ||
| Hunger (H) | 5 | 0.660 |
| Food Responsiveness (FR) | 4 | 0.714 |
| Emotional Over-Eating (EOE) | 5 | 0.895 |
| Enjoyment of Food (EF) | 3 | 0.759 |
| Food Avoidance Subscales | ||
| Satiety Response (SR) | 4 | 0.660 |
| Emotional Under-Eating (EUE) | 5 | 0.856 |
| Food Fussiness (FF) | 5 | 0.716 |
| Slowness in Eating (SE) | 4 | 0.818 |
| Corrected Item-Total Correlation | Cronbach’s α If Item Deleted | ||
|---|---|---|---|
| EF 1 | I love food | 0.148 | 0.715 |
| EF 3 | I enjoy eating | 0.131 | 0.716 |
| EF 4 | I look forward to mealtimes | 0.315 | 0.706 |
| EOE 5 | I eat more when I’m annoyed | 0.303 | 0.706 |
| EOE 8 | I eat more when I’m worried | 0.290 | 0.707 |
| EOE 10 | I eat more when I’m upset | 0.325 | 0.705 |
| EOE 16 | I eat more when I’m anxious | 0.249 | 0.710 |
| EOE 21 | I eat more when I’m angry | 0.204 | 0.712 |
| EUE 15 | I eat less when I’m worried | 0.008 | 0.725 |
| EUE 18 | I eat less when I’m angry | 0.156 | 0.716 |
| EUE 20 | I eat less when I’m upset | −0.008 | 0.725 |
| EUE 27 | I eat less when I’m annoyed | 0.102 | 0.719 |
| EUE 35 | I eat less when I’m anxious | 0.090 | 0.719 |
| FF 2 | I often decide that I don’t like a food, before tasting it | 0.254 | 0.709 |
| FF 7 | I refuse new foods at first | 0.266 | 0.709 |
| FF 12 | I enjoy tasting new foods | 0.026 | 0.721 |
| FF 19 | I am interested in tasting new food I haven’t tasted before | −0.079 | 0.728 |
| FF 24 | I enjoy a wide variety of foods | −0.095 | 0.725 |
| FR 13 | I often feel hungry when I’m with someone who is eating | 0.318 | 0.706 |
| FR 17 | Given the choice, I would eat most if the time | 0.364 | 0.702 |
| FR 22 | I am always thinking about food | 0.389 | 0.702 |
| FR 33 | When I see or smell food that I like, it makes me want to eat | 0.357 | 0.705 |
| H 6 | I often notice my stomach rumbling | 0.296 | 0.707 |
| H 9 | If I miss a meal I get irritable | 0.352 | 0.703 |
| H 28 | I often feel so hungry that I have to eat something right away | 0.348 | 0.703 |
| H 32 | I often feel hungry | 0.404 | 0.701 |
| H 34 | If my meals are delayed I get light-headed | 0.453 | 0.698 |
| SE 14 | I often finish my meals quickly | −0.025 | 0.727 |
| SE 25 | I am often last at finishing a meal | 0.380 | 0.701 |
| SE 26 | I eat more and more slowly during the course of a meal | 0.294 | 0.707 |
| SE 29 | I eat slowly | 0.198 | 0.713 |
| SR 11 | I often leave food on my plate at the end of the meal | 0.253 | 0.709 |
| SR 23 | I often get full before my meal is finished | 0.273 | 0.708 |
| SR 30 | I cannot eat a meal if I have had a snack just before | 0.095 | 0.719 |
| SR 31 | I get full up easily | 0.225 | 0.711 |
| Extracted Factors | |||||||
|---|---|---|---|---|---|---|---|
| EOE | EF | H | SE | FF | SR | ||
| EOE 8 | I eat more when I’m worried | 0.935 | |||||
| EOE 5 | I eat more when I’m annoyed | 0.895 | |||||
| EOE 10 | I eat more when I’m upset | 0.864 | |||||
| EOE 16 | I eat more when I’m anxious | 0.806 | |||||
| EOE 21 | I eat more when I’m angry | 0.768 | |||||
| EF 3 | I enjoy eating | 0.907 | |||||
| EF 1 | I love food | 0.868 | |||||
| EF 4 | I look forward to mealtimes | 0.652 | |||||
| FF 24 | I enjoy a wide variety of foods (Reversed item) | −0.575 | 0.346 | ||||
| FR 22 | I am always thinking about food | 0.416 | 0.329 | ||||
| FR 33 | When I see or smell food that I like, it makes me want to eat | 0.415 | 0.369 | ||||
| H 34 | If my meals are delayed I get light-headed | 0.813 | |||||
| H28 | I often feel so hungry that I have to eat something right away | 0.727 | |||||
| H 9 | If I miss a meal I get irritable | 0.699 | |||||
| H 32 | I often feel hungry | 0.642 | |||||
| SE 29 | I eat slowly | 0.853 | |||||
| SE 26 | I eat more and more slowly during the course of a meal | 0.848 | |||||
| SE 14 | I often finish my meals quickly (Reversed item) | 0.764 | |||||
| SE 25 | I am often last at finishing a meal | 0.750 | |||||
| FF 7 | I refuse new foods at first | 0.806 | |||||
| FF 12 | I enjoy tasting new foods (Reversed item) | 0.777 | |||||
| FF 19 | I am interested in tasting new food I haven’t tasted before (Reversed item) | 0.757 | |||||
| FF 2 | I often decide that I don’t like a food, before tasting it | 0.545 | 0.349 | ||||
| SR 23 | I often get full before my meal is finished | 0.795 | |||||
| SR 31 | I get full up easily | 0.740 | |||||
| SR 11 | I often leave food on my plate at the end of the meal | 0.642 | |||||
| SR 30 | I cannot eat a meal if I have had a snack just before | 0.497 | |||||
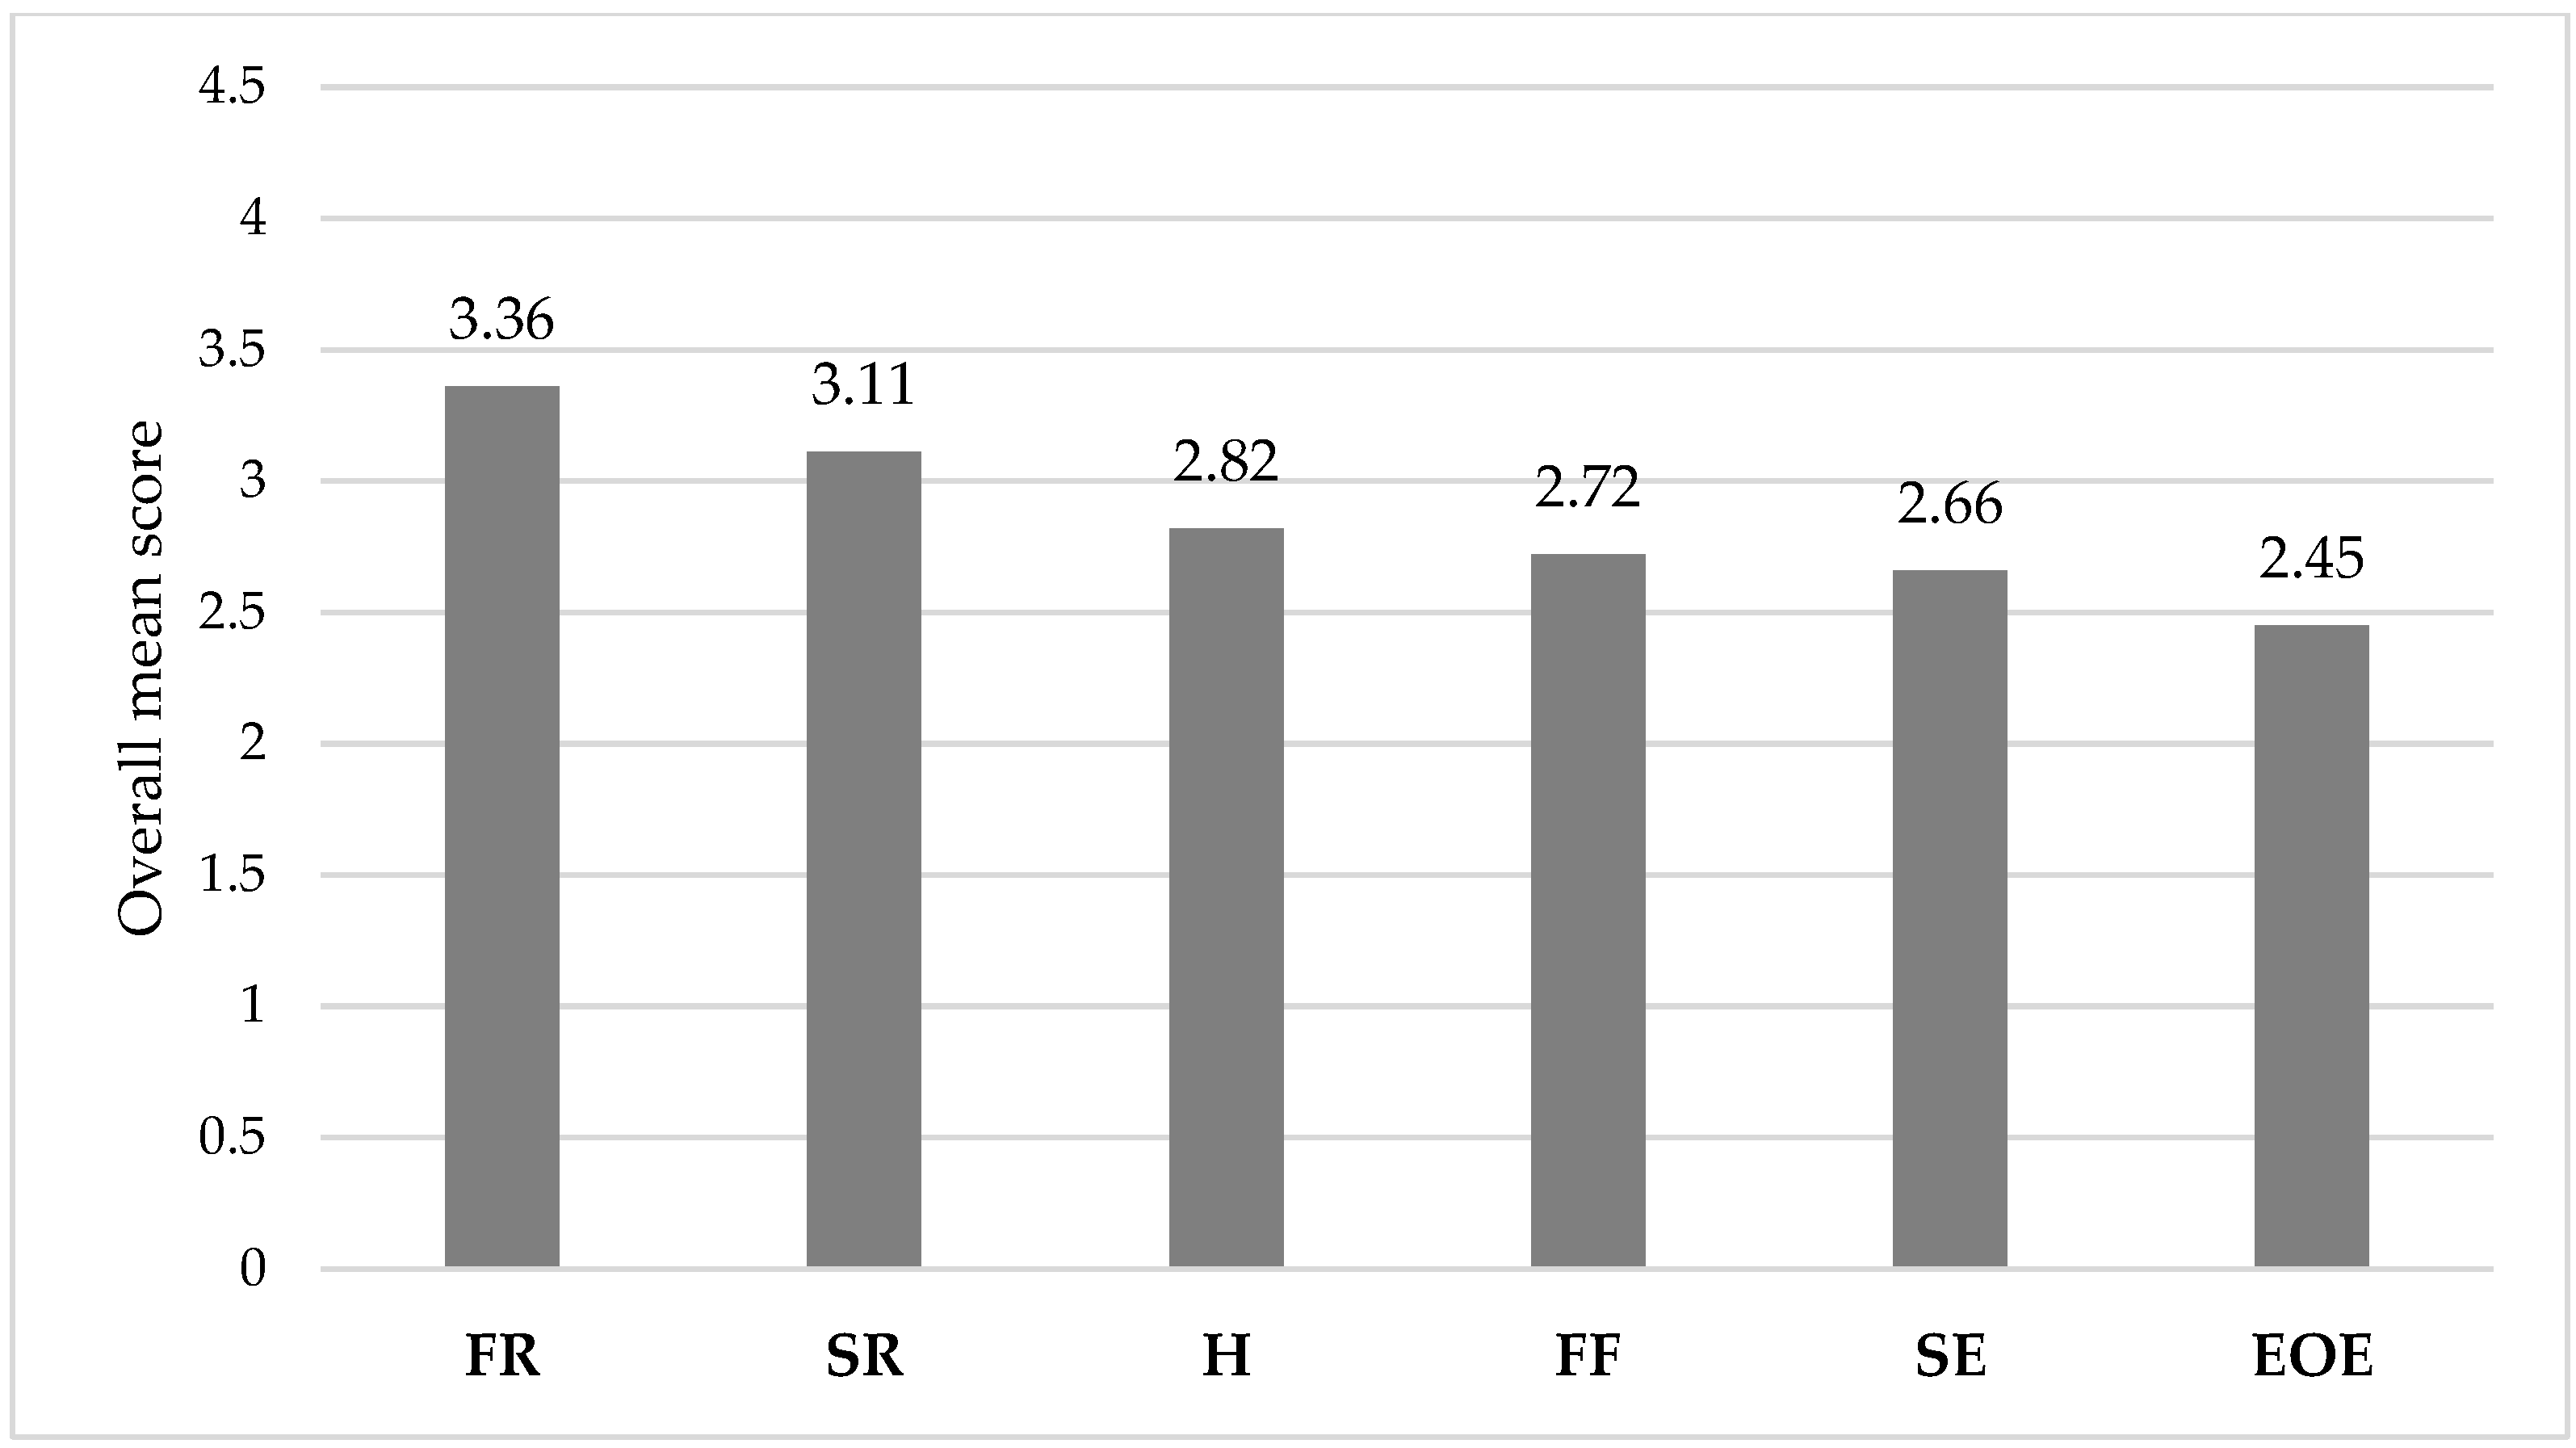
| Mean (SD) Score * | |
|---|---|
| Hunger (H) | 2.82 (0.76) |
| Enjoyment of Food (EF) | 3.36 (0.48) |
| Emotional Over-Eating (EOE) | 2.45 (0.97) |
| Satiety Response (SR) | 3.11 (0.75) |
| Food Fussiness (FF) | 2.72 (0.80) |
| Slowness in Eating (SE) | 2.66 (0.90) |
| H | EF | EOE | SR | FF | SE | Age | BMI | |
|---|---|---|---|---|---|---|---|---|
| Food approach scales | ||||||||
| Hunger (H) | 1 | |||||||
| Enjoyment of Food (EF) | 0.461 ** | 1 | ||||||
| Emotional Over-Eating (EOE) | 0.391 ** | 0.425 ** | 1 | |||||
| Food avoidance scales | ||||||||
| Satiety Response (SR) | 0.092 * | −0.149 ** | −0.129 ** | 1 | ||||
| Food Fussiness (FF) | −0.025 | −0.123 ** | −0.061 | 0.177 ** | 1 | |||
| Slowness in Eating (SE) | −0.027 | −0.057 | −0.053 | 0.243 ** | 0.035 | 1 | ||
| Participants characteristics | ||||||||
| Age (in years) | −0.171 ** | −0.269 ** | −0.166 ** | 0.009 | 0.005 | −0.072 | 1 | |
| Body Mass Index (BMI) | 0.016 | 0.046 | 0.155 ** | −0.077 | 0.002 | −0.155 ** | 0.339 ** | 1 |
| Socioeconomic status index (SESi) score | −0.082 * | −0.084 * | −0.134 ** | −0.011 | −0.061 | −0.136 ** | 0.464 ** | 0.184 ** |
Publisher’s Note: MDPI stays neutral with regard to jurisdictional claims in published maps and institutional affiliations. |
© 2022 by the authors. Licensee MDPI, Basel, Switzerland. This article is an open access article distributed under the terms and conditions of the Creative Commons Attribution (CC BY) license (https://creativecommons.org/licenses/by/4.0/).
Share and Cite
Alruwaitaa, M.A.; Alshathri, A.; Alajllan, L.; Alshahrani, N.; Alotaibi, W.; Elbarazi, I.; Aldhwayan, M.M. The Arabic Version of the Adult Eating Behavior Questionnaire among Saudi Population: Translation and Validation. Nutrients 2022, 14, 4705. https://doi.org/10.3390/nu14214705
Alruwaitaa MA, Alshathri A, Alajllan L, Alshahrani N, Alotaibi W, Elbarazi I, Aldhwayan MM. The Arabic Version of the Adult Eating Behavior Questionnaire among Saudi Population: Translation and Validation. Nutrients. 2022; 14(21):4705. https://doi.org/10.3390/nu14214705
Chicago/Turabian StyleAlruwaitaa, Mona A., Aldanah Alshathri, Lama Alajllan, Norah Alshahrani, Wejdan Alotaibi, Iffat Elbarazi, and Madhawi M. Aldhwayan. 2022. "The Arabic Version of the Adult Eating Behavior Questionnaire among Saudi Population: Translation and Validation" Nutrients 14, no. 21: 4705. https://doi.org/10.3390/nu14214705
APA StyleAlruwaitaa, M. A., Alshathri, A., Alajllan, L., Alshahrani, N., Alotaibi, W., Elbarazi, I., & Aldhwayan, M. M. (2022). The Arabic Version of the Adult Eating Behavior Questionnaire among Saudi Population: Translation and Validation. Nutrients, 14(21), 4705. https://doi.org/10.3390/nu14214705