
Prognostic Nutritional Index as a Predictor of Diabetic Nephropathy Progression

 ,
,
Abstract
:Abstract
1. Introduction
2. Methods
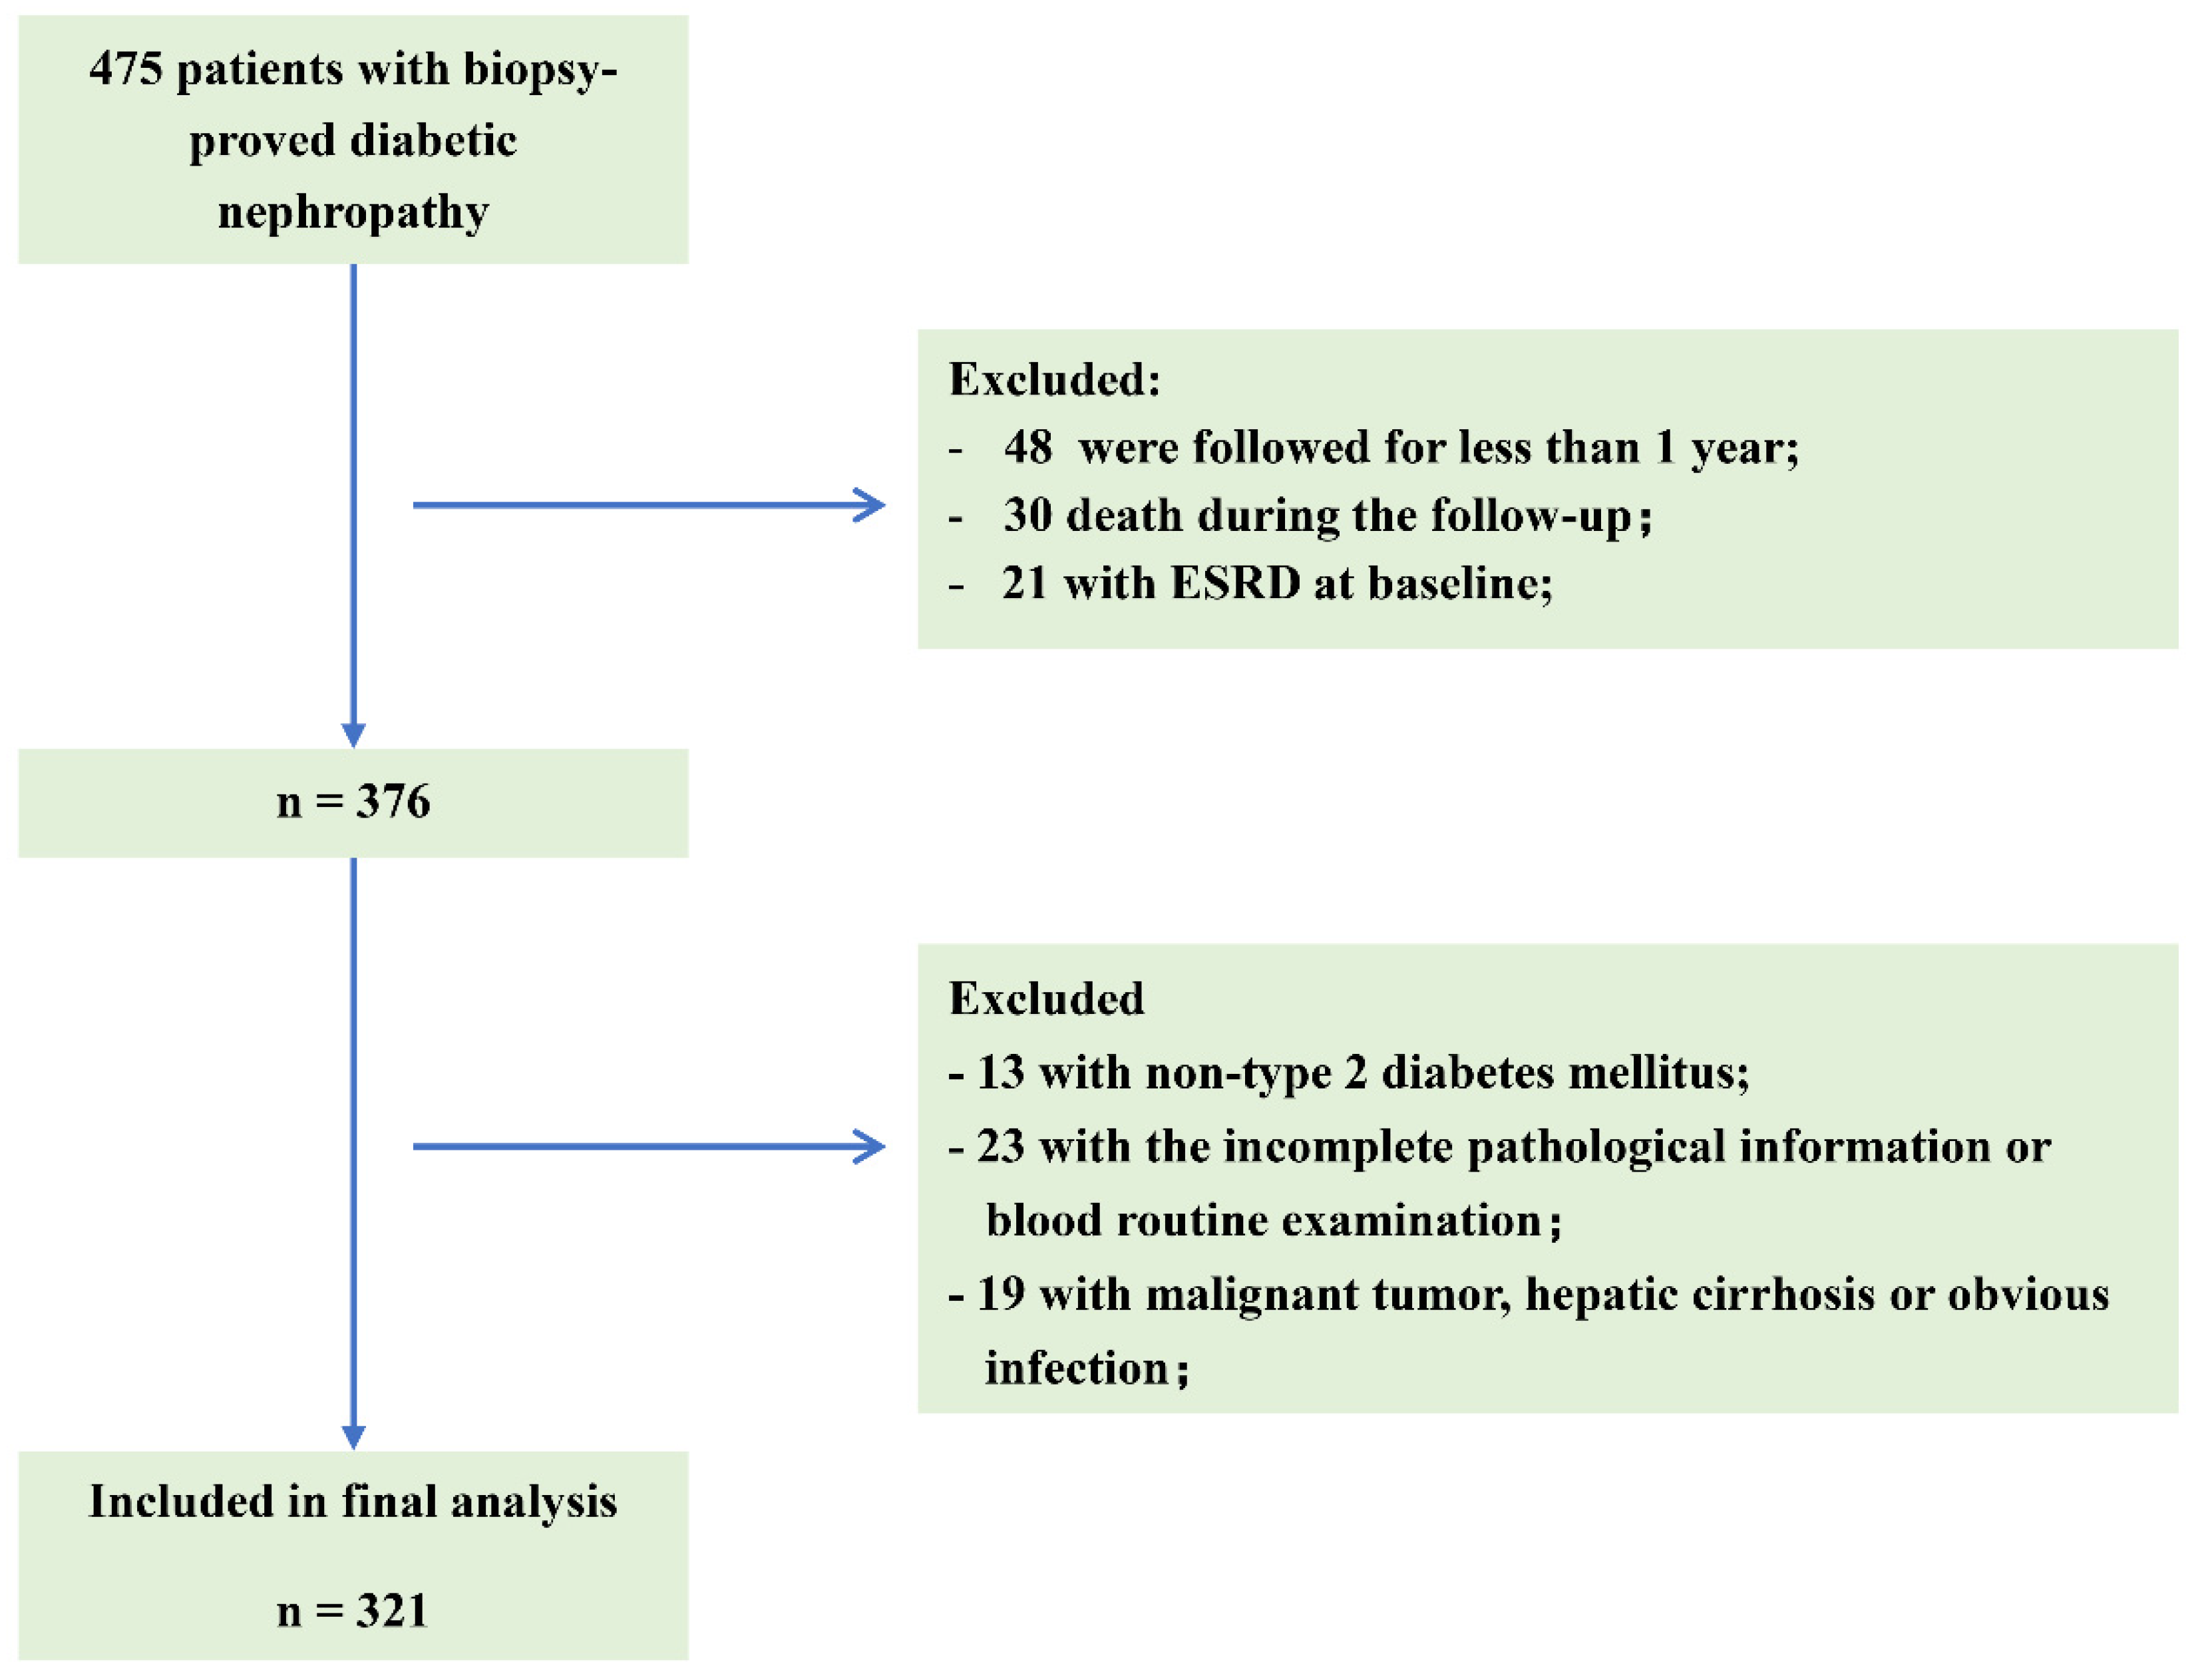
2.1. Patients
2.2. Data Collection
2.3. Statistical Analysis
3. Results
3.1. Baseline Features of the Patients
3.2. Associations of PNI with Baseline Clinical Characteristics
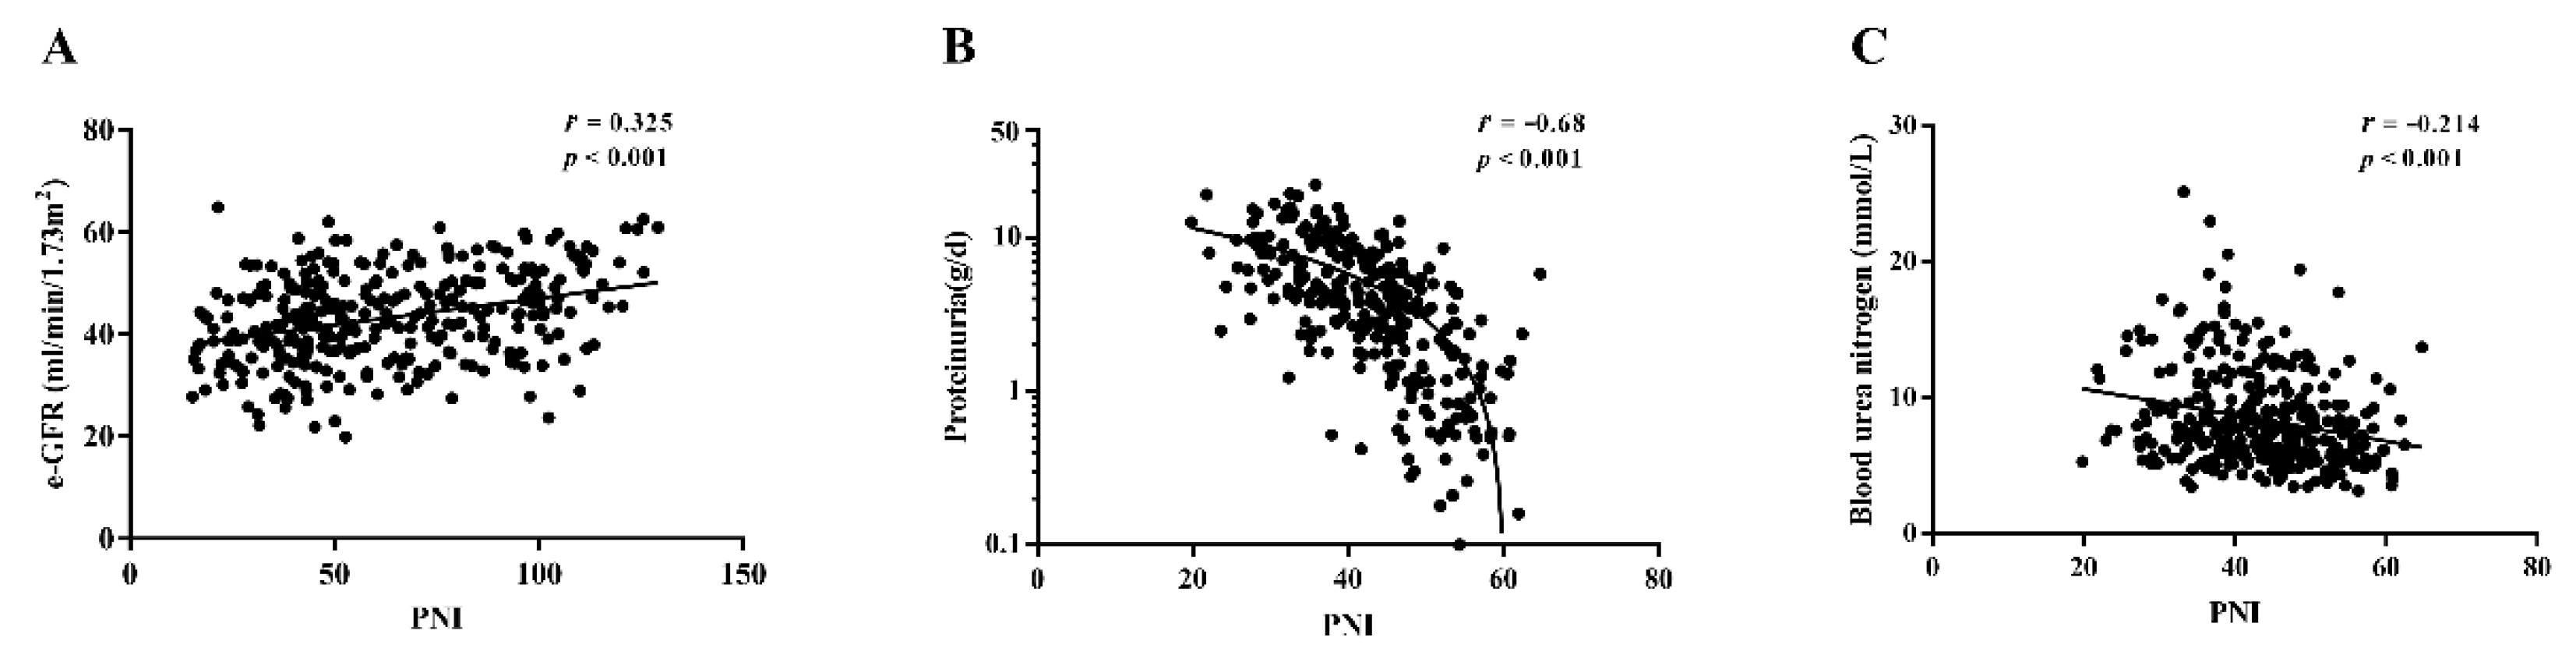
3.3. Correlation of PNI with Clinical and Pathological Characteristics
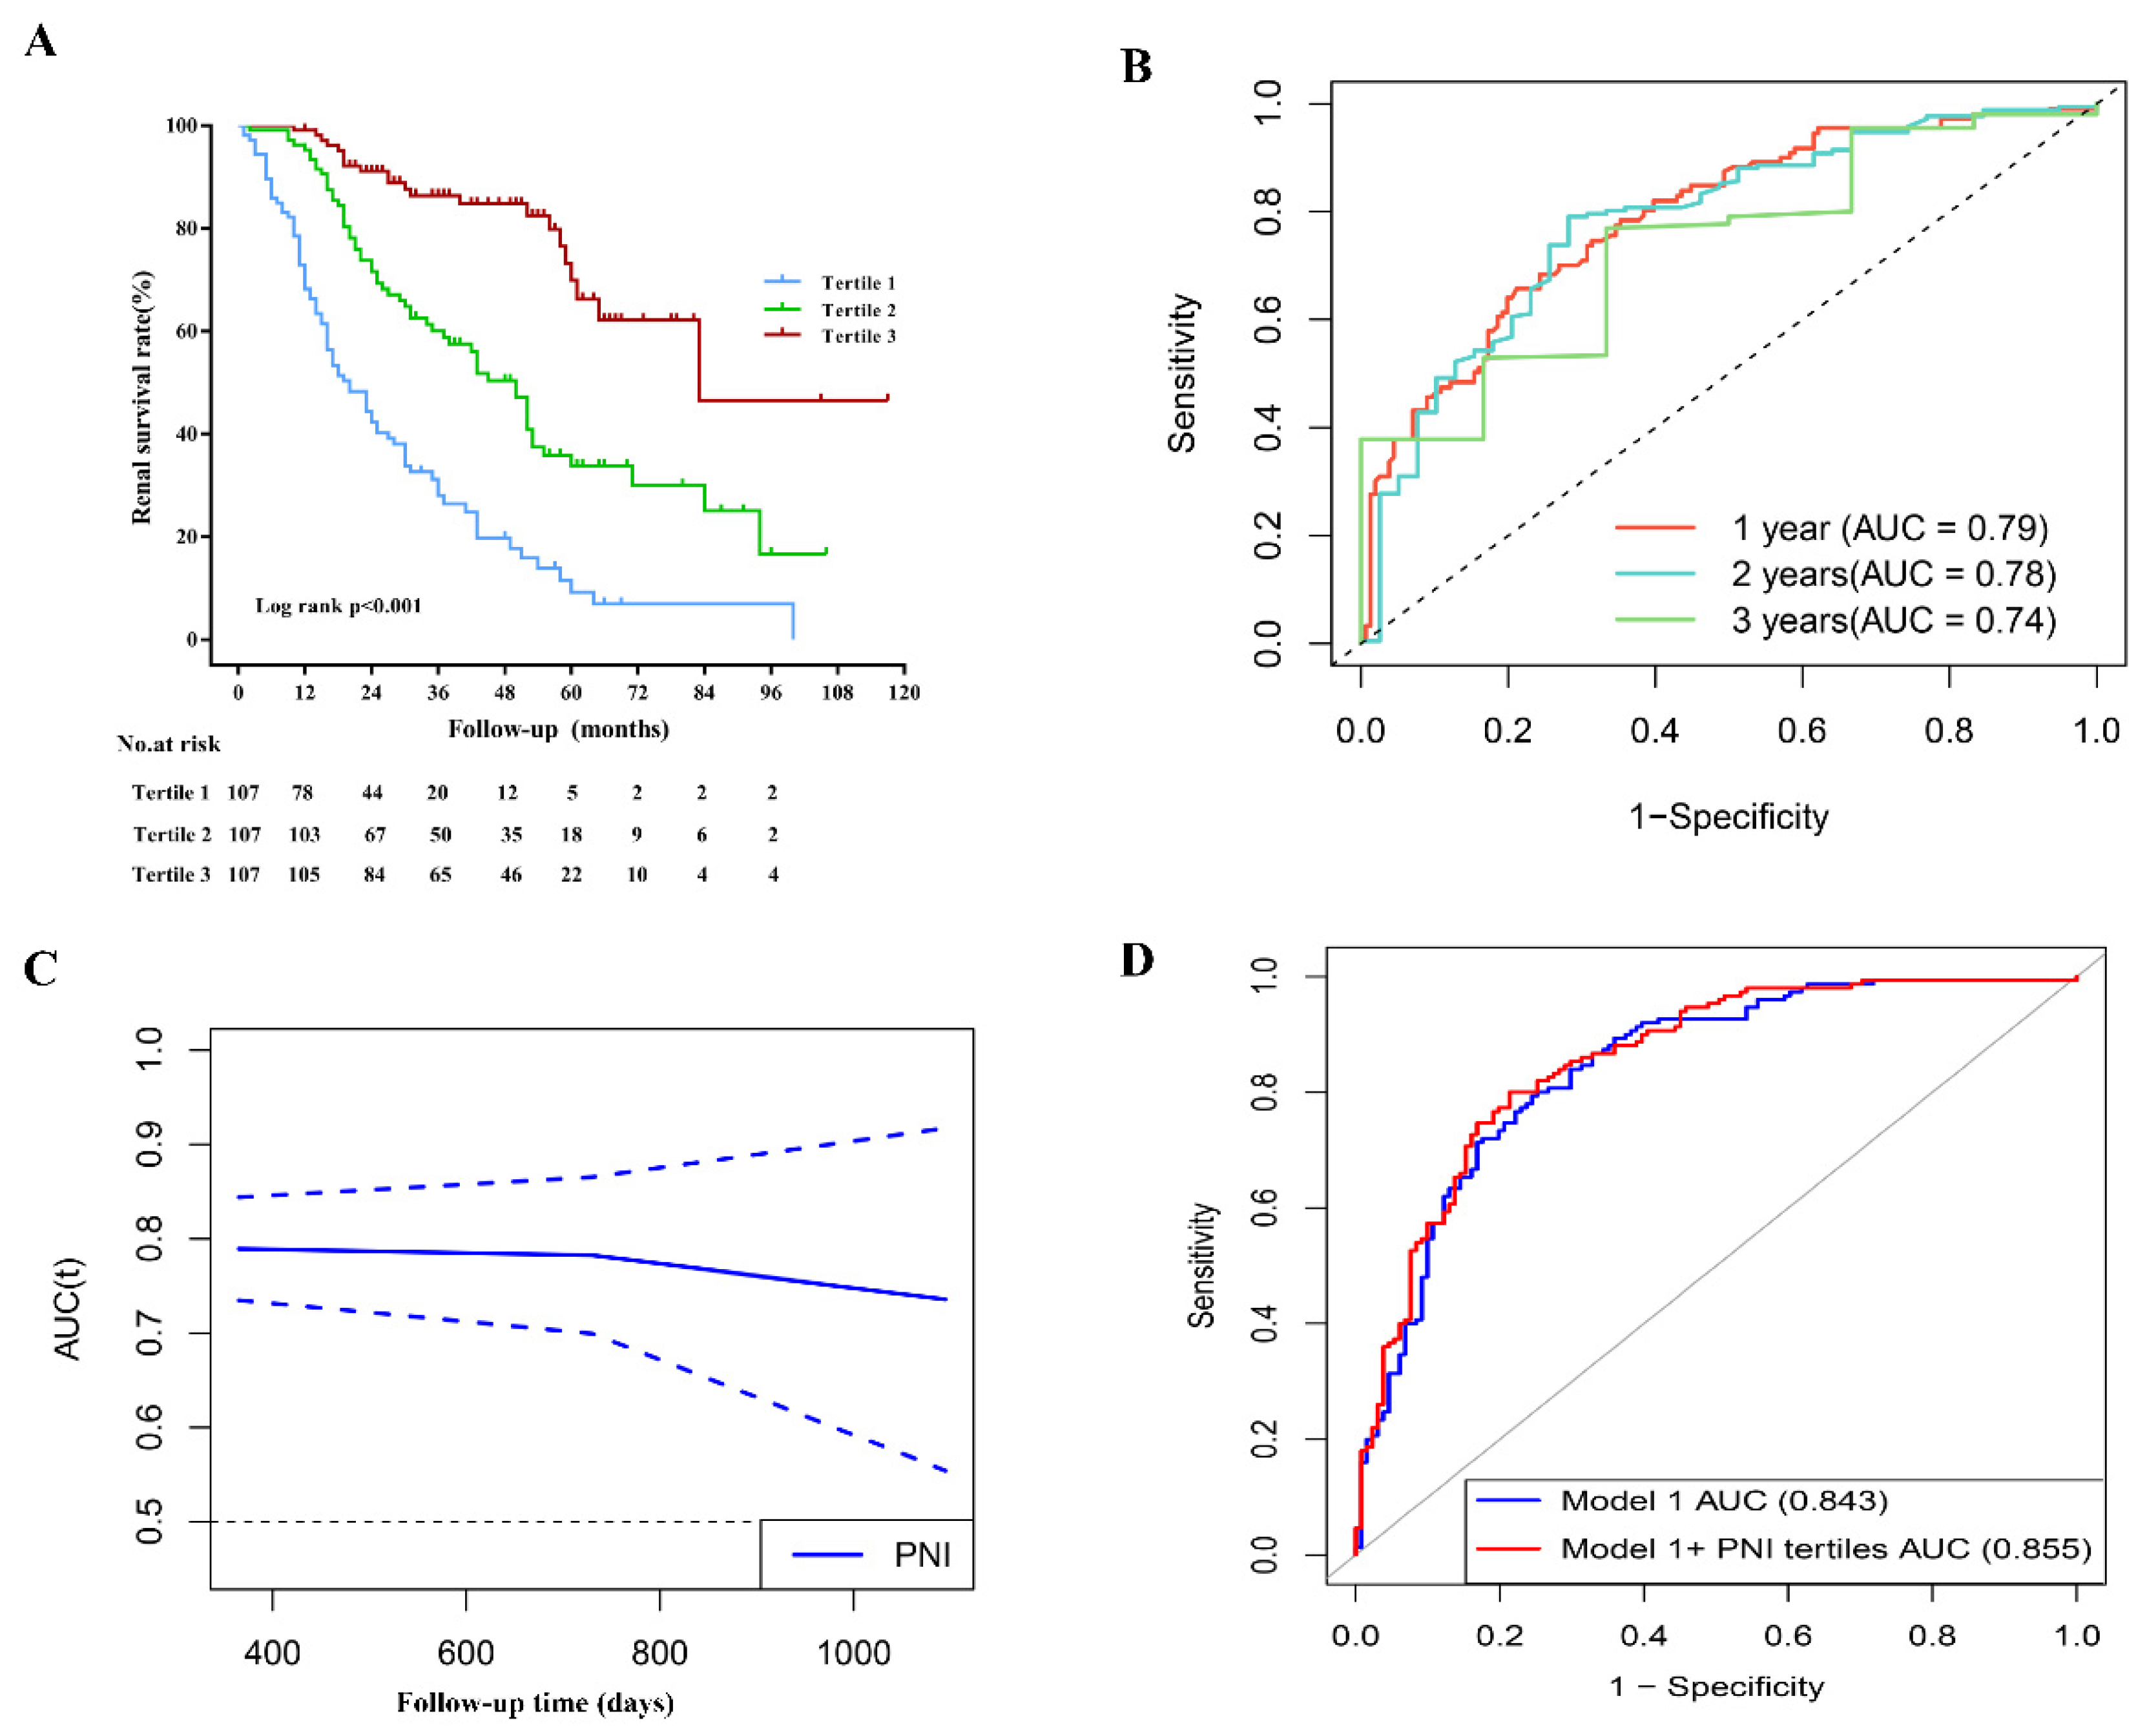
3.4. PNI and ESRD in Patients with DN
3.5. PNI and the Prediction of Incident ESRD
4. Discussion
Supplementary Materials
Author Contributions
Funding
Institutional Review Board Statement
Informed Consent Statement
Data Availability Statement
Conflicts of Interest
References
- Alicic, R.Z.; Rooney, M.T.; Tuttle, K.R. Diabetic Kidney Disease: Challenges, Progress, and Possibilities. Clin. J. Am. Soc. Nephrol. 2017, 12, 2032–2045. [Google Scholar] [CrossRef] [PubMed]
- Ruiz-Ortega, M.; Rodrigues-Diez, R.R.; Lavoz, C.; Rayego-Mateos, S. Special Issue “Diabetic Nephropathy: Diagnosis, Prevention and Treatment”. J. Clin. Med. 2020, 9, 813. [Google Scholar] [CrossRef] [PubMed]
- Diabetes around the World in 2021. The IDF Diabetes Atlas 10th Edition [Internet] ed: International Diabetes Federation. Available online: https://diabetesatlas.org/ (accessed on 13 November 2021).
- Li, Y.; Teng, D.; Shi, X.; Qin, G.; Qin, Y.; Quan, H.; Shi, B.; Sun, H.; Ba, J.; Chen, B.; et al. Prevalence of diabetes recorded in mainland China using 2018 diagnostic criteria from the American Diabetes Association: National cross sectional study. BMJ 2020, 369, m997. [Google Scholar] [CrossRef] [PubMed]
- Zhang, L.; Long, J.; Jiang, W.; Shi, Y.; He, X.; Zhou, Z.; Li, Y.; Yeung, R.O.; Wang, J.; Matsushita, K.; et al. Trends in Chronic Kidney Disease in China. N. Engl. J. Med. 2016, 375, 905–906. [Google Scholar] [CrossRef]
- Gaede, P.; Lund-Andersen, H.; Parving, H.H.; Pedersen, O. Effect of a multifactorial intervention on mortality in type 2 diabetes. N. Engl. J. Med. 2008, 358, 580–591. [Google Scholar] [CrossRef]
- Block, T.J.; Batu, D.; Cooper, M.E. Recent advances in the pharmacotherapeutic management of diabetic kidney disease. Expert Opin. Pharmacother. 2022, 23, 791–803. [Google Scholar] [CrossRef]
- Kitada, M.; Ogura, Y.; Monno, I.; Koya, D. A low-protein diet for diabetic kidney disease: Its effect and molecular mechanism, an approach from animal studies. Nutrients 2018, 10, 544. [Google Scholar] [CrossRef]
- Tauchi, E.; Hanai, K.; Babazono, T. Effects of dietary protein intake on renal outcome and mortality in patients with advanced diabetic nephropathy. Clin. Exp. Nephrol. 2020, 24, 119–125. [Google Scholar] [CrossRef]
- Hickey, F.B.; Martin, F. Diabetic kidney disease and immune modulation. Curr. Opin. Pharmacol. 2013, 13, 602–612. [Google Scholar] [CrossRef]
- Flyvbjerg, A. The role of the complement system in diabetic nephropathy. Nat. Rev. Nephrol. 2017, 13, 311–318. [Google Scholar] [CrossRef]
- Onodera, T.; Goseki, N.; Kosaki, G. Prognostic nutritional index in gastrointestinal surgery of malnourished cancer patients. Nihon Geka Gakkai Zasshi 1984, 85, 1001–1005. [Google Scholar]
- Zencirkiran Agus, H.; Kahraman, S. Prognostic nutritional index predicts one-year outcome in heart failure with preserved ejection fraction. Acta Cardiol. 2020, 75, 450–455. [Google Scholar] [CrossRef]
- Wei, W.; Wu, X.; Jin, C.; Mu, T.; Gu, G.; Min, M.; Mu, S.; Han, Y. Predictive Significance of the Prognostic Nutritional Index (PNI) in Patients with Severe COVID-19. J. Immunol. Res. 2021, 2021, 9917302. [Google Scholar] [CrossRef]
- Barutcu Atas, D.; Tugcu, M.; Asicioglu, E.; Velioglu, A.; Arikan, H.; Koc, M.; Tuglular, S. Prognostic nutritional index is a predictor of mortality in elderly patients with chronic kidney disease. Int. Urol. Nephrol. 2022, 54, 1155–1162. [Google Scholar] [CrossRef]
- American Diabetes Association. 2. Classification and Diagnosis of Diabetes: Standards of Medical Care in Diabetes-2018. Diabetes Care 2018, 41, S13–S27. [Google Scholar] [CrossRef]
- Tervaert, T.W.; Mooyaart, A.L.; Amann, K.; Cohen, A.H.; Cook, H.T.; Drachenberg, C.B.; Ferrario, F.; Fogo, A.B.; Haas, M.; de Heer, E.; et al. Pathologic classification of diabetic nephropathy. J. Am. Soc. Nephrol. 2010, 21, 556–563. [Google Scholar] [CrossRef]
- Levey, A.S.; Stevens, L.A.; Schmid, C.H.; Zhang, Y.L.; Castro, A.F., 3rd; Feldman, H.I.; Kusek, J.W.; Eggers, P.; Van Lente, F.; Greene, T.; et al. A new equation to estimate glomerular filtration rate. Ann. Intern. Med. 2009, 150, 604–612. [Google Scholar] [CrossRef] [PubMed]
- Pencina, M.J.; D’Agostino, R.B., Sr.; D’Agostino, R.B., Jr.; Vasan, R.S. Evaluating the added predictive ability of a new marker: From area under the ROC curve to reclassification and beyond. Stat. Med. 2008, 27, 157–172; discussion 207–112. [Google Scholar] [CrossRef]
- Zhang, J.; Zhang, R.; Wang, Y.; Li, H.; Han, Q.; Wu, Y.; Wang, T.; Liu, F. The Level of Serum Albumin Is Associated with Renal Prognosis in Patients with Diabetic Nephropathy. J. Diabetes Res. 2019, 2019, 7825804. [Google Scholar] [CrossRef]
- Zhao, L.; Han, Q.; Zhou, L.; Bai, L.; Wang, Y.; Wu, Y.; Ren, H.; Zou, Y.; Li, S.; Su, Q.; et al. Addition of glomerular lesion severity improves the value of anemia status for the prediction of renal outcomes in Chinese patients with type 2 diabetes. Ren. Fail. 2022, 44, 346–357. [Google Scholar] [CrossRef]
- Zha, Y.; Qian, Q. Protein Nutrition and Malnutrition in CKD and ESRD. Nutrients 2017, 9, 208. [Google Scholar] [CrossRef] [PubMed]
- Vlagopoulos, P.T.; Tighiouart, H.; Weiner, D.E.; Griffith, J.; Pettitt, D.; Salem, D.N.; Levey, A.S.; Sarnak, M.J. Anemia as a Risk Factor for Cardiovascular Disease and All-Cause Mortality in Diabetes: The Impact of Chronic Kidney Disease. J. Am. Soc. Nephrol. 2005, 16, 3403. [Google Scholar] [CrossRef]
- Hu, Y.; Cao, Q.; Wang, H.; Yang, Y.; Xiong, Y.; Li, X.; Zhou, Q. Prognostic nutritional index predicts acute kidney injury and mortality of patients in the coronary care unit. Exp. Ther. Med. 2021, 21, 123. [Google Scholar] [CrossRef] [PubMed]
- Shang, S.; Huang, Y.; Zhan, X.; Peng, F.; Wang, X.; Wen, Y.; Feng, X.; Zhou, Q.; Tang, L.W.; Long, H.; et al. The relationship between the prognostic nutritional index and new-onset pneumonia in peritoneal dialysis patients. Int. Urol. Nephrol. 2022, 1–8. [Google Scholar] [CrossRef]
- Dong, X.; Wang, B.; Chen, S.; Liu, J.; Xia, Y.; Wang, S.; Li, B.; Wang, S.; Ying, M.; Li, H.; et al. Association between Prognostic Nutritional Index and Contrast-Associated Acute Kidney Injury in Patients Complicated with Chronic Kidney Disease and Coronary Artery Disease. J. Interv. Cardiol. 2021, 2021, 2274430. [Google Scholar] [CrossRef]
- Zhang, H.; Tao, Y.; Wang, Z.; Lu, J. Evaluation of nutritional status and prognostic impact assessed by the prognostic nutritional index in children with chronic kidney disease. Medicine 2019, 98, e16713. [Google Scholar] [CrossRef]
- Moore, L.W.; Byham-Gray, L.D.; Scott Parrott, J.; Rigassio-Radler, D.; Mandayam, S.; Jones, S.L.; Mitch, W.E.; Osama Gaber, A. The mean dietary protein intake at different stages of chronic kidney disease is higher than current guidelines. Kidney Int. 2013, 83, 724–732. [Google Scholar] [CrossRef]
- Draznin, B.; Aroda, V.R.; Bakris, G.; Benson, G.; Brown, F.M.; Freeman, R.; Green, J.; Huang, E.; Isaacs, D.; Kahan, S.; et al. 11. Chronic Kidney Disease and Risk Management: Standards of Medical Care in Diabetes-2022. Diabetes Care 2022, 45, S175–S184. [Google Scholar] [CrossRef]
- Ikizler, T.A.; Burrowes, J.D.; Byham-Gray, L.D.; Campbell, K.L.; Carrero, J.J.; Chan, W.; Fouque, D.; Friedman, A.N.; Ghaddar, S.; Goldstein-Fuchs, D.J.; et al. KDOQI Clinical Practice Guideline for Nutrition in CKD: 2020 Update. Am. J. Kidney Dis. Off. J. Natl. Kidney Found. 2020, 76, S1–S107. [Google Scholar] [CrossRef]
- Oosterwijk, M.M.; Groothof, D.; Navis, G.; Bakker, S.J.L.; Laverman, G.D. High-Normal Protein Intake Is Not Associated with Faster Renal Function Deterioration in Patients with Type 2 Diabetes: A Prospective Analysis in the DIALECT Cohort. Diabetes Care 2022, 45, 35–41. [Google Scholar] [CrossRef]
- Drechsler, M.; Döring, Y.; Megens, R.T.; Soehnlein, O. Neutrophilic granulocytes—Promiscuous accelerators of atherosclerosis. Thromb. Haemost. 2011, 106, 839–848. [Google Scholar] [CrossRef]
- Zernecke, A.; Bot, I.; Djalali-Talab, Y.; Shagdarsuren, E.; Bidzhekov, K.; Meiler, S.; Krohn, R.; Schober, A.; Sperandio, M.; Soehnlein, O.; et al. Protective role of CXC receptor 4/CXC ligand 12 unveils the importance of neutrophils in atherosclerosis. Circ. Res. 2008, 102, 209–217. [Google Scholar] [CrossRef]
- Cardoso, C.R.L.; Leite, N.C.; Salles, G.F. Importance of hematological parameters for micro- and macrovascular outcomes in patients with type 2 diabetes: The Rio de Janeiro type 2 diabetes cohort study. Cardiovasc. Diabetol. 2021, 20, 133. [Google Scholar] [CrossRef]
- Zhang, J.; Zhang, R.; Wang, Y.; Wu, Y.; Li, H.; Han, Q.; Guo, R.; Wang, T.; Wang, J.; Grung, P.; et al. Effects of neutrophil-lymphocyte ratio on renal function and histologic lesions in patients with diabetic nephropathy. Nephrology 2019, 24, 1115–1121. [Google Scholar] [CrossRef]
- Liu, J.; Liu, X.; Li, Y.; Quan, J.; Wei, S.; An, S.; Yang, R.; Liu, J. The association of neutrophil to lymphocyte ratio, mean platelet volume, and platelet distribution width with diabetic retinopathy and nephropathy: A meta-analysis. Biosci. Rep. 2018, 38, BSR20180172. [Google Scholar] [CrossRef]
- Vaduganathan, M.; Ambrosy, A.P.; Greene, S.J.; Mentz, R.J.; Subacius, H.P.; Maggioni, A.P.; Swedberg, K.; Nodari, S.; Zannad, F.; Konstam, M.A.; et al. Predictive value of low relative lymphocyte count in patients hospitalized for heart failure with reduced ejection fraction: Insights from the EVEREST trial. Circ. Heart Fail. 2012, 5, 750–758. [Google Scholar] [CrossRef]
- Berry, C.; Norrie, J.; Hogg, K.; Brett, M.; Stevenson, K.; McMurray, J.J. The prevalence, nature, and importance of hematologic abnormalities in heart failure. Am. Heart J. 2006, 151, 1313–1321. [Google Scholar] [CrossRef] [PubMed]


| Valuable | All (n = 321) | Tertile 1 (n = 107) <38.78 | Tertile 2 (n = 107) 38.78–47.12 | Tertile 3 (n = 107) ≥47.12 | p Value |
|---|---|---|---|---|---|
| PNI | 43.4 (36.53–49.78) | 34.05 (30.55–36.55) | 43.4 (41.3–45.35) | 52.7 (49.75–55.5) | <0.001 |
| Age (years) | 51.64 ± 8.83 | 51.83 ± 9.08 | 51.92 ± 7.92 | 51.18 ± 9.48 | 0.8 |
| Gender (male, %) | 227 (70.7) | 74 (69.2) | 74 (69.2) | 79 (73.8) | 0.687 |
| DM duration (months) | 96 (36–132) | 96 (55–156) | 120 (36–168) | 96 (45–132) | 0.474 |
| Early onset of T2DM (%) | 117 (36.4) | 44 (41.1) | 39 (36.4) | 34 (31.8) | 0.365 |
| Smoking (%) | 168 (52.5) | 57 (53.3) | 50 (47.2) | 61 (57) | 0.349 |
| Body mass index (kg/m2) | 25.65 (23.13–27.61) | 24.61 (22.3–28.34) | 25.781 (23.14–28.04) | 25.93 (24.24–27.68) | 0.372 |
| MAP (mmHg) | 105.59 ± 15.07 | 108.18 ± 15.4 | 105.00 ± 15.29 | 103.57 ± 14.26 | 0.072 |
| Hypertension (%) | 278 (86.6) | 99 (92.5) | 95 (88.8) | 84 (78.5) | 0.008 |
| Initial proteinuria (g/day) | 3.81 (1.79–7.09) | 8.64 (4.35–10.5) | 3.68 (2.58–6.82) | 1.20 (0.54–2.58) | <0.001 |
| e-GFR (ml/min/1.73 m2) | 57.72 (41–86.02) | 45.63 (35.80–67.3) | 59.79 (43.8–78.67) | 73.44 (46.11–99.55) | <0.001 |
| Serum creatinine (μmol/L) | 115 (80–154.5) | 145 (106–167.5) | 113 (87–137.6) | 89 (73–140) | <0.001 |
| BUN (mmol/L) | 7.6 (5.9–10.13) | 7.9 (6.83–13.29) | 7.6 (5.9–9.9) | 6.8 (5.18–8.98) | <0.001 |
| Uric acid (μmol/L) | 388.14 ± 79.98 | 372.23 ± 74.24 | 383.08 ± 78.70 | 409.1 ± 82.95 | 0.002 |
| FBS (mmol/L) | 7.15 (5.58–9.64) | 8.13 (6.52–11.34) | 7.37 (5.15–9.43) | 6.98 (6.01–8.82) | 0.18 |
| HbA1c (%) | 7.65 ± 1.87 | 7.7 ± 2.15 | 7.62 ± 1.82 | 7.65 ± 1.64 | 0.959 |
| Triglyceride (mmol/L) | 1.73 (1.27–2.33) | 1.53 (1.22–2.18) | 1.81 (1.31–2.31) | 1.81 (1.25–2.66) | 0.474 |
| Total cholesterol (mmol/L) | 4.95 (4.19–5.89) | 5.26 (4.62–6.56) | 5.13 (4.49–6.16) | 4.16 (3.47–5.15) | <0.001 |
| LDL-C (mmol/L) | 2.83 (2.17–3.64) | 2.95 (2.58–3.76) | 3.03 (2.47–3.59) | 2.21 (1.64–3.03) | <0.001 |
| HDL-C (mmol/L) | 1.21 (1.01–1.54) | 1.35 (1.11–1.72) | 1.15 (0.93–1.44) | 1.14 (0.96–1.32) | <0.001 |
| Anemia (%) | 200 (62.3) | 93 (86.9) | 74 (69.2) | 33 (30.8) | <0.001 |
| Albumin (g/L) | 35.2 (28.5–40.75) | 28.2 (26.1–29.9) | 35.4 (33.9–37.4) | 42.9 (40.55–45.7) | <0.001 |
| Hypoalbuminemia (%) | 156 (48.6) | 107 (100%) | 47 (43.9) | 2 (1.9) | <0.001 |
| White blood cell (109/L) | 6.56 ± 1.67 | 6.35 ± 1.78 | 6.32 ± 1.62 | 7.01 ± 1.51 | 0.003 |
| Lymphocyte (109/L) | 1.61 (1.3–2.03) | 1.39 (1.17–1.74) | 1.57 (1.29–1.94) | 1.88 (1.54–2.28) | <0.001 |
| RASI use (%) | 223 (69.47) | 83 (77.57) | 82 (76.64) | 58 (54.21) | <0.001 |
| Insulin use (%) | 256 (79.75) | 84 (78.5) | 87 (81.31) | 85 (79.44) | 0.874 |
| Progressed to ESRD (%) | 164 (51.09) | 84 (78.5) | 58 (54.21) | 22 (20.56) | <0.001 |
| Pathological Lesions | All | Tertile 1 | Tertile 2 | Tertile 3 | p # | r * | p * |
|---|---|---|---|---|---|---|---|
| Glomerular class | <0.001 | −0.412 | <0.001 | ||||
| I | 16 (5) | 0 (0) | 1 (0.9) | 15 (14) | |||
| II a | 68 (21.2) | 8 (7.5) | 20 (18.7) | 40 (37.4) | |||
| II b | 42 (13.1) | 12 (11.2) | 13 (12.1) | 17 (15.9) | |||
| III | 155 (48.3) | 74 (69.2) | 55 (51.4) | 26 (24.3) | |||
| IV | 40 (12.5) | 13 (12.1) | 18 (16.8) | 9 (8.4) | |||
| IFTA | <0.001 | −0.282 | <0.001 | ||||
| 0 | 9 (2.8) | 1 (0.9) | 1 (0.9) | 7 (6.5) | |||
| 1 | 148 (46.1) | 38 (35.5) | 44 (41.1) | 66 (61.7) | |||
| 2 | 134 (41.7) | 53 (49.5) | 51 (47.7) | 30 (28) | |||
| 3 | 30 (9.3) | 15 (14) | 11 (10.3) | 4 (3.7) | |||
| Interstitial inflammation | <0.001 | −0.271 | <0.001 | ||||
| 0 | 19 (5.9) | 1 (0.9) | 3 (2.8) | 15 (14) | |||
| 1 | 234 (72.9) | 74 (69.2) | 80 (74.8) | 80 (74.8) | |||
| 2 | 68 (21.2) | 32 (29.9) | 24 (22.4) | 12 (11.2) | |||
| Arteriolar hyalinosis | 0.03 | −0.156 | 0.005 | ||||
| 0 | 32 (10) | 7 (6.5) | 7 (6.5) | 18 (16.8) | |||
| 1 | 176 (54.8) | 57 (53.3) | 59 (55.1) | 60 (56.1) | |||
| 2 | 113 (35.2) | 43 (40.2) | 41 (38.3) | 29 (27.1) | |||
| Per-SD Increment of PNI | PNI Tertiles | ||||
|---|---|---|---|---|---|
| HR (95% CI) | p Value | HR (95% CI) | p Value | HR (95% CI) | |
| Univariate | 0.445 (0.38–0.522) | <0.001 | 0.368 (0.296–0.456) | <0.001 | 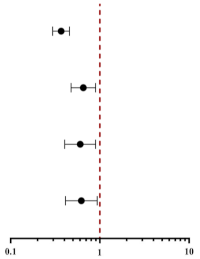 |
| Model 1 | 0.694 (0.516–0.934) | 0.016 | 0.642 (0.430–0.959) | 0.030 | |
| Model 2 | 0.702 (0.520–0.946) | 0.020 | 0.645 (0.432–0.964) | 0.033 | |
| Model 3 | 0.705 (0.523–0.952) | 0.023 | 0.649 (0.434–0.971) | 0.036 | |
| Variables | Model 1 | Model 1 + PNI Tertiles | p Value a |
|---|---|---|---|
| AUC | 0.843 (95% CI, 0.797–0.890) | 0.855 (95% CI, 0.811–0.900) | 0.10 b |
| IDI | - | 0.621 (95% CI, 0.390–0.844) | 0.011 |
| NRI | - | 0.023 (95% CI, 0.005–0.040) | <0.001 |
Publisher’s Note: MDPI stays neutral with regard to jurisdictional claims in published maps and institutional affiliations. |
© 2022 by the authors. Licensee MDPI, Basel, Switzerland. This article is an open access article distributed under the terms and conditions of the Creative Commons Attribution (CC BY) license (https://creativecommons.org/licenses/by/4.0/).
Share and Cite
Zhang, J.; Xiao, X.; Wu, Y.; Yang, J.; Zou, Y.; Zhao, Y.; Yang, Q.; Liu, F. Prognostic Nutritional Index as a Predictor of Diabetic Nephropathy Progression. Nutrients 2022, 14, 3634. https://doi.org/10.3390/nu14173634
Zhang J, Xiao X, Wu Y, Yang J, Zou Y, Zhao Y, Yang Q, Liu F. Prognostic Nutritional Index as a Predictor of Diabetic Nephropathy Progression. Nutrients. 2022; 14(17):3634. https://doi.org/10.3390/nu14173634
Chicago/Turabian StyleZhang, Junlin, Xiang Xiao, Yucheng Wu, Jia Yang, Yutong Zou, Yuancheng Zhao, Qing Yang, and Fang Liu. 2022. "Prognostic Nutritional Index as a Predictor of Diabetic Nephropathy Progression" Nutrients 14, no. 17: 3634. https://doi.org/10.3390/nu14173634
APA StyleZhang, J., Xiao, X., Wu, Y., Yang, J., Zou, Y., Zhao, Y., Yang, Q., & Liu, F. (2022). Prognostic Nutritional Index as a Predictor of Diabetic Nephropathy Progression. Nutrients, 14(17), 3634. https://doi.org/10.3390/nu14173634