
Development of an Assay for Soy Isoflavones in Women’s Hair

 , ,
, , 
Abstract
1. Introduction
2. Materials and Methods
2.1. Materials
2.1.1. Direct Extraction Tests
2.1.2. Digestion Tests
2.1.3. Digestion and Extraction of the Conjugated Isoflavones
2.1.4. ELISA Measurements
2.1.5. Control Solutions for Digestion Tests
2.2. Methods
2.2.1. Dietary Inquiry
- The dietary specificity, such as vegetarian, Asian, or gluten-free diets;
- The eater’s status, i.e., as big, medium, or small;
- The snacking practice;
- The main cooking practices;
- The intake frequency of soy-based foodstuffs but also of food that contain “hidden-soy”.
2.2.2. Isoflavones Food and Hair Scores
2.2.3. Sample Preparation
2.2.4. ELISA Measurements in Hair
2.2.5. Statistical Treatments
3. Results
3.1. Tests of the Extraction Methods for Isoflavones from Hair Samples
3.1.1. Tests on Pure Control Substances
3.1.2. Test on Hair Samples
3.2. Characterization of the Isoflavones Assay in Hair
3.2.1. Sensitivity
3.2.2. Specificity
3.2.3. Repeatability and Reproducibility
3.3. Correlation with the Dietary Data
3.4. Detection of Equol
4. Discussion
4.1. Reliability of Isoflavones Assessment in Hair Compared to Other Biological Samples
4.1.1. Comparison with Urine Samples
4.1.2. Comparison with Plasma or Serum Samples
4.1.3. The Importance of the Food Intake Estimation
4.2. Positive Innovative Elements Brought in This Work
4.2.1. The Assay
4.2.2. The Food Survey
4.3. Challenges of the Present Analytical Method
4.3.1. Digestion Procedure
4.3.2. Limit Linked to the Assay Procedure
4.3.3. Limit Linked to the Dietary Inquiry
5. Conclusions
Supplementary Materials
Author Contributions
Funding
Institutional Review Board Statement
Informed Consent Statement
Data Availability Statement
Acknowledgments
Conflicts of Interest
References
- Lee, G.A.; Crawford, G.W.; Liu, L.; Sasaki, Y.; Chen, X. Archaeological Soybean (Glycine Max) in East Asia: Does Size Matter? PLoS ONE 2011, 6, e26720. [Google Scholar] [CrossRef]
- Bennetau-Pelissero, C. Plant Proteins from Legumes. In Bioactive Molecules in Food. Reference Series in Phytochemistry; Mérillon, J.M., Ramawat, K., Eds.; Springer: Cham, Switzerland, 2019; pp. 223–265. [Google Scholar]
- Bennetts, H.W.; Uuderwood, E.J.; Shier, F.L. A Specific Breeding Problem of Sheep on Subterranean Clover Pastures in Western Australia. Aust. Vet. J. 1946, 22, 2–12. [Google Scholar] [CrossRef]
- Stott, P.; Harris, S.; Wight, N. Fertility and Infertility in the European Hare in Australia. In Lagomorph Biology; Alves, P.C., Ferrand, N., Hackländer, K., Eds.; Springer: Berlin/Heidelberg, Germany, 2008; pp. 225–240. [Google Scholar]
- Chadha, R.; Bhalla, Y.; Jain, A.; Chadha, K.; Karan, M. Dietary Soy Isoflavone: A Mechanistic Insight. Nat. Prod. Commun. 2017, 12, 627–634. [Google Scholar] [CrossRef]
- Mikulić, M.; Krstonošić, M.; Sazdanić, D.; Cvejic, J. Health Perspectives on Soy Isoflavones. In Phytochemicals in Soybeans; CRC Press: Boca Raton, FL, USA, 2022. [Google Scholar]
- Fernandez-Lopez, A.; Lamothe, V.; Delample, M.; Denayrolles, M.; Bennetau-Pelissero, C. Removing Isoflavones from Modern Soyfood: Why and How? Food Chem. 2016, 210, 286–294. [Google Scholar] [CrossRef] [PubMed]
- Ismanto, A.; Hadibarata, T.; Kristanti, R.A.; Maslukah, L.; Safinatunnajah, N.; Kusumastuti, W. Endocrine Disrupting Chemicals (EDCs) in Environmental Matrices: Occurrence, Fate, Health Impact, Physio-Chemical and Bioremediation Technology. Environ. Pollut. 2022, 302, 119061. [Google Scholar] [CrossRef]
- Nusbaum, J.S.; Mirza, I.; Shum, J.; Freilich, R.W.; Cohen, R.E.; Pillinger, M.H.; Izmirly, P.M.; Buyon, J.P. Sex Differences in Systemic Lupus Erythematosus: Epidemiology, Clinical Considerations, and Disease Pathogenesis. Mayo Clin. Proc. 2020, 95, 384–394. [Google Scholar] [CrossRef] [PubMed]
- Barbhaiya, M.; Costenbader, K.H. Environmental Exposures and the Development of Systemic Lupus Erythematosus. Curr. Opin. Rheumatol. 2016, 28, 497–505. [Google Scholar] [CrossRef]
- Jang, H.H.; Lee, Y.M.; Choe, J.S.; Kwon, O. Validation of Soy Isoflavone Intake and Its Health Effects: A Review of the Development of Exposure Biomarkers. Nutr. Res. Pract. 2021, 15, 1–11. [Google Scholar] [CrossRef] [PubMed]
- Avino, P.; Lammardo, M.; Petrucci, A.; Rosada, A. Weekly and Longitudinal Element Variability in Hair Samples of Subjects Non-Occupationally Exposed. Appl. Sci. 2021, 11, 1236. [Google Scholar] [CrossRef]
- Le Houérou, C.; Bennetau-Pelissero, C.; Lamothe, V.; Le Menn, F.; Babin, P.; Bennetau, B. Syntheses of Novel Hapten-Protein Conjugates for Production of Highly Specific Antibodies to Formononetin, Daidzein and Genistein. Tetrahedron 2000, 56, 295–301. [Google Scholar] [CrossRef]
- Bennetau-Pelissero, C.; Le Houérou, C.; Lamothe, V.; Le Menn, F.; Babin, P.; Bennetau, B. Synthesis of Haptens and Conjugates for ELISAs of Phytoestrogens. Development of the Immunological Tests. J. Agric. Food Chem. 2000, 48, 305–311. [Google Scholar] [CrossRef] [PubMed]
- Shinkaruk, S.; Durand, M.; Lamothe, V.; Carpaye, A.; Martinet, A.; Chantre, P.; Vergne, S.; Nogues, X.; Moore, N.; Bennetau-Pelissero, C. Bioavailability of Glycitein Relatively to Other Soy Isoflavones in Healthy Young Caucasian Men. Food Chem. 2012, 135, 1104–1111. [Google Scholar] [CrossRef] [PubMed]
- Lee, A.; Beaubernard, L.; Lamothe, V.; Bennetau-Pelissero, C. New Evaluation of Isoflavone Exposure in the French Population. Nutrients 2019, 11, 2308. [Google Scholar] [CrossRef] [PubMed]
- Lee, A.; Bensaada, S.; Lamothe, V.; Lacoste, M.; Bennetau-Pelissero, C. Endocrine Disruptors on and in Fruits and Vegetables: Estimation of the Potential Exposure of the French Population. Food Chem. 2022, 373, 131513. [Google Scholar] [CrossRef]
- Vergne, S.; Titier, K.; Bernard, V.; Asselineau, J.; Durand, M.; Lamothe, V.; Potier, M.; Perez, P.; Demotes-Mainard, J.; Chantre, P.; et al. Bioavailability and Urinary Excretion of Isoflavones in Humans: Effects of Soy-Based Supplements Formulation and Equol Production. J. Pharm. Biomed. Anal. 2007, 43, 1488–1494. [Google Scholar] [CrossRef]
- Gaillard, Y.; Vayssette, F.; Pépin, G. Compared Interest between Hair Analysis and Urinalysis in Doping Controls: Results for Amphetamines, Corticosteroids and Anabolic Steroids in Racing Cyclists. Forensic Sci. Int. 2000, 107, 361–379. [Google Scholar] [CrossRef]
- Offidani, C.; Strano Rossi, S.; Chiarotti, M. Improved Enzymatic Hydrolysis of Hair. Forensic Sci. Int. 1993, 63, 171–174. [Google Scholar] [CrossRef]
- Gupta, S.; Singh, R. Hydrolyzing Proficiency of Keratinases in Feather Degradation. Indian J. Microbiol. 2014, 54, 466–470. [Google Scholar] [CrossRef]
- Balagova, L.; Jezova, D. Importance of Methodological Details in the Measurement of Cortisol in Human Hair. Endocr. Regul. 2018, 52, 134–138. [Google Scholar] [CrossRef]
- Gao, W.; Kirschbaum, C.; Grass, J.; Stalder, T. LC–MS Based Analysis of Endogenous Steroid Hormones in Human Hair. J. Steroid Biochem. Mol. Biol. 2016, 162, 92–99. [Google Scholar] [CrossRef]
- Balíková, M.A.; Habrdová, V. Hair Analysis for Opiates: Evaluation of Washing and Incubation Procedures. J. Chromatogr. B Anal. Technol. Biomed. Life Sci. 2003, 789, 93–100. [Google Scholar] [CrossRef]
- Grace, P.B.; Taylor, J.I.; Low, Y.-L.; Luben, R.N.; Mulligan, A.A.; Botting, N.P.; Dowsett, M.; Welch, A.A.; Khaw, K.-T.; Wareham, N.J.; et al. Phytoestrogen Concentrations in Serum and Spot Urine as Biomarkers for Dietary Phytoestrogen Intake and Their Relation to Breast Cancer Risk in European Prospective Investigation of Cancer and Nutrition-Norfolk. Cancer Epidemiol. Biomarkers Prev. 2004, 13, 698–708. [Google Scholar] [CrossRef] [PubMed]
- Mathey, J.; Lamothe, V.; Coxam, V.; Potier, M.; Sauvant, P.; Bennetau-Pelissero, C. Concentrations of Isoflavones in Plasma and Urine of Post-Menopausal Women Chronically Ingesting High Quantities of Soy Isoflavones. J. Pharm. Biomed. Anal. 2006, 41, 957–965. [Google Scholar] [CrossRef] [PubMed]
- Verkasalo, P.K.; Appleby, P.N.; Allen, N.E.; Davey, G.; Adlercreutz, H.; Key, T.J. Soya Intake and Plasma Concentrations of Daidzein and Genistein: Validity of Dietary Assessment among Eighty British Women (Oxford Arm of the European Prospective Investigation into Cancer and Nutrition). Br. J. Nutr. 2001, 86, 415–421. [Google Scholar] [CrossRef]
- Atkinson, C.; Skor, H.E.; Fitzgibbons, E.D.; Scholes, D.; Chen, C.; Wähälä, K.; Schwartz, S.M.; Lampe, J.W. Overnight Urinary Isoflavone Excretion in a Population of Women Living in the United States, and Its Relationship to Isoflavone Intake. Cancer Epidemiol. Biomarkers Prev. 2002, 11, 253–260, Erratum in Cancer Epidemiol. Biomarkers Prev. 2022, 11, 1511. [Google Scholar]
- Frankenfeld, C.L.; Patterson, R.E.; Kalhorn, T.F.; Skor, H.E.; Howald, W.N.; Lampe, J.W. Validation of a Soy Food Frequency Questionnaire with Plasma Concentrations of Isoflavones in US Adults. J. Am. Diet. Assoc. 2002, 102, 1407–1413. [Google Scholar] [CrossRef]
- Heald, C.L.; Bolton-Smith, C.; Ritchie, M.R.; Morton, M.S.; Alexander, F.E. Phyto-Oestrogen Intake in Scottish Men: Use of Serum to Validate a Self-Administered Food-Frequency Questionnaire in Older Men. Eur. J. Clin. Nutr. 2006, 60, 129–135. [Google Scholar] [CrossRef][Green Version]
- Morimoto, Y.; Beckford, F.; Franke, A.A.; Maskarinec, G. Urinary Isoflavonoid Excretion as a Biomarker of Dietary Soy Intake during Two Randomized Soy Trials. Asia Pac. J. Clin. Nutr. 2014, 23, 205–209. [Google Scholar] [CrossRef]
- Ritchie, M.R.; Morton, M.S.; Deighton, N.; Blake, A.; Cummings, J.H. Plasma and Urinary Phyto-Oestrogens as Biomarkers of Intake: Validation by Duplicate Diet Analysis. Br. J. Nutr. 2004, 91, 447–457. [Google Scholar] [CrossRef]
- Huang, M.H.; Harrison, G.G.; Mohamed, M.M.; Gornbein, J.A.; Henning, S.M.; Go, V.L.W.; Greendale, G.A. Assessing the Accuracy of a Food Frequency Questionnaire for Estimating Usual Intake of Phytoestrogens. Nutr. Cancer 2000, 37, 145–154. [Google Scholar] [CrossRef]
- Kim, J.; Kim, H.J.; Joung, H.; Park, M.K.; Li, S.; Song, Y.; Franke, A.A.; Paik, H.Y. Overnight Urinary Excretion of Isoflavones as an Indicator for Dietary Isoflavone Intake in Korean Girls of Pubertal Age. Br. J. Nutr. 2010, 104, 709–715. [Google Scholar] [CrossRef] [PubMed]
- Chávez-Suárez, K.M.; Ortega-Vélez, M.I.; Valenzuela-Quintanar, A.I.; Galván-Portillo, M.; López-Carrillo, L.; Esparza-Romero, J.; Saucedo-Tamayo, M.S.; Robles-Burgueño, M.R.; Palma-Durán, S.A.; Gutiérrez-Coronado, M.L.; et al. Phytoestrogen Concentrations in Human Urine as Biomarkers for Dietary Phytoestrogen Intake in Mexican Women. Nutrients 2017, 9, 1078. [Google Scholar] [CrossRef] [PubMed]
- Horn-Ross, P.L.; Barnes, S.; Lee, V.S.; Collins, C.N.; Reynolds, P.; Lee, M.M.; Stewart, S.L.; Canchola, A.J.; Wilson, L.; Jones, K. Reliability and Validity of an Assessment of Usual Phytoestrogen Consumption (United States). Cancer Causes Control 2006, 17, 85–93. [Google Scholar] [CrossRef] [PubMed]
- Pragst, F.; Balikova, M.A. State of the Art in Hair Analysis for Detection of Drug and Alcohol Abuse. Clin. Chim. Acta 2006, 370, 17–49. [Google Scholar] [CrossRef]
- Cho, S.H.; Choi, M.H.; Sim, W.Y.; Lee, W.Y.; Chung, B.C. Metabolic Alterations of DHEA and Cholesterol Sulphates in the Hair of Patients with Acne Measured by Liquid Chromatography-Mass Spectrometry. Exp. Dermatol. 2010, 19, 694–696. [Google Scholar] [CrossRef]
- Mielczarek, C.; Pająk, W. Analysis of Acid-Base Properties of Flavonoid Genistein. J. Appl. Spectrosc. 2013, 80, 737–744. [Google Scholar] [CrossRef]
- Soukup, S.T.; Al-Maharik, N.; Botting, N.; Kulling, S.E. Quantification of Soy Isoflavones and Their Conjugative Metabolites in Plasma and Urine: An Automated and Validated UHPLC-MS/MS Method for Use in Large-Scale Studies. Anal. Bioanal. Chem. 2014, 406, 6007–6020. [Google Scholar] [CrossRef]
- Chandrareddy, A.; Muneyyirci-Delale, O.; McFarlane, S.I.; Murad, O.M. Adverse Effects of Phytoestrogens on Reproductive Health: A Report of Three Cases. Complement. Ther. Clin. Pract. 2008, 14, 132–135. [Google Scholar] [CrossRef]
- Imai, H.; Nishikawa, H.; Suzuki, A.; Kodama, E.; Iida, T.; Mikura, K.; Hashizume, M.; Kigawa, Y.; Tadokoro, R.; Sugisawa, C.; et al. Secondary Hypogonadism Due to Excessive Ingestion of Isoflavone in a Man. Intern. Med. 2022. [Google Scholar] [CrossRef]
- Satya-Murti, S.; Lockhart, J. Recognizing and Reducing Cognitive Bias in Clinical and Forensic Neurology. Neurol. Clin. Pract. 2015, 5, 389–396. [Google Scholar] [CrossRef]
- Kumar, V. The Power of Expectations: Undermining the Role of Pygmalion Effect in Mentoring. CHRISMED J. Health Res. 2019, 6, 126–127. [Google Scholar] [CrossRef]


| Digestion Reagent | Solution | Incubation Time | Incubation Temperature |
|---|---|---|---|
| Soda digestion | 2 mL NaOH 1 N | 1 h | 100 °C |
| Acid digestion | 2 mL HCl 0.1 N | 8 h | 40 °C |
| Pronase digestion | 2 mL 1 mg/mL Tris buffer pH 8.25 | 24 h | 40 °C |
| Keratinase digestion | 2 mL 1.8 UI/mL Tris buffer pH 8.25 | 2 h | 40 °C |
| Test Samples | Soda Digestion | Pronase Digestion | Keratinase Digestion | Methanol Extraction | Ethanol Extraction | Acid Digestion |
|---|---|---|---|---|---|---|
| Genistein-7-sulfate | 0.00% ± 0.00% *** | 50.97% ± 0.56% *** | 90.39% ± 3.56% *** | 54.00% ± 15.00% *** | 83.00% ± 8.6% | 98.32% ± 16.26% |
| Genistein-7-β-D-glucuronide | 0.00% ± 0.00% *** | 61.59% ± 7.85% *** | 47.26% ± 6.20% *** | 26.00% ± 3.12% *** | 8.02% ± 7.56% *** | 0.0% ± 0.00% |
| Genistein | 94.00% ± 13.00% *** | 96.00% ± 15.00% | 97.00% ± 12.00% | 56.62% ± 12.12% | ||
| Additional treatment | β-glucuronidase digestion | |||||
| Positive hair sample | 15.82% ± 18.41% *** | 74.06% ± 38.62% | 55.04% ± 59.37% ** | 100% ± 10.09% | ||
| Negative hair sample | 5.86% ± 4.26% *** | 106.0% ± 38.00% | 24.00% ± 54% *** | 100% ± 42.00% | ||
| MinilysTM crushing | ||||||
| Mixture of hair | 0.00% ± 0.00% *** | 56.42% ± 2.63% *** | 64.74% ± 14.07 ** | 41.34% ± 7.26% *** | 18.72% ± 3.08% *** | 100% ± 24.86% |
| References | [19] | [20] | [21] | [22] | [23] | [24] |
| Inter-Assay Variation Coefficients | ||||||
|---|---|---|---|---|---|---|
| Same Extraction | Different Extractions | |||||
| 1st Extraction | 2nd Extraction | Overall | ||||
| GEN | Sample | Sample 28 (n = 6) | Sample 29 (n = 8) | Soy-eater-1 (n = 6) | Soy-eater-2 (n = 6) | Soy-eaters (n = 12) |
| Mean ± SD | 2.25 ± 0.46 | 1.18 ± 0.17 | 3.47 ± 0.35 | 4.88 ± 0.92 | 4.18 ± 0.76 | |
| Variation coefficient | 20.44% | 14.59% | 10.12% | 18.85% | 18.25% | |
| DAI | Sample | Sample 28 (n = 6) | Sample 29 (n = 7) | Soy-eater-1 (n = 6) | Soy-eater-2 (n = 6) | Soy-eaters (n = 12) |
| Mean ± SD | 1.67 ± 0.28 | 2.27 ± 0.35 | 7.86 ± 0.38 | 6.30 ± 1.53 | 7.08 ± 1.29 | |
| Variation coefficient | 16.63% | 15.52% | 4.89% | 24.34% | 18.18% | |
| Subjects | Nature of Samples | Biomarkers | Dietary Data (mg/day) | Correlation | References |
|---|---|---|---|---|---|
| 80 British volunteers | Plasma | GEN | 7 days food diaries | GEN: r = 0.80; p < 0.001 | [27] |
| DAI | DAI: r = 0.78; p < 0.001 | ||||
| 360 women | 2 × overnight urine (48 h apart) | ISO | 2 days 24 h recall DAI (µg): 5.0–6.4 GEN (µg): 7.3–9.3 | ISO: r = 0.52; p = 0.001 FFQ: r = 0.29; p < 0.01 | [28] |
| 77 volunteers | Plasma | GEN | FFQ | GEN: r = 0,53; p < 0.001 | [29] |
| DAI | DIAD: r = 0,45; p < 0.001 | ||||
| 284 volunteers 333 volunteers | Urine Serum | ISO | 7 days food diaries | Urine r = 0.27; p < 0.001 | [25] |
| Serum r = 0.31; p < 0.001 | |||||
| 203 male volunteers | Serum | ISO | FFQ | ISO: r = 0.27; p < 0.001 | [30] |
| 256 premenopausal women | 12 h urine | ISO | FFQ Low: 0.1–2.3 High: 49.8–74.6 | ISO: r = 0.51; p < 0.001 | [31] |
| 14 adults (14% men) | 24 h urine Plasma | ISO | 24 h food record: 11.0 24 h recall: 12.3 | Urine: r = 0.97; p < 0.001 | [32] |
| Plasma: r = 0.92; p < 0.001 | |||||
| 51 Japanese women 18 Caucasian women | 24-h urine | GEN | 48-h dietary recall | GEN: r = 0.54; p < 0.001 DAI: r = 0.58; p < 0.001 | [33] |
| DAI | |||||
| 24 pubertal girls | 12 h urine | ISO | 3 days 24 h recall ISO: 3.0–13.3 | lSO: r = 0.72; p < 0.001 | [34] |
| 100 healthy women | 12 h urine | ISO | 24 h recall | ISO: r = 0.460; p < 0.001 | [35] |
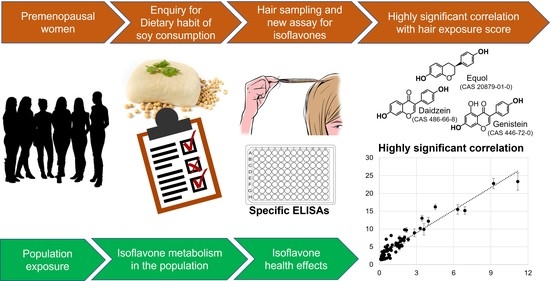
| 60 French women | Hair | ISO | French dietary habit questionnaire | ISO: r = 0.947; p < 0.001 GEN: r = 0.914; p < 0.001 DAI: r = 0.911; p < 0.001 | Present study |
| GEN | |||||
| DAI |
Publisher’s Note: MDPI stays neutral with regard to jurisdictional claims in published maps and institutional affiliations. |
© 2022 by the authors. Licensee MDPI, Basel, Switzerland. This article is an open access article distributed under the terms and conditions of the Creative Commons Attribution (CC BY) license (https://creativecommons.org/licenses/by/4.0/).
Share and Cite
Bensaada, S.; Raymond, I.; Breton, M.; Pellegrin, I.; Viallard, J.-F.; Bennetau-Pelissero, C. Development of an Assay for Soy Isoflavones in Women’s Hair. Nutrients 2022, 14, 3619. https://doi.org/10.3390/nu14173619
Bensaada S, Raymond I, Breton M, Pellegrin I, Viallard J-F, Bennetau-Pelissero C. Development of an Assay for Soy Isoflavones in Women’s Hair. Nutrients. 2022; 14(17):3619. https://doi.org/10.3390/nu14173619
Chicago/Turabian StyleBensaada, Souad, Isabelle Raymond, Malena Breton, Isabelle Pellegrin, Jean-François Viallard, and Catherine Bennetau-Pelissero. 2022. "Development of an Assay for Soy Isoflavones in Women’s Hair" Nutrients 14, no. 17: 3619. https://doi.org/10.3390/nu14173619
APA StyleBensaada, S., Raymond, I., Breton, M., Pellegrin, I., Viallard, J.-F., & Bennetau-Pelissero, C. (2022). Development of an Assay for Soy Isoflavones in Women’s Hair. Nutrients, 14(17), 3619. https://doi.org/10.3390/nu14173619