
Factors Associated with Low Vitamin D Status among Older Adults in Kuwait


Abstract
1. Introduction
2. Methods and Materials
2.1. Population and Study Design
2.2. Collection of Data
2.2.1. Demographic Variables
2.2.2. Lifestyle Variables and Sun Exposure
2.2.3. Anthropometric Measurements
2.2.4. Vitamin D Intake, Dietary Calcium, and Calories
2.2.5. Clinical Variables
2.2.6. Biochemical Assessment
Assessment of the Biochemistry Test, 25(OH)D, and PTH
2.3. Statistical Analysis
3. Results
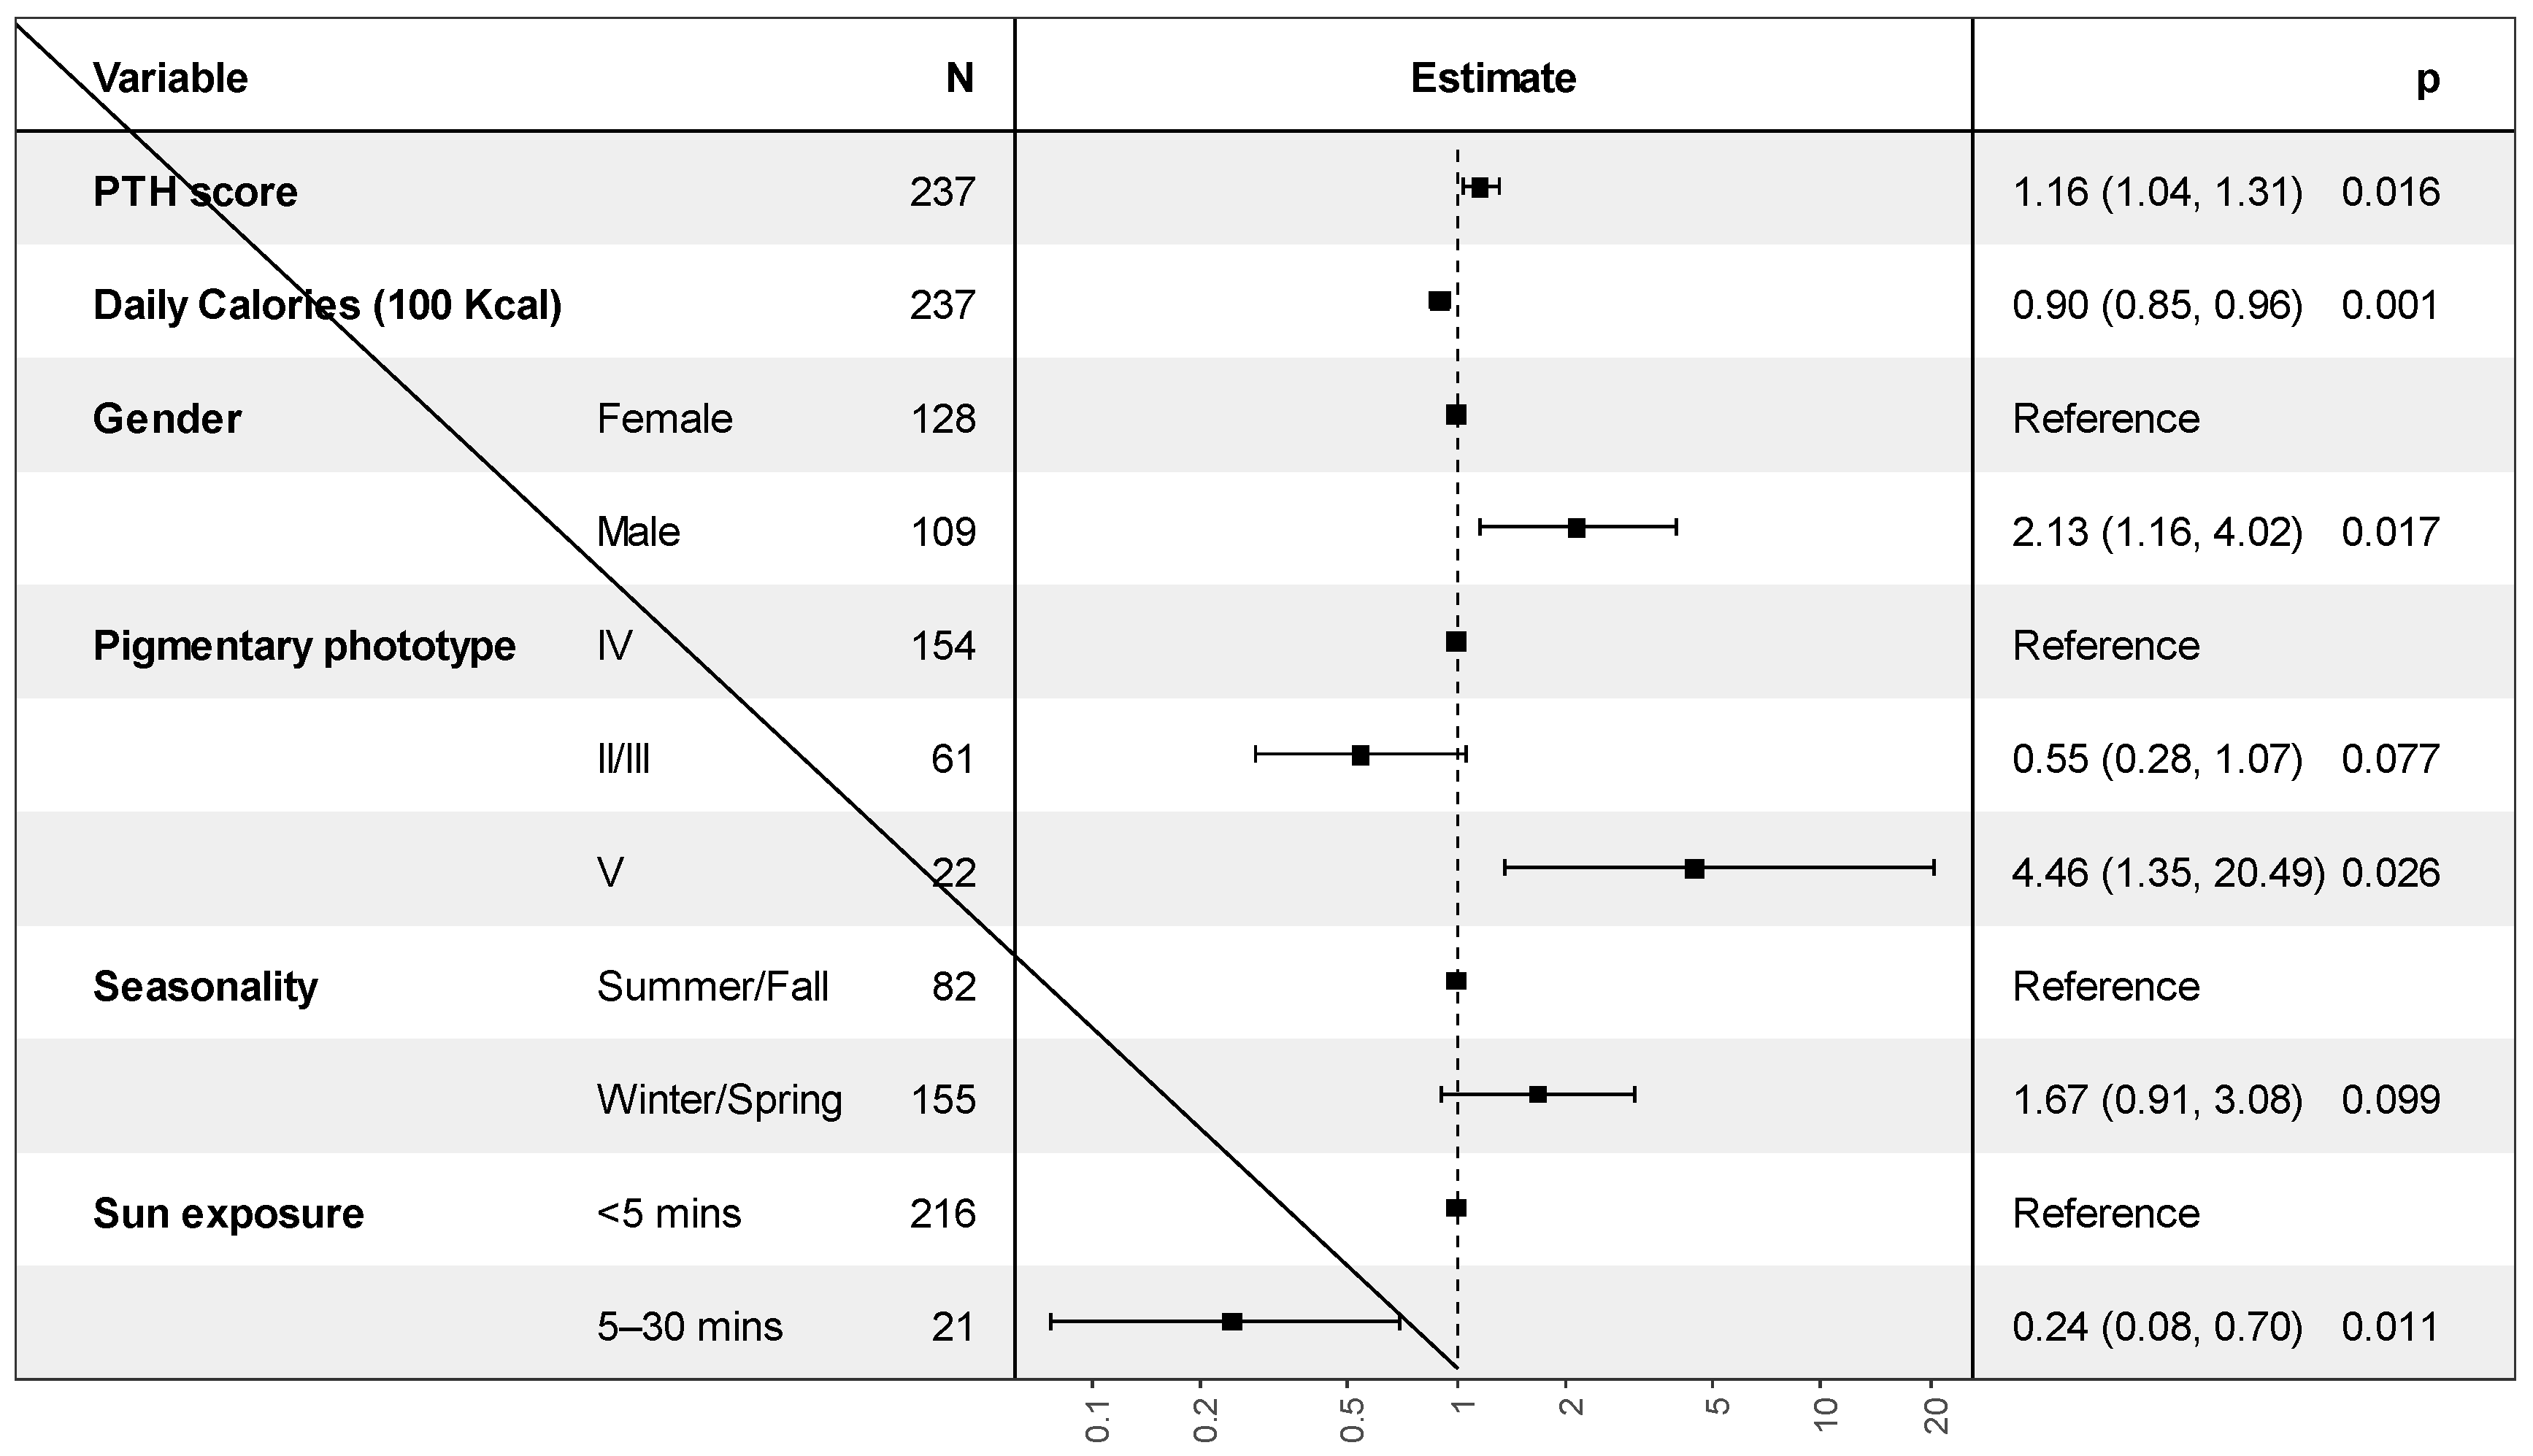
Independent Factors Associated with Vitamin D Deficiency
4. Discussion
Strengths and Limitations
5. Conclusions
Supplementary Materials
Author Contributions
Funding
Institutional Review Board Statement
Informed Consent Statement
Data Availability Statement
Acknowledgments
Conflicts of Interest
References
- Meehan, M.; Penckofer, S. The Role of Vitamin D in the Aging Adult. J. Aging Gerontol. 2014, 2, 60–71. [Google Scholar] [CrossRef] [PubMed]
- Awad, A.; Alhadab, A.; Albassam, A. Medication-Related Burden and Medication Adherence Among Geriatric Patients in Kuwait: A Cross-Sectional Study. Front. Pharmacol. 2020, 11, 1296. [Google Scholar] [CrossRef] [PubMed]
- Kim, S.H.; Oh, J.E.; Song, D.W.; Cho, C.Y.; Hong, S.H.; Cho, Y.J.; Yoo, B.W.; Shin, K.S.; Joe, H.; Shin, H.S.; et al. The factors associated with Vitamin D deficiency in community dwelling elderly in Korea. Nutr. Res. Pract. 2018, 12, 387–395. [Google Scholar] [CrossRef]
- Pray, L.; Boon, C.; Miller, E.A.; Pillsbury, L. (Eds.) Providing Healthy and Safe Foods as We Age: Workshop Summary; National Academies Press: Washington, DC, USA, 2010. [Google Scholar]
- Mithal, A.; Wahl, D.A.; Bonjour, J.-P.; Burckhardt, P.; Dawson-Hughes, B.; Eisman, J.A.; El-Hajj Fuleihan, G.; Josse, R.G.; Lips, P.; Morales-Torres, J. Global vitamin D status and determinants of hypovitaminosis D. Osteoporos. Int. 2009, 20, 1807–1820. [Google Scholar] [CrossRef] [PubMed]
- Di Gessa, G.; Biddulph, J.P.; Zaninotto, P.; de Oliveira, C. Changes in vitamin D levels and depressive symptoms in later life in England. Sci. Rep. 2021, 11, 7724. [Google Scholar] [CrossRef]
- Theodoratou, E.; Tzoulaki, I.; Zgaga, L.; Ioannidis, J.P. Vitamin D and multiple health outcomes: Umbrella review of systematic reviews and meta-analyses of observational studies and randomised trials. BMJ 2014, 348, g2035. [Google Scholar] [CrossRef]
- Karampela, I.; Sakelliou, A.; Vallianou, N.; Christodoulatos, G.-S.; Magkos, F.; Dalamaga, M. Vitamin D and Obesity: Current Evidence and Controversies. Curr. Obes. Rep. 2021, 10, 162–180. [Google Scholar] [CrossRef] [PubMed]
- Lips, P. Vitamin D physiology. Prog. Biophys. Mol. Biol. 2006, 92, 4–8. [Google Scholar] [CrossRef]
- Lin, L.Y.; Smeeth, L.; Langan, S.; Warren-Gash, C. Distribution of vitamin D status in the UK: A cross-sectional analysis of UK Biobank. BMJ Open 2021, 11, e038503. [Google Scholar] [CrossRef]
- Buchmann, N.; Eckstein, N.; Spira, D.; Demuth, I.; Steinhagen-Thiessen, E.; Norman, K. Vitamin D insufficiency is associated with metabolic syndrome independent of insulin resistance and obesity in young adults—The Berlin Aging Study II. Diabetes/Metab. Res. Rev. 2021, 37, e3457. [Google Scholar] [CrossRef]
- Atli, T.; Gullu, S.; Uysal, A.R.; Erdogan, G. The prevalence of Vitamin D deficiency and effects of ultraviolet light on Vitamin D levels in elderly Turkish population. Arch. Gerontol. Geriatr. 2005, 40, 53–60. [Google Scholar] [CrossRef] [PubMed]
- Gallagher, J.C. Vitamin D and aging. Endocrinol. Metab. Clin. N. Am. 2013, 42, 319–332. [Google Scholar] [CrossRef] [PubMed]
- Durvasula, S.; Gies, P.; Mason, R.S.; Chen, J.S.; Henderson, S.; Seibel, M.J.; Sambrook, P.N.; March, L.M.; Lord, S.R.; Kok, C.; et al. Vitamin D response of older people in residential aged care to sunlight-derived ultraviolet radiation. Arch. Osteoporos. 2014, 9, 197. [Google Scholar] [CrossRef] [PubMed]
- Scott, D.; Blizzard, L.; Fell, J.; Ding, C.; Winzenberg, T.; Jones, G. A prospective study of the associations between 25-hydroxy-vitamin D, sarcopenia progression and physical activity in older adults. Clin. Endocrinol. 2010, 73, 581–587. [Google Scholar] [CrossRef]
- Crowe, F.L.; Jolly, K.; MacArthur, C.; Manaseki-Holland, S.; Gittoes, N.; Hewison, M.; Scragg, R.; Nirantharakumar, K. Trends in the incidence of testing for vitamin D deficiency in primary care in the UK: A retrospective analysis of The Health Improvement Network (THIN), 2005–2015. BMJ Open 2019, 9, e028355. [Google Scholar] [CrossRef]
- Amrein, K.; Scherkl, M.; Hoffmann, M.; Neuwersch-Sommeregger, S.; Köstenberger, M.; Berisha, A.T.; Martucci, G.; Pilz, S.; Malle, O. Vitamin D deficiency 2.0: An update on the current status worldwide. Eur. J. Clin. Nutr. 2020, 74, 1498–1513. [Google Scholar] [CrossRef]
- Martucci, G.; Tuzzolino, F.; Arcadipane, A.; Pieber, T.R.; Schnedl, C.; Urbanic Purkart, T.; Treiber, G.; Amrein, K. The effect of high-dose cholecalciferol on bioavailable vitamin D levels in critically ill patients: A post hoc analysis of the VITdAL-ICU trial. Intensive Care Med. 2017, 43, 1732–1734. [Google Scholar] [CrossRef]
- De Pascale, G.; Quraishi, S.A. Vitamin D status in critically ill patients: The evidence is now bioavailable! Crit. Care 2014, 18, 449. [Google Scholar] [CrossRef]
- Institute of Medicine Committee to Review Dietary Reference Intakes for Vitamin D, Calcium. The National Academies Collection: Reports funded by National Institutes of Health. In Dietary Reference Intakes for Calcium and Vitamin D; Ross, A.C., Taylor, C.L., Yaktine, A.L., Del Valle, H.B., Eds.; National Academy of Sciences; National Academies Press: Washington, DC, USA, 2011. [Google Scholar]
- Holick, M.F.; Binkley, N.C.; Bischoff-Ferrari, H.A.; Gordon, C.M.; Hanley, D.A.; Heaney, R.P.; Murad, M.H.; Weaver, C.M. Evaluation, Treatment, and Prevention of Vitamin D Deficiency: An Endocrine Society Clinical Practice Guideline. J. Clin. Endocrinol. Metab. 2011, 96, 1911–1930. [Google Scholar] [CrossRef]
- Arabi, A.; El Rassi, R.; El-Hajj Fuleihan, G. Hypovitaminosis D in developing countries-prevalence, risk factors and outcomes. Nat. Rev. Endocrinol. 2010, 6, 550–561. [Google Scholar] [CrossRef]
- Alyahya, K.O. Vitamin D levels in schoolchildren: A cross-sectional study in Kuwait. BMC Pediatr. 2017, 17, 213. [Google Scholar] [CrossRef] [PubMed]
- Bassil, D.; Rahme, M.; Hoteit, M.; Fuleihan, G.E.-H. Hypovitaminosis D in the Middle East and North Africa: Prevalence, risk factors and impact on outcomes. Dermatoendocrinology 2013, 5, 274–298. [Google Scholar] [CrossRef] [PubMed]
- Al-Yatama, F.I.; AlOtaibi, F.; Al-Bader, M.D.; Al-Shoumer, K.A. The Effect of Clothing on Vitamin D Status, Bone Turnover Markers, and Bone Mineral Density in Young Kuwaiti Females. Int. J. Endocrinol. 2019, 2019, 6794837. [Google Scholar] [CrossRef] [PubMed]
- Al-Mutairi, N.; Issa, B.I.; Nair, V. Photoprotection and vitamin D status: A study on awareness, knowledge and attitude towards sun protection in general population from Kuwait, and its relation with vitamin D levels. Indian J. Dermatol. Venereol. Leprol. 2012, 78, 342–349. [Google Scholar] [CrossRef] [PubMed]
- Meshari Alsejari, M. Prevalence and Risk Factors of Vitamin D Deficiency among a sample of Kuwaiti population: A sociocultural Study. Coll. Antropol. 2018, 42, 101–109. [Google Scholar]
- Forrest, K.Y.; Stuhldreher, W.L. Prevalence and correlates of vitamin D deficiency in US adults. Nutr. Res. 2011, 31, 48–54. [Google Scholar] [CrossRef] [PubMed]
- Albolushi, T.; Bouhaimed, M.; Spencer, J. Lower Blood Vitamin D Levels Are Associated with Depressive Symptoms in a Population of Older Adults in Kuwait: A Cross-Sectional Study. Nutrients 2022, 14, 1548. [Google Scholar] [CrossRef]
- Al-Hazzaa, H.M. Health-enhancing physical activity among Saudi adults using the International Physical Activity Questionnaire (IPAQ). Public Health Nutr. 2007, 10, 59–64. [Google Scholar] [CrossRef]
- Helou, K.; El Helou, N.; Mahfouz, M.; Mahfouz, Y.; Salameh, P.; Harmouche-Karaki, M. Validity and reliability of an adapted arabic version of the long international physical activity questionnaire. BMC Public Health 2017, 18, 49. [Google Scholar] [CrossRef]
- Hanwell, H.; Vieth, R.; Cole, D.; Scillitani, A.; Modoni, S.; Frusciante, V.; Ritrovato, G.; Chiodini, I.; Minisola, S.; Carnevale, V. Sun exposure questionnaire predicts circulating 25-hydroxyvitamin D concentrations in Caucasian hospital workers in southern Italy. J. Steroid Biochem. Mol. Biol. 2010, 121, 334–337. [Google Scholar] [CrossRef]
- Weiderpass, E.; Botteri, E.; Longenecker, J.C.; Alkandari, A.; Al-Wotayan, R.; Al Duwairi, Q.; Tuomilehto, J. The Prevalence of Overweight and Obesity in an Adult Kuwaiti Population in 2014. Front. Endocrinol. 2019, 10, 449. [Google Scholar] [CrossRef] [PubMed]
- Alberti, K.G.M.M.; Eckel, R.H.; Grundy, S.M.; Zimmet, P.Z.; Cleeman, J.I.; Donato, K.A.; Fruchart, J.C.; James, W.P.T.; Loria, C.M.; Smith, S.C., Jr. Harmonizing the Metabolic Syndrome: A joint interim statement of the international diabetes federation task force on epidemiology and prevention; national heart, lung, and blood institute; American heart association; world heart federation; international atherosclerosis society; and international association for the study of obesity. Circulation 2009, 120, 1640–1645. [Google Scholar]
- Oguoma, V.M.; Coffee, N.T.; Alsharrah, S.; Abu-Farha, M.; Al-Refaei, F.H.; Al-Mulla, F.; Daniel, M. Prevalence of overweight and obesity, and associations with socio-demographic factors in Kuwait. BMC Public Health 2021, 21, 667. [Google Scholar] [CrossRef]
- Zareef, T.A.; Jackson, R.T.; Alkahtani, A.A. Vitamin D Intake among Premenopausal Women Living in Jeddah: Food Sources and Relationship to Demographic Factors and Bone Health. J. Nutr. Metab. 2018, 2018, 8570986. [Google Scholar] [CrossRef] [PubMed]
- Papandreou, D.; Rachaniotis, N.; Lari, M.; Al Mussabi, W. Validation of a food frequency questionnaire for vitamin D and calcium intake in healthy female college students. Food Nutr. Sci. 2014, 5, 2048. [Google Scholar] [CrossRef]
- Dehghan, M.; Al Hamad, N.; Yusufali, A.; Nusrath, F.; Yusuf, S.; Merchant, A.T. Development of a semi-quantitative food frequency questionnaire for use in United Arab Emirates and Kuwait based on local foods. Nutr. J. 2005, 4, 18. [Google Scholar] [CrossRef] [PubMed]
- Unger, T.; Borghi, C.; Charchar, F.; Khan, N.A.; Poulter, N.R.; Prabhakaran, D.; Ramirez, A.; Schlaich, M.; Stergiou, G.S.; Tomaszewski, M.; et al. 2020 International Society of Hypertension Global Hypertension Practice Guidelines. Hypertension 2020, 75, 1334–1357. [Google Scholar] [CrossRef]
- Al-Taiar, A.; Rahman, A.; Al-Sabah, R.; Shaban, L.; Al-Harbi, A. Vitamin D status among adolescents in Kuwait: A cross-sectional study. BMJ Open 2018, 8, e021401. [Google Scholar] [CrossRef]
- Ross, A.C.; Manson, J.E.; Abrams, S.A.; Aloia, J.F.; Brannon, P.M.; Clinton, S.K.; Durazo-Arvizu, R.A.; Gallagher, J.C.; Gallo, R.L.; Jones, G.; et al. The 2011 report on dietary reference intakes for calcium and vitamin D from the Institute of Medicine: What clinicians need to know. J. Clin. Endocrinol. Metab. 2011, 96, 53–58. [Google Scholar] [CrossRef]
- Lips, P.; Cashman, K.D.; Lamberg-Allardt, C.; Bischoff-Ferrari, H.A.; Obermayer-Pietsch, B.; Bianchi, M.L.; Stepan, J.; El-Hajj Fuleihan, G.; Bouillon, R. Current vitamin D status in European and Middle East countries and strategies to prevent vitamin D deficiency: A position statement of the European Calcified Tissue Society. Eur. J. Endocrinol. 2019, 180, P23–P54. [Google Scholar] [CrossRef]
- Chakhtoura, M.; Rahme, M.; Chamoun, N.; El-Hajj Fuleihan, G. Vitamin D in the Middle East and North Africa. Bone Rep. 2018, 8, 135–146. [Google Scholar] [CrossRef] [PubMed]
- Cesareo, R.; Attanasio, R.; Caputo, M.; Castello, R.; Chiodini, I.; Falchetti, A.; Guglielmi, R.; Papini, E.; Santonati, A.; Scillitani, A.; et al. Italian Association of Clinical Endocrinologists (AME) and Italian Chapter of the American Association of Clinical Endocrinologists (AACE) Position Statement: Clinical Management of Vitamin D Deficiency in Adults. Nutrients 2018, 10, 546. [Google Scholar] [CrossRef] [PubMed]
- Cashman, K.D.; Dowling, K.G.; Škrabáková, Z.; Gonzalez-Gross, M.; Valtueña, J.; De Henauw, S.; Moreno, L.; Damsgaard, C.T.; Michaelsen, K.F.; Mølgaard, C.; et al. Vitamin D deficiency in Europe: Pandemic? Am. J. Clin. Nutr. 2016, 103, 1033–1044. [Google Scholar] [CrossRef] [PubMed]
- Chen, J.; Yun, C.; He, Y.; Piao, J.; Yang, L.; Yang, X. Vitamin D status among the elderly Chinese population: A cross-sectional analysis of the 2010–2013 China national nutrition and health survey (CNNHS). Nutr. J. 2017, 16, 3. [Google Scholar] [CrossRef]
- Souberbielle, J.C.; Massart, C.; Brailly-Tabard, S.; Cavalier, E.; Chanson, P. Prevalence and determinants of vitamin D deficiency in healthy French adults: The VARIETE study. Endocrine 2016, 53, 543–550. [Google Scholar] [CrossRef]
- Gill, T.K.; Hill, C.L.; Shanahan, E.M.; Taylor, A.W.; Appleton, S.L.; Grant, J.F.; Shi, Z.; Dal Grande, E.; Price, K.; Adams, R.J. Vitamin D levels in an Australian population. BMC Public Health 2014, 14, 1001. [Google Scholar] [CrossRef]
- Chan, R.; Woo, J. The value of vitamin D supplementation in older people. Nutr. Ther. Metab. 2011, 29, 8–21. [Google Scholar]
- Kweder, H.; Eidi, H. Vitamin D deficiency in elderly: Risk factors and drugs impact on vitamin D status. Avicenna J. Med. 2018, 8, 139–146. [Google Scholar] [CrossRef]
- Aasheim, E.T.; Hofsø, D.; Hjelmesæth, J.; Birkeland, K.I.; Bøhmer, T. Vitamin status in morbidly obese patients: A cross-sectional study. Am. J. Clin. Nutr. 2008, 87, 362–369. [Google Scholar] [CrossRef]
- Lagunova, Z.; Porojnicu, A.C.; Lindberg, F.; Hexeberg, S.; Moan, J. The dependency of vitamin D status on body mass index, gender, age and season. Anticancer Res. 2009, 29, 3713–3720. [Google Scholar] [CrossRef]
- Carrillo-Vega, M.F.; García-Peña, C.; Gutiérrez-Robledo, L.M.; Pérez-Zepeda, M.U. Vitamin D deficiency in older adults and its associated factors: A cross-sectional analysis of the Mexican Health and Aging Study. Arch. Osteoporos. 2016, 12, 8. [Google Scholar] [CrossRef] [PubMed]
- Huang, C.-H.; Huang, Y.-T.A.; Lai, Y.-C.; Sun, C.-K. Prevalence and predictors of hypovitaminosis D among the elderly in subtropical region. PLoS ONE 2017, 12, e0181063. [Google Scholar] [CrossRef] [PubMed]
- Lopes, J.B.; Fernandes, G.H.; Takayama, L.; Figueiredo, C.P.; Pereira, R.M.R. A predictive model of vitamin D insufficiency in older community people: From the São Paulo Aging & Health Study (SPAH). Maturitas 2014, 78, 335–340. [Google Scholar] [PubMed]
- Nair, R.; Maseeh, A. Vitamin D: The “sunshine” vitamin. J. Pharmacol. Pharmacother. 2012, 3, 118. [Google Scholar] [PubMed]
- Park, S.; Johnson, M.A. Living in low-latitude regions in the United States does not prevent poor vitamin D status. Nutr. Rev. 2005, 63, 203–209. [Google Scholar] [CrossRef] [PubMed]
- Rockell, J.; Skeaff, C.; Williams, S.; Green, T. Association between quantitative measures of skin color and plasma 25-hydroxyvitamin D. Osteoporos. Int. 2008, 19, 1639–1642. [Google Scholar] [CrossRef]
- Egan, K.M.; Signorello, L.B.; Munro, H.M.; Hargreaves, M.K.; Hollis, B.W.; Blot, W.J. Vitamin D insufficiency among African-Americans in the southeastern United States: Implications for cancer disparities (United States). Cancer Causes Control 2008, 19, 527–535. [Google Scholar] [CrossRef]
- Bird, M.-L.; Hill, K.D.; Robertson, I.; Ball, M.J.; Pittaway, J.K.; Williams, A.D. The association between seasonal variation in vitamin D, postural sway, and falls risk: An observational cohort study. J. Aging Res. 2013, 2013, 751310. [Google Scholar] [CrossRef] [PubMed]
- Hossein-nezhad, A.; Holick, M.F. Vitamin D for health: A global perspective. Mayo Clin. Proc. 2013, 88, 720–755. [Google Scholar] [CrossRef]
- Holick, M.F. Evolution and function of vitamin D. In Vitamin D Analogs in Cancer Prevention and Therapy; Springer: Berlin/Heidelberg, Germany, 2003; pp. 3–28. [Google Scholar]
- Sulimani, R.A.; Mohammed, A.G.; Alfadda, A.A.; Alshehri, S.N.; Al-Othman, A.M.; Al-Daghri, N.M.; Hanley, D.A.; Khan, A.A. Vitamin D deficiency and biochemical variations among urban Saudi adolescent girls according to season. Saudi Med. J. 2016, 37, 1002–1008. [Google Scholar] [CrossRef]
- Al-Daghri, N.M.; Al-Attas, O.S.; Alokail, M.S.; Alkharfy, K.M.; El-Kholie, E.; Yousef, M.; Al-Othman, A.; Al-Saleh, Y.; Sabico, S.; Kumar, S.; et al. Increased vitamin D supplementation recommended during summer season in the gulf region: A counterintuitive seasonal effect in vitamin D levels in adult, overweight and obese Middle Eastern residents. Clin. Endocrinol. 2012, 76, 346–350. [Google Scholar] [CrossRef] [PubMed]
- Pludowski, P.; Takacs, I.; Boyanov, M.; Belaya, Z.; Diaconu, C.C.; Mokhort, T.; Zherdova, N.; Rasa, I.; Payer, J.; Pilz, S. Clinical Practice in the Prevention, Diagnosis and Treatment of Vitamin D Deficiency: A Central and Eastern European Expert Consensus Statement. Nutrients 2022, 14, 1483. [Google Scholar] [CrossRef] [PubMed]
- Martins, J.S.; Palhares, M.d.O.; Teixeira, O.C.M.; Gontijo Ramos, M. Vitamin D Status and Its Association with Parathyroid Hormone Concentration in Brazilians. J. Nutr. Metab. 2017, 2017, 9056470. [Google Scholar] [CrossRef]
- Kilicarslan, A.; Aslan, A.C.; Gezgen, G. The role of vitamin D deficiency in parathyroid hormone levels. Turk. J. Med. Sci. 2013, 43, 368–372. [Google Scholar] [CrossRef]
- Tsugawa, N.; Uenishi, K.; Ishida, H.; Ozaki, R.; Takase, T.; Minekami, T.; Uchino, Y.; Kamao, M.; Okano, T. Association between vitamin D status and serum parathyroid hormone concentration and calcaneal stiffness in Japanese adolescents: Sex differences in susceptibility to vitamin D deficiency. J. Bone Miner. Metab. 2016, 34, 464–474. [Google Scholar] [CrossRef] [PubMed]
- Heaney, R. Toward a physiological referent for the vitamin D requirement. J. Endocrinol. Investig. 2014, 37, 1127–1130. [Google Scholar] [CrossRef] [PubMed]
- Larijani, B.; Hossein-Nezhad, A.; Feizabad, E.; Maghbooli, Z.; Adibi, H.; Ramezani, M.; Taheri, E. Vitamin D deficiency, bone turnover markers and causative factors among adolescents: A cross-sectional study. J. Diabetes Metab. Disord. 2016, 15, 46. [Google Scholar] [CrossRef]
- Lejnieks, A.; Slaidina, A.; Zvaigzne, A.; Soboleva, U.; Eivazova, G.; Daukste, I.; Lejniece, S. Vitamin D status and its seasonal variations and association with parathyroid hormone concentration in healthy women in Riga. Medicina 2013, 49, 51. [Google Scholar] [CrossRef]
- Quaggiotto, P.; Tran, H.; Bhanugopan, M. Vitamin D deficiency remains prevalent despite increased laboratory testing in New South Wales, Australia. Singap. Med. J. 2014, 55, 271. [Google Scholar] [CrossRef]
- Bañón, S.; Rosillo, M.; Gómez, A.; Pérez-Elias, M.J.; Moreno, S.; Casado, J.L. Effect of a monthly dose of calcidiol in improving vitamin D deficiency and secondary hyperparathyroidism in HIV-infected patients. Endocrine 2015, 49, 528–537. [Google Scholar] [CrossRef]
- Annweiler, C.; Riou, J.; Alessandri, A.; Gicquel, D.; Henni, S.; Féart, C.; Kabeshova, A. Clinical Identification of Geriatric Patients with Hypovitaminosis D: The ‘Vitamin D Status Predictor for Geriatrics’ Study. Nutrients 2017, 9, 658. [Google Scholar] [CrossRef] [PubMed]
- Sizar, O.; Khare, S.; Goyal, A.; Bansal, P.; Givler, A. Vitamin D deficiency; StatPearls: Treasure Island, FL, USA, 2021. [Google Scholar]
- Snijder, M.B.; van Dam, R.M.; Visser, M.; Deeg, D.J.; Dekker, J.M.; Bouter, L.M.; Seidell, J.; Lips, P. Adiposity in relation to vitamin D status and parathyroid hormone levels: A population-based study in older men and women. J. Clin. Endocrinol. Metab. 2005, 90, 4119–4123. [Google Scholar] [CrossRef] [PubMed]
- Botella-Carretero, J.I.; Alvarez-Blasco, F.; Villafruela, J.J.; Balsa, J.A.; Vázquez, C.; Escobar-Morreale, H.F. Vitamin D deficiency is associated with the metabolic syndrome in morbid obesity. Clin. Nutr. 2007, 26, 573–580. [Google Scholar] [CrossRef] [PubMed]
- Oliai Araghi, S.; van Dijk, S.C.; Ham, A.C.; Brouwer-Brolsma, E.M.; Enneman, A.W.; Sohl, E.; Swart, K.M.A.; Van Der Zwaluw, N.L.; Van Wijngaarden, J.P.; Dhonukshe-Rutten, R.A.M.; et al. BMI and Body Fat Mass Is Inversely Associated with Vitamin D Levels in Older Individuals. J. Nutr. Health Aging 2015, 19, 980–985. [Google Scholar] [CrossRef]
- Gilsanz, V.; Kremer, A.; Mo, A.O.; Wren, T.A.; Kremer, R. Vitamin D status and its relation to muscle mass and muscle fat in young women. J. Clin. Endocrinol. Metab. 2010, 95, 1595–1601. [Google Scholar] [CrossRef]
- Wortsman, J.; Matsuoka, L.Y.; Chen, T.C.; Lu, Z.; Holick, M.F. Decreased bioavailability of vitamin D in obesity. Am. J. Clin. Nutr. 2000, 72, 690–693. [Google Scholar] [CrossRef]
- Ford, E.S. Risks for All-Cause Mortality, Cardiovascular Disease, and Diabetes Associated With the Metabolic Syndrome: A summary of the evidence. Diabetes Care 2005, 28, 1769–1778. [Google Scholar] [CrossRef]
- Tsuji, K.; Maeda, T.; Kawane, T.; Matsunuma, A.; Horiuchi, N. Leptin stimulates fibroblast growth factor 23 expression in bone and suppresses renal 1α,25-dihydroxyvitamin D3 synthesis in leptin-deficient mice. J. Bone Miner. Res. Off. J. Am. Soc. Bone Miner. Res. 2010, 25, 1711–1723. [Google Scholar] [CrossRef]


| Variables | Deficiency (<75) (n = 150, 63%) | Sufficiency (≥75) (n = 87, 37%) | p-Value |
|---|---|---|---|
| Serum vitamin D levels (SD) (nmol/L) | 49.25 (14.81) | 105.24 (35.93) | <0.001 |
| Age in years, mean (SD) | 71.52 (5.15) | 71.21 (4.56) | 0.630 |
| Gender | 0.042 | ||
| Female | 73 (48.67%) | 55 (63.22%) | |
| Male | 77 (51.33%) | 32 (36.78%) | |
| Marital status | 0.595 | ||
| Divorced | 5 (3.33%) | 3 (3.45%) | |
| Married | 105 (70.00%) | 68 (78.16%) | |
| Single | 3 (2.00%) | 1 (1.15%) | |
| Widowed | 37 (24.67%) | 15 (17.24%) | |
| Governorate | 0.126 | ||
| Ahmadi | 19 (12.67%) | 14 (16.09%) | |
| Capital | 24 (16.00%) | 13 (14.94%) | |
| Farwanya | 25 (16.67%) | 14 (16.09%) | |
| Hawaly | 27 (18.00%) | 23 (26.44%) | |
| Jahra | 23 (15.33%) | 16 (18.39%) | |
| Mubarak Al-Kabeer | 32 (21.33%) | 7 (8.05%) | |
| Type of House | 0.116 | ||
| Rental flat | 2 (1.33%) | 1 (1.15%) | |
| Rental house | 0 (0.00%) | 2 (2.30%) | |
| Owned flat | 0 (0.00%) | 1 (1.15%) | |
| Owned house | 148 (98.67%) | 83 (95.40%) | |
| Education level | |||
| No formal education | 31 (20.67%) | 20 (22.99%) | 0.728 |
| Completed primary/intermediate school | 26 (17.33%) | 10 (11.49%) | |
| Completed secondary school | 36 (24.00%) | 19 (21.84%) | |
| Completed diploma | 25 (16.67%) | 18 (20.69%) | |
| University degree or above | 32 (21.33%) | 20 (22.99%) | |
| Income per month | 0.691 | ||
| KWD 500–1000 | 62 (42.18%) | 42 (48.84%) | |
| KWD 1001–1500 | 37 (25.17%) | 22 (25.58%) | |
| KWD 1501–2000 | 27 (18.37%) | 12 (13.95%) | |
| More than KWD 2000 | 21 (14.29%) | 10 (11.63%) | |
| Occupation | 0.658 | ||
| Business | 8 (5.33%) | 2 (2.30%) | |
| Housewife | 44 (29.33%) | 29 (33.33%) | |
| Paid job (with salary) | 4 (2.67%) | 3 (3.45%) | |
| Retired | 94 (62.67%) | 53 (60.92%) | |
| Number of children | 6.00 [5.00; 9.00] | 6.00 [4.00; 9.00] | 0.193 |
| BMI (Kg/m2) | 29.63 (6.14) | 30.31 (5.82) | 0.400 |
| Body mass index categories: | 0.297 | ||
| Normal weight | 17 (11.33%) | 14 (16.09%) | |
| Overweight | 75 (50.00%) | 35 (40.23%) | |
| Obese | 58 (38.67%) | 38 (43.68%) | |
| Waist (CM) | 100.69 (19.30) | 103.19 (17.55) | 0.310 |
| Hip (CM) | 106.29 (19.08) | 109.66 (13.79) | 0.118 |
| Current smoker | 11 (7.33%) | 6 (6.90%) | 0.900 |
| Alcohol drinker | 2 (1.33%) | 2 (2.30%) | 0.626 |
| Sleep duration category | 0.348 | ||
| <6 | 28 (18.92%) | 12 (13.79%) | |
| 6–8 | 118 (79.73%) | 72 (82.76%) | |
| >8 | 2 (1.35%) | 3 (3.45%) | |
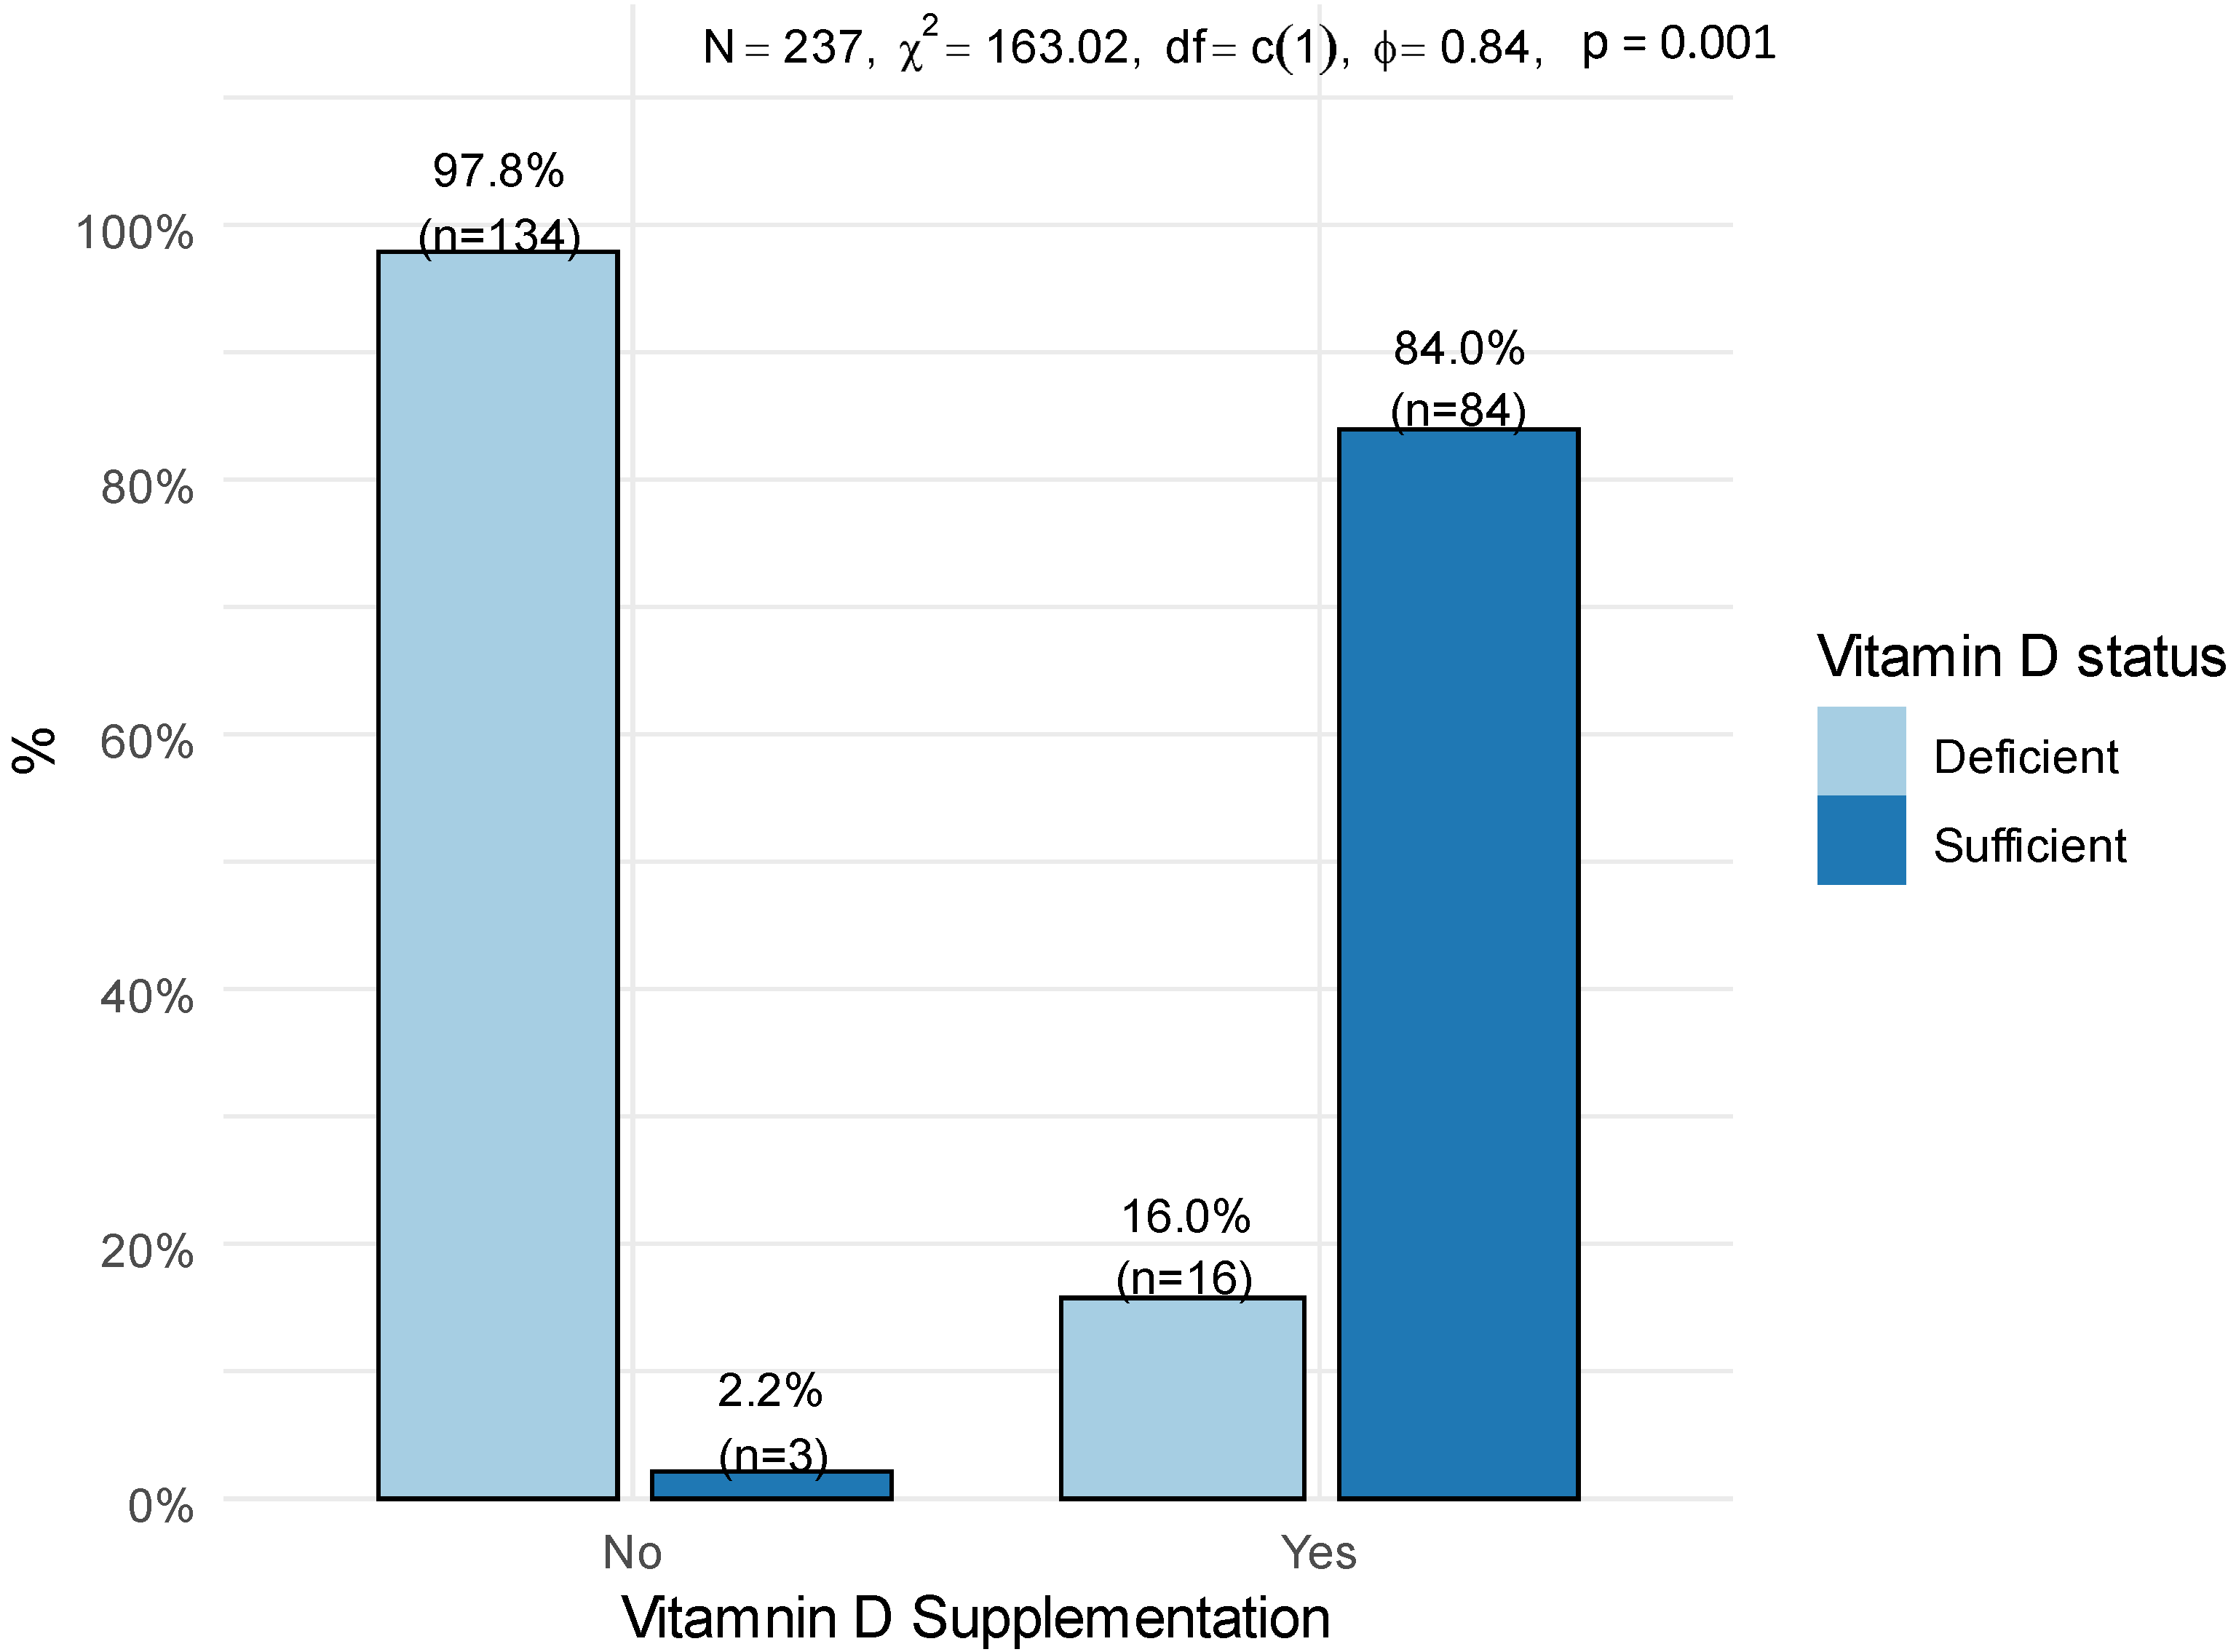
| Vitamin D supplement consumers | 16.0 (16.0%) | 84.0 (84.0%) | <0.001 |
| Calcium supplementation (%) | 3 (2.00%) | 4 (4.60%) | 0.265 |
| Dietary intake of vitamin D (IU) * | 177.99 [98.40; 235.36] | 217.35 [153.44; 307.65] | 0.001 |
| Dietary intake of calcium (mg) * | 621.34 [458.94; 943.24] | 855.29 [639.77; 1125.40] | <0.001 |
| Daily calorie intake (Kcal) | 1337.49 (497.74) | 1567.01 (456.61) | <0.001 |
| Walking per minute | 3.25 (3.05) | 2.90 (3.04) | 0.385 |
| Physical activity > 1 day | 67 (44.67%) | 41 (47.13%) | 0.817 |
| Dresses for women (1, 2, 3) | 0.939 | ||
| Hijab | 34 (46.58%) | 27 (50.00%) | |
| Veiled | 37 (50.68%) | 26 (48.15%) | |
| Without hijab | 2 (2.74%) | 1 (1.85%) | |
| Dresses for men (1, 2, 3) | 0.167 | ||
| Dishdasha and ghutra | 74 (96.10%) | 29 (87.88%) | |
| Dishdasha without ghutra | 2 (2.60%) | 3 (9.09%) | |
| Cap and trousers | 1 (1.30%) | 1 (3.03%) |
| Variables | Deficiency (<75) (n = 150, 63%) | Sufficiency (≥75) (n = 87, 37%) | p-Value |
|---|---|---|---|
| Comorbidity indicators | |||
| Dyslipidemia | 109 (72.67%) | 61 (70.11%) | 0.787 |
| Hypertension | 107 (71.33%) | 58 (66.67%) | 0.544 |
| Type 2 diabetes | 92 (61.33%) | 60 (68.97%) | 0.238 |
| Cardiovascular disease | 34 (22.82%) | 20 (22.99%) | 0.976 |
| Osteoporosis | 33 (22.00%) | 26 (29.89%) | 0.231 |
| Laboratory test | |||
| PO4 mmol/L | 1.10 [1.02; 1.22] | 1.15 [1.03; 1.25] | 0.050 |
| Ca mmol/L | 2.29 [2.22; 2.37] | 2.32 [2.26; 2.38] | 0.034 |
| PTH mmol/L | 6.03 [4.40; 7.82] | 5.02 [3.67; 6.50] | 0.003 |
| ALP IU/L | 69.00 [57.25; 81.75] | 69.00 [57.00; 90.50] | 0.202 |
| Seasonality | 0.126 | ||
| Winter/Spring | 104 (69.33%) | 51 (58.62%) | |
| Summer/Fall | 46 (30.67%) | 36 (41.38%) | |
| Sun exposure | 0.023 | ||
| <5 min | 142 (94.67%) | 74 (85.06%) | |
| 5–30 min | 8 (5.33%) | 13 (14.94%) | |
| Pigmentary phototype | 0.004 | ||
| II | 3 (2.00%) | 0 (0.00%) | |
| III | 28 (18.67%) | 30 (34.48%) | |
| IV | 100 (66.67%) | 54 (62.07%) | |
| V | 19 (12.67%) | 3 (3.45%) |
Publisher’s Note: MDPI stays neutral with regard to jurisdictional claims in published maps and institutional affiliations. |
© 2022 by the authors. Licensee MDPI, Basel, Switzerland. This article is an open access article distributed under the terms and conditions of the Creative Commons Attribution (CC BY) license (https://creativecommons.org/licenses/by/4.0/).
Share and Cite
ALbuloshi, T.; Kamel, A.M.; Spencer, J.P.E. Factors Associated with Low Vitamin D Status among Older Adults in Kuwait. Nutrients 2022, 14, 3342. https://doi.org/10.3390/nu14163342
ALbuloshi T, Kamel AM, Spencer JPE. Factors Associated with Low Vitamin D Status among Older Adults in Kuwait. Nutrients. 2022; 14(16):3342. https://doi.org/10.3390/nu14163342
Chicago/Turabian StyleALbuloshi, Thurayya, Ahmed M. Kamel, and Jeremy P. E. Spencer. 2022. "Factors Associated with Low Vitamin D Status among Older Adults in Kuwait" Nutrients 14, no. 16: 3342. https://doi.org/10.3390/nu14163342
APA StyleALbuloshi, T., Kamel, A. M., & Spencer, J. P. E. (2022). Factors Associated with Low Vitamin D Status among Older Adults in Kuwait. Nutrients, 14(16), 3342. https://doi.org/10.3390/nu14163342