
Inverse Association between Dietary Diversity Score Calculated from the Diet Quality Questionnaire and Psychological Stress in Chinese Adults: A Prospective Study from China Health and Nutrition Survey


Abstract
:1. Introduction
2. Materials and Methods
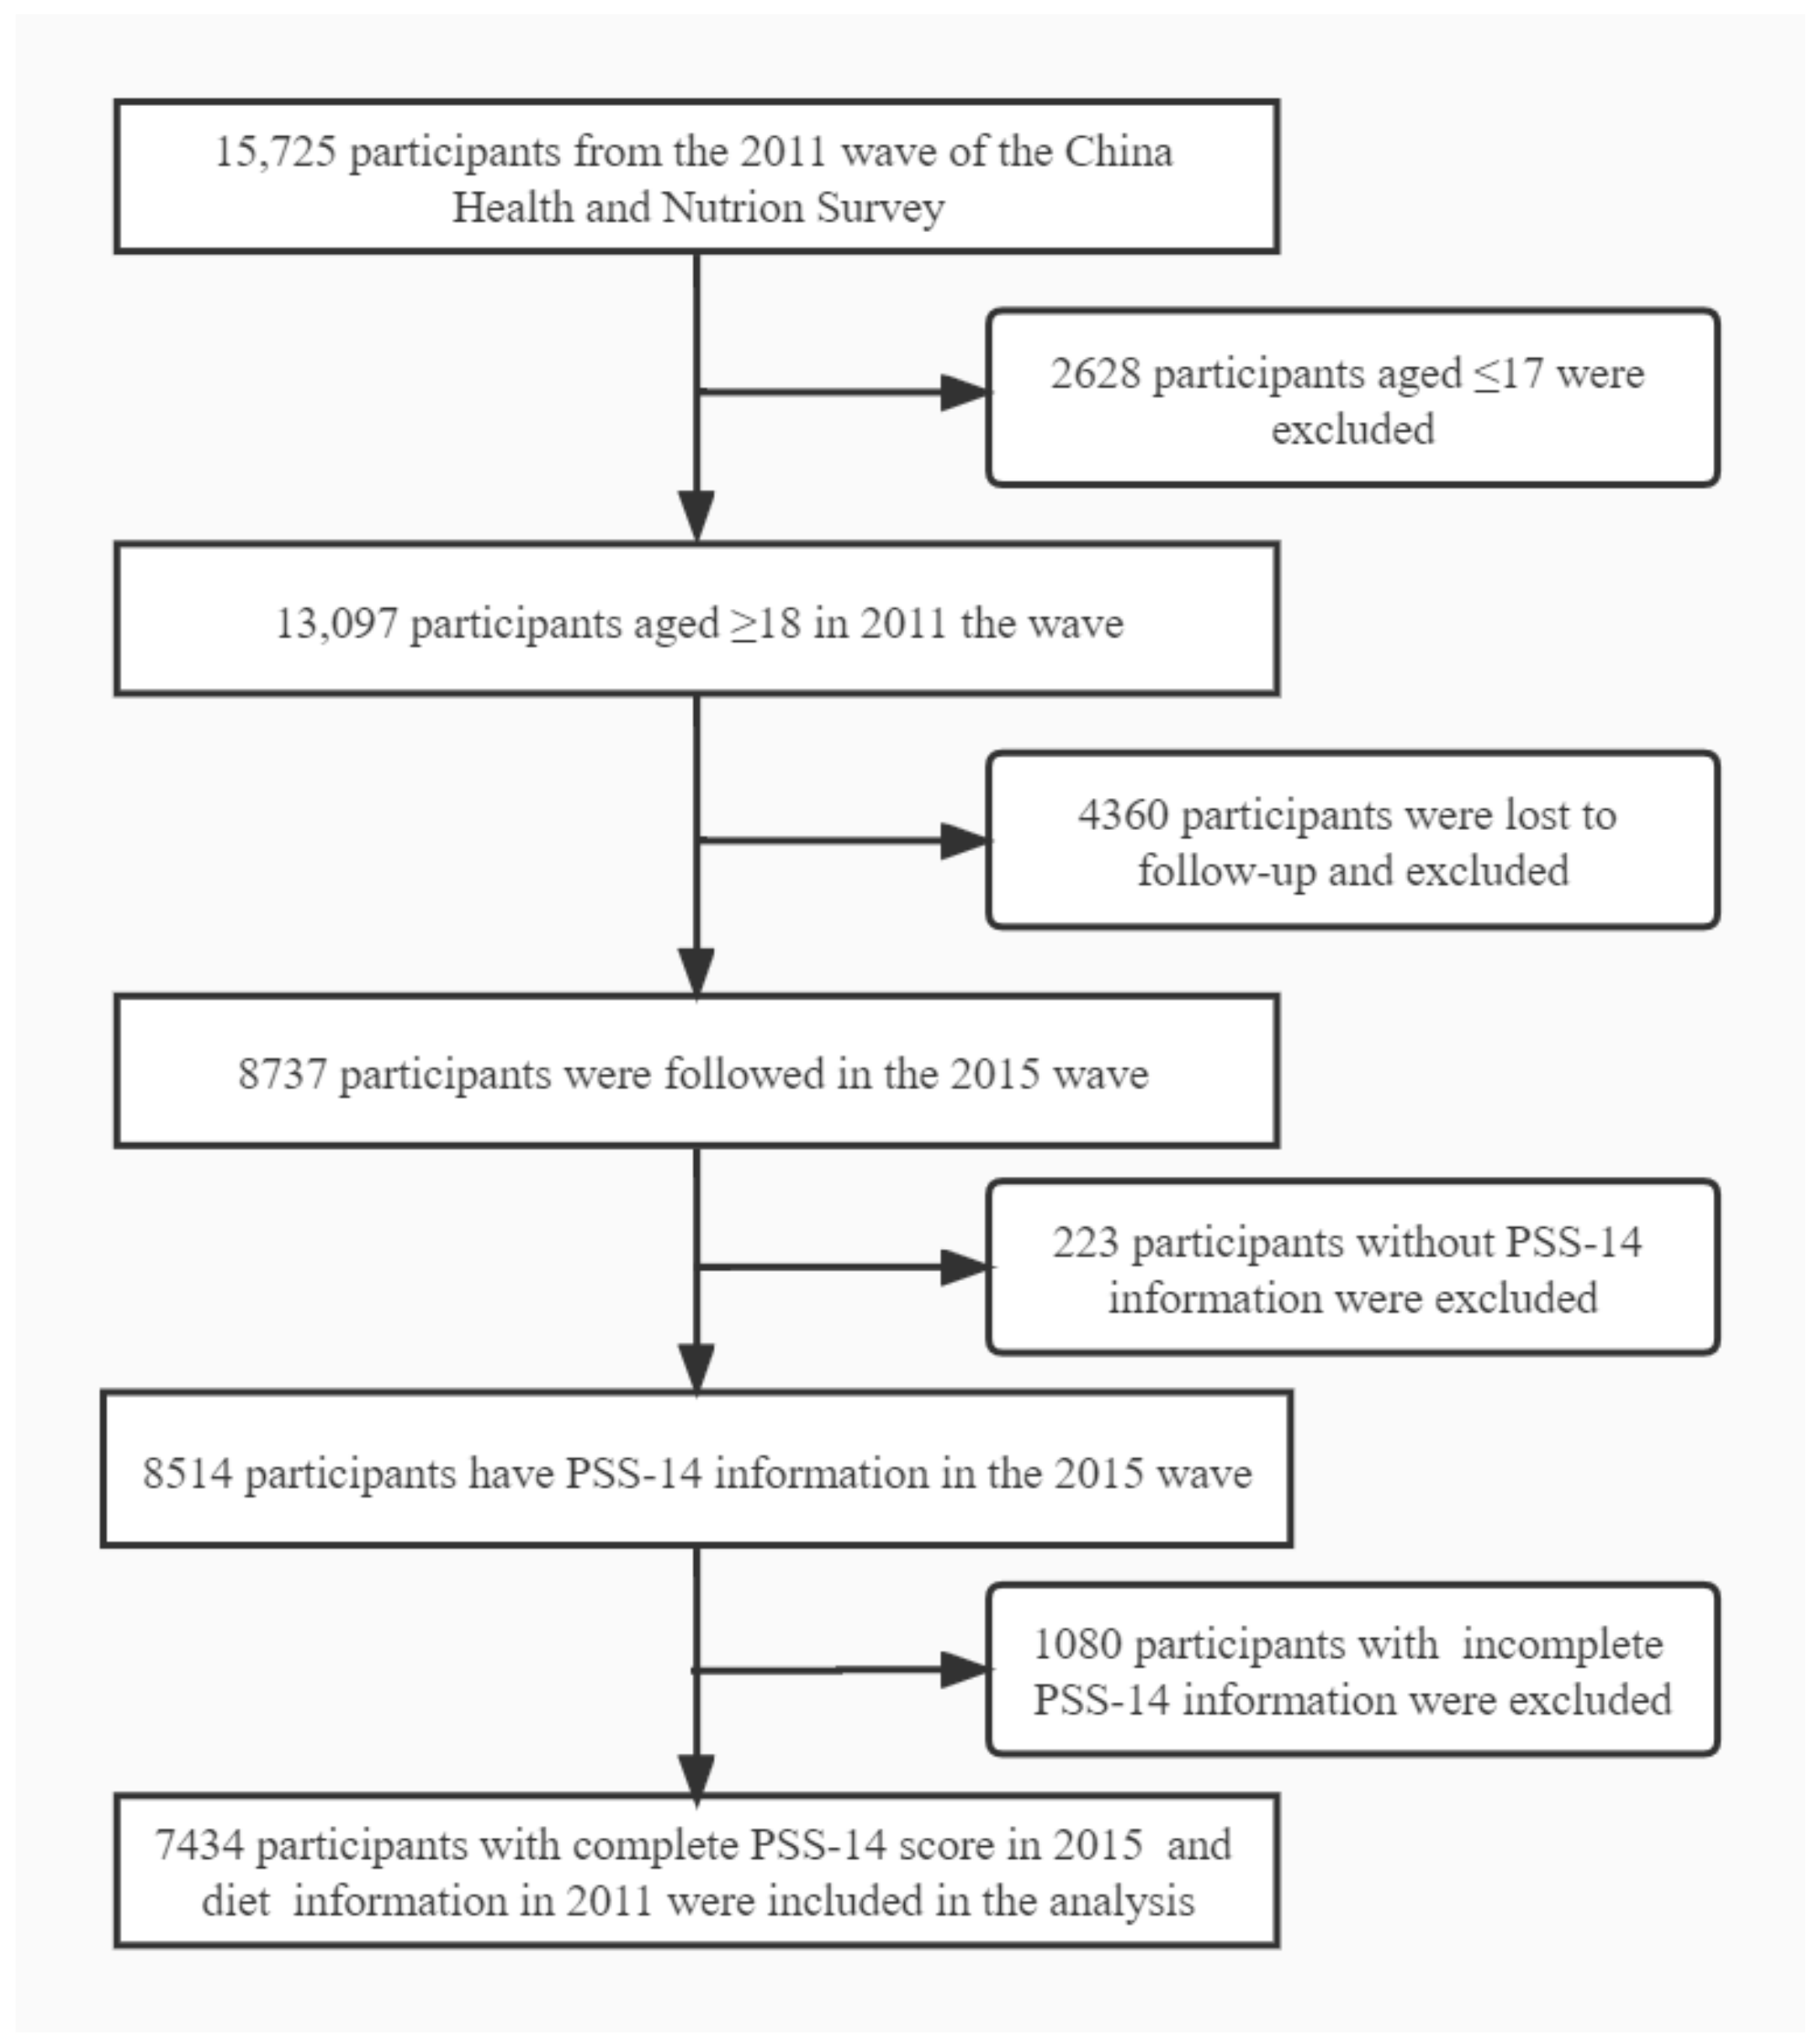
2.1. Data Resource and Study Participants
2.2. Study Outcome and Definitions
2.3. Dietary Data Collection and Assessment
2.4. Measurements and Calculation of Covariates
2.5. Statistical Analysis
3. Results
3.1. Participant Characteristics
3.2. The Distribution of Dietary Diversity and Perceived Stress Level
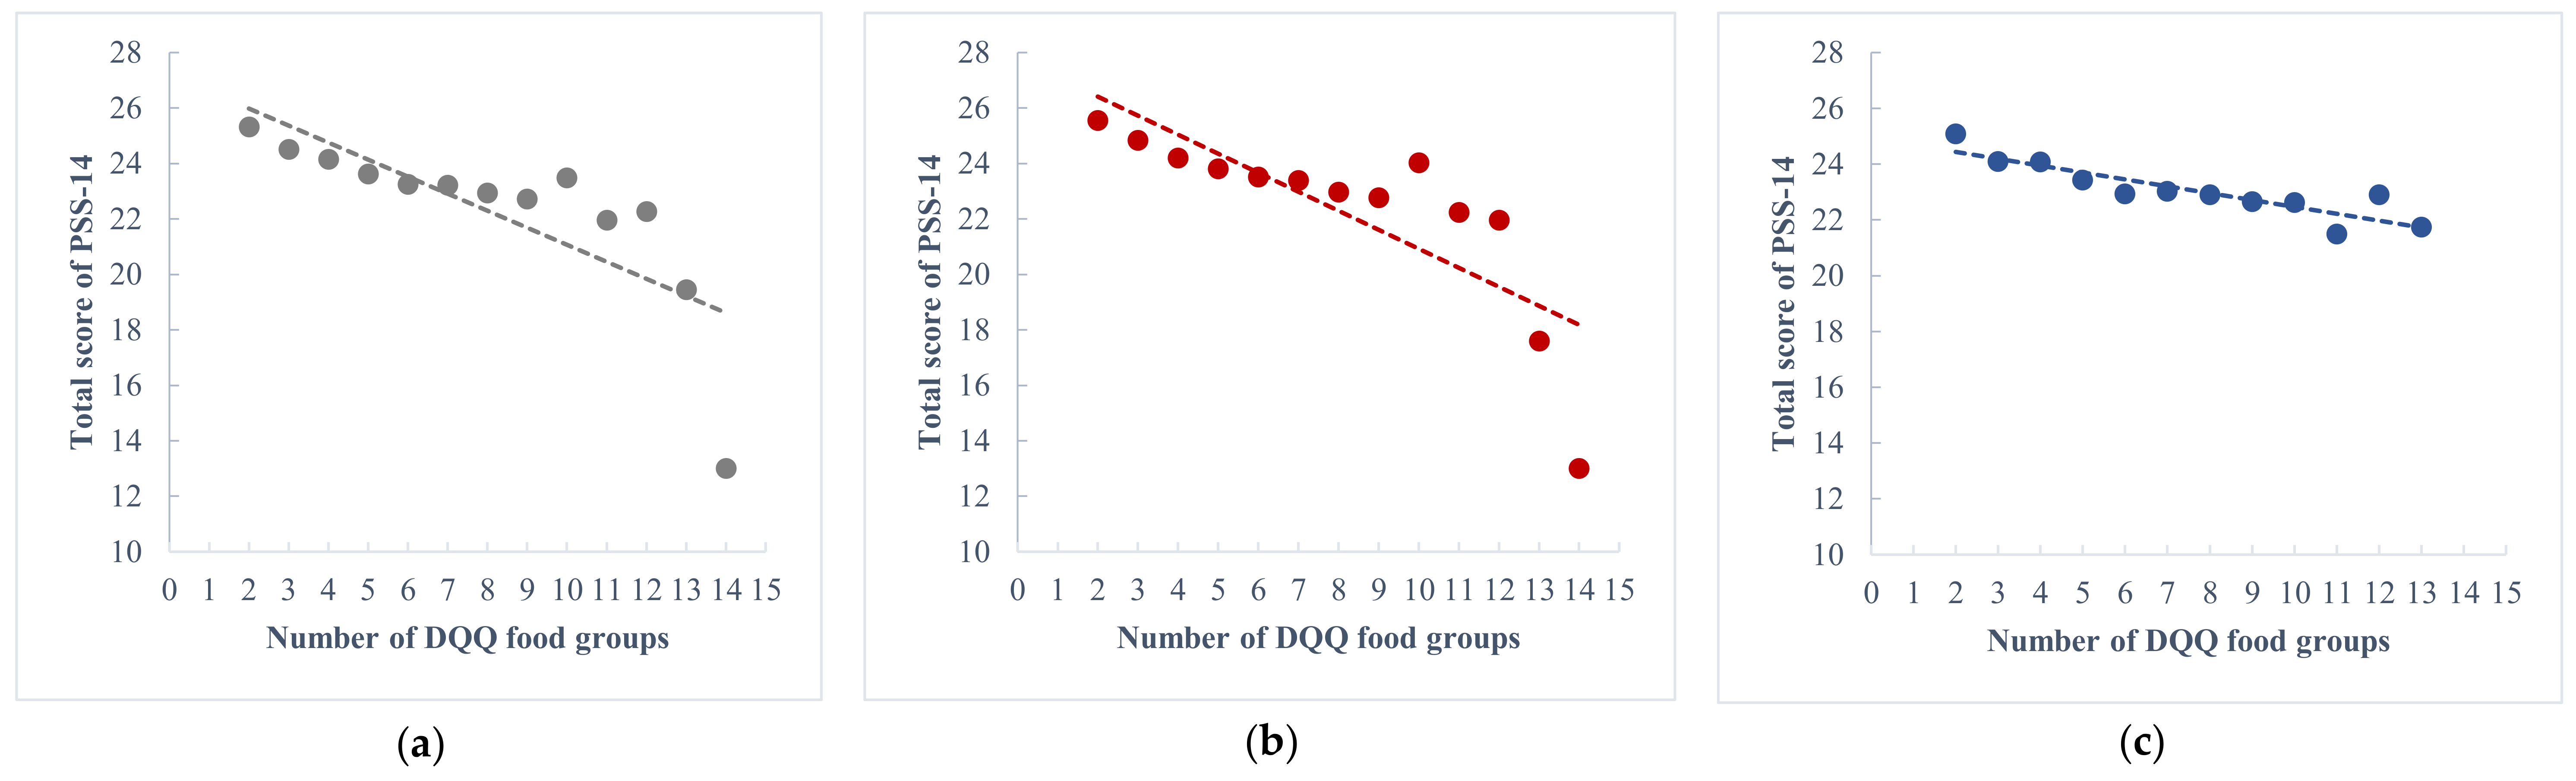
3.3. The Relationship between Dietary Diversity and Perceived Stress Level
4. Discussion
5. Strengths and Limitations
6. Conclusions
Author Contributions
Funding
Institutional Review Board Statement
Informed Consent Statement
Data Availability Statement
Acknowledgments
Conflicts of Interest
References
- GBD 2019 Mental Disorders Collaborators. Global, regional, and national burden of 12 mental disorders in 204 countries and territories, 1990–2019: A systematic analysis for the Global Burden of Disease Study 2019. Lancet Psychiatry 2022, 9, 137–150. [Google Scholar] [CrossRef]
- Vidal, E.J.; Alvarez, D.; Martinez-Velarde, D.; Vidal-Damas, L.; Yuncar-Rojas, K.A.; Julca-Malca, A.; Bernabe-Ortiz, A. Perceived stress and high fat intake: A study in a sample of undergraduate students. PLoS ONE 2018, 13, e0192827. [Google Scholar] [CrossRef] [PubMed]
- Bremner, J.D.; Moazzami, K.; Wittbrodt, M.T.; Nye, J.A.; Lima, B.B.; Gillespie, C.F.; Rapaport, M.H.; Pearce, B.D.; Shah, A.J.; Vaccarino, V. Diet, Stress and Mental Health. Nutrients 2020, 12, 2428. [Google Scholar] [CrossRef] [PubMed]
- McCabe, D.; Lisy, K.; Lockwood, C.; Colbeck, M. The impact of essential fatty acid, B vitamins, vitamin C, magnesium and zinc supplementation on stress levels in women: A systematic review. JBI Database Syst. Rev. Implement. Rep. 2017, 15, 402–453. [Google Scholar] [CrossRef]
- Li, Y.; Lv, M.R.; Wei, Y.J.; Sun, L.; Zhang, J.X.; Zhang, H.G.; Li, B. Dietary patterns and depression risk: A meta-analysis. Psychiatry Res. 2017, 253, 373–382. [Google Scholar] [CrossRef]
- Li, R.; Zong, Z.Y.; Gu, X.X.; Wang, D.N.; Dong, C.; Sun, C.; Zhao, R.; Gu, Z.F.; Gao, J.L. Higher dietary diversity as a protective factor against depression among older adults in China: A cross-sectional study. Ann. Palliat. Med. 2021, 11, 1278–1289. [Google Scholar] [CrossRef]
- Jesus, M.; Silva, T.; Cagigal, C.; Martins, V.; Silva, C. Dietary Patterns: A New Therapeutic Approach for Depression? Curr. Pharm. Biotechnol. 2019, 20, 123–129. [Google Scholar] [CrossRef]
- Brody, S.; Preut, R.; Schommer, K.; Schürmeyer, T.H. A randomized controlled trial of high dose ascorbic acid for reduction of blood pressure, cortisol, and subjective responses to psychological stress. Psychopharmacology 2002, 159, 319–324. [Google Scholar] [CrossRef]
- Soltani, H.; Keim, N.L.; Laugero, K.D. Diet Quality for Sodium and Vegetables Mediate Effects of Whole Food Diets on 8-Week Changes in Stress Load. Nutrients 2018, 10, 1606. [Google Scholar] [CrossRef]
- Long, S.J.; Benton, D. Effects of vitamin and mineral supplementation on stress, mild psychiatric symptoms, and mood in nonclinical samples: A meta-analysis. Psychosom. Med. 2013, 75, 144–153. [Google Scholar] [CrossRef]
- Hellhammer, J.; Fries, E.; Buss, C.; Engert, V.; Tuch, A.; Rutenberg, D.; Hellhammer, D. Effects of soy lecithin phosphatidic acid and phosphatidylserine complex (PAS) on the endocrine and psychological responses to mental stress. Stress 2004, 7, 119–126. [Google Scholar] [CrossRef]
- Wade, A.T.; Davis, C.R.; Dyer, K.A.; Hodgson, J.M.; Woodman, R.J.; Keage, H.A.D.; Murphy, K.J. A Mediterranean diet supplemented with dairy foods improves mood and processing speed in an Australian sample: Results from the MedDairy randomized controlled trial. Nutr. Neurosci. 2020, 23, 646–658. [Google Scholar] [CrossRef]
- Sánchez-Villegas, A.; Martínez-González, M.A.; Estruch, R.; Salas-Salvadó, J.; Corella, D.; Covas, M.I.; Arós, F.; Romaguera, D.; Gómez-Gracia, E.; Lapetra, J.; et al. Mediterranean dietary pattern and depression: The PREDIMED randomized trial. BMC Med. 2013, 11, 208. [Google Scholar] [CrossRef]
- Noah, L.; Morel, V.; Bertin, C.; Pouteau, E.; Macian, N.; Duale, C.; Pereira, B.; Pickering, G. Effect of a Combination of Magnesium, B Vitamins, Rhodiola, and Green Tea (L-Theanine) on Chronically Stressed Healthy Individuals-A Randomized, Placebo-Controlled Study. Nutrients 2022, 14, 1863. [Google Scholar] [CrossRef]
- Rashidkhani, B.; Gargari, B.P.; Ranjbar, F.; Zareiy, S.; Kargarnovin, Z. Dietary patterns and anthropometric indices among Iranian women with major depressive disorder. Psychiatry Res. 2013, 210, 115–120. [Google Scholar] [CrossRef]
- Merali, Z.; Graitson, S.; Mackay, J.C.; Kent, P. Stress and eating: A dual role for bombesin-like peptides. Front. Neurosci. 2013, 7, 193. [Google Scholar] [CrossRef]
- Poorrezaeian, M.; Siassi, F.; Qorbani, M.; Karimi, J.; Koohdani, F.; Asayesh, H.; Sotoudeh, G. Association of dietary diversity score with anxiety in women. Psychiatry Res. 2015, 230, 622–627. [Google Scholar] [CrossRef]
- Oldewage-Theron, W.H.; Kruger, R. Food variety and dietary diversity as indicators of the dietary adequacy and health status of an elderly population in Sharpeville, South Africa. J. Nutr. Elder. 2008, 27, 101–133. [Google Scholar] [CrossRef]
- De Oliveira Otto, M.C.; Anderson, C.A.M.; Dearborn, J.L.; Ferranti, E.P.; Mozaffarian, D.; Rao, G.; Wylie-Rosett, J.; Lichtenstein, A.H.L. American Heart Association Behavioral Change for Improving Health Factors Committee of the Council on, H. Cardiometabolic, et al. Dietary Diversity: Implications for Obesity Prevention in Adult Populations: A Science Advisory from the American Heart Association. Circulation 2018, 138, e160–e168. [Google Scholar]
- Azadbakht, L.; Esmaillzadeh, A. Dietary diversity score is related to obesity and abdominal adiposity among Iranian female youth. Public Health Nutr. 2010, 14, 62–69. [Google Scholar] [CrossRef]
- World Health Organization WHO. Healthy Diet. Available online: https://www.who.int/news-room/fact-sheets/detail/healthy-diet (accessed on 22 April 2021).
- Chinese Nutrition Society. The Chinese Dietary Guidelines, 4th ed.; People’s Health Publishing House: Beijing, China, 2016; pp. 1–298. ISBN 978-711-722-214-3. [Google Scholar]
- Otsuka, R.; Kato, Y.; Nishita, Y.; Tange, C.; Nakamoto, M.; Tomida, M.; Imai, T.; Ando, F.; Shimokata, H.; Suzuki, T. Dietary diversity and 14-year decline in higher-level functional capacity among middle-aged and elderly Japanese. Nutrition 2016, 32, 784–789. [Google Scholar] [CrossRef]
- Poorrezaeian, M.; Siassi, F.; Milajerdi, A.; Qorbani, M.; Karimi, J.; Sohrabi-Kabi, R.; Pak, N.; Sotoudeh, G. Depression is related to dietary diversity score in women: A cross-sectional study from a developing country. Ann. Gen. Psychiatry 2017, 16, 39. [Google Scholar] [CrossRef]
- Zheng, J.; Zhou, R.; Li, F.; Chen, L.; Wu, K.; Huang, J.; Liu, H.; Huang, Z.; Xu, L.; Yuan, Z.; et al. Association between dietary diversity and cognitive impairment among the oldest-old: Findings from a nationwide cohort study. Clin. Nutr. 2021, 40, 1452–1462. [Google Scholar] [CrossRef]
- Yin, Z.; Brasher, M.S.; Kraus, V.B.; Lv, Y.; Shi, X.; Zeng, Y. Dietary Diversity Was Positively Associated with Psychological Resilience among Elders: A Population-Based Study. Nutrients 2019, 11, 650. [Google Scholar] [CrossRef]
- Zhang, J.; Zhao, A. Dietary Diversity and Healthy Aging: A Prospective Study. Nutrients 2021, 13, 1787. [Google Scholar] [CrossRef]
- Salehi-Abargouei, A.; Akbari, F.; Bellissimo, N.; Azadbakht, L. Dietary diversity score and obesity: A systematic review and meta-analysis of observational studies. Eur. J. Clin. Nutr. 2015, 70, 1–9. [Google Scholar] [CrossRef]
- Herforth, A.; Steele, E.M.; Calixto, G.; Sattamini, I.; Olarte, D.; Ballard, T.; Monteiro, C. Development of a Diet Quality Questionnaire for Improved Measurement of Dietary Diversity and Other Diet Quality Indicators (P13-018-19). Curr. Dev. Nutr. 2019, 3, nzz036-P13. [Google Scholar] [CrossRef]
- Ma, S.; Herforth, A.W.; Vogliano, C.; Zou, Z. Most Commonly-Consumed Food Items by Food Group, and by Province, in China: Implications for Diet Quality Monitoring. Nutrients 2022, 14, 1754. [Google Scholar] [CrossRef]
- Zhang, B.; Zhai, F.Y.; Du, S.F.; Popkin, B.M. The China Health and Nutrition Survey, 1989–2011. Obes. Rev. 2014, 15 (Suppl. S1), 2–7. [Google Scholar] [CrossRef]
- Cao, B.; Zhao, Y.; Ren, Z.; McIntyre, R.S.; Teopiz, K.M.; Gao, X.; Ding, L. Are Physical Activities Associated With Perceived Stress? The Evidence From the China Health and Nutrition Survey. Front. Public Health 2021, 9, 697484. [Google Scholar] [CrossRef]
- Cohen, S.; Kamarck, T.; Mermelstein, R. A global measure of perceived stress. J. Health Soc. Behav. 1983, 24, 385–396. [Google Scholar] [CrossRef] [PubMed]
- Huang, F.; Wang, H.; Wang, Z.; Zhang, J.; Du, W.; Su, C.; Jia, X.; Ouyang, Y.; Wang, Y.; Li, L.; et al. Psychometric properties of the perceived stress scale in a community sample of Chinese. BMC Psychiatry 2020, 20, 130. [Google Scholar]
- Leng, M.; Wei, L.; Shi, X.; Cao, G.; Wei, Y.; Xu, H.; Zhang, X.; Zhang, W.; Xing, S.; Wei, H. Mental distress and influencing factors in nurses caring for patients with COVID-19. Nurs. Crit. Care 2020, 26, 94–101. [Google Scholar] [CrossRef] [PubMed]
- Zhai, F.Y.; Du, S.F.; Wang, Z.H.; Zhang, J.G.; Du, W.W.; Popkin, B.M. Dynamics of the Chinese diet and the role of urbanicity, 1991–2011. Obes. Rev. 2014, 15 (Suppl. S1), 16–26. [Google Scholar] [CrossRef]
- Zhai, F.; Guo, X.; Popkin, B.M.; Ma, L.; Wang, Q.; Shuigao, W.Y.; Ge, J.A.K. Evaluation of the 24-Hour Individual Recall Method in China. Food Nutr. Bull. 1996, 17, 1–7. [Google Scholar] [CrossRef]
- Yan, S.; Li, J.; Li, S.; Zhang, B.; Du, S.; Gordon-Larsen, P.; Adair, L.; Popkin, B. The expanding burden of cardiometabolic risk in China: The China Health and Nutrition Survey. Obes. Rev. 2012, 13, 810–821. [Google Scholar] [CrossRef]
- Herforth, A.W.; Wiesmann, D.; Martínez-Steele, E.; Andrade, G.; Monteiro, C.A. Introducing a Suite of Low-Burden Diet Quality Indicators That Reflect Healthy Diet Patterns at Population Level. Curr. Dev. Nutr. 2020, 4, nzaa168. [Google Scholar] [CrossRef]
- Popkin, B.M. Weights for the China Health and Nutrition Study. Available online: https://bbs.pinggu.org/a-2362260.html (accessed on 27 May 2022).
- Gonzalez, M.J.; Miranda-Massari, J.R. Diet and stress. Psychiatr. Clin. N. Am. 2014, 37, 579–589. [Google Scholar] [CrossRef]
- Stringham, N.T.; Holmes, P.V.; Stringham, J.M. Supplementation with macular carotenoids reduces psychological stress, serum cortisol, and sub-optimal symptoms of physical and emotional health in young adults. Nutr. Neurosci. 2017, 21, 286–296. [Google Scholar] [CrossRef]
- Willette, A.A.; Coe, C.L.; Colman, R.J.; Bendlin, B.B.; Kastman, E.K.; Field, A.S.; Alexander, A.L.; Allison, D.B.; Weindruch, R.H.; Johnson, S.C. Calorie restriction reduces psychological stress reactivity and its association with brain volume and microstructure in aged rhesus monkeys. Psychoneuroendocrinology 2012, 37, 903–916. [Google Scholar] [CrossRef]
- Shively, C.A.; Appt, S.E.; Chen, H.; Day, S.M.; Frye, B.M.; Shaltout, H.A.; Silverstein-Metzler, M.G.; Snyder-Mackler, N.; Uberseder, B.; Vitolins, M.Z.; et al. Mediterranean diet, stress resilience, and aging in nonhuman primates. Neurobiol. Stress 2020, 13, 100254. [Google Scholar] [CrossRef]
- Mika, A.; Day, H.E.; Martinez, A.; Rumian, N.L.; Greenwood, B.N.; Chichlowski, M.; Berg, B.M.; Fleshner, M. Early life diets with prebiotics and bioactive milk fractions attenuate the impact of stress on learned helplessness behaviours and alter gene expression within neural circuits important for stress resistance. Eur. J. Neurosci. 2016, 45, 342–357. [Google Scholar] [CrossRef]
- Ramsden, C.E.; Zamora, D.; Makriyannis, A.; Wood, J.T.; Mann, J.D.; Faurot, K.R.; MacIntosh, B.A.; Majchrzak-Hong, S.F.; Gross, J.R.; Courville, A.B.; et al. Diet-induced changes in n-3- and n-6-derived endocannabinoids and reductions in headache pain and psychological distress. J. Pain 2015, 16, 707–716. [Google Scholar] [CrossRef]
- Wang, C.C.; Du, L.; Shi, H.H.; Ding, L.; Yanagita, T.; Xue, C.H.; Wang, Y.M.; Zhang, T.T. Dietary EPA-Enriched Phospholipids Alleviate Chronic Stress and LPS-Induced Depression and Anxiety-Like Behavior by Regulating Immunity and Neuroinflammation. Mol. Nutr. Food Res. 2021, 65, e2100009. [Google Scholar] [CrossRef]
- Jaatinen, N.; Korpela, R.; Poussa, T.; Turpeinen, A.; Mustonen, S.; Merilahti, J.; Peuhkuri, K. Effects of daily intake of yoghurt enriched with bioactive components on chronic stress responses: A double-blinded randomized controlled trial. Int. J. Food Sci. Nutr. 2014, 65, 507–514. [Google Scholar] [CrossRef]
- Marquez-Morales, L.; El-Kassis, E.G.; Cavazos-Arroyo, J.; Rocha-Rocha, V.; Martinez-Gutierrez, F.; Perez-Armendariz, B. Effect of the Intake of a Traditional Mexican Beverage Fermented with Lactic Acid Bacteria on Academic Stress in Medical Students. Nutrients 2021, 13, 1551. [Google Scholar] [CrossRef]
- Stough, C.; Simpson, T.; Lomas, J.; McPhee, G.; Billings, C.; Myers, S.; Oliver, C.; Downey, L.A. Reducing occupational stress with a B-vitamin focussed intervention: A randomized clinical trial: Study protocol. Nutr. J. 2014, 13, 122. [Google Scholar] [CrossRef]
- Helms, E.R.; Zinn, C.; Rowlands, D.S.; Naidoo, R.; Cronin, J. High-protein, low-fat, short-term diet results in less stress and fatigue than moderate-protein moderate-fat diet during weight loss in male weightlifters: A pilot study. Int. J. Sport Nutr. Exerc. Metab. 2015, 25, 163–170. [Google Scholar] [CrossRef]
- Yanguas-Casas, N.; Torres, C.; Crespo-Castrillo, A.; Diaz-Pacheco, S.; Healy, K.; Stanton, C.; Chowen, J.A.; Garcia-Segura, L.M.; Arevalo, M.A.; Cryan, J.F.; et al. High-fat diet alters stress behavior, inflammatory parameters and gut microbiota in Tg APP mice in a sex-specific manner. Neurobiol. Dis. 2021, 159, 105495. [Google Scholar] [CrossRef]
- Faghih, S.; Babajafari, S.; Mirzaei, A.; Akhlaghi, M. Adherence to the dietary approaches to stop hypertension (DASH) dietary pattern and mental health in Iranian university students. Eur. J. Nutr. 2020, 59, 1001–1011. [Google Scholar] [CrossRef]
- Zeeni, N.; Daher, C.; Fromentin, G.; Tome, D.; Darcel, N.; Chaumontet, C. A cafeteria diet modifies the response to chronic variable stress in rats. Stress 2012, 16, 211–219. [Google Scholar] [CrossRef] [PubMed]
- Lassale, C.; Batty, G.D.; Baghdadli, A.; Jacka, F.; Sánchez-Villegas, A.; Kivimäki, M.; Akbaraly, T. Healthy dietary indices and risk of depressive outcomes: A systematic review and meta-analysis of observational studies. Mol. Psychiatry 2019, 24, 965–986. [Google Scholar] [CrossRef] [PubMed]
- Askari, M.; Daneshzad, E.; Mofrad, M.D.; Bellissimo, N.; Suitor, K.; Azadbakht, L. Vegetarian diet and the risk of depression, anxiety, and stress symptoms: A systematic review and meta-analysis of observational studies. Crit. Rev. Food Sci. Nutr. 2022, 62, 261–271. [Google Scholar] [CrossRef] [PubMed]
- Molla, W.; Adem, D.A.; Tilahun, R.; Shumye, S.; Kabthymer, R.H.; Kebede, D.; Mengistu, N.; Ayele, G.M.; Assefa, D.G. Dietary diversity and associated factors among children (6–23 months) in Gedeo zone, Ethiopia: Cross-sectional study. Ital. J. Pediatr. 2021, 47, 233. [Google Scholar] [CrossRef]
- Jiang, W.; Mo, M.; Li, M.; Wang, S.; Muyiduli, X.; Shao, B.; Jiang, S.; Yu, Y. The relationship of dietary diversity score with depression and anxiety among prenatal and post-partum women. J. Obstet. Gynaecol. Res. 2018, 44, 1929–1936. [Google Scholar] [CrossRef]
- Li, S.; Chen, K.; Liu, C.; Bi, J.; He, Z.; Luo, R.; Yu, Y.; Wang, Z. Dietary diversity and mental health in preschoolers in rural China. Public Health Nutr. 2020, 24, 1869–1876. [Google Scholar] [CrossRef]
- Wang, J.; Um, P.; Dickerman, B.A.; Liu, J. Zinc, Magnesium, Selenium and Depression: A Review of the Evidence, Potential Mechanisms and Implications. Nutrients 2018, 10, 584. [Google Scholar] [CrossRef]
- Beezhold, B.L.; Johnston, C.S. Restriction of meat, fish, and poultry in omnivores improves mood: A pilot randomized controlled trial. Nutr. J. 2012, 11, 9. [Google Scholar] [CrossRef]
- Muñoz, M.A.; Fíto, M.; Marrugat, J.; Covas, M.I.; Schröder, H. Adherence to the Mediterranean diet is associated with better mental and physical health. Br. J. Nutr. 2009, 101, 1821–1827. [Google Scholar] [CrossRef]
- Abshirini, M.; Siassi, F.; Koohdani, F.; Qorbani, M.; Mozaffari, H.; Aslani, Z.; Soleymani, M.; Entezarian, M.; Sotoudeh, G. Dietary total antioxidant capacity is inversely associated with depression, anxiety and some oxidative stress biomarkers in postmenopausal women: A cross-sectional study. Ann. Gen. Psychiatry 2019, 18, 3. [Google Scholar] [CrossRef]
- Chen, Y.; Feng, X.; Hu, X.; Sha, J.; Li, B.; Zhang, H.; Fan, H. Dexmedetomidine Ameliorates Acute Stress-Induced Kidney Injury by Attenuating Oxidative Stress and Apoptosis through Inhibition of the ROS/JNK Signaling Pathway. Oxid. Med. Cell. Longev. 2018, 2018, 4035310. [Google Scholar] [CrossRef]
- Johnson, A.J.; Howell, B.R. Dietary diversity contributes to microbiome associations in autism. Cell Metab. 2021, 33, 2311–2313. [Google Scholar] [CrossRef]
- Winter, G.; Hart, R.A.; Charlesworth, R.P.G.; Sharpley, C.F. Gut microbiome and depression: What we know and what we need to know. Rev. Neurosci. 2018, 29, 629–643. [Google Scholar] [CrossRef]

| Variables n (%) or Median (Quartile) | Total Participants (n = 7434) | Lower Psychological Stress Group (n = 4204) | Higher Psychological Stress Group (n = 3230) | Z/ϰ2 | p |
|---|---|---|---|---|---|
| Age in 2011 | 51.00 (41.00–60.00) | 51.00 (41.00–60.00) | 52.00 (41.00–61.00) | 1.1303 | 0.2584 |
| Age in 2015 | 55.00 (45.00–65.00) | 55.00 (45.00–64.00) | 56.00 (45.00–65.00) | 1.1444 | 0.2525 |
| Gender | 9.6049 | 0.0019 | |||
| Male | 3464 (46.60) | 2025 (48.17) | 1439 (44.55) | ||
| Female | 3970 (53.40) | 2179 (51.83) | 1791 (55.45) | ||
| Marital status in 2011 | 9.5294 | 0.0230 | |||
| Never married | 286 (3.86) | 171 (4.07) | 115 (3.56) | ||
| Married | 6530 (88.14) | 3712 (88.30) | 2818 (87.24) | ||
| Divorced/Separated/Widowed | 593 (8.00) | 304 (7.23) | 289 (8.95) | ||
| Marital status in 2015 | 11.6203 | 0.0088 | |||
| Never married | 184 (2.48) | 110 (2.62) | 74 (2.29) | ||
| Married | 6596 (88.97) | 3764 (89.53) | 2832 (87.68) | ||
| Divorced/Separated/Widowed | 634 (8.55) | 321 (7.64) | 313 (9.69) | ||
| BMI in 2011 | 23.70 (21.45–26.15) | 23.80 (21.49–26.26) | 23.61 (21.36–26.03) | −2.6582 | 0.0079 |
| BMI categories in 2011 | 13.7777 | 0.0032 | |||
| Normal weight | 3555 (49.01) | 2013 (48.84) | 1542 (49.23) | ||
| Obesity | 922 (12.71) | 545 (13.22) | 377 (12.04) | ||
| Overweight | 2457 (33.87) | 1412 (34.26) | 1045 (33.37) | ||
| Underweight | 320 (4.41) | 152 (3.69) | 168 (5.36) | ||
| BMI in 2015 | 24.09 (21.82–26.52) | 24.13 (21.89–26.52) | 24.07 (21.75–26.52) | −1.3582 | 0.1744 |
| BMI categories in 2015 | 4.8868 | 0.1803 | |||
| Normal weight | 2986 (44.68) | 1709 (44.91) | 1277 (44.37) | ||
| Obesity | 968 (14.48) | 571 (15.01) | 397 (13.79) | ||
| Overweight | 2454 (36.72) | 1382 (36.32) | 1072 (37.25) | ||
| Underweight | 275 (4.11) | 143 (3.76) | 132 (4.59) | ||
| Residence | 53.6550 | <0.0001 | |||
| Rural | 4563 (61.38) | 2428 (57.75) | 2135 (66.10) | ||
| Urban | 2871 (38.62) | 1776 (42.25) | 1095 (33.90) | ||
| Province | 229.9176 | <0.0001 | |||
| Beijing | 702 (9.44) | 413 (9.82) | 289 (8.95) | ||
| Chongqing | 548 (7.37) | 240 (5.71) | 308 (9.54) | ||
| Guangxi | 606 (8.15) | 293 (6.97) | 313 (9.69) | ||
| Guizhou | 613 (8.25) | 296 (7.04) | 317 (9.81) | ||
| Heilongjiang | 518 (6.97) | 294 (6.99) | 224 (6.93) | ||
| Henan | 602 (8.1) | 316 (7.52) | 286 (8.85) | ||
| Hubei | 610 (8.21) | 314 (7.47) | 296 (9.16) | ||
| Hunan | 561 (7.55) | 304 (7.23) | 257 (7.96) | ||
| Jiangsu | 759 (10.21) | 493 (11.73) | 266 (8.24) | ||
| Liaoning | 608 (8.18) | 460 (10.94) | 148 (4.58) | ||
| Shandong | 569 (7.65) | 292 (6.95) | 277 (8.58) | ||
| Shanghai | 738 (9.93) | 489 (11.63) | 249 (7.71) | ||
| Urbanization index in 2011 | 73.84 (54.55–88.93) | 77.18 (56.16–89.77) | 68.92 (53.08–87.88) | −8.0879 | <0.0001 |
| Weight in 2011, kg | 61.40 (54.50–70.00) | 62.25 (55.00–70.20) | 60.40 (53.50–68.60) | −6.4470 | <0.0001 |
| Height in 2011, cm | 161.00 (155.50–167.80) | 162.00 (156.00–168.00) | 160.00 (154.90–166.60) | −7.0626 | <0.0001 |
| WC in 2011, cm | 84.00 (77.00–91.10) | 84.50 (77.00–91.70) | 83.20 (76.50–90.60) | −3.1637 | 0.0016 |
| Urbanization index in 2015 | 77.08 (60.12–87.60) | 79.74 (61.02–88.55) | 73.57 (57.97–86.98) | −7.9719 | <0.0001 |
| Weight in 2015, kg | 62.30 (55.00–70.40) | 62.90 (55.70–71.00) | 61.60 (54.20–69.80) | −4.8665 | <0.0001 |
| Height in 2015, cm | 160.70 (155.00–167.10) | 161.50 (155.80–168.00) | 160.00 (154.00–166.00) | −6.5127 | <0.0001 |
| WC in 2015, cm | 85.00 (78.00–92.50) | 85.60 (78.50–93.00) | 85.00 (77.35–92.00) | −2.7671 | 0.0057 |
| Cumulative average dietary intake | |||||
| Energy, kcal/day | 1835.11 (1407.41–2359.90) | 1841.62 (1407.83–2385.35) | 1820.19 (1407.40–2329.92) | −1.0028 | 0.3159 |
| Protein, g/day | 63.04 (46.23–84.70) | 63.99 (46.85–86.02) | 61.62 (45.56–82.87) | −3.7050 | 0.0002 |
| Carbohydrate, g/day | 255.30 (184.39–342.15) | 255.12 (181.50–340.87) | 255.91 (186.87–344.86) | 1.2833 | 0.1994 |
| Fat, g/day | 58.90 (35.97–87.89) | 59.85 (37.24–89.23) | 58.05 (34.05–86.01) | −2.9658 | 0.0030 |
| Calcium, mg/day | 363.27 (241.08–539.65) | 376.55 (248.32–561.32) | 345.63 (232.72–512.31) | −5.4703 | <0.0001 |
| Sodium, mg/day | 3761.39 (2655.46–5272.83) | 3781.94 (2662.10–5307.16) | 3740.80 (2648.67–5230.20) | −0.6063 | 0.5443 |
| Variables | Lower Psychological Stress Group | Higher Psychological Stress Group | Z | p |
|---|---|---|---|---|
| Dietary diversity (Number of DQQ food groups) | 7.1100 | <0.0001 | ||
| 2 | 51 (1.21) | 68 (2.11) | ||
| 3 | 268 (6.37) | 290 (8.98) | ||
| 4 | 580 (13.80) | 534 (16.53) | ||
| 5 | 822 (19.55) | 650 (20.12) | ||
| 6 | 924 (21.98) | 658 (20.37) | ||
| 7 | 722 (17.17) | 516 (15.98) | ||
| 8 | 430 (10.23) | 286 (8.85) | ||
| 9 | 242 (5.76) | 130 (4.02) | ||
| ≥10 | 165 (3.92) | 98 (3.03) | ||
| 10 | 86 (2.05) | 63 (1.95) | ||
| 11 | 51 (1.21) | 23 (0.71) | ||
| 12 | 20 (0.48) | 10 (0.31) | ||
| 13 | 7 (0.17) | 2 (0.06) | ||
| 14 | 1 (0.02) | 0 (0.00) |
| Parameter | df | Estimate | Standard Error | Wald ϰ2 | p | OR | 95%CI |
|---|---|---|---|---|---|---|---|
| Intercept | 1 | 0.9343 | 0.2950 | 10.0287 | 0.0015 | ||
| BMI categories in 2015 | |||||||
| Normal weight | Ref | ||||||
| Obesity | 1 | −0.0679 | 0.0757 | 0.8035 | 0.3701 | 0.934 | 0.806, 1.084 |
| Overweight | 1 | 0.0586 | 0.0555 | 1.1128 | 0.2915 | 1.060 | 0.951, 1.182 |
| Underweight | 1 | 0.1769 | 0.1274 | 1.9280 | 0.1650 | 1.194 | 0.930, 1.532 |
| Gender | |||||||
| Female | Ref | ||||||
| Male | 1 | −0.1579 | 0.0507 | 9.6983 | 0.0018 | 0.854 | 0.773, 0.943 |
| Marital status in 2015 | |||||||
| Never married | Ref | ||||||
| Married | 1 | −0.1336 | 0.1784 | 0.5604 | 0.4541 | 0.875 | 0.617, 1.241 |
| Divorced/Separated/Widowed | 1 | 0.000463 | 0.2044 | 0.0000 | 0.9982 | 1.000 | 0.670, 1.493 |
| Age | 1 | 0.000727 | 0.00201 | 0.1314 | 0.7170 | 1.001 | 0.997, 1.005 |
| Urbanization index | 1 | −0.00836 | 0.00160 | 27.3869 | <0.0001 | 0.992 | 0.989, 0.995 |
| Dietary diversity (Number of DQQ food groups) | |||||||
| ≤2 | Ref | ||||||
| 3 | 1 | −0.2118 | 0.2251 | 0.8850 | 0.3468 | 0.809 | 0.521, 1.258 |
| 4 | 1 | −0.3943 | 0.2155 | 3.3469 | 0.0673 | 0.674 | 0.442, 1.029 |
| 5 | 1 | −0.4587 | 0.2143 | 4.5814 | 0.0323 | 0.632 | 0.415, 0.962 |
| 6 | 1 | −0.5350 | 0.2149 | 6.1944 | 0.0128 | 0.586 | 0.384, 0.893 |
| 7 | 1 | −0.5036 | 0.2170 | 5.3890 | 0.0203 | 0.604 | 0.395, 0.925 |
| 8 | 1 | −0.4899 | 0.2241 | 4.7768 | 0.0288 | 0.613 | 0.395, 0.951 |
| 9 | 1 | −0.7331 | 0.2404 | 9.3010 | 0.0023 | 0.480 | 0.300, 0.770 |
| ≥10 | 1 | −0.6858 | 0.2513 | 7.4484 | 0.0063 | 0.504 | 0.308, 0.824 |
Publisher’s Note: MDPI stays neutral with regard to jurisdictional claims in published maps and institutional affiliations. |
© 2022 by the authors. Licensee MDPI, Basel, Switzerland. This article is an open access article distributed under the terms and conditions of the Creative Commons Attribution (CC BY) license (https://creativecommons.org/licenses/by/4.0/).
Share and Cite
Zhou, J.; Wang, H.; Zou, Z. Inverse Association between Dietary Diversity Score Calculated from the Diet Quality Questionnaire and Psychological Stress in Chinese Adults: A Prospective Study from China Health and Nutrition Survey. Nutrients 2022, 14, 3297. https://doi.org/10.3390/nu14163297
Zhou J, Wang H, Zou Z. Inverse Association between Dietary Diversity Score Calculated from the Diet Quality Questionnaire and Psychological Stress in Chinese Adults: A Prospective Study from China Health and Nutrition Survey. Nutrients. 2022; 14(16):3297. https://doi.org/10.3390/nu14163297
Chicago/Turabian StyleZhou, Jia, Huan Wang, and Zhiyong Zou. 2022. "Inverse Association between Dietary Diversity Score Calculated from the Diet Quality Questionnaire and Psychological Stress in Chinese Adults: A Prospective Study from China Health and Nutrition Survey" Nutrients 14, no. 16: 3297. https://doi.org/10.3390/nu14163297
APA StyleZhou, J., Wang, H., & Zou, Z. (2022). Inverse Association between Dietary Diversity Score Calculated from the Diet Quality Questionnaire and Psychological Stress in Chinese Adults: A Prospective Study from China Health and Nutrition Survey. Nutrients, 14(16), 3297. https://doi.org/10.3390/nu14163297