
The Influence of Food Environments on Food Security Resilience during the COVID-19 Pandemic: An Examination of Urban and Rural Difference in Kenya

 and
and
Abstract
:1. Introduction
2. Materials and Methods
2.1. Overview of Study and Study Setting
2.2. Sample Population
2.3. Survey Instrument
2.4. Data Collection
2.5. Data Analysis
2.6. Ethical Considerations
3. Results
3.1. Demographic
3.2. Influence of COVID-19 on Agricultural Practices and Livelihood
3.2.1. Agricultural Practices
3.2.2. Livelihood
3.3. Perceived Influence of the COVID-19 Pandemic on Food Environment Attributes
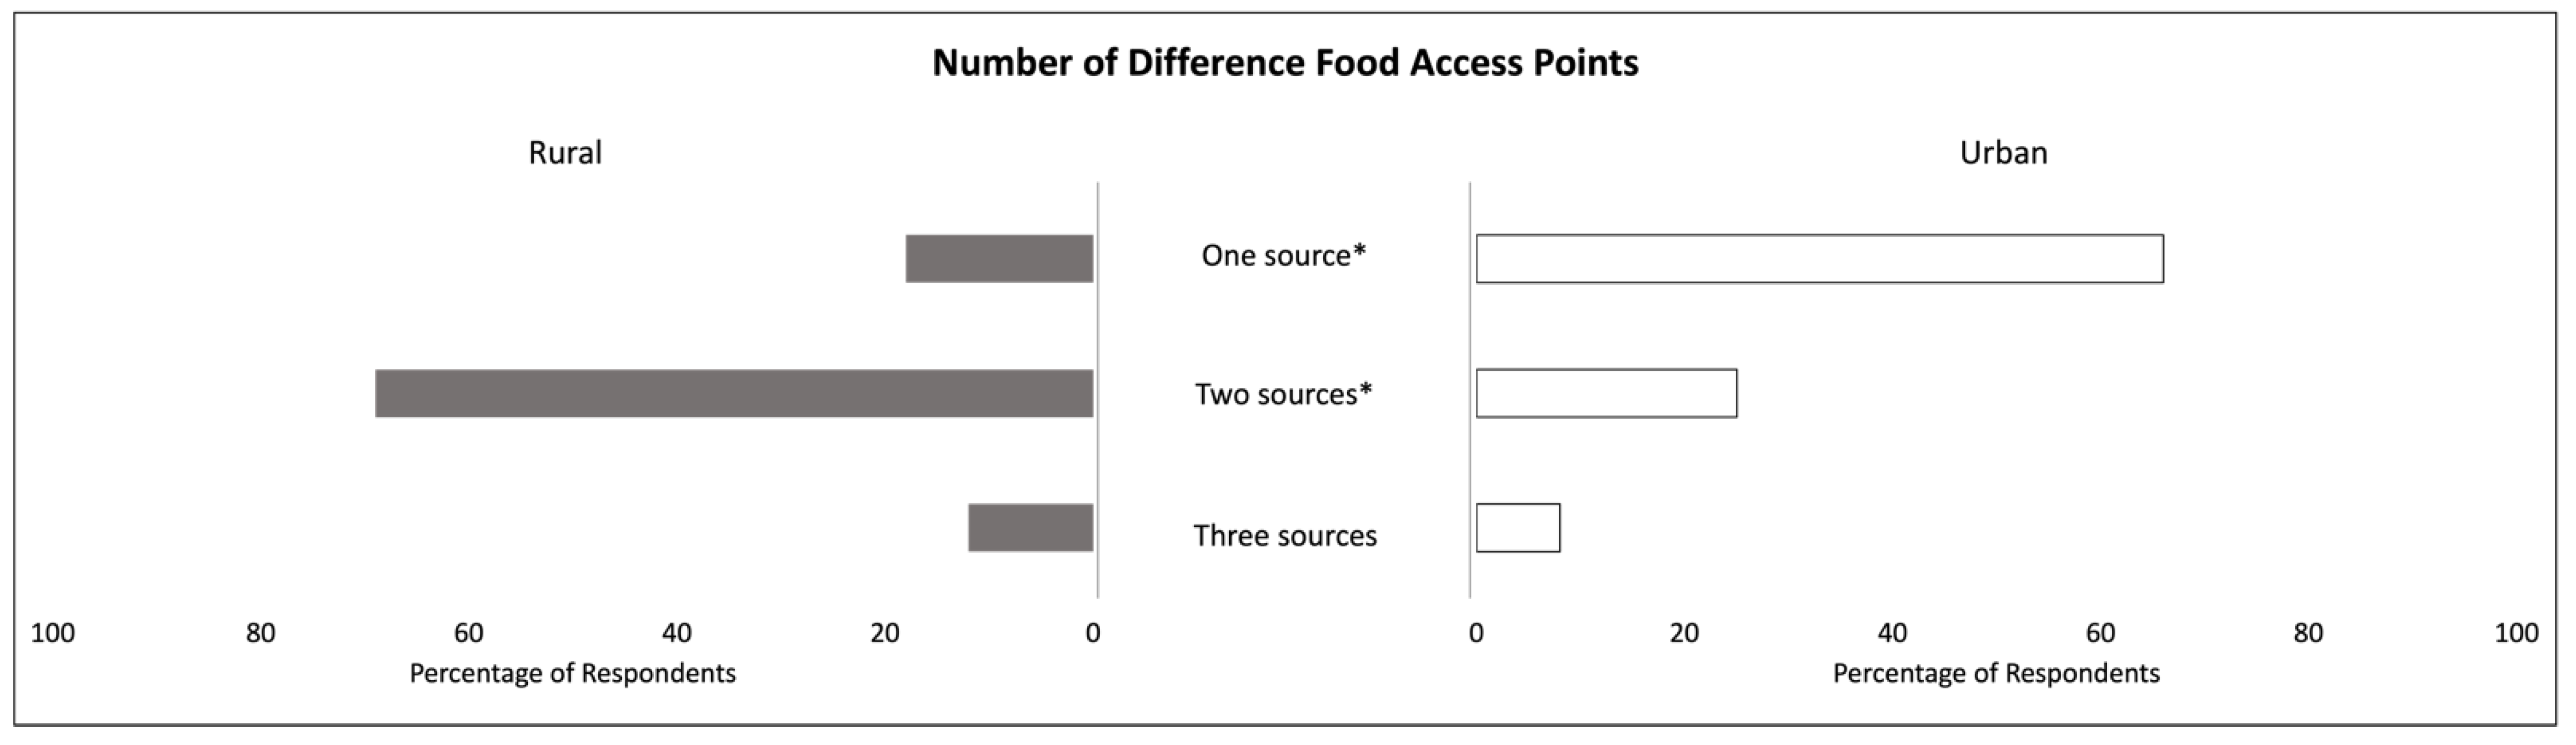
3.3.1. Access to Different Types of Food Environments
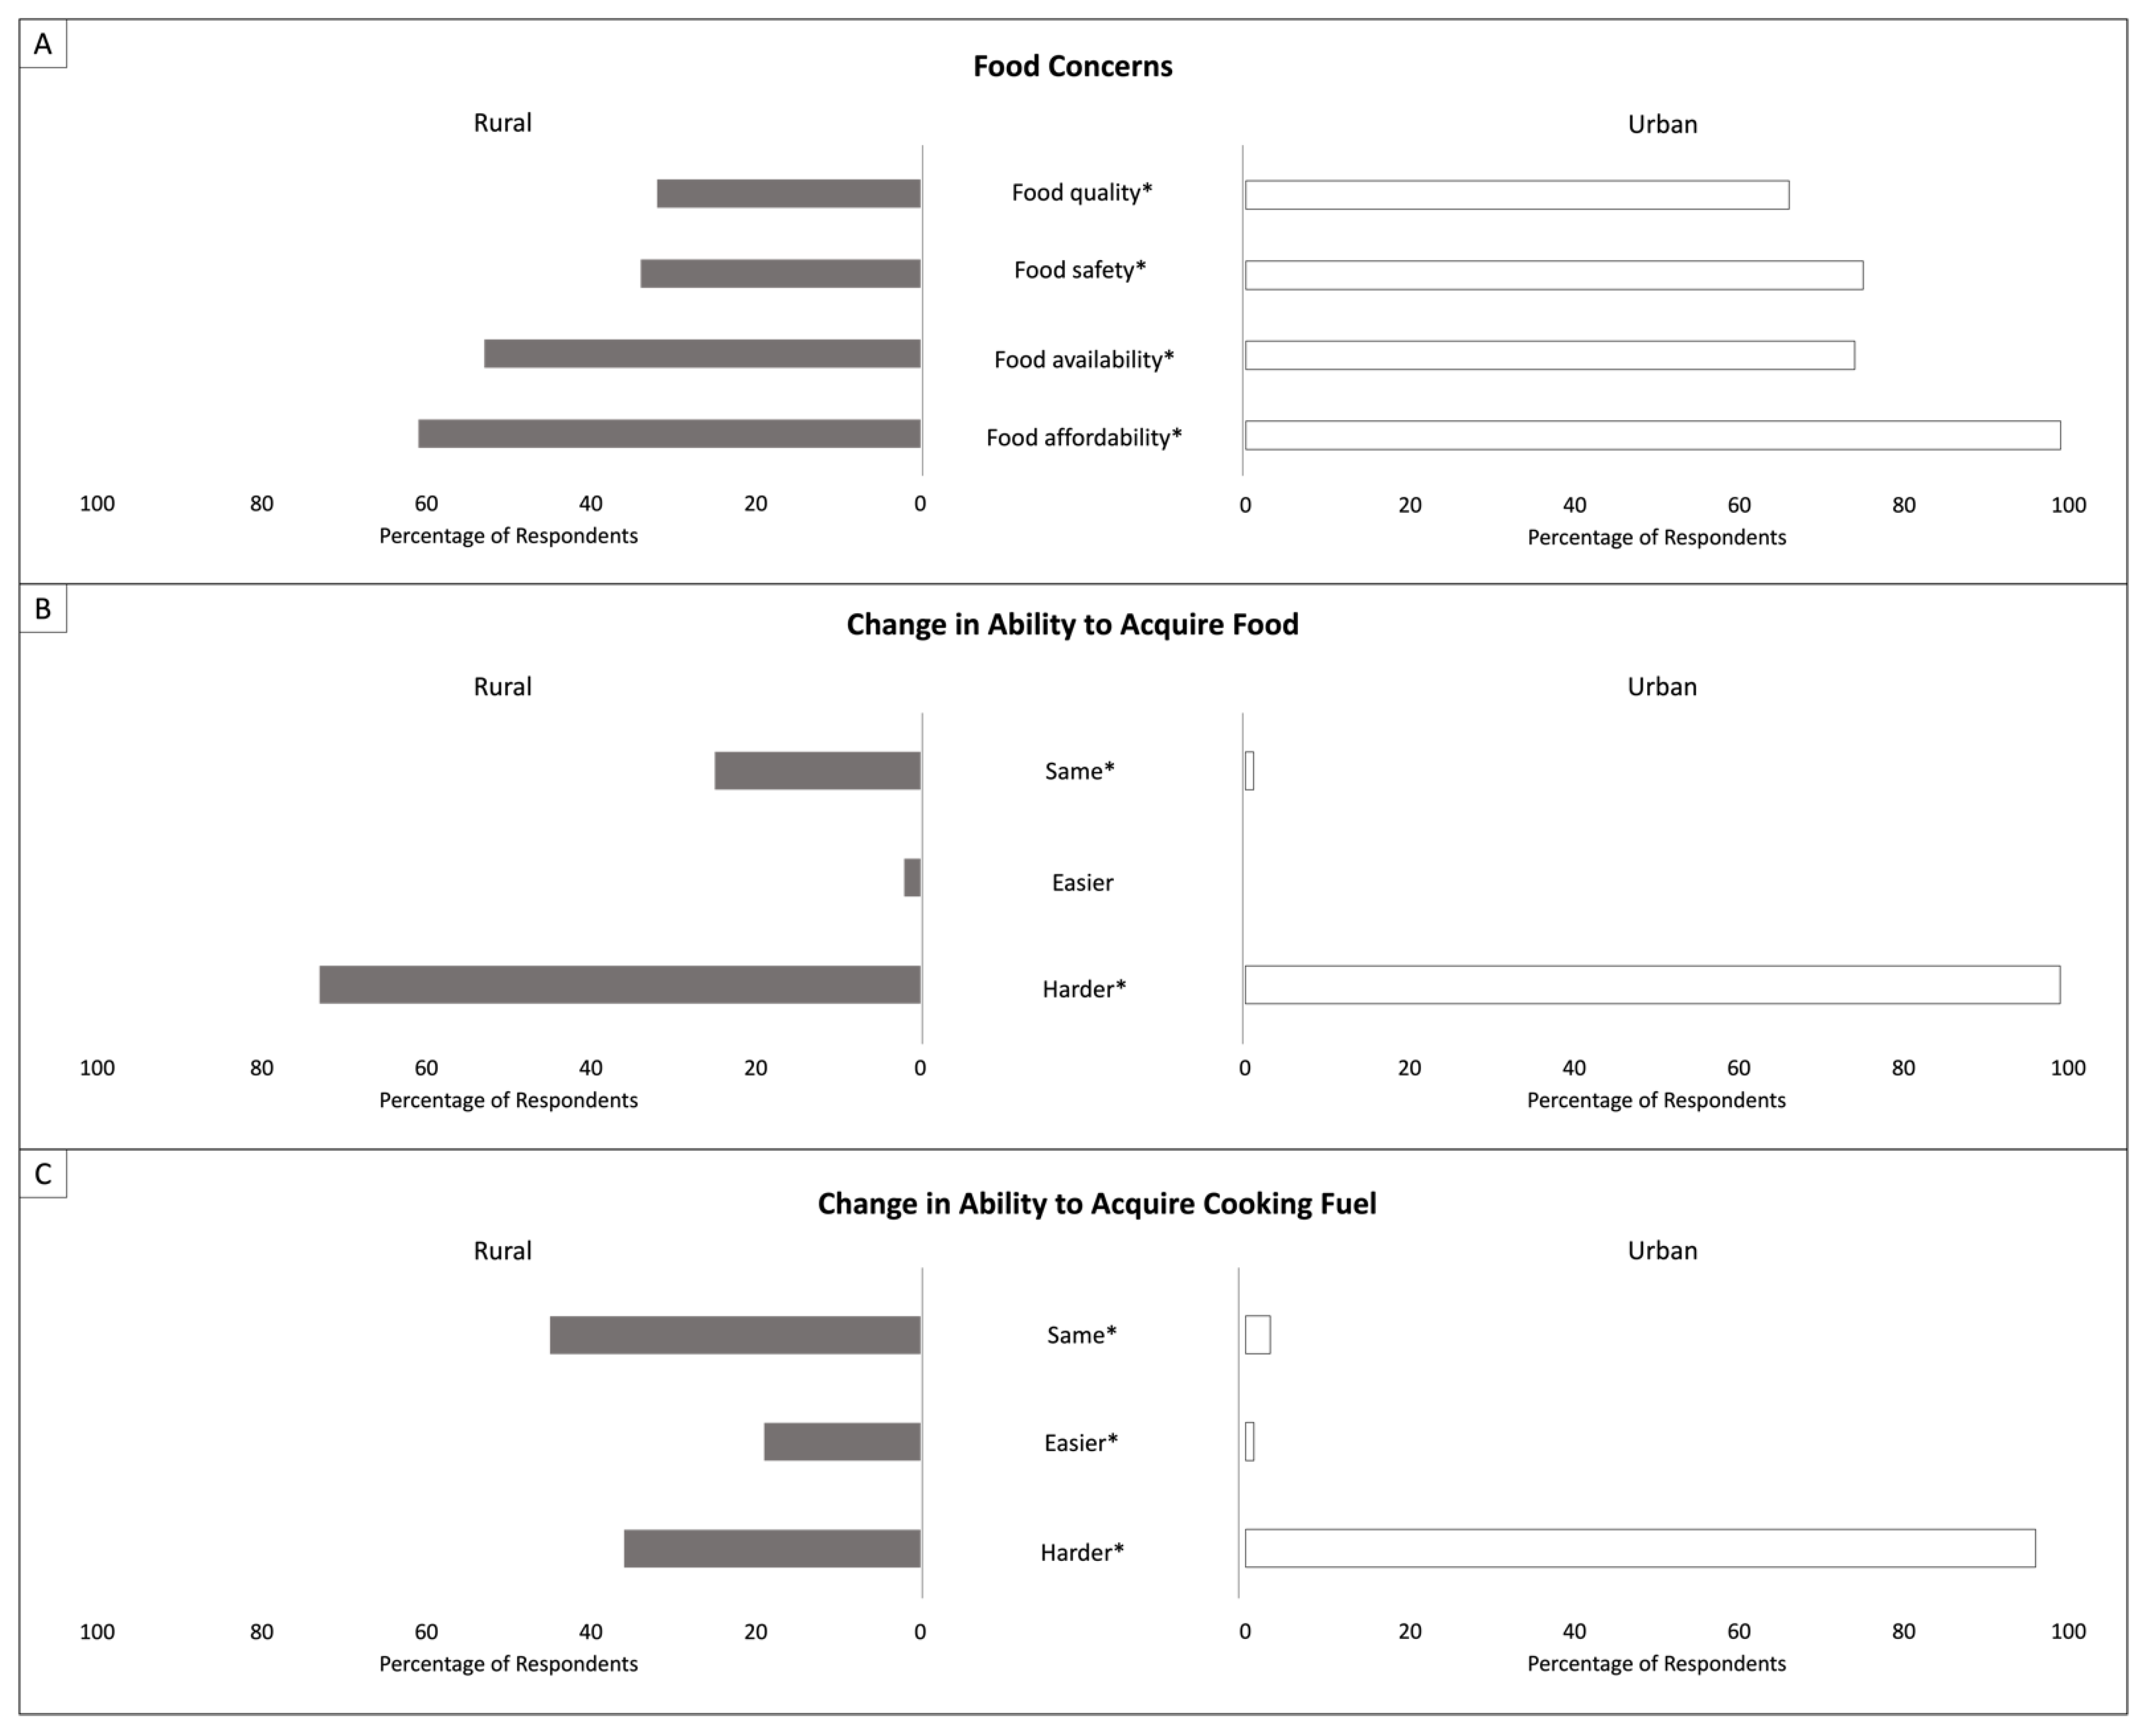
3.3.2. Food Accessibility and Price
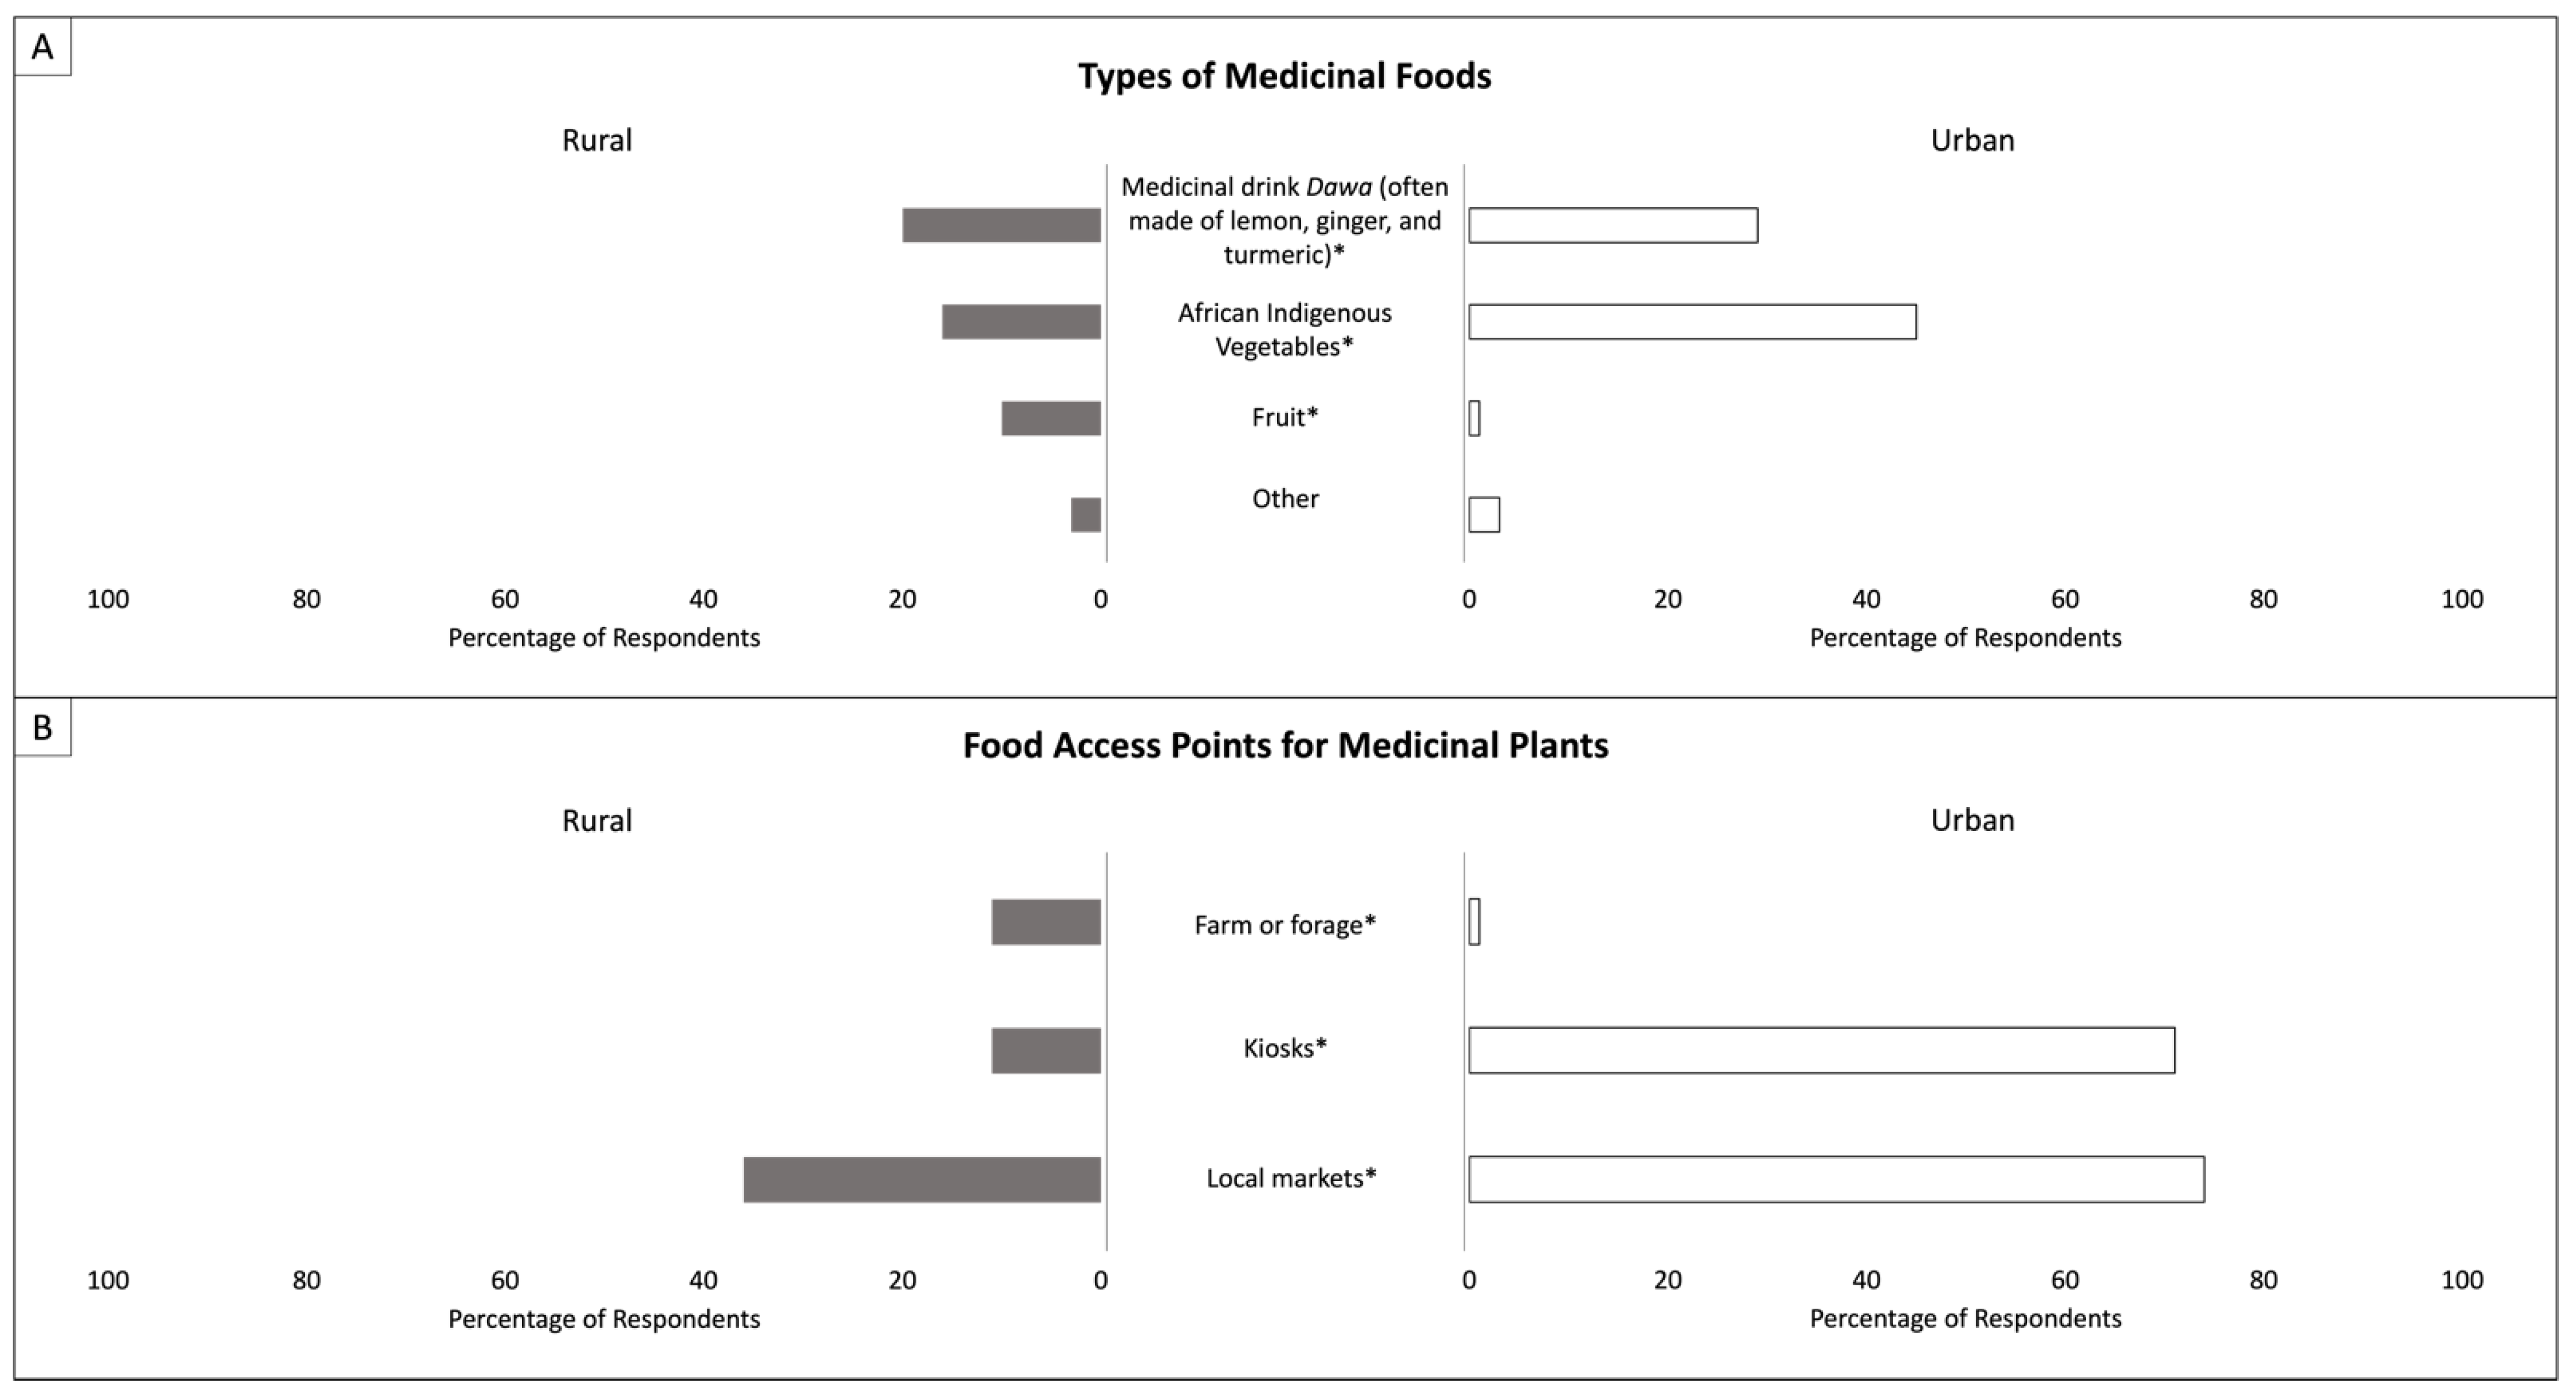
3.3.3. Diets
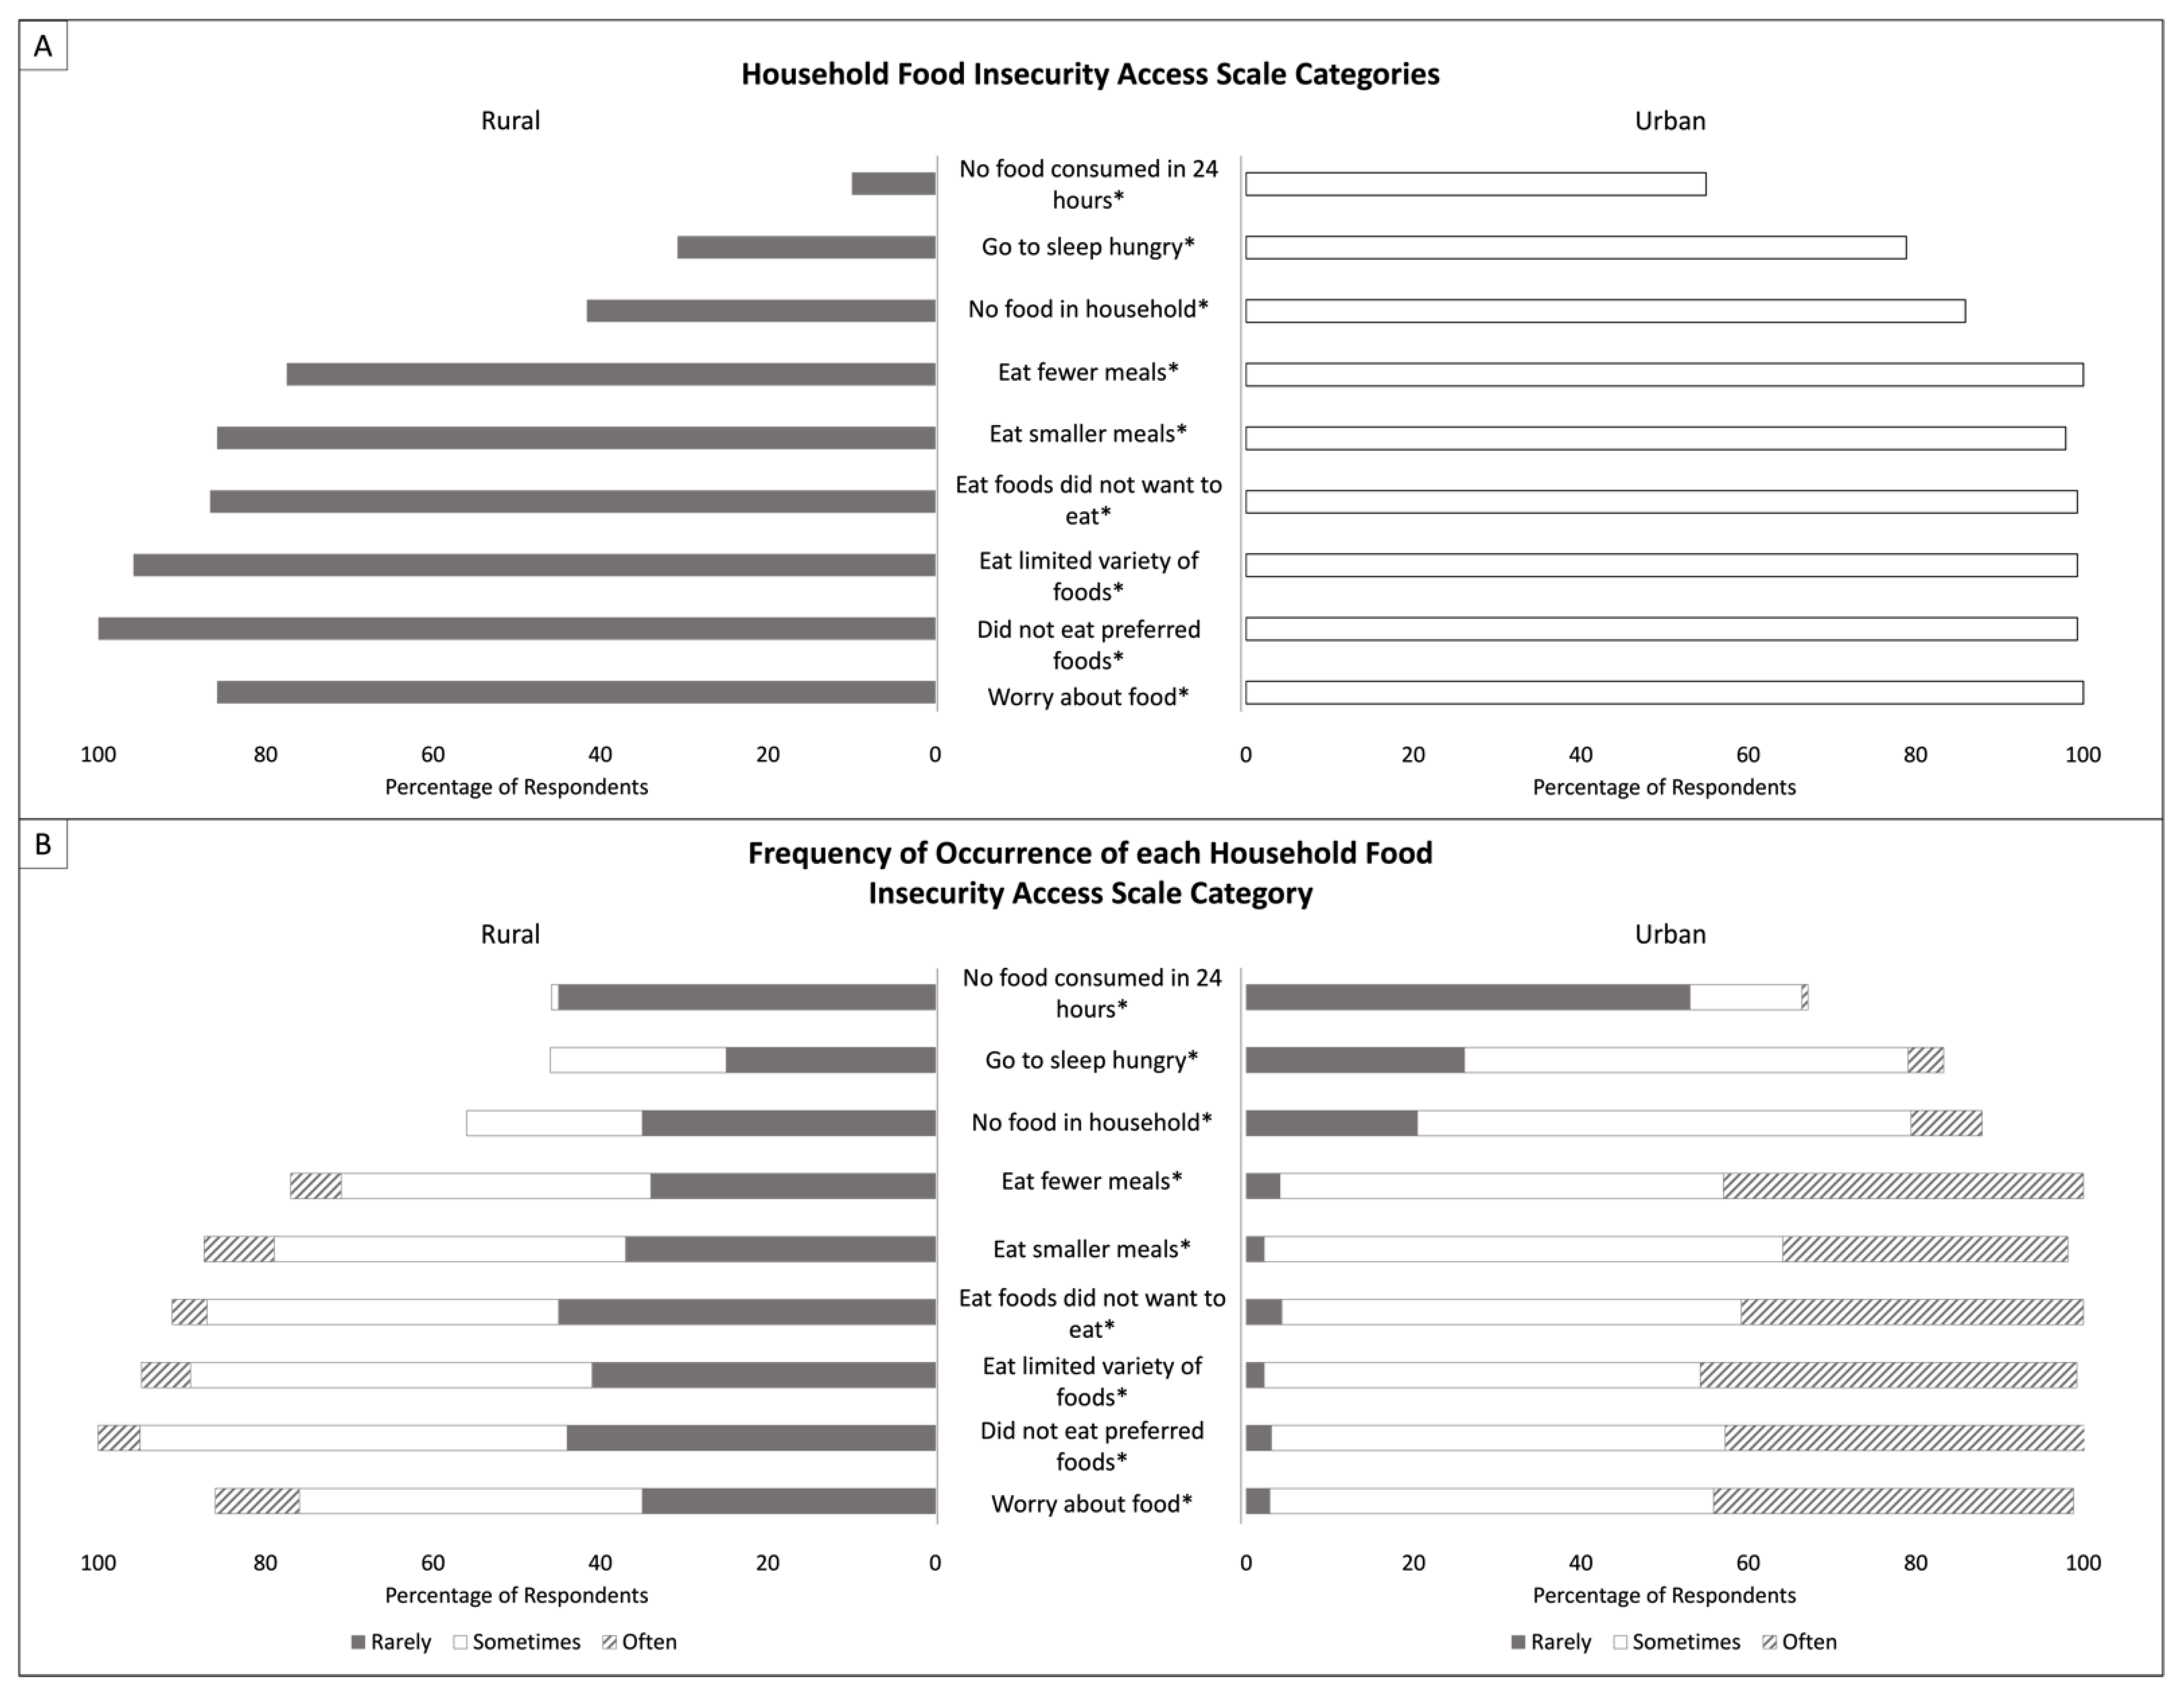
3.4. Food Security
4. Discussion
4.1. Agricultural Production and Livelihoods
4.1.1. Agricultural Production
4.1.2. Livelihoods
4.2. Food Environment Attributes and Diet
4.3. Food Security
4.4. Limitations
5. Conclusions
Author Contributions
Funding
Institutional Review Board Statement
Informed Consent Statement
Data Availability Statement
Acknowledgments
Conflicts of Interest
References
- FAO. Safeguarding against Economic Slowdowns and Downturns; FAO: Rome, Italy, 2019. [Google Scholar]
- FAO; IFAD; UNICEF; WFP; WHO. The State of Food Security and Nutrition in the World 2021. In Transforming Food Systems for Food Security, Improved Nutrition and Affordable Healthy Diets for All; FAO: Rome, Italy, 2021. [Google Scholar]
- Nechifor, V.; Ramos, M.P.; Ferrari, E.; Laichena, J.; Kihiu, E.; Omanyo, D.; Musamali, R.; Kiriga, B. Food security and welfare changes under COVID-19 in Sub-Saharan Africa: Impacts and responses in Kenya. Glob. Food Secur. 2021, 28, 100514. [Google Scholar] [CrossRef] [PubMed]
- Kansiime, M.K.; Tambo, J.A.; Mugambi, I.; Bundi, M.; Kara, A.; Owuor, C. COVID-19 implications on household income and food security in Kenya and Uganda: Findings from a rapid assessment. World Dev. 2021, 137, 105199. [Google Scholar] [CrossRef] [PubMed]
- Demeke, M.; Kariuki, J.; Wanjiru, M. Assessing the impact of COVID-19 on food and nutrition security and adequacy of responses in Kenya. Policy Brief Food Agric. Organ. United Nations 2020, 1–10. [Google Scholar]
- Picchioni, F.; Goulao, L.F.; Roberfroid, D. The impact of COVID-19 on diet quality, food security and nutrition in low and middle income countries: A systematic review of the evidence. Clin. Nutr. 2021, in press. [Google Scholar] [CrossRef]
- Barasa, E.; Kazungu, J.; Orangi, S.; Kabia, E.; Ogero, M.; Kasera, K. Assessing the Indirect Health Effects of the COVID-19 Pandemic in Kenya: Working Paper 570; Center for Global Development: Washington, DC, USA, 2021. [Google Scholar]
- Pinchoff, J.; Austrian, K.; Rajshekhar, N.; Abuya, T.; Kangwana, B.; Ochako, R.; Tidwell, J.B.; Mwanga, D.; Muluve, E.; Mbushi, F.; et al. Gendered economic, social and health effects of the COVID-19 pandemic and mitigation policies in Kenya: Evidence from a prospective cohort survey in Nairobi informal settlements. BMJ Open 2021, 11, e042749. [Google Scholar] [CrossRef]
- Maredia, M.K.; Adenikinju, A.; Belton, B.; Chapoto, A.; Faye, N.F.; Liverpool-Tasie, S.; Olwande., J.; Reardon, T.; Theriault, V.; Tschirley, D. COVID-19’s impacts on incomes and food consumption in urban and rural areas are surprisingly similar: Evidence from five African countries. Glob. Food Secur. 2022, 33, 100633. [Google Scholar] [CrossRef]
- Tendall, D.M.; Joerin, J.; Kopainsky, B.; Edwards, P.; Shreck, A.; Le, Q.B.; Kruetli, P.; Grant, M.; Six, J. Food system resilience: Defining the concept. Glob. Food Secur. 2015, 6, 17–23. [Google Scholar] [CrossRef]
- Jacobi, J.; Mukhovi, S.; Llanque, A.; Augstburger, H.; Käser, F.; Pozo, C.; Peter, M.N.; Delgado, J.M.F.; Kiteme, B.P.; Rist, S.; et al. Operationalizing food system resilience: An indicator-based assessment in agroindustrial, smallholder farming, and agroecological contexts in Bolivia and Kenya. Land Use Policy 2018, 79, 433–446. [Google Scholar] [CrossRef]
- Ahmed, S.; Downs, S.M.; Yang, C.; Chunlin, L.; Broek, N.T.; Ghosh-Jerath, S. Rapid tool based on a food environment typology framework for evaluating effects of the COVID-19 pandemic on food system resilience. Food Sec. 2020, 12, 773–778. [Google Scholar] [CrossRef]
- ICCO Cooperation. Effectively Assessing Household Food Security Status, Working Paper. 2018. Available online: https://www.icco-cooperation.org/en/wp-content/uploads/sites/2/2019/08/stars-HFIAS-workingpaper.pdf (accessed on 21 February 2022).
- Birch, I. Agricultural Productivity in Kenya: Barriers and Opportunities. In K4D Helpdesk Report; Institute of Development Studies: Brighton, UK, 2018. [Google Scholar]
- Ritchie, H.; Roser, M. Urbanization. Our World Data, 2018. Available online: https://ourworldindata.org/urbanization (accessed on 29 January 2021).
- Kimani-Murage, E.W.; Schofield, L.; Wekesah, F.; Mohamed, S.; Mberu, B.; Ettarh, R.; Egondi, T.; Kyobutungi, C.; Ezeh, A. Vulnerability to food insecurity in urban slums: Experiences from Nairobi, Kenya. J. Urban Health 2014, 91, 1098–1113. [Google Scholar] [CrossRef] [Green Version]
- Downs, S.M.; Fox, E.L.; Zivkovic, A.; Mavros, T.; Sabbahi, M.; Merchant, E.V.; Mutuku, V.; Okumu-Camerra, K.; Kimenju, S. Drivers of food choice among women living in informal settlements in Nairobi, Kenya. Appetite 2021, 168, 105748. [Google Scholar] [CrossRef]
- Simon, J.E.; Weller, S.; Hoffman, D.; Govindasamy, R.; Morin, X.; Merchant, E.V.; Dinssa, F.F.; Van Wyk, E.; Byrnes, D.; Odendo, M.; et al. Improving income and nutrition of smallholder farmers in eastern Africa using a market-first science-driven approach to enhance value chain production of African Indigenous Vegetables. J. Med. Act. 2020, 9, 289–309. [Google Scholar] [CrossRef]
- Odendo, M.; Ndinya-Omboko, C.; Merchant, E.V.; Nyabinda, N.; Minyatta-Onyango, E.; Maiyo, N.; Hoffman, D.; Simon, J.E. Do preferences for attributes of African Indigenous Vegetables recipes vary between men and women? A case from Western Kenya. J. Med. Act. Plants 2020, 9, 126–132. [Google Scholar] [CrossRef]
- Merchant, E.V.; Odendo, M.; Ndinya, C.; Nyabinda, N.; Maiyo, N.; Downs, S.; Hoffman, D.J.; Simon, J.E. Barriers and facilitators in preparation and consumption of African Indigenous Vegetables: A qualitative exploration from Kenya. Front. Sustain. Food Syst. 2022, 6, 801527. [Google Scholar] [CrossRef]
- Zivkovic, A.; Merchant, E.V.; Nyawir, T.; Hoffman, D.J.; Simon, J.E.; Downs, S. Strengthening vegetable production and consumption in a Kenyan informal settlement: A feasibility and preliminary impact assessment of a sack garden intervention. Curr. Dev. Nutr. 2022, 6, nzac036. [Google Scholar] [CrossRef]
- Ghosh-Jerath, S.; Kapoor, R.; Dhasmana, A.; Singh, A.; Downs, S.; Ahmed, S. Effect of COVID-19 pandemic on food systems and determinants of resilience in indigenous communities of Jharkhand State, India: A serial cross-sectional study. Front. Sustain. Food Syst. 2022, 6, 724321. [Google Scholar] [CrossRef]
- Amicarelli, V.; Lagioia, G.; Sampietro, S.; Bux, C. Has the COVID-19 pandemic changed food waste perception and behavior? Evidence from Italian consumers. Socio-Econ. Plan. Sci. 2022, 82, 101095. [Google Scholar] [CrossRef]
- Ebel, R.; Ahmed, S.; Warne, T.; Moxley, A.; Grimberg, I.; Jarchow, M.; Menalled, F.D. Perceptions and responses of diversified farm producers in the Northern Great Plains to the early stage of the COVID-19 Pandemic Front. Sustain. Food Syst. 2022, 6, 668335. [Google Scholar] [CrossRef]
- Poudel, P.B.; Poudel, M.R.; Gautam, A.; Phuyal, S.; Tiwari, C.K.; Bashyal, S. COVID-19 and its global impact on food and agriculture. J. Biol. Today’s World 2020, 9, 221–225. [Google Scholar]
- Rahimi, P.; Islam, M.S.; Duarte, P.M.; Tazerji, S.S.; Sobur, M.A.; El Zowalaty, M.E.; Ashour, H.M.; Rahman, M.T. Impact of the COVID-19 pandemic on food production and animal health. Trends Food Sci. Technol. 2022, 121, 105–113. [Google Scholar] [CrossRef]
- Stöber, S.; Chepkoech, W.; Neubert, S.; Kurgat, B.; Bett, H.; Lotze-Campen, H. Adaptation pathways for African Indigenous Vegetables’ value chains. In Climate Change Adaptation in Africa: Fostering Resilience and Capacity to Adapt; Leal Filho, W., Belay, S., Kalangu, J., Menas, W., Munishi, P., Musiyiwa, K., Eds.; Springer International Publishing: New York, NY, USA, 2017; pp. 413–433. [Google Scholar] [CrossRef]
- Osiki, A. COVID-19 and labour law: Kenya. Ital. Labour Law E-J. 2020, 13, 1–4. [Google Scholar] [CrossRef]
- Aldaco, R.; Hoehn, D.; Laso, J.; Margallo, M.; Ruiz-Salmón, J.; Cristobal, J.; Kahhat, R.; Villanueva-Rey, P.; Bala, A.; Batlle-Bayer, L.; et al. Food waste management during the COVID-19 outbreak: A holistic climate, economic and nutritional approach. Sci. Total Environ. 2020, 742, 140524. [Google Scholar] [CrossRef]
- Harris, J.; Depenbusch, L.; Pal, A.A.; Nair, R.M.; Ramasamy, S. Food system disruption: Initial livelihood and dietary effects of COVID-19 on vegetable producers in India. Food Sec. 2020, 12, 841–851. [Google Scholar] [CrossRef] [PubMed]
- Green, R.; Cornelsen, L.; Dangour, A.D.; Turner, R.; Shankar, B.; Mazzocchi, M.; Smith, R.D. The effect of rising food prices on food consumption: Systematic review with meta-regression. BMJ 2013, 346, 346. [Google Scholar] [CrossRef] [Green Version]
- Cornelsen, L.; Green, R.; Turner, R.; Dangour, A.D.; Shankar, B.; Mazzocchi, M.; Smith, R.D. What happens to patterns of food consumption when food prices change? Evidence from a systematic review and meta-analysis of food price elasticities globally. Health Econ. 2015, 24, 1548–1559. [Google Scholar] [CrossRef] [PubMed]
- Andreyeva, T.; Long, M.W.; Brownell, K.D. The impact of food prices on consumption: A systematic review of research on the price elasticity of demand for food. Am. J. Public Health 2010, 100, 216–222. [Google Scholar] [CrossRef]
- Lowder, S.K.; Skoet, J.; Raney, T. The number, size, and distribution of farms, smallholder farms, and family farms worldwide. World Dev. 2016, 87, 16–29. [Google Scholar] [CrossRef] [Green Version]
- Mburu, S.W.; Koskey, G.; Kimiti, J.M.; Ombori, O.; Maingi, J.M.; Njeru, E.M. Agrobiodiversity conservation enhances food security in subsistence-based farming systems of Eastern Kenya. Agric. Food Secur. 2016, 5, 19. [Google Scholar] [CrossRef] [Green Version]
- Janssens, W.; Pradhan, M.; de Groot, R.; Sidze, E.; Donfouet, H.P.P.; Abajobir, A. The short-term economic effects of COVID-19 on low-income households in rural Kenya: An analysis using weekly financial household data. World Dev. 2021, 138, 105280. [Google Scholar] [CrossRef]
- Quaife, M.; van Zandvoort, K.; Gimma, A.; Shah, K.; McCreesh, N.; Prem, K.; Barasa, E.; Mwanga, D.; Kangwana, B.; Pinchoff, J.; et al. The impact of COVID-19 control measures on social contacts and transmission in Kenyan informal settlements. BMC Med. 2020, 18, 316. [Google Scholar] [CrossRef]
- Drammeh, W.; Hamid, N.A.; Rohana, A.J. Determinants of household food insecurity and its association with child malnutrition in sub-Saharan Africa: A review of the literature. Curr. Res. Nutr. Food Sci. 2019, 7, 610–623. [Google Scholar] [CrossRef] [Green Version]
- Bogale, A.; Shimelis, S. Household level determinants of food insecurity in rural areas of Dire Dawa, eastern Ethiopia. AJFAND 2009, 9, 1914–1926. [Google Scholar] [CrossRef]


| Demographic Characteristics | County Setting | Total (n = 317) | p Value | |
|---|---|---|---|---|
| Rural | Urban | |||
| (n = 173) | (n = 144) | |||
| Gender: n (%) | ||||
| Male | 43 (25) | 1 (1) | 44 (14) | <0.001 * |
| Female | 128 (74) | 143 (99) | 271 (85) | |
| Missing | 2 (1) | 0 | 2 (<1) | |
| Age: mean ± std. dev | 46.1 ± 11.6 | 32.0 ± 10.1 | 39.7 ± 13.0 | <0.001 * |
| Age: n (%) | ||||
| 18–24 years old | 2 (1) | 34 (24) | 36 (11) | <0.001 * |
| 25–34 years old | 24 (14) | 66 (46) | 90 (29) | |
| 35–44 years old | 53 (31) | 27 (19) | 80 (25) | |
| 45–54 years old | 51 (30) | 10 (7) | 61 (19) | |
| 55–64 years old | 31 (18) | 3 (2) | 34 (11) | |
| 65+ years old | 11 (6) | 3 (2) | 14 (4) | |
| Missing | 1 (1) | 1 (1) | 2 (<1) | |
| Type of Farming: n (%) † | ||||
| Arable farming | 14 (8) | 0 (0) | 14 (8) | <0.001 * |
| Mixed farming | 134 (80) | 1 (25) | 135 (78) | <0.001 * |
| Subsistence farming | 51 (30) | 4 (100) | 55 (32) | <0.001 * |
| Commercial farming | 5 (3) | 0 (0) | 5 (3) | 0.04 * |
| Extensive/organic farming | 2 (1) | 0 (0) | 2 (1) | 0.196 |
| Number of Sources of Income: n (%) † | ||||
| One source | 103 (60) | 122 (85) | 225 (71) | <0.001 * |
| Two sources | 63 (36) | 22 (15) | 85 (27) | |
| Three sources | 7 (4) | 0 (0) | 7 (2) | |
| Type of Employment: n (%) † | ||||
| Sale of food items | 141 (56) | 41 (25) | 182 (44) | <0.001 * |
| Day laborer | 22 (9) | 74 (44) | 96 (23) | <0.001 * |
| Own business | 49 (20) | 33 (20) | 82 (20) | 0.274 |
| Salaried employee | 32 (13) | 17 (10) | 49 (12) | 0.101 |
| Other | 6 (2) | 1 (1) | 7 (2) | 0.337 |
| Average Number of Food Sources: mean ± std. dev. | 1.9 ± 0.7 | 1.4 ± 0.6 | 1.7 ± 0.7 | <0.001 * |
| Different Food Environments | Pre-pandemic Access | Increased Access | Decreased Access | ||||
|---|---|---|---|---|---|---|---|
| Rural (%) | Urban (%) | Rural (%) | Urban (%) | Rural (%) | Urban (%) | ||
| Natural | Cultivated Spaces | 89 | 1 | 17 | 1 | 2 | 24 |
| Wild Spaces | 0 | 0 | 0 | 0 | 2 | 3 | |
| Built | Informal Markets | 73 | 97 | 13 | 43 | 13 | 4 |
| Formal Markets | 27 | 28 | 4 | 7 | 12 | 31 | |
| Supplemental Food | 1 | 13 | 1 | 1 | 7 | 31 | |
| Food Groups | Food Accessibility | Food Price | Household Consumption | |||||||||
|---|---|---|---|---|---|---|---|---|---|---|---|---|
| Higher | Lower | Higher | Lower | Higher | Lower | |||||||
| Rural (n) | Urban (n) | Rural (n) | Urban (n) | Rural (n) | Urban (n) | Rural (n) | Urban (n) | Rural (n) | Urban (n) | Rural (n) | Urban (n) | |
| Grains, white roots, plantains | 7 | 0 | 218 | 636 | 253 | 584 | 44 | 22 | 85 | 163 | 124 | 345 |
| Pulses | 5 | 0 | 65 | 184 | 104 | 178 | 3 | 5 | 34 | 51 | 31 | 102 |
| Dark leafy greens | 3 | 0 | 42 | 459 | 72 | 390 | 254 | 39 | 129 | 176 | 45 | 226 |
| Animal sourced protein | 5 | 0 | 227 | 667 | 287 | 505 | 14 | 7 | 58 | 70 | 118 | 397 |
| Vitamin A-rich fruit/vegetables | 2 | 0 | 85 | 334 | 112 | 319 | 46 | 9 | 54 | 50 | 47 | 228 |
| Other fruit/vegetables | 6 | 0 | 69 | 361 | 94 | 356 | 123 | 26 | 80 | 237 | 29 | 115 |
| Cooking oil | 0 | 0 | 74 | 115 | 97 | 119 | 0 | 1 | 7 | 13 | 21 | 68 |
| Tea | 0 | 0 | 33 | 93 | 41 | 78 | 0 | 3 | 14 | 19 | 14 | 61 |
| Sugar | 0 | 0 | 72 | 123 | 94 | 114 | 1 | 2 | 9 | 22 | 22 | 61 |
| Total | 28 | 0 | 885 | 2972 | 1154 | 2643 | 485 | 114 | 470 | 801 | 451 | 1603 |
| Component | Rural | Urban | Total | p Value |
|---|---|---|---|---|
| (n = 173) | (n = 144) | (n = 317) | ||
| n (%) | n (%) | n (%) | ||
| Change in diet | 64 (37) | 86 (60) | 150 (47) | <0.001 * |
| Consume medicinal foods | 72 (42) | 112 (78) | 184 (58) | <0.001 * |
| Concern over diet impact | 117 (68) | 142 (99) | 259 (82) | <0.001 * |
| Component | HFIAS Score | p Value |
|---|---|---|
| Overall | 13.5 ± 6.4 | -- |
| County Setting | ||
| Urban | 18.1 ± 3.3 | <0.001 * |
| Rural | 9.0 ± 5.4 | |
| Gender | ||
| Female | 14.2 ± 6.2 | <0.001 * |
| Male | 8.0 ± 5.7 | |
| Age | ||
| 18–24 years old | 17.9 ± 4.1 | <0.001 * |
| 25–34 years old | 15.7 ± 5.8 | |
| 35–44 years old | 13.2 ± 5.9 | |
| 45–54 years old | 11.4 ± 6.0 | |
| 55–64 years old | 8.4 ± 6.8 | |
| 65+ years old | 10.0 ± 6.6 |
| Variables | Total Population (n = 279) | Rural (n = 137) | Urban (n = 142) | |||
|---|---|---|---|---|---|---|
| b † (95% CI) | p Value | b † (95% CI) | p Value | b † (95% CI) | p Value | |
| County type (1 = urban, 0 = rural) | 0.57 (3.88 to 10.71) | <0.001 * | - | - | - | - |
| Sex (1 = women, 0 = men) | 0.01 (−1.43 to 1.79) | 0.827 | 0.01 (−1.79 to 1.97) | 0.93 | - | - |
| Age (linear) | −0.09 (−0.08 to −0.001) | 0.045 * | −0.17 (−0.15 to −0.01) | 0.018 * | 0.03 (−0.04 to 0.06) | 0.753 |
| More than one income (1 = yes, 0 = no) | −0.09 (−2.45 to 0.20) | 0.022 * | −0.13 (−3.11 to 0.16) | 0.076 | −0.12 (−2.73 to 0.39) | 0.14 |
| Practice farming (1 = yes, 0 = no) | 0.16 (−1.28 to 5.34) | 0.227 | 0.10 (−1.88 to 9.39) | 0.189 | −0.10 (−6.82 to 2.18) | 0.309 |
| Acquiring food more difficult compared to pre-COVID (1 = yes, 0 = no) | 0.25 (3.12 to 6.20) | <0.001 * | 0.37 (2.65 to 6.43) | <0.001 * | 0.18 (0.72 to 13.58) | 0.03 * |
| Increased access to cultivated food environment (1 = yes, 0 = no) | −0.21 (−6.31 to −2.78) | <0.001 * | −0.40 (−7.77 to −3.23) | <0.001 * | 0.13 (−2.66 to 12.78) | 0.197 |
| Increased access to informal food environment (1 = yes, 0 = no) | 0.15 (0.92 to 3.44) | 0.001 * | 0.24 (1.15 to 6.37) | 0.005 | 0.13 (−0.56 to 2.25) | 0.236 |
| Reported change in food price (1 = yes, 0 = no) | 0.02 (−1.19 to 2.06) | 0.599 | 0.02 (−2.18 to 2.71) | 0.829 | 0.07 (−1.22 to 2.92) | 0.422 |
| Household changed diet (1 = yes, 0 = no) | 0.02 (−0.84 to 1.29) | 0.678 | 0.00 (−1.65 to 1.65) | 1.00 | 0.17 (−0.31 to 2.54) | 0.124 |
Publisher’s Note: MDPI stays neutral with regard to jurisdictional claims in published maps and institutional affiliations. |
© 2022 by the authors. Licensee MDPI, Basel, Switzerland. This article is an open access article distributed under the terms and conditions of the Creative Commons Attribution (CC BY) license (https://creativecommons.org/licenses/by/4.0/).
Share and Cite
Merchant, E.V.; Fatima, T.; Fatima, A.; Maiyo, N.; Mutuku, V.; Keino, S.; Simon, J.E.; Hoffman, D.J.; Downs, S.M. The Influence of Food Environments on Food Security Resilience during the COVID-19 Pandemic: An Examination of Urban and Rural Difference in Kenya. Nutrients 2022, 14, 2939. https://doi.org/10.3390/nu14142939
Merchant EV, Fatima T, Fatima A, Maiyo N, Mutuku V, Keino S, Simon JE, Hoffman DJ, Downs SM. The Influence of Food Environments on Food Security Resilience during the COVID-19 Pandemic: An Examination of Urban and Rural Difference in Kenya. Nutrients. 2022; 14(14):2939. https://doi.org/10.3390/nu14142939
Chicago/Turabian StyleMerchant, Emily V., Tasneem Fatima, Alisa Fatima, Norah Maiyo, Vincent Mutuku, Susan Keino, James E. Simon, Daniel J. Hoffman, and Shauna M. Downs. 2022. "The Influence of Food Environments on Food Security Resilience during the COVID-19 Pandemic: An Examination of Urban and Rural Difference in Kenya" Nutrients 14, no. 14: 2939. https://doi.org/10.3390/nu14142939
APA StyleMerchant, E. V., Fatima, T., Fatima, A., Maiyo, N., Mutuku, V., Keino, S., Simon, J. E., Hoffman, D. J., & Downs, S. M. (2022). The Influence of Food Environments on Food Security Resilience during the COVID-19 Pandemic: An Examination of Urban and Rural Difference in Kenya. Nutrients, 14(14), 2939. https://doi.org/10.3390/nu14142939