
Gender Differences in Treatment Outcomes for Eating Disorders: A Case-Matched, Retrospective Pre–Post Comparison


Abstract
:
1. Introduction
2. Materials and Methods
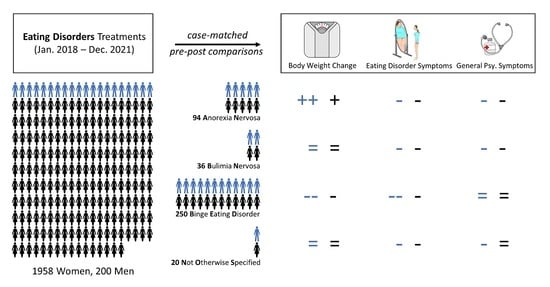
2.1. Participants
2.2. Outcome Assessments
2.2.1. Patient Characteristics and Body Weight
2.2.2. Eating Disorder Symptoms
2.2.3. General Psychopathology
2.3. Statistical Analysis
3. Results
3.1. Patient and Treatment Characteristics
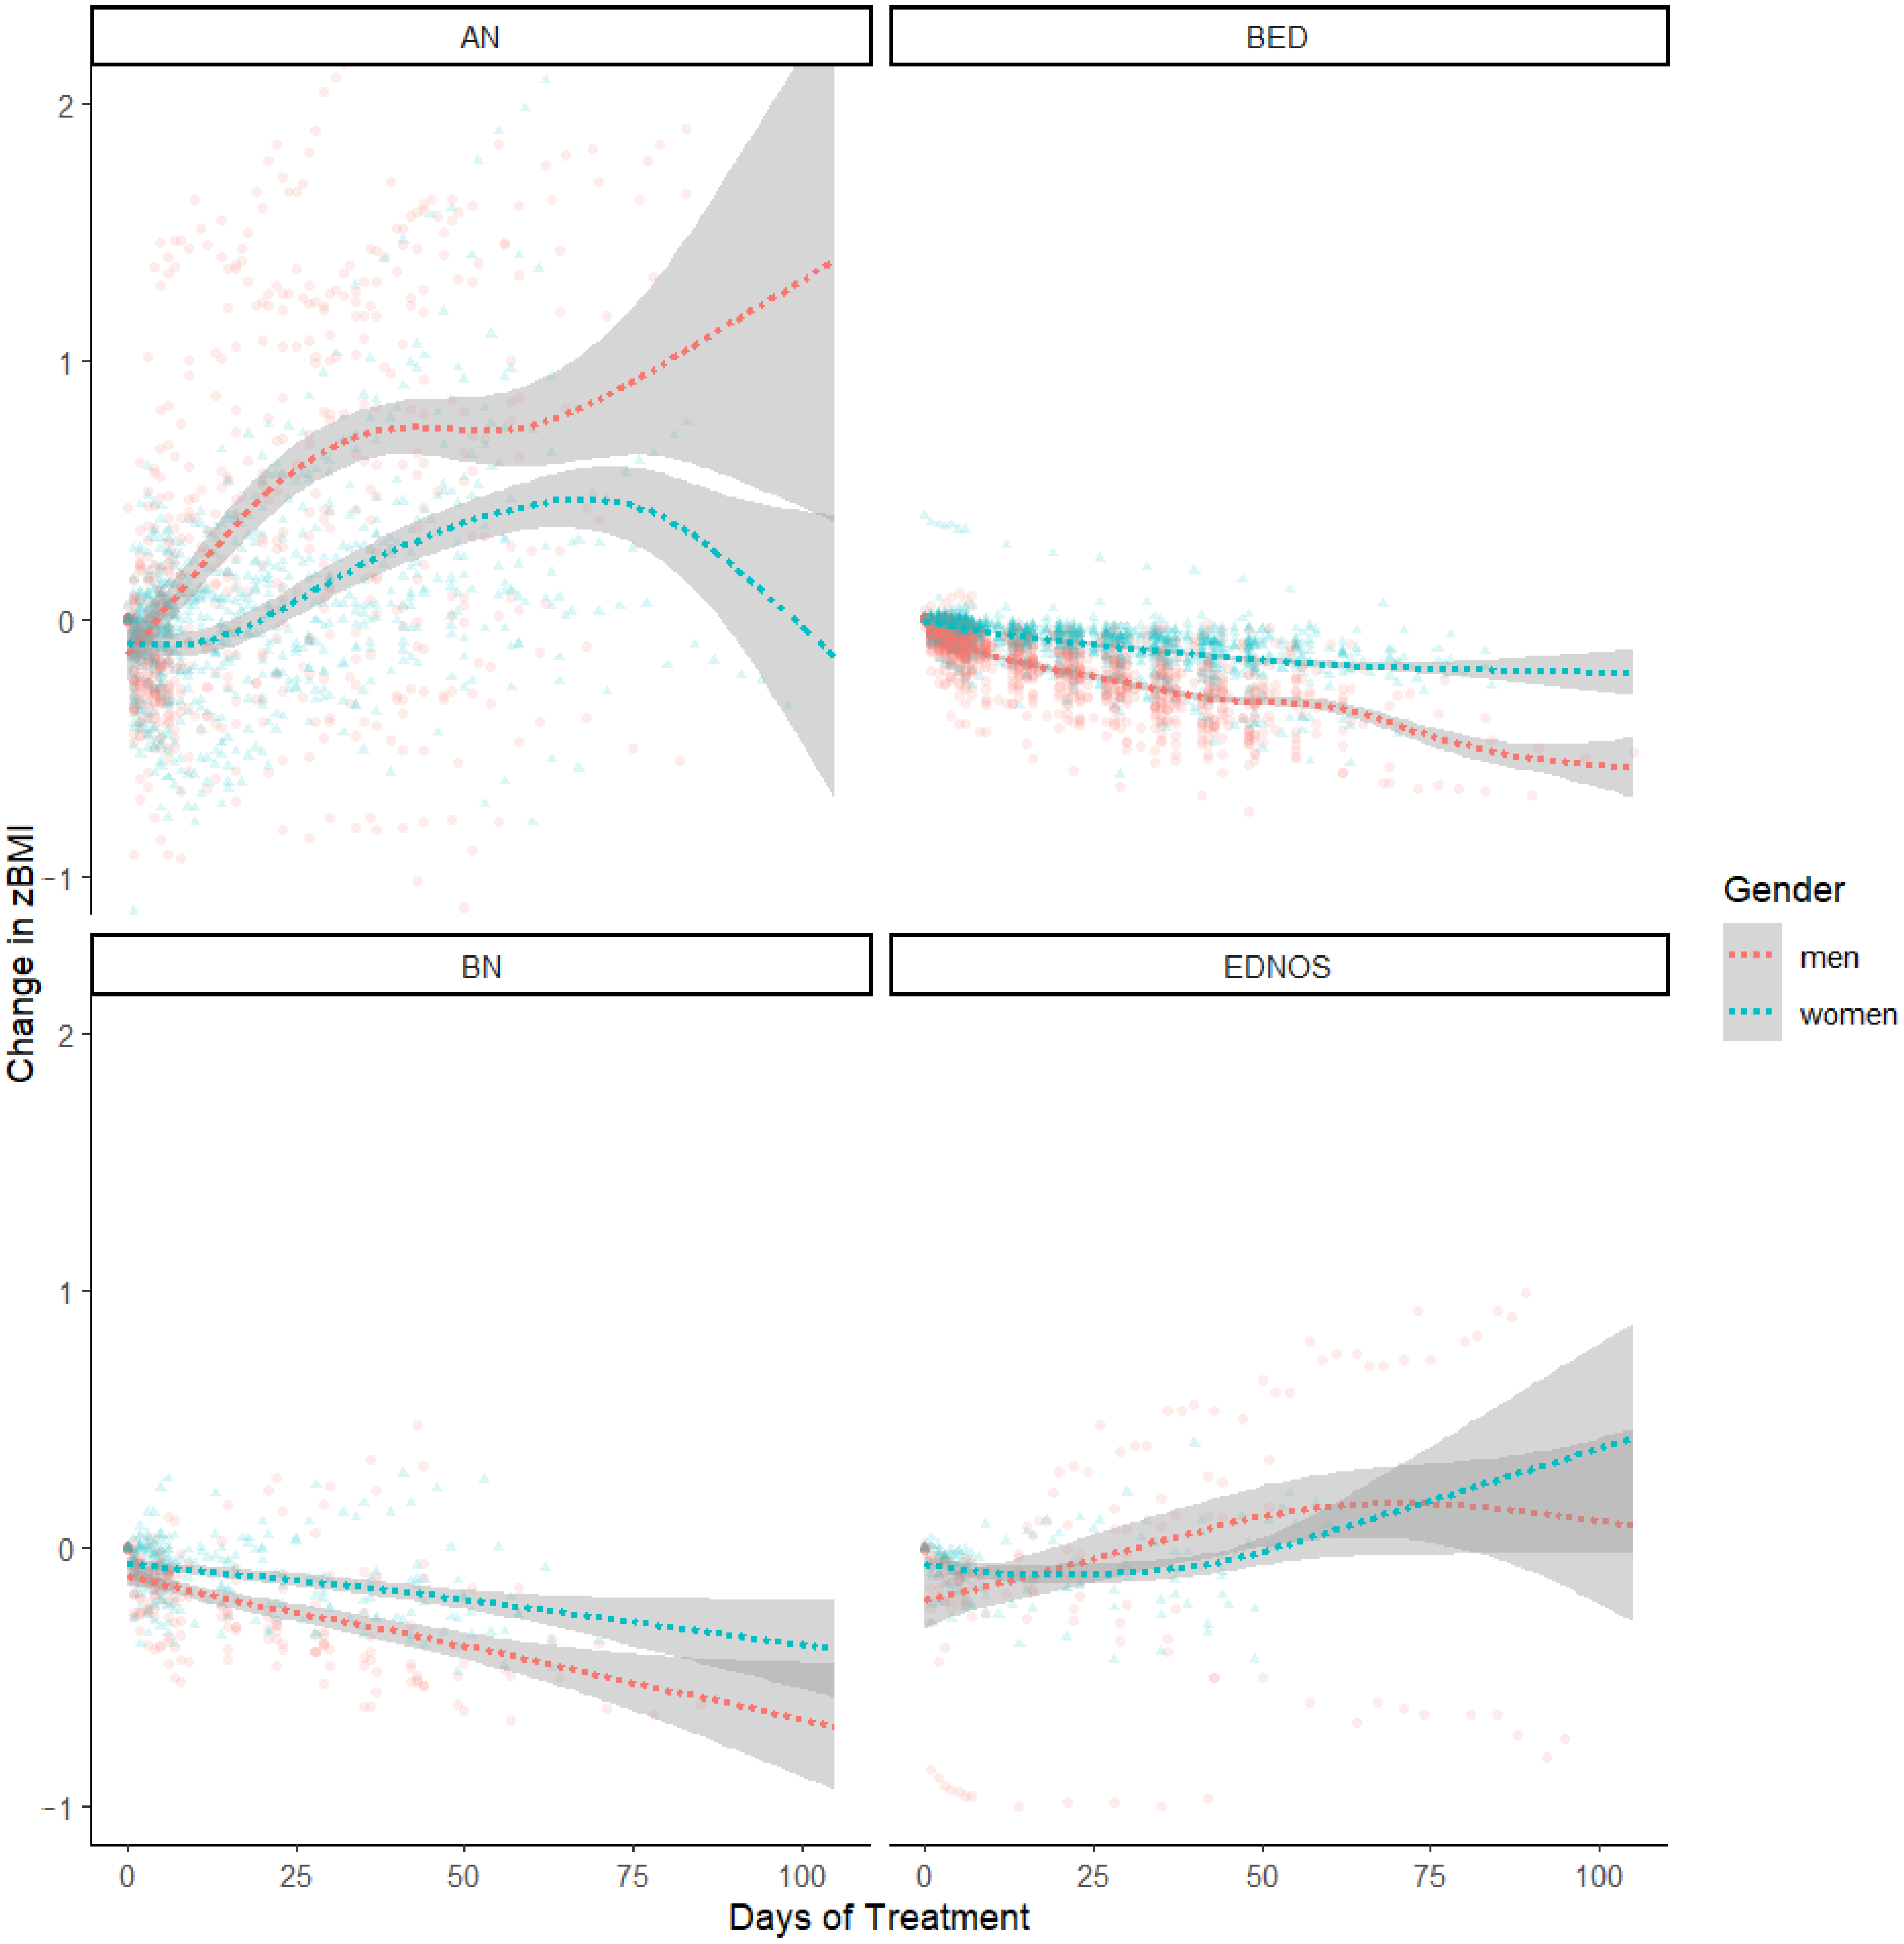
3.2. Body Weight Outcomes
3.3. Eating Disorder Symptoms’ Outcomes
3.4. General Psychopathology Outcomes
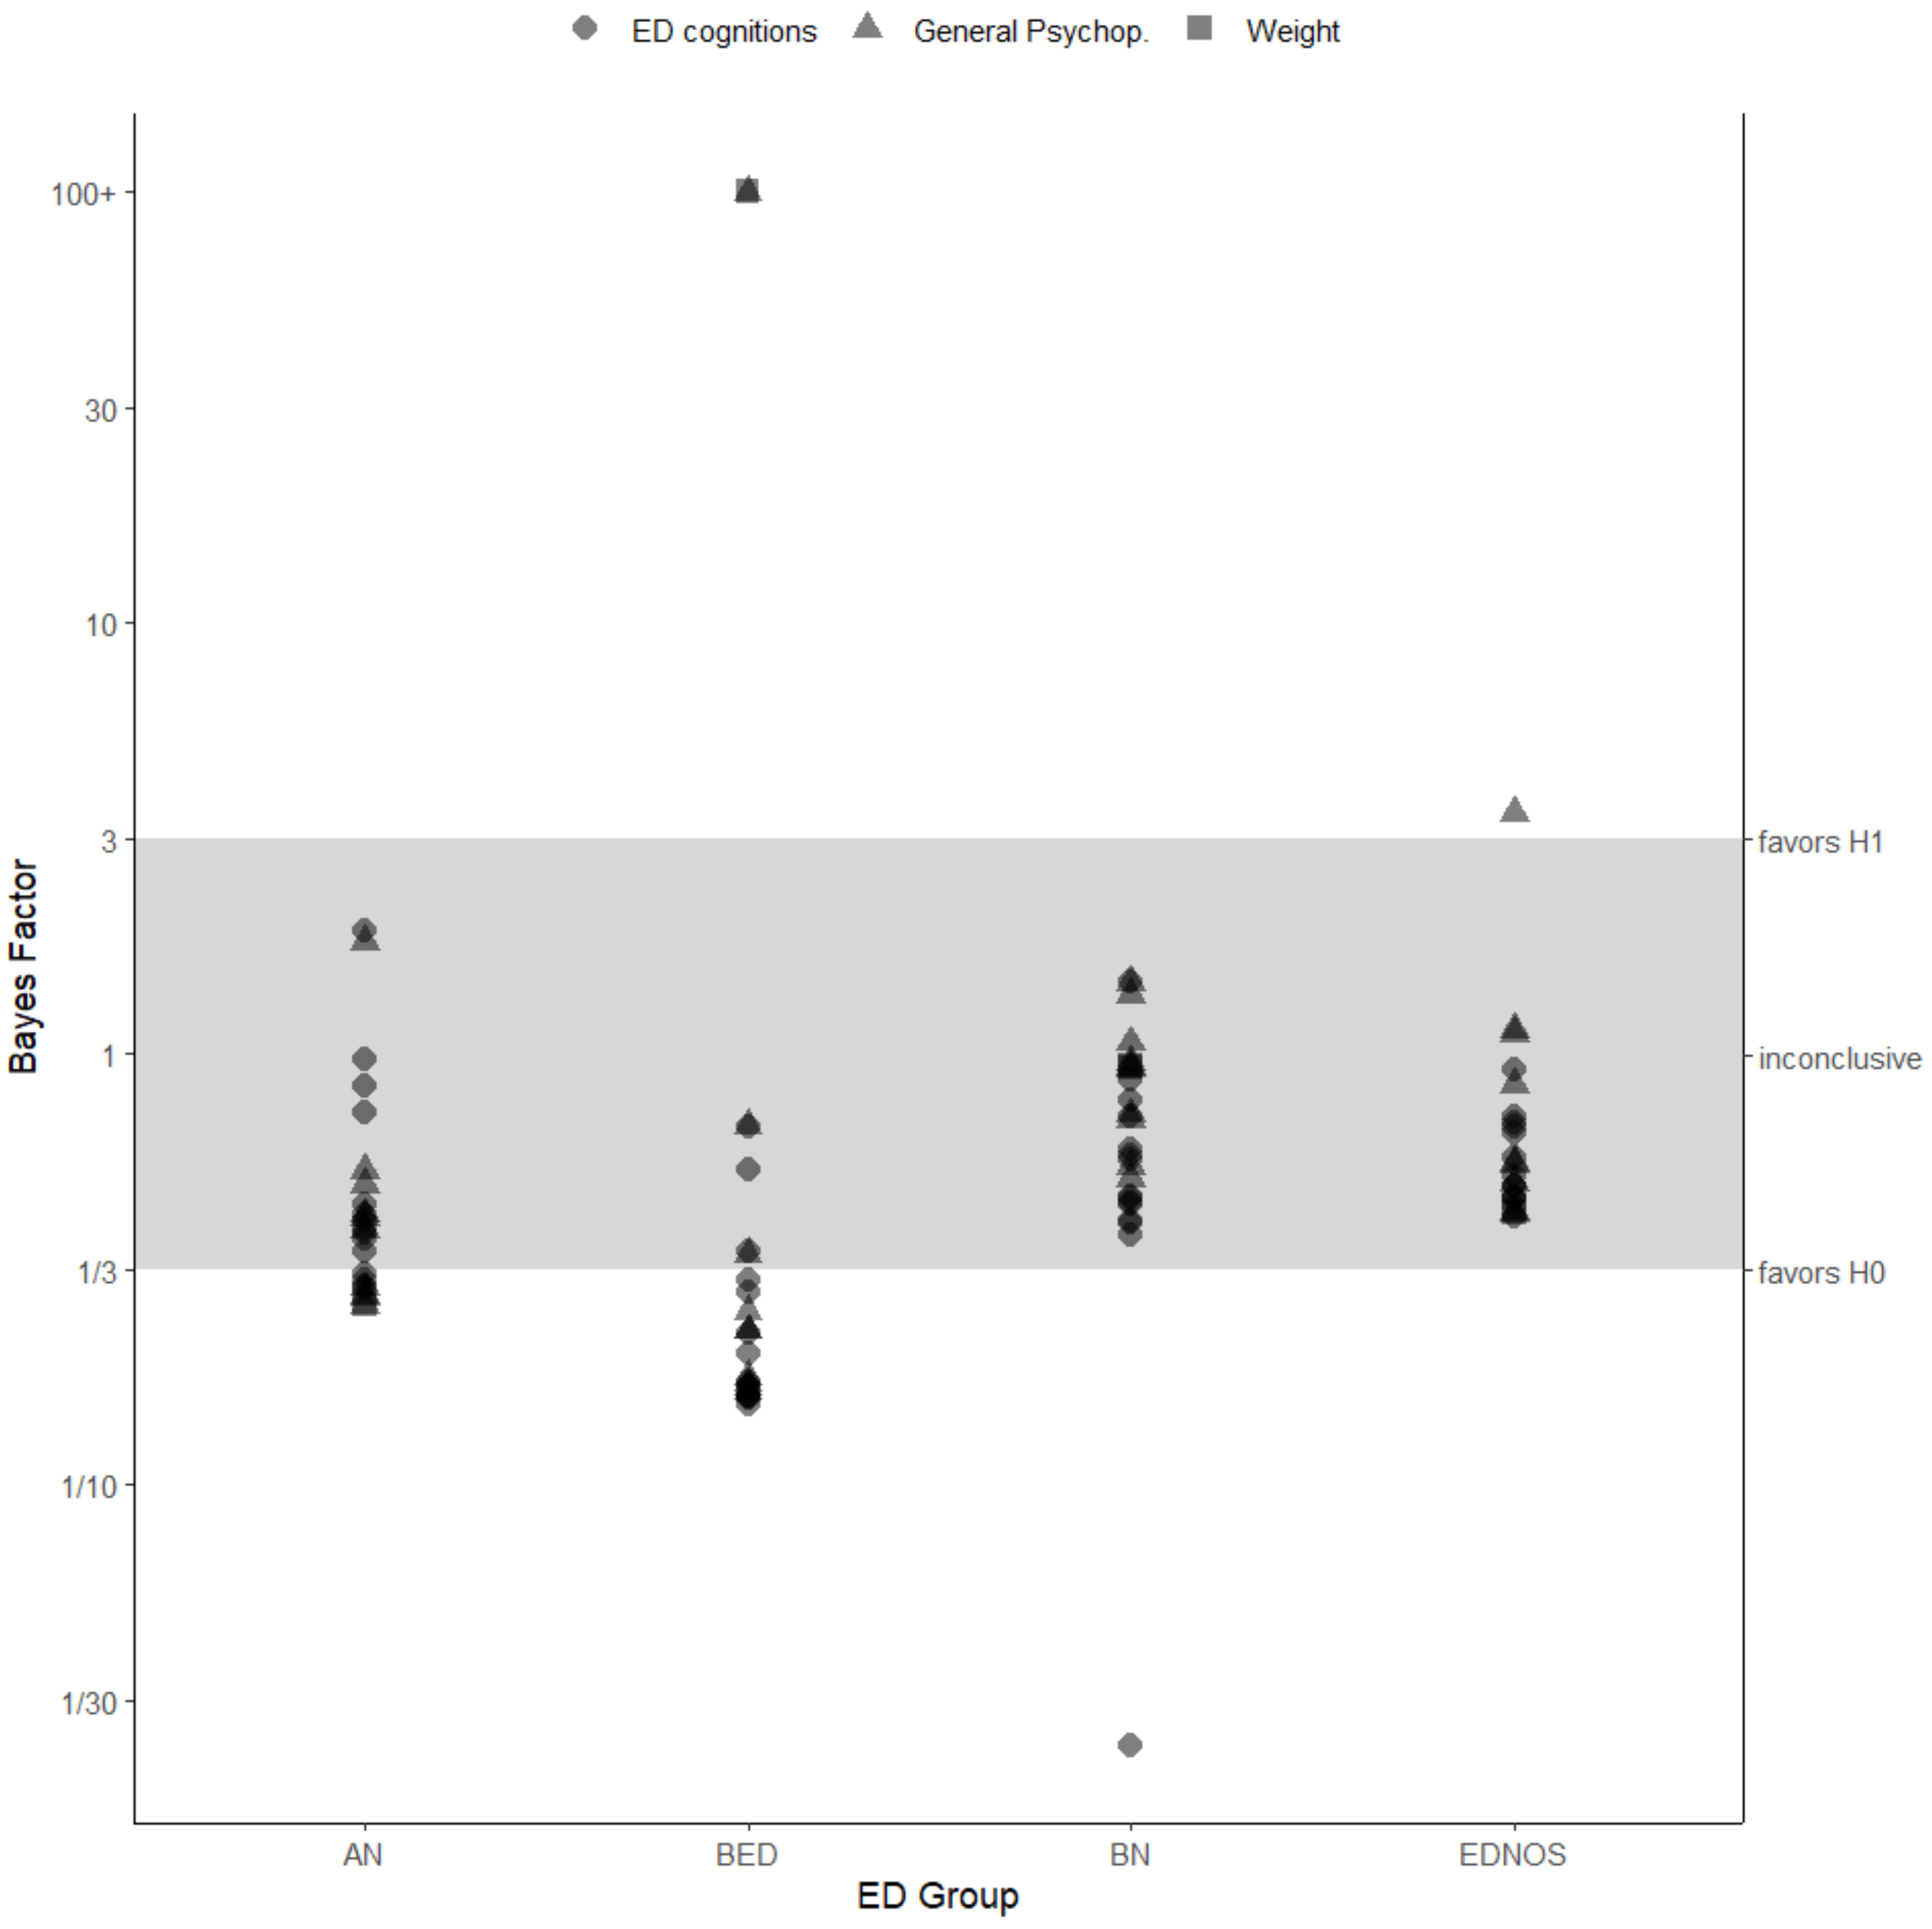
3.5. Evidence Strength
4. Discussion
Strengths and Limitations
5. Conclusions
Author Contributions
Funding
Institutional Review Board Statement
Informed Consent Statement
Data Availability Statement
Conflicts of Interest
Appendix A

| ED Group: | Men | Women | ||||||||||||||||
|---|---|---|---|---|---|---|---|---|---|---|---|---|---|---|---|---|---|---|
| Variables * | Admission | End-Of-Treatment | Change EOT-Ad. | Admission | End-Of-Treatment | Change EOT-Ad. | ||||||||||||
| n | M | SD | n | M | SD | n | M | SD | n | M | SD | n | M | SD | n | M | SD | |
| AN | ||||||||||||||||||
| Weight | ||||||||||||||||||
| BMI | 47 | 17.46 | 2.97 | 47 | 17.94 | 2.39 | 47 | 0.49 | 1.37 | 47 | 17.36 | 2.45 | 47 | 17.68 | 2.30 | 47 | 0.31 | 1.18 |
| zBMI | 47 | −2.63 | 1.62 | 47 | −2.26 | 1.23 | 47 | 0.38 | 0.87 | 47 | −2.15 | 1.52 | 47 | −1.95 | 1.44 | 47 | 0.20 | 0.73 |
| EDEQ | ||||||||||||||||||
| total | 46 | 4.12 | 1.44 | 31 | 2.54 | 0.85 | 30 | −1.75 | 1.22 | 44 | 4.34 | 1.49 | 34 | 3.05 | 1.23 | 32 | −1.49 | 1.07 |
| Restraint | 46 | 3.84 | 1.92 | 31 | 1.81 | 0.76 | 30 | −2.24 | 1.50 | 44 | 4.21 | 2.17 | 34 | 2.16 | 1.20 | 32 | −2.50 | 1.75 |
| EatingConcern | 45 | 3.69 | 1.57 | 31 | 2.10 | 0.85 | 29 | −1.64 | 1.37 | 44 | 3.86 | 1.31 | 34 | 2.58 | 1.26 | 32 | −1.30 | 1.04 |
| WeightsConcern | 45 | 4.25 | 1.44 | 31 | 2.82 | 1.05 | 29 | −1.54 | 1.49 | 44 | 4.35 | 1.67 | 34 | 3.26 | 1.53 | 32 | −1.25 | 1.28 |
| ShapeConcern | 45 | 4.73 | 1.59 | 31 | 3.43 | 1.33 | 29 | −1.58 | 1.43 | 44 | 4.95 | 1.53 | 34 | 4.22 | 1.56 | 32 | −0.93 | 1.14 |
| f (eat. episode) | 45 | 4.87 | 8.55 | 31 | 1.68 | 5.43 | 29 | −2.45 | 9.35 | 44 | 4.14 | 8.01 | 34 | 3.88 | 11.33 | 32 | −0.28 | 13.93 |
| f (loss control) | 44 | 3.80 | 7.25 | 31 | 0.52 | 0.93 | 29 | −3.14 | 6.06 | 43 | 4.60 | 8.43 | 34 | 0.15 | 0.44 | 31 | −3.71 | 7.38 |
| f (binge days) | 44 | 3.95 | 7.46 | 31 | 1.03 | 3.63 | 29 | −3.10 | 4.45 | 43 | 4.84 | 8.80 | 34 | 0.29 | 0.80 | 31 | −3.68 | 6.80 |
| f (purge) | 44 | 5.57 | 16.69 | 31 | 0.42 | 1.50 | 29 | −6.17 | 19.02 | 44 | 3.14 | 7.61 | 34 | 0.53 | 2.12 | 32 | −1.53 | 4.45 |
| f (lax.) | 44 | 0.18 | 0.69 | 31 | 0.00 | 0.00 | 29 | −0.28 | 0.84 | 44 | 0.95 | 3.67 | 34 | 0.06 | 0.34 | 32 | −0.56 | 2.50 |
| f (exer.) | 43 | 7.42 | 10.05 | 31 | 3.06 | 6.24 | 28 | −3.71 | 8.92 | 44 | 8.39 | 10.27 | 34 | 2.06 | 5.14 | 32 | −7.19 | 10.91 |
| FBeK | ||||||||||||||||||
| Attract. | 46 | 6.30 | 9.25 | 32 | 12.09 | 14.44 | 31 | 6.74 | 11.56 | 45 | 6.38 | 10.80 | 34 | 10.94 | 14.38 | 33 | 4.18 | 14.47 |
| Accent. | 46 | 75.87 | 27.25 | 32 | 81.81 | 23.25 | 31 | 6.45 | 32.57 | 45 | 76.02 | 26.64 | 34 | 88.15 | 17.11 | 33 | 5.33 | 21.38 |
| Worry | 46 | 80.48 | 24.94 | 32 | 76.53 | 26.53 | 31 | −7.58 | 25.21 | 45 | 78.07 | 26.86 | 34 | 79.32 | 21.87 | 33 | 0.18 | 25.83 |
| Sex.Discomfort | 46 | 81.37 | 23.52 | 32 | 82.06 | 21.44 | 31 | −1.39 | 19.70 | 45 | 79.98 | 22.70 | 34 | 78.59 | 26.53 | 33 | −3.33 | 24.51 |
| SCL-27-plus | ||||||||||||||||||
| Dep | 43 | 2.18 | 0.93 | 31 | 1.40 | 0.95 | 29 | −0.65 | 0.89 | 44 | 2.27 | 0.94 | 35 | 1.66 | 1.15 | 33 | −0.65 | 0.82 |
| Veg | 43 | 1.68 | 0.86 | 31 | 1.23 | 0.75 | 29 | −0.44 | 0.59 | 44 | 1.93 | 0.96 | 35 | 1.74 | 0.97 | 33 | −0.18 | 0.54 |
| Ago | 43 | 1.03 | 0.96 | 31 | 0.84 | 0.97 | 29 | −0.17 | 0.57 | 44 | 1.13 | 0.93 | 35 | 1.05 | 0.87 | 33 | −0.11 | 0.71 |
| Sop | 43 | 2.08 | 1.06 | 31 | 2.00 | 0.99 | 29 | −0.11 | 0.73 | 44 | 2.60 | 0.89 | 35 | 2.61 | 0.93 | 33 | −0.02 | 0.54 |
| Pain | 43 | 1.45 | 0.82 | 31 | 1.24 | 0.79 | 29 | −0.19 | 0.63 | 44 | 1.85 | 0.87 | 35 | 1.66 | 0.84 | 33 | −0.16 | 0.54 |
| GSI | 43 | 1.68 | 0.63 | 31 | 1.34 | 0.65 | 29 | −0.31 | 0.47 | 44 | 1.96 | 0.71 | 35 | 1.74 | 0.76 | 33 | −0.22 | 0.37 |
| LTDep | 40 | 0.58 | 0.36 | 27 | 0.66 | 0.31 | 24 | 0.12 | 0.39 | 44 | 0.60 | 0.40 | 35 | 0.74 | 0.35 | 33 | 0.14 | 0.44 |
| f (suic. thoughts) | 45 | 1.11 | 2.52 | 31 | 0.71 | 1.35 | 29 | −0.48 | 2.40 | 46 | 9.15 | 53.72 | 35 | 0.83 | 3.38 | 34 | −0.21 | 1.37 |
| f (suic. attempts) | 46 | 0.09 | 0.35 | 31 | 0.23 | 0.67 | 30 | 0.10 | 0.55 | 46 | 0.61 | 2.04 | 35 | 0.37 | 1.70 | 34 | −0.09 | 0.57 |
| BDI | ||||||||||||||||||
| total score | 46 | 25.04 | 12.83 | 32 | 13.66 | 10.67 | 31 | −11.77 | 11.15 | 46 | 26.04 | 13.23 | 35 | 17.06 | 11.88 | 34 | −8.29 | 12.98 |
| BN | ||||||||||||||||||
| Weight | ||||||||||||||||||
| BMI | 18 | 28.63 | 9.44 | 18 | 27.05 | 8.44 | 18 | −1.59 | 1.52 | 18 | 25.35 | 6.30 | 18 | 24.59 | 5.85 | 18 | −0.77 | 1.09 |
| zBMI | 18 | 0.35 | 1.72 | 18 | 0.07 | 1.58 | 18 | −0.28 | 0.32 | 18 | 0.29 | 1.16 | 18 | 0.14 | 1.14 | 18 | −0.16 | 0.19 |
| EDEQ | ||||||||||||||||||
| total | 18 | 5.49 | 1.18 | 15 | 3.54 | 1.81 | 15 | −1.84 | 1.40 | 18 | 5.59 | 0.89 | 15 | 3.24 | 1.45 | 15 | −2.46 | 1.59 |
| Restraint | 18 | 5.29 | 1.87 | 15 | 2.74 | 1.57 | 15 | −2.28 | 1.66 | 18 | 5.28 | 1.70 | 15 | 2.40 | 1.20 | 15 | −3.32 | 1.61 |
| EatingConcern | 18 | 4.80 | 1.19 | 15 | 3.01 | 1.94 | 15 | −1.84 | 1.83 | 18 | 4.85 | 1.18 | 15 | 2.68 | 1.37 | 15 | −2.09 | 1.71 |
| WeightsConcern | 18 | 5.72 | 1.41 | 15 | 4.00 | 2.18 | 15 | −1.56 | 1.73 | 18 | 5.96 | 1.08 | 15 | 3.69 | 1.89 | 15 | −2.38 | 1.90 |
| ShapeConcern | 18 | 6.14 | 1.31 | 15 | 4.40 | 2.08 | 15 | −1.67 | 1.68 | 18 | 6.28 | 0.86 | 15 | 4.18 | 1.75 | 15 | −2.07 | 1.84 |
| f (eat. episode) | 18 | 19.11 | 11.93 | 15 | 3.20 | 7.86 | 15 | −15.67 | 13.22 | 17 | 13.00 | 9.38 | 15 | 0.80 | 1.26 | 14 | −11.93 | 8.77 |
| f (loss control) | 18 | 18.39 | 11.10 | 15 | 2.00 | 4.42 | 15 | −16.20 | 11.43 | 18 | 13.17 | 8.95 | 15 | 2.20 | 5.09 | 15 | −9.20 | 6.26 |
| f (binge days) | 18 | 18.00 | 10.20 | 15 | 1.80 | 3.99 | 15 | −15.87 | 10.25 | 18 | 14.00 | 9.52 | 15 | 0.87 | 1.30 | 15 | −12.33 | 8.60 |
| f (purge) | 18 | 13.94 | 11.88 | 15 | 7.87 | 16.67 | 15 | −5.93 | 19.03 | 18 | 13.17 | 12.46 | 15 | 0.80 | 1.66 | 15 | −13.13 | 11.80 |
| f (lax.) | 18 | 4.39 | 8.81 | 15 | 0.07 | 0.26 | 15 | −3.87 | 8.39 | 18 | 2.56 | 5.17 | 15 | 0.00 | 0.00 | 15 | −2.27 | 5.01 |
| f (exer.) | 18 | 7.22 | 11.03 | 15 | 6.53 | 13.54 | 15 | −0.20 | 12.07 | 18 | 11.28 | 14.38 | 15 | 1.07 | 1.83 | 15 | −12.47 | 14.81 |
| FBeK | ||||||||||||||||||
| Attract. | 17 | 7.65 | 19.67 | 16 | 15.31 | 25.29 | 15 | 7.80 | 19.93 | 17 | 2.41 | 1.77 | 14 | 19.57 | 24.78 | 14 | 17.36 | 24.64 |
| Accent. | 17 | 78.53 | 24.62 | 16 | 80.63 | 23.09 | 15 | 3.87 | 12.64 | 17 | 87.53 | 18.02 | 14 | 90.14 | 16.03 | 14 | 5.00 | 9.89 |
| Worry | 17 | 82.35 | 23.98 | 16 | 73.69 | 33.64 | 15 | −8.60 | 18.63 | 17 | 87.76 | 16.72 | 14 | 83.14 | 14.19 | 14 | −3.36 | 12.68 |
| Sex.Discomfort | 17 | 91.53 | 14.50 | 16 | 85.69 | 21.96 | 15 | −5.67 | 10.40 | 17 | 87.00 | 14.46 | 14 | 81.36 | 21.39 | 14 | −8.64 | 18.86 |
| SCL-27-plus | ||||||||||||||||||
| Dep | 18 | 2.42 | 1.24 | 15 | 1.76 | 1.47 | 15 | −0.67 | 1.07 | 18 | 2.28 | 0.83 | 15 | 1.23 | 0.97 | 15 | −1.13 | 1.02 |
| Veg | 18 | 1.80 | 1.06 | 15 | 1.48 | 1.01 | 15 | −0.19 | 0.36 | 18 | 2.27 | 0.79 | 15 | 1.50 | 0.80 | 15 | −0.71 | 0.88 |
| Ago | 18 | 1.57 | 1.31 | 15 | 1.35 | 1.32 | 15 | −0.20 | 0.99 | 18 | 1.31 | 0.99 | 14 | 0.95 | 0.91 | 14 | −0.45 | 0.66 |
| Sop | 18 | 2.78 | 1.26 | 15 | 2.41 | 1.43 | 15 | −0.32 | 0.88 | 18 | 2.92 | 0.97 | 15 | 2.25 | 0.97 | 15 | −0.77 | 0.87 |
| Pain | 18 | 1.90 | 1.03 | 15 | 1.71 | 1.01 | 15 | −0.01 | 0.55 | 18 | 2.06 | 0.76 | 15 | 1.49 | 0.62 | 15 | −0.46 | 0.67 |
| GSI | 18 | 2.09 | 0.92 | 15 | 1.74 | 1.11 | 15 | −0.28 | 0.58 | 18 | 2.17 | 0.53 | 15 | 1.50 | 0.71 | 15 | −0.67 | 0.70 |
| LTDep | 18 | 0.82 | 0.30 | 14 | 0.79 | 0.32 | 14 | −0.11 | 0.23 | 18 | 0.70 | 0.37 | 13 | 0.82 | 0.36 | 13 | 0.08 | 0.28 |
| f (suic. thoughts) | 15 | 3.07 | 5.04 | 15 | 1.60 | 2.16 | 13 | −2.15 | 5.81 | 18 | 0.72 | 0.96 | 15 | 0.53 | 0.83 | 15 | −0.33 | 0.98 |
| f (suic. attempts) | 18 | 1.00 | 2.00 | 15 | 1.93 | 3.56 | 15 | 0.73 | 3.17 | 18 | 0.17 | 0.38 | 15 | 0.33 | 0.62 | 15 | 0.13 | 0.35 |
| BDI | ||||||||||||||||||
| total score | 18 | 31.06 | 15.09 | 15 | 21.87 | 17.67 | 15 | −8.40 | 7.88 | 18 | 27.33 | 9.62 | 14 | 12.57 | 9.09 | 14 | −15.43 | 11.24 |
| BED | ||||||||||||||||||
| Weight | ||||||||||||||||||
| BMI | 125 | 47.52 | 9.04 | 125 | 43.95 | 8.16 | 125 | −3.57 | 1.74 | 125 | 42.82 | 9.06 | 125 | 40.54 | 8.54 | 125 | −2.29 | 1.29 |
| zBMI | 125 | 3.23 | 0.85 | 125 | 2.92 | 0.86 | 125 | −0.31 | 0.15 | 125 | 2.28 | 0.69 | 125 | 2.13 | 0.72 | 125 | −0.15 | 0.11 |
| EDEQ | ||||||||||||||||||
| total | 118 | 4.05 | 0.92 | 108 | 2.82 | 1.00 | 103 | −1.26 | 1.03 | 115 | 4.50 | 0.97 | 105 | 2.99 | 1.06 | 102 | −1.53 | 1.15 |
| Restraint | 118 | 2.36 | 1.24 | 108 | 1.96 | 1.14 | 103 | −0.41 | 1.50 | 115 | 2.79 | 1.47 | 105 | 1.92 | 1.00 | 102 | −0.90 | 1.72 |
| EatingConcern | 118 | 3.68 | 1.52 | 108 | 2.08 | 1.03 | 103 | −1.67 | 1.45 | 115 | 4.13 | 1.38 | 105 | 2.32 | 1.10 | 102 | −1.84 | 1.46 |
| WeightsConcern | 118 | 4.94 | 0.98 | 108 | 3.62 | 1.23 | 103 | −1.34 | 1.26 | 115 | 5.42 | 1.09 | 105 | 3.77 | 1.36 | 102 | −1.63 | 1.41 |
| ShapeConcern | 118 | 5.22 | 1.05 | 108 | 3.60 | 1.42 | 103 | −1.62 | 1.37 | 115 | 5.67 | 1.01 | 105 | 3.95 | 1.48 | 102 | −1.74 | 1.44 |
| f (eat. episode) | 117 | 14.35 | 11.98 | 108 | 1.26 | 2.95 | 102 | −13.58 | 12.66 | 114 | 14.10 | 9.00 | 105 | 0.68 | 1.53 | 101 | −13.24 | 8.49 |
| f (loss control) | 116 | 12.22 | 11.84 | 108 | 1.04 | 2.37 | 101 | −11.55 | 12.42 | 111 | 12.06 | 9.69 | 104 | 1.13 | 4.03 | 97 | −10.93 | 9.98 |
| f (binge days) | 117 | 11.68 | 8.79 | 108 | 0.87 | 1.98 | 102 | −11.25 | 8.95 | 112 | 12.63 | 9.60 | 105 | 0.91 | 3.61 | 99 | −11.83 | 9.31 |
| f (purge) | 114 | 0.18 | 0.88 | 107 | 0.14 | 0.78 | 99 | −0.01 | 0.61 | 115 | 0.22 | 1.07 | 104 | 0.08 | 0.53 | 101 | 0.00 | 0.60 |
| f (lax.) | 115 | 0.15 | 1.21 | 108 | 0.04 | 0.23 | 100 | 0.01 | 0.10 | 114 | 0.20 | 1.88 | 104 | 0.01 | 0.10 | 101 | −0.22 | 2.00 |
| f (exer.) | 116 | 1.61 | 4.62 | 108 | 1.29 | 2.69 | 101 | −0.26 | 4.56 | 115 | 1.09 | 3.69 | 105 | 1.98 | 4.69 | 102 | 0.78 | 5.72 |
| FBeK | ||||||||||||||||||
| Attract. | 116 | 3.79 | 4.25 | 104 | 10.62 | 14.07 | 99 | 7.02 | 13.69 | 117 | 2.71 | 2.61 | 109 | 11.71 | 18.49 | 106 | 9.25 | 17.76 |
| Accent. | 116 | 61.78 | 28.19 | 104 | 69.74 | 27.24 | 99 | 8.04 | 26.04 | 117 | 75.41 | 23.87 | 109 | 80.52 | 22.31 | 106 | 4.78 | 22.78 |
| Worry | 116 | 81.91 | 21.80 | 104 | 72.36 | 25.85 | 99 | −9.20 | 23.94 | 117 | 87.80 | 16.47 | 109 | 77.84 | 25.31 | 106 | −9.70 | 25.33 |
| Sex.Discomfort | 116 | 83.81 | 19.92 | 104 | 73.33 | 25.59 | 99 | −10.74 | 23.81 | 117 | 85.64 | 20.28 | 109 | 79.50 | 24.13 | 106 | −5.96 | 22.48 |
| SCL−27-plus | ||||||||||||||||||
| Dep | 118 | 1.77 | 1.02 | 107 | 1.16 | 1.06 | 101 | −0.66 | 0.96 | 121 | 1.83 | 0.85 | 110 | 1.22 | 0.92 | 107 | −0.60 | 0.92 |
| Veg | 118 | 1.25 | 0.72 | 107 | 1.03 | 0.77 | 101 | −0.28 | 0.60 | 120 | 1.56 | 0.81 | 111 | 1.29 | 0.83 | 107 | −0.21 | 0.68 |
| Ago | 118 | 0.89 | 0.86 | 107 | 0.69 | 0.76 | 101 | −0.20 | 0.56 | 119 | 1.05 | 0.91 | 111 | 0.90 | 0.90 | 106 | −0.08 | 0.63 |
| Sop | 118 | 2.01 | 1.12 | 107 | 1.68 | 1.13 | 101 | −0.36 | 0.88 | 120 | 2.43 | 1.02 | 111 | 2.05 | 1.05 | 107 | −0.40 | 0.84 |
| Pain | 118 | 1.93 | 0.78 | 107 | 1.68 | 0.77 | 101 | −0.27 | 0.59 | 119 | 2.14 | 0.83 | 111 | 1.84 | 0.80 | 106 | −0.27 | 0.63 |
| GSI | 118 | 1.57 | 0.68 | 107 | 1.25 | 0.70 | 101 | −0.35 | 0.50 | 121 | 1.81 | 0.63 | 111 | 1.46 | 0.69 | 108 | −0.31 | 0.53 |
| LTDep | 112 | 0.58 | 0.36 | 94 | 0.56 | 0.38 | 86 | −0.04 | 0.33 | 120 | 0.66 | 0.30 | 110 | 0.74 | 0.32 | 107 | 0.07 | 0.26 |
| f (suic. thoughts) | 118 | 1.81 | 4.72 | 107 | 3.02 | 11.89 | 101 | 0.71 | 11.91 | 120 | 4.90 | 28.90 | 111 | 4.70 | 18.60 | 109 | 2.49 | 14.26 |
| f (suic. attempts) | 119 | 0.15 | 0.46 | 107 | 0.20 | 0.57 | 102 | 0.04 | 0.24 | 121 | 0.21 | 0.61 | 111 | 0.22 | 0.55 | 108 | 0.02 | 0.24 |
| BDI | ||||||||||||||||||
| total score | 118 | 22.15 | 10.72 | 107 | 13.61 | 10.59 | 101 | −8.90 | 9.94 | 122 | 24.99 | 8.67 | 112 | 14.60 | 10.39 | 110 | −10.46 | 10.13 |
| EDNOS | ||||||||||||||||||
| Weight | ||||||||||||||||||
| BMI | 10 | 29.62 | 14.14 | 10 | 27.29 | 9.96 | 10 | −2.33 | 5.77 | 10 | 25.48 | 8.57 | 10 | 24.81 | 7.54 | 10 | −0.67 | 1.27 |
| zBMI | 10 | 0.13 | 2.61 | 10 | 0.07 | 2.16 | 10 | −0.07 | 0.58 | 10 | 0.10 | 1.33 | 10 | 0.01 | 1.28 | 10 | −0.09 | 0.20 |
| EDEQ | ||||||||||||||||||
| total | 10 | 3.48 | 1.23 | 9 | 2.49 | 1.05 | 9 | −0.97 | 0.94 | 9 | 3.83 | 1.62 | 8 | 2.26 | 1.19 | 8 | −1.36 | 1.42 |
| Restraint | 10 | 2.14 | 1.46 | 9 | 1.29 | 0.47 | 9 | −0.98 | 1.12 | 9 | 3.08 | 1.73 | 8 | 1.70 | 1.05 | 8 | −1.34 | 1.85 |
| EatingConcern | 10 | 3.10 | 1.07 | 9 | 2.20 | 1.46 | 9 | −0.97 | 1.24 | 9 | 3.38 | 1.65 | 8 | 2.03 | 1.16 | 8 | −1.08 | 1.58 |
| WeightsConcern | 10 | 4.18 | 1.66 | 9 | 3.22 | 1.50 | 9 | −0.80 | 1.12 | 9 | 4.19 | 1.81 | 8 | 2.48 | 1.14 | 8 | −1.44 | 1.40 |
| ShapeConcern | 10 | 4.50 | 1.67 | 9 | 3.26 | 1.40 | 9 | −1.11 | 1.15 | 9 | 4.65 | 2.14 | 8 | 2.82 | 1.75 | 8 | −1.58 | 1.90 |
| f (eat. episode) | 10 | 5.20 | 8.79 | 8 | 2.50 | 3.46 | 8 | −0.38 | 5.32 | 8 | 6.13 | 11.49 | 8 | 0.50 | 1.41 | 7 | −3.43 | 9.07 |
| f (loss control) | 10 | 2.90 | 3.98 | 8 | 0.88 | 1.13 | 8 | −1.38 | 3.34 | 8 | 7.50 | 10.36 | 8 | 0.63 | 1.19 | 7 | −4.86 | 9.03 |
| f (binge days) | 10 | 2.50 | 3.21 | 8 | 1.50 | 2.73 | 8 | −0.88 | 3.68 | 8 | 6.50 | 12.08 | 8 | 0.38 | 1.06 | 7 | −3.00 | 7.94 |
| f (purge) | 10 | 0.80 | 2.53 | 8 | 0.38 | 1.06 | 8 | −0.63 | 1.77 | 9 | 3.11 | 9.33 | 8 | 0.00 | 0.00 | 8 | −3.50 | 9.90 |
| f (lax.) | 10 | 0.00 | 0.00 | 8 | 0.00 | 0.00 | 8 | 0.00 | 0.00 | 9 | 0.00 | 0.00 | 8 | 0.00 | 0.00 | 8 | 0.00 | 0.00 |
| f (exer.) | 10 | 2.50 | 7.91 | 8 | 3.88 | 9.80 | 8 | 0.75 | 14.21 | 9 | 5.78 | 11.48 | 8 | 0.88 | 2.10 | 8 | −5.63 | 10.45 |
| FBeK | ||||||||||||||||||
| Attract. | 10 | 5.40 | 6.19 | 9 | 12.11 | 8.37 | 9 | 6.11 | 8.13 | 9 | 8.56 | 10.45 | 8 | 14.25 | 6.39 | 8 | 5.13 | 13.29 |
| Accent. | 10 | 86.70 | 14.27 | 9 | 88.33 | 11.66 | 9 | 2.11 | 20.23 | 9 | 83.67 | 19.75 | 8 | 89.50 | 13.79 | 8 | 7.88 | 15.08 |
| Worry | 10 | 86.50 | 19.61 | 9 | 86.78 | 15.63 | 9 | 0.11 | 8.19 | 9 | 80.67 | 20.69 | 8 | 70.13 | 35.04 | 8 | −10.88 | 26.35 |
| Sex.Discomfort | 10 | 85.30 | 19.77 | 9 | 71.56 | 21.97 | 9 | −12.33 | 20.89 | 9 | 74.89 | 25.55 | 8 | 65.00 | 30.92 | 8 | −8.88 | 13.53 |
| SCL−27-plus | ||||||||||||||||||
| Dep | 10 | 1.94 | 0.57 | 9 | 1.40 | 1.07 | 9 | −0.51 | 0.69 | 9 | 1.60 | 0.66 | 8 | 1.03 | 0.46 | 8 | −0.55 | 0.45 |
| Veg | 10 | 1.58 | 0.71 | 9 | 1.13 | 0.81 | 9 | −0.53 | 0.36 | 9 | 1.44 | 0.65 | 8 | 1.28 | 0.38 | 8 | 0.00 | 0.43 |
| Ago | 10 | 1.03 | 0.91 | 9 | 0.81 | 0.93 | 9 | −0.25 | 0.28 | 9 | 0.75 | 0.64 | 8 | 0.72 | 0.84 | 8 | −0.06 | 0.53 |
| Sop | 10 | 1.90 | 1.03 | 9 | 1.62 | 0.75 | 9 | −0.44 | 0.70 | 9 | 1.82 | 1.41 | 8 | 1.73 | 1.22 | 8 | −0.15 | 0.58 |
| Pain | 10 | 2.06 | 0.59 | 9 | 1.76 | 0.35 | 9 | −0.24 | 0.48 | 9 | 1.76 | 0.86 | 8 | 1.58 | 0.57 | 8 | −0.13 | 0.40 |
| GSI | 10 | 1.70 | 0.45 | 9 | 1.34 | 0.58 | 9 | −0.40 | 0.33 | 9 | 1.48 | 0.58 | 8 | 1.27 | 0.52 | 8 | −0.18 | 0.24 |
| LTDep | 10 | 0.69 | 0.32 | 8 | 0.58 | 0.38 | 8 | −0.06 | 0.11 | 9 | 0.41 | 0.43 | 7 | 0.60 | 0.43 | 7 | 0.22 | 0.42 |
| f (suic. thoughts) | 10 | 0.70 | 1.34 | 9 | 0.67 | 1.41 | 9 | −0.11 | 0.33 | 9 | 0.00 | 0.00 | 8 | 0.38 | 0.74 | 8 | 0.38 | 0.74 |
| f (suic. attempts) | 9 | 0.11 | 0.33 | 9 | 0.22 | 0.67 | 8 | 0.13 | 0.35 | 9 | 0.00 | 0.00 | 8 | 0.00 | 0.00 | 8 | 0.00 | 0.00 |
| BDI | ||||||||||||||||||
| total score | 10 | 23.00 | 10.01 | 9 | 12.44 | 10.74 | 9 | −10.00 | 11.62 | 9 | 20.22 | 7.79 | 8 | 8.63 | 3.16 | 8 | −11.75 | 6.39 |
| ED Group: | Admission Differences | Change from Adm. to EOT | Gender Differences of Change | ||||||||||||||||
|---|---|---|---|---|---|---|---|---|---|---|---|---|---|---|---|---|---|---|---|
| Variables * | Men vs. Women | Men | Women | ||||||||||||||||
| t | df | p | d | LL | UL | F | df | p | eta2 | F | df | p | eta2 | F | df | p | eta2 | BFincl | |
| AN | |||||||||||||||||||
| Weight | |||||||||||||||||||
| BMI | 0.17 | 92 | 0.865 | 0.04 | −0.37 | 0.44 | 22.73 | 44 | 0.000 | 0.34 | 7.33 | 44 | 0.010 | 0.14 | 1.34 | 90 | 0.250 | 0.01 | 0.38 |
| zBMI | −1.50 | 92 | 0.137 | −0.31 | −0.72 | 0.10 | 23.04 | 44 | 0.000 | 0.34 | 9.18 | 44 | 0.000 | 0.17 | 0.38 | 90 | 0.540 | 0.00 | 0.26 |
| EDEQ | |||||||||||||||||||
| total | −0.71 | 88 | 0.477 | −0.15 | −0.56 | 0.264 | 1.96 | 27 | 0.170 | 0.07 | 1.42 | 29 | 0.240 | 0.05 | 2.58 | 58 | 0.110 | 0.04 | 0.73 |
| Restraint | −0.87 | 88 | 0.389 | −0.18 | −0.60 | 0.23 | 0.48 | 27 | 0.490 | 0.02 | 0.25 | 29 | 0.620 | 0.01 | 0.32 | 58 | 0.570 | 0.01 | 0.29 |
| EatingConcern | −0.53 | 87 | 0.595 | −0.11 | −0.53 | 0.30 | 5.59 | 26 | 0.030 | 0.18 | 0.50 | 29 | 0.480 | 0.02 | 2.85 | 57 | 0.100 | 0.05 | 0.84 |
| WeightsConcern | −0.32 | 87 | 0.750 | −0.07 | −0.48 | 0.35 | 3.04 | 26 | 0.090 | 0.10 | 1.44 | 29 | 0.240 | 0.05 | 1.12 | 57 | 0.290 | 0.02 | 0.41 |
| ShapeConcern | −0.68 | 87 | 0.500 | −0.14 | −0.56 | 0.27 | 0.00 | 26 | 0.950 | 0.00 | 0.95 | 29 | 0.340 | 0.03 | 4.87 | 57 | 0.030 | 0.08 | 1.93 |
| f (eat. episode) | 0.42 | 87 | 0.679 | 0.09 | −0.33 | 0.50 | 0.26 | 26 | 0.610 | 0.01 | 0.00 | 29 | 0.990 | 0.00 | 0.98 | 57 | 0.330 | 0.02 | 0.39 |
| f (loss control) | −0.48 | 85 | 0.632 | −0.10 | −0.52 | 0.32 | 0.16 | 26 | 0.700 | 0.01 | 0.73 | 28 | 0.400 | 0.03 | 3.31 | 56 | 0.070 | 0.06 | 0.97 |
| f (binge days) | −0.51 | 85 | 0.615 | −0.11 | −0.53 | 0.31 | 0.85 | 26 | 0.360 | 0.03 | 0.00 | 28 | 0.970 | 0.00 | 1.39 | 56 | 0.240 | 0.02 | 0.45 |
| f (purge) | 0.88 | 86 | 0.381 | 0.19 | −0.23 | 0.61 | 0.00 | 26 | 0.960 | 0.00 | 0.00 | 29 | 1.00 | 0.00 | 0.16 | 57 | 0.690 | 0.00 | 0.30 |
| f (lax.) | −1.37 | 46 | 0.177 | −0.29 | −0.71 | 0.13 | - | - | - | - | 0.40 | 29 | 0.530 | 0.01 | 0.62 | 57 | 0.430 | 0.01 | 0.35 |
| f (exer.) | −0.44 | 85 | 0.658 | −0.10 | −0.52 | 0.33 | 0.06 | 25 | 0.810 | 0.00 | 2.15 | 29 | 0.150 | 0.07 | 1.16 | 56 | 0.290 | 0.02 | 0.43 |
| FBeK | |||||||||||||||||||
| Attract. | −0.04 | 89 | 0.972 | −0.01 | −0.42 | 0.40 | 0.22 | 28 | 0.650 | 0.01 | 0.00 | 30 | 0.950 | 0.00 | 0.50 | 60 | 0.480 | 0.01 | 0.31 |
| Accent. | −0.03 | 89 | 0.979 | −0.01 | −0.42 | 0.41 | 19.66 | 28 | 0.000 | 0.41 | 14.94 | 30 | 0.000 | 0.33 | 1.09 | 60 | 0.300 | 0.02 | 0.39 |
| Worry | 0.44 | 89 | 0.658 | 0.09 | −0.32 | 0.50 | 1.95 | 28 | 0.170 | 0.07 | 1.33 | 30 | 0.260 | 0.04 | 0.72 | 60 | 0.400 | 0.01 | 0.37 |
| Sex.Discomfort | 0.29 | 89 | 0.775 | 0.06 | −0.35 | 0.47 | 6.41 | 28 | 0.020 | 0.19 | 3.08 | 30 | 0.090 | 0.09 | 0.28 | 60 | 0.600 | 0.00 | 0.29 |
| SCL−27-plus | |||||||||||||||||||
| Dep | −0.46 | 85 | 0.649 | −0.10 | −0.52 | 0.32 | 0.82 | 26 | 0.370 | 0.03 | 0.44 | 30 | 0.510 | 0.01 | 0.02 | 58 | 0.880 | 0.00 | 0.26 |
| Veg | −1.29 | 85 | 0.200 | −0.28 | −0.70 | 0.15 | 0.04 | 26 | 0.850 | 0.00 | 3.95 | 30 | 0.060 | 0.12 | 5.10 | 58 | 0.030 | 0.08 | 1.82 |
| Ago | −0.48 | 85 | 0.632 | −0.10 | −0.52 | 0.32 | 0.09 | 26 | 0.760 | 0.00 | 2.17 | 30 | 0.150 | 0.07 | 0.17 | 58 | 0.680 | 0.00 | 0.27 |
| Sop | −2.51 | 85 | 0.014 | −0.54 | −0.97 | −0.11 | 5.60 | 26 | 0.030 | 0.18 | 2.84 | 30 | 0.100 | 0.09 | 1.49 | 58 | 0.230 | 0.03 | 0.42 |
| Pain | −2.17 | 85 | 0.033 | −0.47 | −0.89 | −0.04 | 5.46 | 26 | 0.030 | 0.17 | 5.83 | 30 | 0.020 | 0.16 | 1.14 | 58 | 0.290 | 0.02 | 0.39 |
| GSI | −1.89 | 85 | 0.062 | −0.41 | −0.83 | 0.02 | 0.77 | 26 | 0.390 | 0.03 | 4.35 | 30 | 0.050 | 0.13 | 1.59 | 58 | 0.210 | 0.03 | 0.43 |
| LTDep | −0.21 | 82 | 0.835 | −0.05 | −0.47 | 0.38 | 2.81 | 21 | 0.110 | 0.12 | 0.91 | 30 | 0.350 | 0.03 | 0.00 | 53 | 0.950 | 0.00 | 0.28 |
| f (suic. thoughts) | −1.00 | 89 | 0.319 | −0.21 | −0.62 | 0.20 | 0.07 | 26 | 0.800 | 0.00 | 2.31 | 31 | 0.140 | 0.07 | 0.22 | 59 | 0.640 | 0.00 | 0.29 |
| f (suic. attempts) | −1.71 | 48 | 0.094 | −0.36 | −0.77 | 0.06 | 2.79 | 27 | 0.110 | 0.09 | 2.27 | 31 | 0.140 | 0.07 | 1.27 | 60 | 0.260 | 0.02 | 0.50 |
| BDI | |||||||||||||||||||
| total score | −0.37 | 90 | 0.714 | −0.08 | −0.49 | 0.33 | 0.03 | 28 | 0.860 | 0.00 | 0.58 | 31 | 0.450 | 0.02 | 1.68 | 61 | 0.200 | 0.03 | 0.54 |
| BN | |||||||||||||||||||
| Weight | |||||||||||||||||||
| BMI | 1.23 | 34 | 0.229 | 0.41 | −0.26 | 1.07 | 4.48 | 15 | 0.050 | 0.23 | 7.76 | 15 | 0.010 | 0.34 | 3.10 | 32 | 0.090 | 0.09 | 0.94 |
| zBMI | 0.12 | 34 | 0.908 | 0.04 | −0.62 | 0.69 | 0.08 | 15 | 0.780 | 0.01 | 0.21 | 15 | 0.660 | 0.01 | 3.20 | 32 | 0.080 | 0.09 | 0.93 |
| EDEQ | |||||||||||||||||||
| total | −0.3 | 34 | 0.766 | −0.1 | −0.75 | 0.555 | 0.57 | 12 | 0.470 | 0.05 | 0.43 | 12 | 0.520 | 0.03 | 1.87 | 26 | 0.180 | 0.07 | 0.57 |
| Restraint | 0.02 | 34 | 0.985 | 0.01 | −0.65 | 0.66 | 0.02 | 12 | 0.890 | 0.00 | 0.31 | 12 | 0.590 | 0.03 | 2.90 | 26 | 0.100 | 0.10 | 0.78 |
| EatingConcern | −0.13 | 34 | 0.900 | −0.04 | −0.70 | 0.61 | 0.83 | 12 | 0.380 | 0.06 | 0.75 | 12 | 0.400 | 0.06 | 1.70 | 26 | 0.200 | 0.06 | 0.45 |
| WeightsConcern | −0.56 | 34 | 0.581 | −0.19 | −0.84 | 0.47 | 0.42 | 12 | 0.530 | 0.03 | 0.08 | 12 | 0.780 | 0.01 | 1.62 | 26 | 0.210 | 0.06 | 0.60 |
| ShapeConcern | −0.40 | 34 | 0.694 | −0.13 | −0.79 | 0.52 | 0.13 | 12 | 0.720 | 0.01 | 0.32 | 12 | 0.580 | 0.03 | 0.79 | 26 | 0.380 | 0.03 | 0.41 |
| f (eat. episode) | 1.68 | 33 | 0.103 | 0.57 | −0.11 | 1.24 | 3.30 | 12 | 0.090 | 0.22 | 17.41 | 11 | 0.000 | 0.61 | 3.39 | 25 | 0.080 | 0.12 | 0.71 |
| f (loss control) | 1.55 | 34 | 0.130 | 0.52 | −0.15 | 1.18 | 3.34 | 12 | 0.090 | 0.22 | 0.48 | 12 | 0.500 | 0.04 | 0.02 | 26 | 0.880 | 0.00 | 0.45 |
| f (binge days) | 1.22 | 34 | 0.232 | 0.41 | −0.26 | 1.06 | 2.62 | 12 | 0.130 | 0.18 | 9.91 | 12 | 0.010 | 0.45 | 2.13 | 26 | 0.160 | 0.08 | 0.46 |
| f (purge) | 0.19 | 34 | 0.849 | 0.06 | −0.59 | 0.72 | 0.06 | 12 | 0.820 | 0.00 | 5.21 | 12 | 0.040 | 0.30 | 2.18 | 26 | 0.150 | 0.08 | 0.87 |
| f (lax.) | 0.76 | 34 | 0.451 | 0.25 | −0.40 | 0.91 | 3.00 | 12 | 0.110 | 0.20 | 0.00 | 12 | 1.00 | 0.00 | 2.56 | 26 | 0.120 | 0.09 | 0.03 |
| f (exer.) | −0.95 | 34 | 0.349 | −0.32 | −0.97 | 0.34 | 0.85 | 12 | 0.370 | 0.07 | 1.99 | 12 | 0.180 | 0.14 | 2.55 | 26 | 0.120 | 0.09 | 1.48 |
| FBeK | |||||||||||||||||||
| Attract. | 1.09 | 16 | 0.290 | 0.38 | −0.31 | 1.05 | 1.02 | 12 | 0.330 | 0.08 | 1.28 | 11 | 0.280 | 0.10 | 1.78 | 25 | 0.190 | 0.07 | 0.58 |
| Accent. | −1.22 | 32 | 0.233 | −0.42 | −1.09 | 0.27 | 0.60 | 12 | 0.450 | 0.05 | 2.16 | 11 | 0.170 | 0.16 | 0.04 | 25 | 0.840 | 0.00 | 0.38 |
| Worry | −0.76 | 32 | 0.451 | −0.26 | −0.94 | 0.42 | 1.59 | 12 | 0.230 | 0.12 | 9.00 | 11 | 0.010 | 0.45 | 0.51 | 25 | 0.480 | 0.02 | 0.47 |
| Sex.Discomfort | 0.91 | 32 | 0.369 | 0.31 | −0.37 | 0.99 | 5.88 | 12 | 0.030 | 0.33 | 0.33 | 11 | 0.570 | 0.03 | 0.50 | 25 | 0.490 | 0.02 | 0.41 |
| SCL−27-plus | |||||||||||||||||||
| Dep | 0.41 | 34 | 0.684 | 0.14 | −0.52 | 0.79 | 2.23 | 12 | 0.160 | 0.16 | 0.55 | 12 | 0.470 | 0.04 | 2.59 | 26 | 0.120 | 0.09 | 0.55 |
| Veg | −1.49 | 34 | 0.145 | −0.50 | −1.16 | 0.17 | 0.01 | 12 | 0.930 | 0.00 | 0.10 | 12 | 0.750 | 0.01 | 2.38 | 26 | 0.130 | 0.08 | 1.06 |
| Ago | 0.68 | 34 | 0.499 | 0.23 | −0.43 | 0.88 | 0.01 | 12 | 0.920 | 0.00 | 1.12 | 11 | 0.310 | 0.09 | 1.73 | 25 | 0.200 | 0.06 | 0.51 |
| Sop | −0.39 | 34 | 0.702 | −0.13 | −0.78 | 0.53 | 0.30 | 12 | 0.600 | 0.02 | 0.05 | 12 | 0.820 | 0.00 | 2.50 | 26 | 0.130 | 0.09 | 0.73 |
| Pain | −0.52 | 34 | 0.607 | −0.17 | −0.83 | 0.48 | 0.04 | 12 | 0.850 | 0.00 | 2.95 | 12 | 0.110 | 0.20 | 3.62 | 26 | 0.070 | 0.12 | 1.46 |
| GSI | −0.29 | 27 | 0.776 | −0.10 | −0.75 | 0.56 | 0.89 | 12 | 0.360 | 0.07 | 0.45 | 12 | 0.520 | 0.04 | 2.65 | 26 | 0.120 | 0.09 | 0.93 |
| LTDep | 1.06 | 34 | 0.296 | 0.35 | −0.31 | 1.01 | 0.20 | 11 | 0.670 | 0.02 | 0.02 | 10 | 0.890 | 0.00 | 0.73 | 23 | 0.400 | 0.03 | 0.96 |
| f (suic. thoughts) | 1.78 | 15 | 0.096 | 0.68 | −0.03 | 1.38 | 0.00 | 10 | 0.980 | 0.00 | 0.01 | 12 | 0.910 | 0.00 | 3.80 | 24 | 0.060 | 0.14 | 0.93 |
| f (suic. attempts) | 1.74 | 18 | 0.099 | 0.58 | −0.09 | 1.24 | 0.00 | 12 | 0.970 | 0.00 | 0.23 | 12 | 0.640 | 0.02 | 1.04 | 26 | 0.320 | 0.04 | 0.71 |
| BDI | |||||||||||||||||||
| total score | 0.88 | 34 | 0.384 | 0.29 | −0.37 | 0.95 | 0.70 | 12 | 0.420 | 0.05 | 0.27 | 11 | 0.610 | 0.02 | 3.71 | 25 | 0.070 | 0.13 | 1.37 |
| BED | |||||||||||||||||||
| Weight | |||||||||||||||||||
| BMI | 4.10 | 248 | 0.000 | 0.52 | 0.27 | 0.77 | 30.94 | 122 | 0.000 | 0.20 | 8.44 | 122 | 0.000 | 0.06 | 43.50 | 246 | 0.000 | 0.15 | 4.E+07 |
| zBMI | 9.69 | 238 | 0.000 | 1.23 | 0.95 | 1.50 | 8.18 | 122 | 0.000 | 0.06 | 6.72 | 122 | 0.010 | 0.05 | 96.50 | 246 | 0.000 | 0.28 | ∞ |
| EDEQ | |||||||||||||||||||
| total | −3.67 | 231 | 0.000 | −0.48 | −0.74 | −0.22 | 3.36 | 100 | 0.070 | 0.03 | 0.43 | 99 | 0.520 | 0 | 0.11 | 201 | 0.740 | 0.00 | 0.16 |
| Restraint | −2.42 | 231 | 0.016 | −0.32 | −0.58 | −0.06 | 3.65 | 100 | 0.060 | 0.04 | 7.04 | 99 | 0.010 | 0.07 | 0.92 | 201 | 0.340 | 0.00 | 0.20 |
| EatingConcern | −2.39 | 231 | 0.018 | −0.31 | −0.57 | −0.05 | 5.00 | 100 | 0.030 | 0.05 | 1.31 | 99 | 0.250 | 0.01 | 0.39 | 201 | 0.530 | 0.00 | 0.22 |
| WeightsConcern | −3.55 | 231 | 0.000 | −0.47 | −0.73 | −0.21 | 5.66 | 100 | 0.020 | 0.05 | 0.51 | 99 | 0.480 | 0.01 | 0.12 | 201 | 0.730 | 0.00 | 0.16 |
| ShapeConcern | −3.37 | 231 | 0.001 | −0.44 | −0.70 | −0.18 | 1.65 | 100 | 0.200 | 0.02 | 0.34 | 99 | 0.560 | 0.00 | 0.08 | 201 | 0.780 | 0.00 | 0.17 |
| f (eat. episode) | 0.18 | 229 | 0.856 | 0.02 | −0.23 | 0.28 | 0.05 | 99 | 0.830 | 0.00 | 3.61 | 98 | 0.060 | 0.04 | 4.25 | 199 | 0.040 | 0.02 | 0.68 |
| f (loss control) | 0.11 | 225 | 0.916 | 0.01 | −0.25 | 0.27 | 3.13 | 98 | 0.080 | 0.03 | 3.09 | 94 | 0.080 | 0.03 | 0.05 | 194 | 0.820 | 0.00 | 0.16 |
| f (binge days) | −0.79 | 227 | 0.431 | −0.10 | −0.36 | 0.16 | 0.38 | 99 | 0.540 | 0.00 | 0.17 | 96 | 0.680 | 0.00 | 0.35 | 197 | 0.550 | 0.00 | 0.17 |
| f (purge) | −0.32 | 227 | 0.747 | −0.04 | −0.30 | 0.22 | 0.67 | 96 | 0.410 | 0.01 | 0.00 | 98 | 0.980 | 0.00 | 0.13 | 196 | 0.720 | 0.00 | 0.15 |
| f (lax.) | −0.26 | 227 | 0.796 | −0.03 | −0.29 | 0.23 | 0.97 | 98 | 0.330 | 0.01 | 0.06 | 98 | 0.810 | 0.00 | 0.04 | 197 | 0.840 | 0.00 | 0.16 |
| f (exer.) | 0.95 | 229 | 0.341 | 0.13 | −0.13 | 0.38 | 1.30 | 98 | 0.260 | 0.01 | 0.41 | 99 | 0.520 | 0.00 | 1.57 | 199 | 0.210 | 0.01 | 0.35 |
| FBeK | |||||||||||||||||||
| Attract. | 2.34 | 191 | 0.020 | 0.31 | 0.05 | 0.57 | 5.37 | 96 | 0.020 | 0.05 | 1.70 | 103 | 0.200 | 0.02 | 2.36 | 201 | 0.130 | 0.01 | 0.30 |
| Accent. | −3.98 | 224 | 0.000 | −0.52 | −0.78 | −0.26 | 13.95 | 96 | 0.000 | 0.13 | 12.77 | 103 | 0.000 | 0.11 | 1.14 | 201 | 0.290 | 0.01 | 0.28 |
| Worry | −2.33 | 214 | 0.021 | −0.31 | −0.56 | −0.05 | 8.20 | 96 | 0.010 | 0.08 | 0.85 | 103 | 0.360 | 0.01 | 0.13 | 201 | 0.710 | 0.00 | 0.17 |
| Sex.Discomfort | −0.70 | 231 | 0.488 | −0.09 | −0.35 | 0.17 | 1.63 | 96 | 0.200 | 0.02 | 1.02 | 103 | 0.320 | 0.01 | 2.20 | 201 | 0.140 | 0.01 | 0.54 |
| SCL−27-plus | |||||||||||||||||||
| Dep | −0.57 | 237 | 0.572 | −0.07 | −0.33 | 0.18 | 0.07 | 98 | 0.790 | 0.00 | 1.14 | 104 | 0.290 | 0.01 | 0.07 | 204 | 0.800 | 0.00 | 0.17 |
| Veg | −3.16 | 236 | 0.002 | −0.41 | −0.67 | −0.15 | 0.47 | 98 | 0.500 | 0.00 | 0.79 | 104 | 0.380 | 0.01 | 1.41 | 204 | 0.240 | 0.01 | 0.34 |
| Ago | −1.34 | 235 | 0.181 | −0.17 | −0.43 | 0.08 | 0.08 | 98 | 0.780 | 0.00 | 0.08 | 103 | 0.780 | 0.00 | 3.02 | 203 | 0.080 | 0.01 | 0.68 |
| Sop | −3.07 | 236 | 0.002 | −0.40 | −0.65 | −0.14 | 0.09 | 98 | 0.770 | 0.00 | 0.38 | 104 | 0.540 | 0.00 | 0.31 | 204 | 0.580 | 0.00 | 0.17 |
| Pain | −2.00 | 235 | 0.047 | −0.26 | −0.52 | 0.00 | 0.68 | 98 | 0.410 | 0.01 | 0.14 | 103 | 0.710 | 0.00 | 0.20 | 203 | 0.650 | 0.00 | 0.18 |
| GSI | −2.81 | 237 | 0.005 | −0.36 | −0.62 | −0.11 | 0.02 | 98 | 0.890 | 0.00 | 0.56 | 105 | 0.450 | 0.01 | 0.86 | 205 | 0.350 | 0.00 | 0.25 |
| LTDep | −1.82 | 217 | 0.070 | −0.24 | −0.50 | 0.02 | 0.91 | 83 | 0.340 | 0.01 | 2.68 | 104 | 0.100 | 0.03 | 8.77 | 189 | 0.000 | 0.04 | 12.406 |
| f (suic. thoughts) | −1.15 | 236 | 0.252 | −0.15 | −0.40 | 0.11 | 3.21 | 98 | 0.080 | 0.03 | 0.81 | 106 | 0.370 | 0.01 | 0.83 | 206 | 0.360 | 0.00 | 0.23 |
| f (suic. attempts) | −0.91 | 238 | 0.363 | −0.12 | −0.37 | 0.14 | 0.83 | 99 | 0.360 | 0.01 | 3.07 | 105 | 0.080 | 0.03 | 1.13 | 206 | 0.290 | 0.01 | 0.23 |
| BDI | |||||||||||||||||||
| total score | −2.25 | 225 | 0.025 | −0.29 | −0.55 | −0.04 | 0.00 | 98 | 0.970 | 0.00 | 1.42 | 107 | 0.240 | 0.01 | 0.37 | 207 | 0.540 | 0.00 | 0.17 |
| EDNOS | |||||||||||||||||||
| Weight | |||||||||||||||||||
| BMI | 0.79 | 18 | 0.439 | 0.35 | −0.54 | 1.23 | 9.83 | 7 | 0.020 | 0.58 | 12.28 | 7 | 0.010 | 0.64 | 0.00 | 16 | 0.970 | 0.00 | 0.43 |
| zBMI | 0.04 | 13 | 0.972 | 0.02 | −0.86 | 0.89 | 4.49 | 7 | 0.070 | 0.39 | 0.00 | 7 | 0.990 | 0.00 | 0.31 | 16 | 0.590 | 0.02 | 0.43 |
| EDEQ | |||||||||||||||||||
| total | −0.53 | 17 | 0.603 | −0.24 | −1.14 | 0.664 | 0.04 | 6 | 0.850 | 0.01 | 1.66 | 5 | 0.250 | 0.25 | 0.39 | 13 | 0.540 | 0.03 | 0.49 |
| Restraint | −1.28 | 17 | 0.217 | −0.59 | −1.50 | 0.34 | 3.60 | 6 | 0.110 | 0.37 | 0.83 | 5 | 0.400 | 0.14 | 0.43 | 13 | 0.520 | 0.03 | 0.47 |
| EatingConcern | −0.46 | 17 | 0.653 | −0.21 | −1.11 | 0.70 | 0.48 | 6 | 0.510 | 0.07 | 2.05 | 5 | 0.210 | 0.29 | 0.02 | 13 | 0.890 | 0.00 | 0.42 |
| WeightsConcern | −0.02 | 17 | 0.986 | −0.01 | −0.91 | 0.89 | 0.00 | 6 | 0.950 | 0.00 | 1.38 | 5 | 0.290 | 0.22 | 1.63 | 13 | 0.220 | 0.11 | 0.71 |
| ShapeConcern | −0.17 | 17 | 0.867 | −0.08 | −0.98 | 0.82 | 0.79 | 6 | 0.410 | 0.12 | 1.97 | 5 | 0.220 | 0.28 | 0.54 | 13 | 0.470 | 0.04 | 0.49 |
| f (eat. episode) | −0.19 | 16 | 0.849 | −0.09 | −1.02 | 0.84 | 3.13 | 5 | 0.140 | 0.39 | 0.00 | 4 | 1.00 | 0.00 | 3.60 | 11 | 0.080 | 0.25 | 0.92 |
| f (loss control) | −1.19 | 9 | 0.267 | −0.62 | −1.56 | 0.35 | 3.28 | 5 | 0.130 | 0.40 | 0.03 | 4 | 0.870 | 0.01 | 0.79 | 11 | 0.390 | 0.07 | 0.52 |
| f (binge days) | −0.91 | 8 | 0.390 | −0.48 | −1.42 | 0.47 | 0.91 | 5 | 0.380 | 0.15 | 0.00 | 4 | 1.00 | 0.00 | 2.12 | 11 | 0.170 | 0.16 | 0.69 |
| f (purge) | −0.76 | 17 | 0.461 | −0.35 | −1.25 | 0.57 | - | - | - | - | 0.00 | 5 | 1.00 | 0.00 | 1.85 | 12 | 0.200 | 0.13 | 0.66 |
| f (lax.) | - | - | - | - | - | - | - | - | - | - | - | - | - | - | - | - | - | - | - |
| f (exer.) | −0.73 | 17 | 0.474 | −0.34 | −1.24 | 0.576 | 1.13 | 5 | 0.340 | 0.18 | 1.03 | 5 | 0.360 | 0.17 | 1.02 | 12 | 0.330 | 0.08 | 0.58 |
| FBeK | |||||||||||||||||||
| Attract. | −0.81 | 17 | 0.428 | −0.37 | −1.28 | 0.54 | 0.82 | 6 | 0.400 | 0.12 | 1.65 | 5 | 0.260 | 0.25 | 0.27 | 13 | 0.610 | 0.02 | 0.44 |
| Accent. | 0.39 | 17 | 0.704 | 0.18 | −0.73 | 1.08 | 7.55 | 6 | 0.030 | 0.56 | 1.37 | 5 | 0.300 | 0.21 | 0.39 | 13 | 0.550 | 0.03 | 0.47 |
| Worry | 0.63 | 17 | 0.537 | 0.29 | −0.62 | 1.19 | 3.95 | 6 | 0.090 | 0.40 | 0.06 | 5 | 0.810 | 0.01 | 1.34 | 13 | 0.270 | 0.09 | 0.68 |
| Sex.Discomfort | 1.00 | 17 | 0.332 | 0.46 | −0.46 | 1.37 | 0.00 | 6 | 0.950 | 0.00 | 0.53 | 5 | 0.500 | 0.10 | 0.28 | 13 | 0.610 | 0.02 | 0.46 |
| SCL−27-plus | |||||||||||||||||||
| Dep | 1.21 | 17 | 0.242 | 0.56 | −0.37 | 1.47 | 1.20 | 6 | 0.310 | 0.17 | 7.14 | 5 | 0.040 | 0.59 | 0.09 | 13 | 0.760 | 0.01 | 0.43 |
| Veg | 0.43 | 17 | 0.670 | 0.20 | −0.71 | 1.10 | 1.31 | 6 | 0.300 | 0.18 | 0.15 | 5 | 0.720 | 0.03 | 5.35 | 13 | 0.040 | 0.29 | 3.61 |
| Ago | 0.76 | 17 | 0.461 | 0.35 | −0.57 | 1.25 | 2.81 | 6 | 0.140 | 0.32 | 0.21 | 5 | 0.670 | 0.04 | 0.81 | 13 | 0.380 | 0.06 | 0.56 |
| Sop | 0.14 | 17 | 0.891 | 0.06 | −0.84 | 0.96 | 0.31 | 6 | 0.600 | 0.05 | 3.56 | 5 | 0.120 | 0.42 | 0.70 | 13 | 0.420 | 0.05 | 0.56 |
| Pain | 0.90 | 17 | 0.382 | 0.41 | −0.51 | 1.32 | 6.68 | 6 | 0.040 | 0.53 | 4.20 | 5 | 0.100 | 0.46 | 0.10 | 13 | 0.760 | 0.01 | 0.43 |
| GSI | 0.96 | 17 | 0.353 | 0.44 | −0.48 | 1.35 | 0.50 | 6 | 0.510 | 0.08 | 3.36 | 5 | 0.130 | 0.40 | 1.34 | 13 | 0.270 | 0.09 | 0.85 |
| LTDep | 1.62 | 17 | 0.123 | 0.75 | −0.20 | 1.67 | 10.40 | 5 | 0.020 | 0.68 | 0.02 | 4 | 0.890 | 0.01 | 1.88 | 11 | 0.200 | 0.15 | 1.14 |
| f (suic. thoughts) | 1.66 | 9 | 0.132 | 0.72 | −0.22 | 1.64 | 0.48 | 6 | 0.510 | 0.07 | 0.34 | 6 | 0.580 | 0.05 | 2.20 | 13 | 0.160 | 0.14 | 1.12 |
| f (suic. attempts) | 1.00 | 8 | 0.347 | 0.47 | −0.47 | 1.40 | 0.00 | 5 | 1.00 | 0.00 | - | - | - | - | - | - | - | - | - |
| BDI | |||||||||||||||||||
| total score | 0.67 | 17 | 0.512 | 0.31 | −0.60 | 1.21 | 0.07 | 6 | 0.790 | 0.01 | 0.71 | 5 | 0.440 | 0.13 | 0.68 | 13 | 0.420 | 0.05 | 0.50 |
| ED Group * | DOT | est. | SE | df | t | p |
|---|---|---|---|---|---|---|
| AN | 0 | −0.07 | 0.04 | 422 | −1.50 | 0.134 |
| 7 | −0.09 | 0.04 | 402 | −2.02 | 0.044 | |
| 14 | −0.11 | 0.04 | 393 | −2.53 | 0.012 | |
| 21 | −0.13 | 0.04 | 394 | −3.02 | 0.003 | |
| 28 | −0.16 | 0.04 | 405 | −3.50 | 0.001 | |
| 35 | −0.18 | 0.04 | 427 | −3.94 | 0.000 | |
| 42 | −0.20 | 0.05 | 460 | −4.34 | 0.000 | |
| 49 | −0.22 | 0.05 | 506 | −4.70 | 0.000 | |
| 56 | −0.24 | 0.05 | 565 | −5.03 | 0.000 | |
| 63 | −0.26 | 0.05 | 639 | −5.31 | 0.000 | |
| BED | 0 | 0.03 | 0.03 | 427 | 1.26 | 0.207 |
| 7 | 0.06 | 0.03 | 403 | 2.08 | 0.038 | |
| 14 | 0.08 | 0.03 | 392 | 2.90 | 0.004 | |
| 21 | 0.10 | 0.03 | 395 | 3.69 | 0.000 | |
| 28 | 0.12 | 0.03 | 413 | 4.45 | 0.000 | |
| 35 | 0.14 | 0.03 | 445 | 5.14 | 0.000 | |
| 42 | 0.16 | 0.03 | 493 | 5.77 | 0.000 | |
| 49 | 0.19 | 0.03 | 559 | 6.32 | 0.000 | |
| 56 | 0.21 | 0.03 | 645 | 6.79 | 0.000 | |
| 63 | 0.23 | 0.03 | 755 | 7.20 | 0.000 | |
| BN | 0 | 0.04 | 0.07 | 425 | 0.57 | 0.566 |
| 7 | 0.06 | 0.07 | 400 | 0.81 | 0.416 | |
| 14 | 0.07 | 0.07 | 391 | 1.05 | 0.294 | |
| 21 | 0.09 | 0.07 | 396 | 1.28 | 0.201 | |
| 28 | 0.11 | 0.07 | 415 | 1.49 | 0.136 | |
| 35 | 0.12 | 0.07 | 450 | 1.69 | 0.092 | |
| 42 | 0.14 | 0.08 | 501 | 1.86 | 0.063 | |
| 49 | 0.16 | 0.08 | 572 | 2.01 | 0.045 | |
| 56 | 0.17 | 0.08 | 664 | 2.14 | 0.033 | |
| 63 | 0.19 | 0.08 | 780 | 2.24 | 0.025 | |
| EDNOS | 0 | 0.14 | 0.10 | 419 | 1.41 | 0.159 |
| 7 | 0.11 | 0.10 | 399 | 1.17 | 0.243 | |
| 14 | 0.09 | 0.10 | 390 | 0.92 | 0.360 | |
| 21 | 0.06 | 0.10 | 392 | 0.66 | 0.512 | |
| 28 | 0.04 | 0.10 | 404 | 0.40 | 0.693 | |
| 35 | 0.01 | 0.10 | 428 | 0.14 | 0.892 | |
| 42 | −0.01 | 0.10 | 463 | −0.11 | 0.909 | |
| 49 | −0.04 | 0.10 | 511 | −0.35 | 0.724 | |
| 56 | −0.06 | 0.10 | 573 | −0.58 | 0.564 | |
| 63 | −0.09 | 0.11 | 652 | −0.79 | 0.432 |
References
- Treasure, J.; Duarte, T.A.; Schmidt, U. Eating disorders. Lancet 2020, 395, 899–911. [Google Scholar] [CrossRef]
- American Psychiatric Association. Diagnostic and Statistical Manual of Mental Disorders, 5th ed.; American Psychiatric Publishing: Washington, DC, USA, 2013; ISBN 0890425558. [Google Scholar]
- Qian, J.; Wu, Y.; Liu, F.; Zhu, Y.; Jin, H.; Zhang, H.; Wan, Y.; Li, C.; Yu, D. An update on the prevalence of eating disorders in the general population: A systematic review and meta-analysis. Eat. Weight Disord. 2021, 27, 415–428. [Google Scholar] [CrossRef] [PubMed]
- Santomauro, D.F.; Melen, S.; Mitchison, D.; Vos, T.; Whiteford, H.; Ferrari, A.J. The hidden burden of eating disorders: An extension of estimates from the Global Burden of Disease Study 2019. Lancet Psychiatry 2021, 8, 320–328. [Google Scholar] [CrossRef]
- Galmiche, M.; Déchelotte, P.; Lambert, G.; Tavolacci, M.P. Prevalence of eating disorders over the 2000–2018 period: A systematic literature review. Am. J. Clin. Nutr. 2019, 109, 1402–1413. [Google Scholar] [CrossRef]
- Chesney, E.; Goodwin, G.M.; Fazel, S. Risks of all-cause and suicide mortality in mental disorders: A meta-review. World Psychiatry 2014, 13, 153–160. [Google Scholar] [CrossRef] [Green Version]
- Udo, T.; Grilo, C.M. Psychiatric and medical correlates of DSM-5 eating disorders in a nationally representative sample of adults in the United States. Int. J. Eat. Disord. 2019, 52, 42–50. [Google Scholar] [CrossRef] [Green Version]
- Wu, J.; Liu, J.; Li, S.; Ma, H.; Wang, Y. Trends in the prevalence and disability-adjusted life years of eating disorders from 1990 to 2017: Results from the Global Burden of Disease Study 2017. Epidemiol. Psychiatr. Sci. 2020, 29, e191. [Google Scholar] [CrossRef]
- Streatfeild, J.; Hickson, J.; Austin, S.B.; Hutcheson, R.; Kandel, J.S.; Lampert, J.G.; Myers, E.M.; Richmond, T.K.; Samnaliev, M.; Velasquez, K.; et al. Social and economic cost of eating disorders in the United States: Evidence to inform policy action. Int. J. Eat. Disord. 2021, 54, 851–868. [Google Scholar] [CrossRef]
- Douglas, V.; Balas, B.; Gordon, K. Facial femininity and perceptions of eating disorders: A reverse-correlation study. PLoS ONE 2021, 16, e0255766. [Google Scholar] [CrossRef]
- Gordon, K.H.; Perez, M.; Joiner, T.E. The impact of racial stereotypes on eating disorder recognition. Int. J. Eat. Disord. 2002, 32, 219–224. [Google Scholar] [CrossRef]
- Gorrell, S.; Murray, S.B. Eating Disorders in Males. Child Adolesc. Psychiatr. Clin. N. Am. 2019, 28, 641–651. [Google Scholar] [CrossRef] [PubMed]
- Halbeisen, G.; Brandt, G.; Paslakis, G. A Plea For Diversity in Eating Disorders Research. Front. Psychiatry 2022, 13, 145. [Google Scholar] [CrossRef]
- Richardson, C.; Paslakis, G. Men’s experiences of eating disorder treatment: A qualitative systematic review of men-only studies. J. Psychiatr. Ment. Health Nurs. 2021, 28, 237–250. [Google Scholar] [CrossRef] [PubMed]
- Ferrari, A. Global, regional, and national burden of 12 mental disorders in 204 countries and territories, 1990–2019: A systematic analysis for the Global Burden of Disease Study 2019. Lancet Psychiatry 2022, 9, 137–150. [Google Scholar] [CrossRef]
- Weltzin, T.E.; Cornella-Carlson, T.; Fitzpatrick, M.E.; Kennington, B.; Bean, P.; Jefferies, C. Treatment Issues and Outcomes for Males With Eating Disorders. Eat. Disord. 2012, 20, 444–459. [Google Scholar] [CrossRef]
- Murray, S.B.; Nagata, J.M.; Griffiths, S.; Calzo, J.P.; Brown, T.A.; Mitchison, D.; Blashill, A.J.; Mond, J.M. The enigma of male eating disorders: A critical review and synthesis. Clin. Psychol. Rev. 2017, 57, 1–11. [Google Scholar] [CrossRef]
- Flores, L.E.; Muir, R.; Weeks, I.; Burton Murray, H.; Silver, J.K. Analysis of Age, Race, Ethnicity, and Sex of Participants in Clinical Trials Focused on Eating Disorders. JAMA Netw. Open 2022, 5, e220051. [Google Scholar] [CrossRef]
- Gallagher, K.A.; Sonneville, K.R.; Hazzard, V.M.; Carson, T.L.; Needham, B.L. Evaluating gender bias in an eating disorder risk assessment questionnaire for athletes. Eat. Disord. 2021, 29, 29–41. [Google Scholar] [CrossRef]
- Talbot, D.; Mahlberg, J. Exploration of height dissatisfaction, muscle dissatisfaction, body ideals, and eating disorder symptoms in men. J. Am. Coll. Health 2021, 1–6. [Google Scholar] [CrossRef]
- Matsumoto, A.; Rodgers, R.F. A review and integrated theoretical model of the development of body image and eating disorders among midlife and aging men. Clin. Psychol. Rev. 2020, 81, 101903. [Google Scholar] [CrossRef]
- Núñez-Navarro, A.; Agüera, Z.; Krug, I.; Jiménez-Murcia, S.; Sánchez, I.; Araguz, N.; Gorwood, P.; Granero, R.; Penelo, E.; Karwautz, A.; et al. Do men with eating disorders differ from women in clinics, psychopathology and personality? Eur. Eat. Disord. Rev. 2012, 20, 23–31. [Google Scholar] [CrossRef] [PubMed]
- Forrest, L.N.; Perkins, N.M.; Lavender, J.M.; Smith, A.R. Using network analysis to identify central eating disorder symptoms among men. Int. J. Eat. Disord. 2019, 52, 871–884. [Google Scholar] [CrossRef] [PubMed]
- Prnjak, K.; Fried, E.; Mond, J.; Hay, P.; Bussey, K.; Griffiths, S.; Trompeter, N.; Lonergan, A.; Mitchison, D. Identifying components of drive for muscularity and leanness associated with core body image disturbance: A network analysis. Psychol. Assess. 2021, 34, 353–366. [Google Scholar] [CrossRef] [PubMed]
- Nagata, J.M.; Ganson, K.T.; Murray, S.B. Eating disorders in adolescent boys and young men: An update. Curr. Opin. Pediatr. 2020, 32, 476–481. [Google Scholar] [CrossRef] [PubMed]
- Lavender, J.M.; Brown, T.A.; Murray, S.B. Men, Muscles, and Eating Disorders: An Overview of Traditional and Muscularity-Oriented Disordered Eating. Curr. Psychiatry Rep. 2017, 19, 32. [Google Scholar] [CrossRef] [PubMed]
- Agüera, Z.; Paslakis, G.; Munguía, L.; Sánchez, I.; Granero, R.; Sánchez-González, J.; Steward, T.; Jiménez-Murcia, S.; Fernández-Aranda, F. Gender-Related Patterns of Emotion Regulation among Patients with Eating Disorders. J. Clin. Med. 2019, 8, 161. [Google Scholar] [CrossRef] [Green Version]
- Rica, R.; Solar, M.; Compte, E.J.; Sepúlveda, A.R. Establishing the optimal male cut-off point: Confirmatory factor analysis of the eating disorder examination-questionnaire (EDE-Q) in a representative sample of Spanish university students. Eat. Weight Disord. 2021, 27, 969–977. [Google Scholar] [CrossRef]
- Murray, S.B.; Rieger, E.; Hildebrandt, T.; Karlov, L.; Russell, J.; Boon, E.; Dawson, R.T.; Touyz, S.W. A comparison of eating, exercise, shape, and weight related symptomatology in males with muscle dysmorphia and anorexia nervosa. Body Image 2012, 9, 193–200. [Google Scholar] [CrossRef]
- Schaefer, L.M.; Smith, K.E.; Leonard, R.; Wetterneck, C.; Smith, B.; Farrell, N.; Riemann, B.C.; Frederick, D.A.; Schaumberg, K.; Klump, K.L.; et al. Identifying a male clinical cutoff on the Eating Disorder Examination-Questionnaire (EDE-Q). Int. J. Eat. Disord. 2018, 51, 1357–1360. [Google Scholar] [CrossRef]
- Murray, S.B.; Brown, T.A.; Blashill, A.J.; Compte, E.J.; Lavender, J.M.; Mitchison, D.; Mond, J.M.; Keel, P.K.; Nagata, J.M. The development and validation of the muscularity-oriented eating test: A novel measure of muscularity-oriented disordered eating. Int. J. Eat. Disord. 2019, 52, 1389–1398. [Google Scholar] [CrossRef]
- Tylka, T.L.; Bergeron, D.; Schwartz, J.P. Development and psychometric evaluation of the Male Body Attitudes Scale (MBAS). Body Image 2005, 2, 161–175. [Google Scholar] [CrossRef]
- Hildebrandt, T.; Walker, D.C.; Alfano, L.; Delinsky, S.; Bannon, K. Development and validation of a male specific body checking questionnaire. Int. J. Eat. Disord. 2010, 43, 77–87. [Google Scholar] [CrossRef] [PubMed] [Green Version]
- Stanford, S.C.; Lemberg, R. Measuring Eating Disorders in Men: Development of the Eating Disorder Assessment for Men (EDAM). Eat. Disord. 2012, 20, 427–436. [Google Scholar] [CrossRef] [PubMed]
- Hilbert, A.; Hoek, H.W.; Schmidt, R. Evidence-based clinical guidelines for eating disorders: International comparison. Curr. Opin. Psychiatry 2017, 30, 423. [Google Scholar] [CrossRef] [PubMed] [Green Version]
- Burnette, C.B.; Luzier, J.L.; Weisenmuller, C.M.; Boutté, R.L. A systematic review of sociodemographic reporting and representation in eating disorder psychotherapy treatment trials in the United States. Int. J. Eat. Disord. 2022, 55, 423–454. [Google Scholar] [CrossRef]
- Herpertz, S.; Fichter, M.; Herpertz-Dahlmann, B.; Hilbert, A.; Tuschen-Caffier, B.; Vocks, S.; Zeeck, A. S3-Leitlinie Diagnostik und Behandlung der Essstörungen; Springer: Berlin/Heidelberg, Germany, 2018. [Google Scholar]
- Lyons, G.; McAndrew, S.; Warne, T. Disappearing in a Female World: Men’s Experiences of Having an Eating Disorder (ED) and How It Impacts Their Lives. Issues Ment. Health Nurs. 2019, 40, 557–566. [Google Scholar] [CrossRef]
- Räisänen, U.; Hunt, K. The role of gendered constructions of eating disorders in delayed help-seeking in men: A qualitative interview study. BMJ Open 2014, 4, 4342. [Google Scholar] [CrossRef] [Green Version]
- Thapliyal, P.; Conti, J.; Bandara, R.S.L.; Hay, P. “It exists”: An exploratory study of treatment experiences in men with eating disorders. Aust. Psychol. 2020, 55, 534–545. [Google Scholar] [CrossRef]
- Robinson, K.J.; Mountford, V.A.; Sperlinger, D.J. Being men with eating disorders: Perspectives of male eating disorder service-users. J. Health Psychol. 2013, 18, 176–186. [Google Scholar] [CrossRef]
- Kinnaird, E.; Norton, C.; Pimblett, C.; Stewart, C.; Tchanturia, K. “There’s nothing there for guys”. Do men with eating disorders want treatment adaptations? A qualitative study. Eat. Weight Disord. 2019, 24, 845–852. [Google Scholar] [CrossRef] [Green Version]
- Strobel, C.; Quadflieg, N.; Voderholzer, U.; Naab, S.; Fichter, M.M. Short- and long-term outcome of males treated for anorexia nervosa: A review of the literature. Eat. Weight Disord. 2018, 23, 541–552. [Google Scholar] [CrossRef] [PubMed]
- Bulik, C.M.; Berkman, N.D.; Brownley, K.A.; Sedway, J.A.; Lohr, K.N. Anorexia nervosa treatment: A systematic review of randomized controlled trials. Int. J. Eat. Disord. 2007, 40, 310–320. [Google Scholar] [CrossRef] [PubMed]
- Coelho, J.S.; Suen, J.; Marshall, S.; Burns, A.; Geller, J.; Lam, P.Y. Gender differences in symptom presentation and treatment outcome in children and youths with eating disorders. J. Eat. Disord. 2021, 9, 113. [Google Scholar] [CrossRef] [PubMed]
- Nagata, J.M.; Bojorquez-Ramirez, P.; Nguyen, A.; Ganson, K.T.; Machen, V.I.; Cattle, C.J.; Buckelew, S.M.; Garber, A.K. Sex differences in refeeding among hospitalized adolescents and young adults with eating disorders. Int. J. Eat. Disord. 2022, 55, 247–253. [Google Scholar] [CrossRef]
- Gorrell, S.; Hughes, E.K.; Sawyer, S.M.; Roberts, S.R.; Nagata, J.M.; Yeo, M.; Lock, J.; Le Grange, D. Gender-based clinical differences in evidence-based treatment for adolescent anorexia nervosa: Analysis of aggregated randomized controlled trials. Eat. Weight Disord. 2021, 27, 1123–1130. [Google Scholar] [CrossRef]
- Agüera, Z.; Sánchez, I.; Granero, R.; Riesco, N.; Steward, T.; Martín-Romera, V.; Jiménez-Murcia, S.; Romero, X.; Caroleo, M.; Segura-García, C.; et al. Short-Term Treatment Outcomes and Dropout Risk in Men and Women with Eating Disorders. Eur. Eat. Disord. Rev. 2017, 25, 293–301. [Google Scholar] [CrossRef]
- Fernández-Aranda, F.; Krug, I.; Jiménez-Murcia, S.; Granero, R.; Núñez, A.; Penelo, E.; Solano, R.; Treasure, J. Male eating disorders and therapy: A controlled pilot study with one year follow-up. J. Behav. Ther. Exp. Psychiatry 2009, 40, 479–486. [Google Scholar] [CrossRef]
- Lydecker, J.A.; Gueorguieva, R.; Masheb, R.; White, M.A.; Grilo, C.M. Examining sex as a predictor and moderator of treatment outcomes for binge-eating disorder: Analysis of aggregated randomized controlled trials. Int. J. Eat. Disord. 2020, 53, 20–30. [Google Scholar] [CrossRef]
- Strobel, C.; Quadflieg, N.; Naab, S.; Voderholzer, U.; Fichter, M.M. Long-term outcomes in treated males with anorexia nervosa and bulimia nervosa—A prospective, gender-matched study. Int. J. Eat. Disord. 2019, 52, 1353–1364. [Google Scholar] [CrossRef]
- Fichter, M.M.; Naab, S.; Voderholzer, U.; Quadflieg, N. Mortality in males as compared to females treated for an eating disorder: A large prospective controlled study. Eat. Weight Disord. 2021, 26, 1627–1637. [Google Scholar] [CrossRef]
- Fairburn, C.G.; Beglin, S.J. Assessment of eating disorders: Interview or self-report questionnaire? Int. J. Eat. Disord. 1994, 16, 363–370. [Google Scholar] [CrossRef]
- Fairburn, C.G.; Cooper, Z. The eating disorder examination. In Binge Eating: Nature, Assessment and Treatment; Fairburn, C.G., Wilson, G.T., Eds.; Guilford Press: New York, NY, USA, 1993; pp. 317–360. [Google Scholar]
- Hilbert, A.; Tuschen-Caffier, B. Eating Disorder Examination—Questionnaire; dgvt-Verlag: Tübingen, Germany, 2006; pp. 1–7. [Google Scholar]
- Hilbert, A.; Tuschen-Caffier, B.; Karwautz, A.; Niederhofer, H.; Munsch, S. Eating Disorder Examination-Questionnaire Evaluation der Deutschsprachigen Übersetzung. Diagnostica 2007, 53, 144–154. [Google Scholar] [CrossRef]
- Brähler, E.; Strauß, B.; Hessel, A.; Schumacher, J. Normierung des Fragebogens zur Beurteilung des eigenen Körpers (FBeK) an einer repräsentativen Bevölkerungsstichprobe. Diagnostica 2000, 46, 156–164. [Google Scholar] [CrossRef]
- Hardt, J. The symptom checklist-27-plus (SCL-27-plus): A modern conceptualization of a traditional screening instrument. GMS Psycho-Social Med. 2008, 5, Doc08. [Google Scholar]
- Henn, L.; Braks, K.; Brian, T.; Herke, M.; Hardt, J. The symptom checklist SCL-27-plus for patients with eating disorders. Psychother. Psychosom. Med. Psychol. 2013, 63, 201–203. [Google Scholar] [CrossRef]
- Hautzinger, M.; Keller, F.; Kühner, C. BDI-II. Beck-Depressions-Inventar. Revision. 2, Auflage; Pearson: London, UK, 2009. [Google Scholar]
- Cole, T.J.; Green, P.J. Smoothing reference centile curves: The LMS method and penalized likelihood. Stat. Med. 1992, 11, 1305–1319. [Google Scholar] [CrossRef]
- Kromeyer-Hauschild, K.; Wabitsch, M.; Kunze, D.; Geller, F.; Geiß, H.C.; Hesse, V.; Von Hippel, A.; Jaeger, U.; Johnsen, D.; Korte, W.; et al. Perzentile für den Body-mass-Index für das Kindes- und Jugendalter unter Heranziehung verschiedener deutscher Stichproben. Monatsschrift Kinderheilkd. 2001, 149, 807–818. [Google Scholar] [CrossRef] [Green Version]
- Hemmelmann, C.; Brose, S.; Vens, M.; Hebebrand, J.; Ziegler, A. Perzentilen des Body-Mass-Indexauch für 18- bis 80-Jährige? Daten der Nationalen Verzehrsstudie II. DMW-Dtsch. Med. Wochenschr. 2010, 135, 848–852. [Google Scholar] [CrossRef]
- Wang, Y.; Chen, H.J. Use of Percentiles and -Scores in Anthropometry. In Handbook of Anthropometry: Physical Measures of Human Form in Health and Disease; Springer: New York, NY, USA, 2012; pp. 29–48. [Google Scholar] [CrossRef]
- Bates, D.; Mächler, M.; Bolker, B.M.; Walker, S.C. Fitting Linear Mixed-Effects Models Using lme4. J. Stat. Softw. 2015, 67, 48. [Google Scholar] [CrossRef]
- Baayen, R.H.; Davidson, D.J.; Bates, D.M. Mixed-effects modeling with crossed random effects for subjects and items. J. Mem. Lang. 2008, 59, 390–412. [Google Scholar] [CrossRef] [Green Version]
- Fox, J.; Weisberg, S. An {R} Companion to Applied Regression, 3rd ed.; Sage: Thousand Oaks, CA, USA, 2019. [Google Scholar]
- Lenth, R.V. Emmeans: Estimated Marginal Means, aka Least-Squares Means. Available online: https://cran.r-project.org/web/packages/emmeans/index.html (accessed on 4 May 2022).
- Van Den Bergh, D.; Van Doorn, J.; Marsman, M.; Draws, T.; Van Kesteren, E.J.; Derks, K.; Dablander, F.; Gronau, Q.F.; Kucharský, Š.; Gupta, A.R.K.N.; et al. A tutorial on conducting and interpreting a bayesian ANOVA in JASP. Annee Psychol. 2020, 120, 73–96. [Google Scholar] [CrossRef]
- Wagenmakers, E.J.; Love, J.; Marsman, M.; Jamil, T.; Ly, A.; Verhagen, J.; Selker, R.; Gronau, Q.F.; Dropmann, D.; Boutin, B.; et al. Bayesian inference for psychology. Part II: Example applications with JASP. Psychon. Bull. Rev. 2018, 25, 58–76. [Google Scholar] [CrossRef] [PubMed] [Green Version]
- IBM Corp. IBM SPSS Statistics for Windows 28.0 2021; IBM Corp.: Armonk, NY, USA, 2021. [Google Scholar]
- R Core Team. R: A Language and Environment for Statistical Computing 2022; R Core Team: Vienna, Austria, 2022. [Google Scholar]
- JASP Team. JASP (Version 0.16.1); JASP Team: Amsterdam, The Netherlands, 2022. [Google Scholar]
- Wickham, H. ggplot2: Elegant Graphics for Data Analysis. Springer: New York, NY, USA, 2016; ISBN 978-3-319-24277-4. [Google Scholar]
- Pruessner, J.C.; Kirschbaum, C.; Meinlschmid, G.; Hellhammer, D.H. Two formulas for computation of the area under the curve represent measures of total hormone concentration versus time-dependent change. Psychoneuroendocrinology 2003, 28, 916–931. [Google Scholar] [CrossRef]
- Redman, L.M.; Kraus, W.E.; Bhapkar, M.; Das, S.K.; Racette, S.B.; Martin, C.K.; Fontana, L.; Wong, W.W.; Roberts, S.B.; Ravussin, E. Energy requirements in nonobese men and women: Results from CALERIE. Am. J. Clin. Nutr. 2014, 99, 71. [Google Scholar] [CrossRef] [PubMed] [Green Version]
- Berg, K.C.; Peterson, C.B.; Frazier, P.; Crow, S.J. Psychometric evaluation of the eating disorder examination and eating disorder examination-questionnaire: A systematic review of the literature. Int. J. Eat. Disord. 2012, 45, 428–438. [Google Scholar] [CrossRef] [PubMed] [Green Version]
- Holland, G.; Tiggemann, M. A systematic review of the impact of the use of social networking sites on body image and disordered eating outcomes. Body Image 2016, 17, 100–110. [Google Scholar] [CrossRef]
- Melki, J.P.; Hitti, E.A.; Oghia, M.J.; Mufarrij, A.A. Media exposure, mediated social comparison to idealized images of muscularity, and anabolic steroid use. Health Commun. 2015, 30, 473–484. [Google Scholar] [CrossRef]
| ED Group * | Gender | n | Age | DOT | ||||
|---|---|---|---|---|---|---|---|---|
| M | SD | p | M | SD | p | |||
| AN | men | 47 | 24.57 | 8.54 | 0.51 | 43.53 | 22.69 | 0.44 |
| women | 47 | 22.94 | 9.64 | 46.34 | 22.61 | |||
| BN | men | 18 | 33.39 | 10.12 | 0.23 | 44.06 | 17.10 | 0.48 |
| women | 18 | 28.50 | 9.00 | 48.17 | 14.26 | |||
| BED | men | 125 | 34.78 | 13.90 | 0.86 | 45.37 | 15.31 | 0.10 |
| women | 125 | 34.50 | 12.48 | 49.02 | 14.87 | |||
| EDNOS | men | 10 | 30.70 | 14.20 | 0.99 | 49.30 | 25.71 | 0.47 |
| women | 10 | 30.80 | 12.02 | 43.70 | 13.01 | |||
| Predictor * | χ2 | df | p |
|---|---|---|---|
| (Intercept) | 21.06 | 1 | 0.000 |
| DOT | 482.95 | 1 | 0.000 |
| ED Group | 10.51 | 3 | 0.01 |
| Gender | 2.18 | 1 | 0.14 |
| DOT × ED Group | 557.67 | 3 | 0.000 |
| DOT × Gender | 26.49 | 1 | 0.000 |
| ED Group × Gender | 4.92 | 3 | 0.18 |
| DOT × ED Group × Gender | 83.46 | 3 | 0.000 |
Publisher’s Note: MDPI stays neutral with regard to jurisdictional claims in published maps and institutional affiliations. |
© 2022 by the authors. Licensee MDPI, Basel, Switzerland. This article is an open access article distributed under the terms and conditions of the Creative Commons Attribution (CC BY) license (https://creativecommons.org/licenses/by/4.0/).
Share and Cite
Halbeisen, G.; Braks, K.; Huber, T.J.; Paslakis, G. Gender Differences in Treatment Outcomes for Eating Disorders: A Case-Matched, Retrospective Pre–Post Comparison. Nutrients 2022, 14, 2240. https://doi.org/10.3390/nu14112240
Halbeisen G, Braks K, Huber TJ, Paslakis G. Gender Differences in Treatment Outcomes for Eating Disorders: A Case-Matched, Retrospective Pre–Post Comparison. Nutrients. 2022; 14(11):2240. https://doi.org/10.3390/nu14112240
Chicago/Turabian StyleHalbeisen, Georg, Karsten Braks, Thomas J. Huber, and Georgios Paslakis. 2022. "Gender Differences in Treatment Outcomes for Eating Disorders: A Case-Matched, Retrospective Pre–Post Comparison" Nutrients 14, no. 11: 2240. https://doi.org/10.3390/nu14112240
APA StyleHalbeisen, G., Braks, K., Huber, T. J., & Paslakis, G. (2022). Gender Differences in Treatment Outcomes for Eating Disorders: A Case-Matched, Retrospective Pre–Post Comparison. Nutrients, 14(11), 2240. https://doi.org/10.3390/nu14112240