
Effects of Individual Dietary Intervention on Nutrient Intake in Postpartum Japanese Women: A Randomized Controlled Trial

 ,
,  ,
, 
Abstract
:1. Introduction
2. Materials and Methods
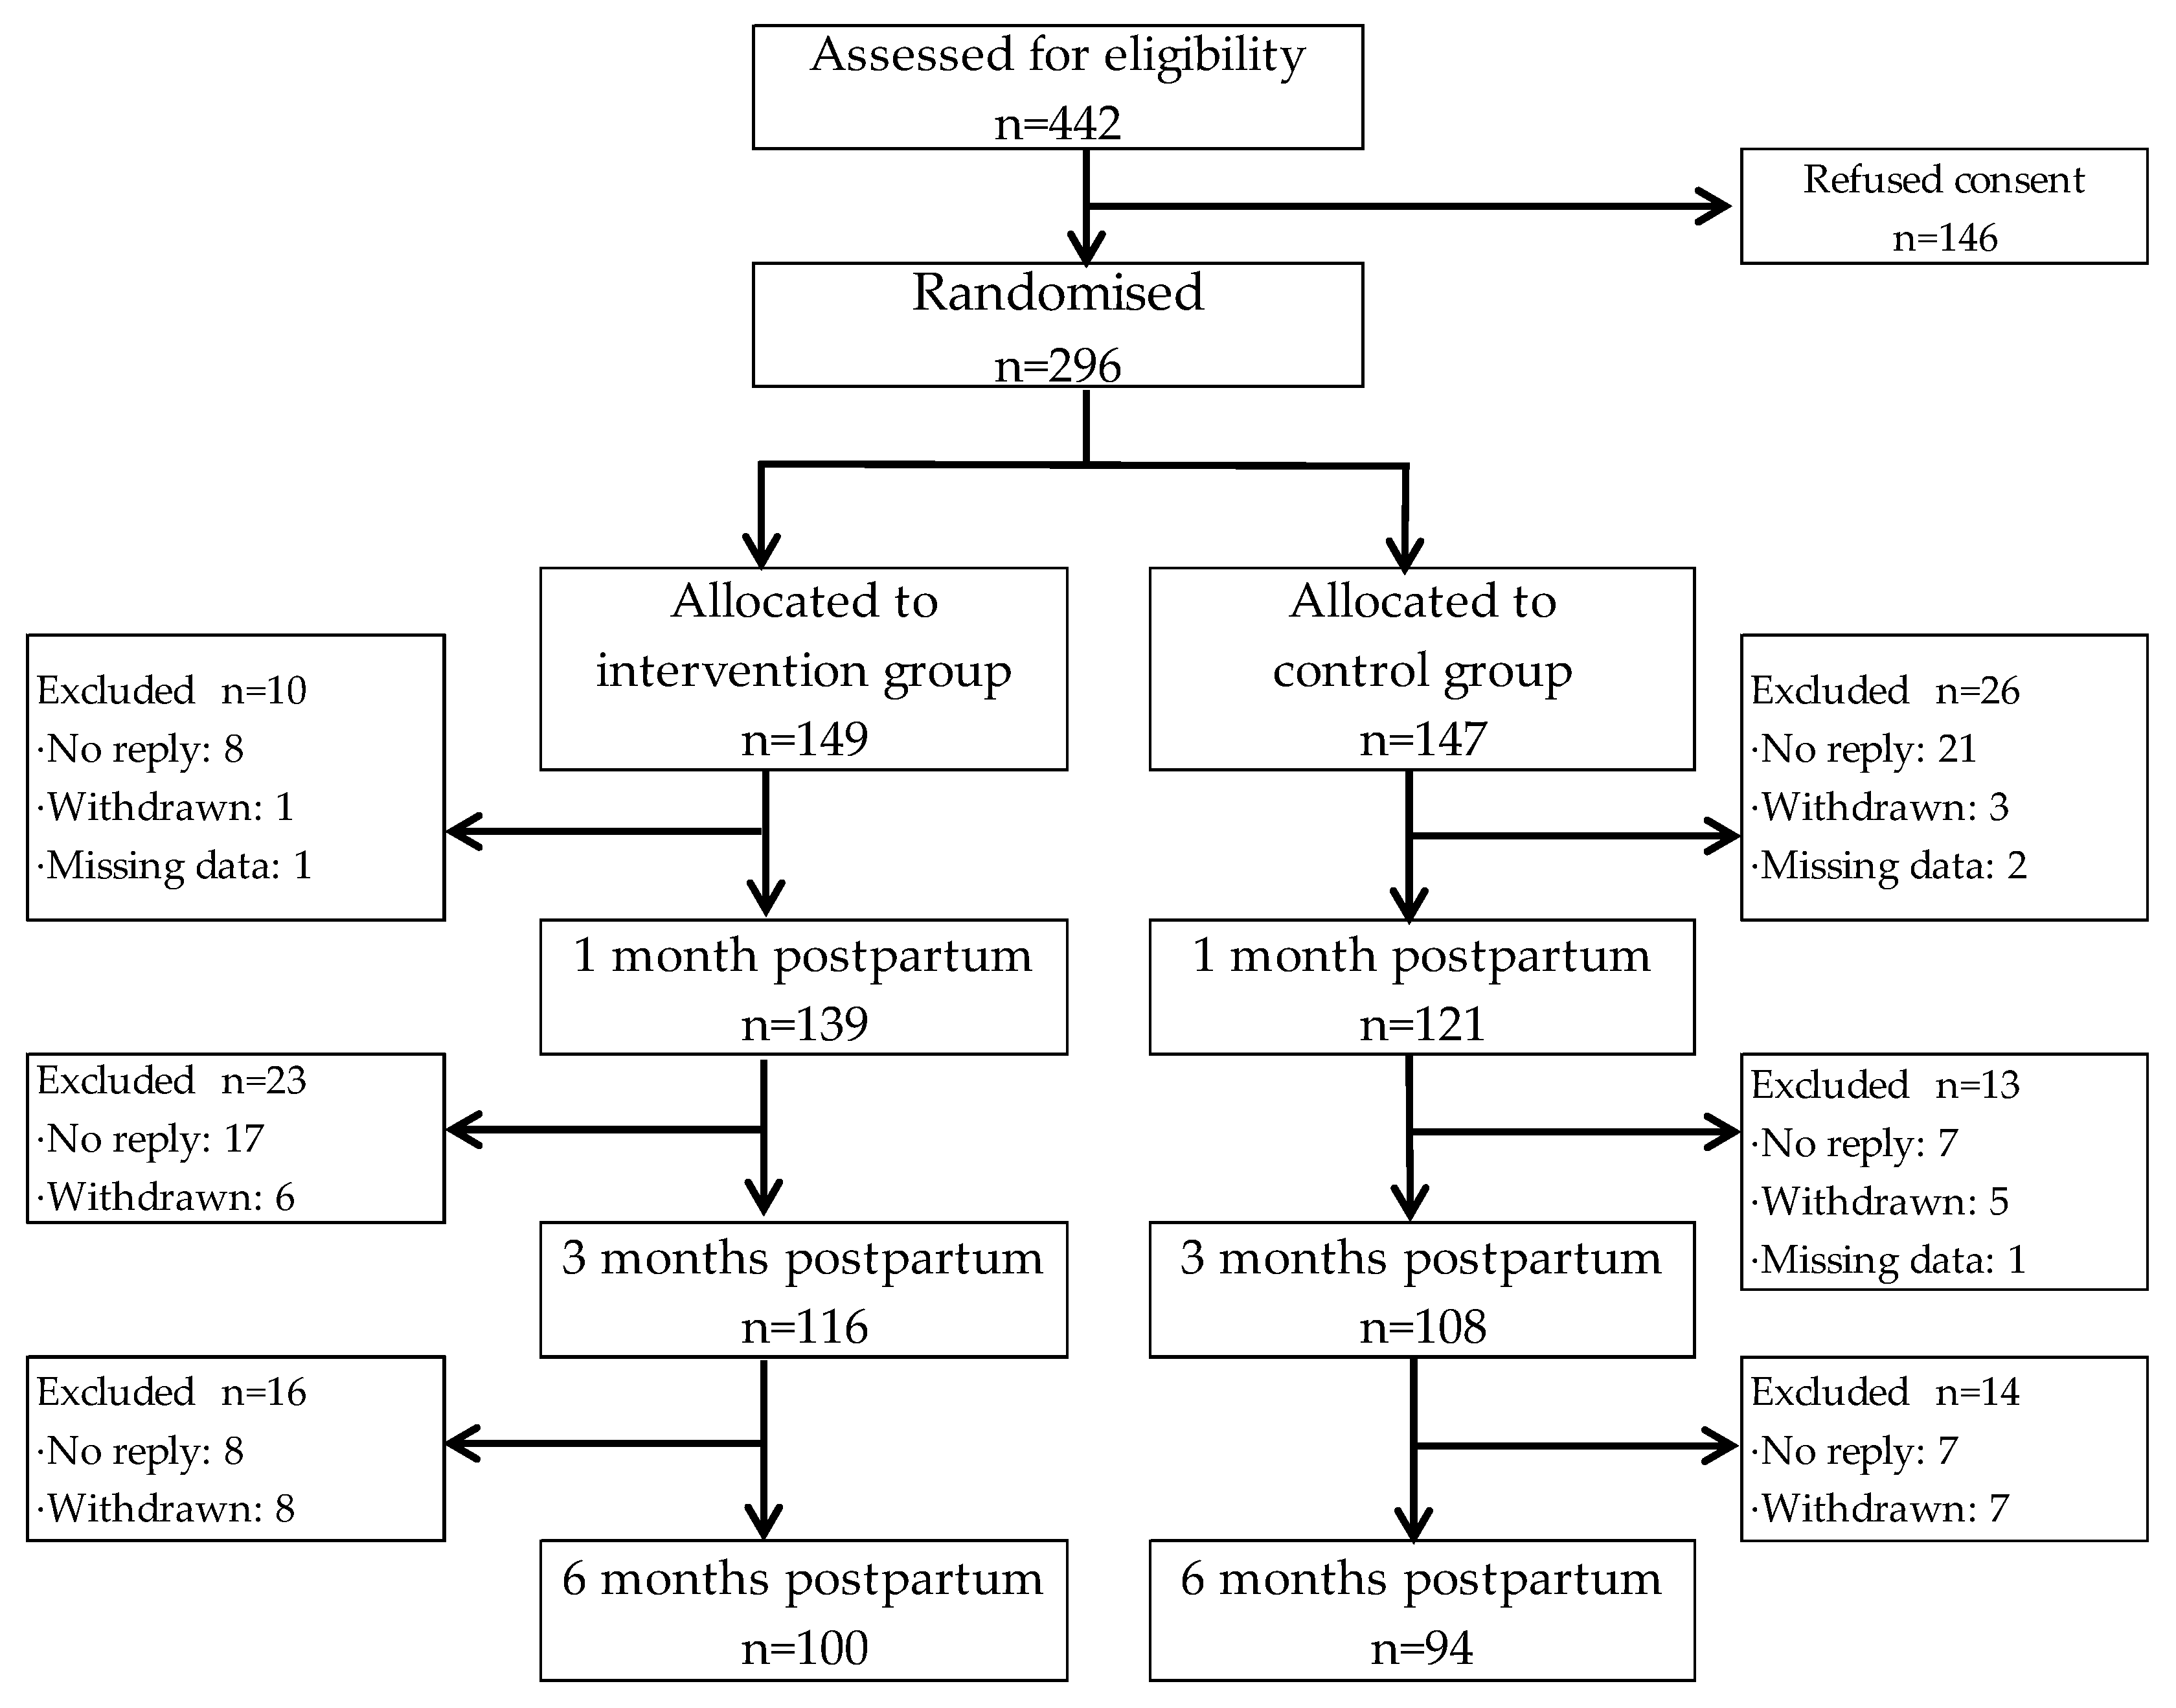
2.1. Study Design
2.2. Participants
2.3. Intervention
2.4. Data Collection
2.5. Outcomes
2.6. Variables
2.7. Ethical Considerations
2.8. Data Analysis
3. Results
3.1. Comparison of Dietary Intake at 1 and 3 Months Postpartum between the Two Groups
3.2. Comparison of Nutrient Intake at 6 Months Postpartum
3.3. Comparison of Food Group Consumption at 6 Months Postpartum
3.4. Comparison of Weight Changes
4. Discussion
5. Conclusions
Author Contributions
Funding
Institutional Review Board Statement
Informed Consent Statement
Data Availability Statement
Acknowledgments
Conflicts of Interest
References
- Bravi, F.; Wiens, F.; Decarli, A.; Pont, A.D.; Agostoni, C.; Ferraroni, M. Impact of maternal nutrition on breast-milk composition: A systematic review. Am. J. Clin. Nutr. 2016, 104, 646–662. [Google Scholar] [CrossRef] [PubMed] [Green Version]
- Kamezaki, A.; Tanaka, M.; Nakamura, E.; Hara, R. The actual situation of the eating habits and the nutrition situation of mothers with infants. Jpn. J. Mater. Health 2015, 56, 112–119. (In Japanese) [Google Scholar]
- Takimoto, H.; Yoshiike, N.; Katagiri, A.; Ishida, H.; Abe, S. Nutritional status of pregnant and lactating women in Japan: A comparison with non-pregnant/non-lactating controls in the National Nutrition Survey. J. Obstet. Gynaecol. Res. 2003, 29, 96–103. [Google Scholar] [CrossRef] [PubMed]
- Kobiyama, A.; Suzuki, E.; Takayama, Y. Post-partum anemia and factors that work against alleviation of the anemia. Jpn. J. Nurs. Sci. 2015, 12, 340–353. [Google Scholar] [CrossRef] [PubMed]
- Hannan, M.A.; Faraji, B.; Tanguma, J.; Longoria, N.; Rodriguez, R.C. Maternal milk concentration of zinc, iron, selenium, and iodine and its relationship to dietary intakes. Biol. Trace Elem. Res. 2009, 127, 6–15. [Google Scholar] [CrossRef]
- Kawakami, T.; Murota, I.; Nakama, M. Quality of health guidance during childbirth and postpartum period: A questionnaire survey on the satisfaction among postpartum women. Teishin Igaku 2006, 58, 134–138. [Google Scholar]
- Østbye, T.; Krause, K.M.; Lovelady, C.A.; Morey, M.C.; Bastian, L.A.; Peterson, B.L.; Swamy, G.K.; Brouwer, R.J.; McBride, C.M. Active Mothers Postpartum: A randomized controlled weight-loss intervention trial. Am. J. Prev. Med. 2009, 37, 173–180. [Google Scholar] [CrossRef] [Green Version]
- Wiltheiss, G.A.; Lovelady, C.A.; West, D.G.; Brouwer, R.J.; Krause, K.M.; Østbye, T. Diet quality and weight change among overweight and obese postpartum women enrolled in a behavioral intervention program. J. Acad. Nutr. Diet. 2013, 113, 54–62. [Google Scholar] [CrossRef] [PubMed] [Green Version]
- Huseinovic, E.; Winkvist, A.; Bertz, F.; Brekke, H.K. Changes in food choice during a successful weight loss trial in overweight and obese postpartum women. Obesity 2014, 22, 2517–2523. [Google Scholar] [CrossRef]
- O’Reilly, S.L.; Dunbar, J.A.; Versace, V.; Janus, E.; Best, J.D.; Carter, R.; Oats, J.J.N.; Skinner, T.; Ackland, M.; Phillips, P.A.; et al. Mothers after Gestational Diabetes in Australia (MAGDA): A Randomised Controlled Trial of a Postnatal Diabetes Prevention Program. PLoS Med. 2016, 13, e1002092. [Google Scholar] [CrossRef] [Green Version]
- Haruna, M.; Shiraishi, M.; Matsuzaki, M.; Yatsuki, Y.; Yeo, S. Effect of tailored dietary guidance for pregnant women on nutritional status: A double-cohort study. Matern. Child Nutr. 2017, 13, e12391. [Google Scholar] [CrossRef] [PubMed]
- Champion, V.L.; Skinner, C.S. The health belief model. In Health Behavior and Health Education. Theory, Research, and Practice, 4th ed.; Glanz, K., Rimer, B.K., Viswanath, K., Eds.; John Wiley and Sons, Inc.: San Francisco, CA, USA, 2008; pp. 45–65. [Google Scholar]
- Rosenstock, I.M.; Strecher, V.; Becker, J. Social learning theory and the health belief model. Health Educ. Q. 1988, 15, 175–183. [Google Scholar] [CrossRef] [PubMed]
- Rosenstock, I.M. Why people use health services. Milbank Mem. Fund Q. 1966, 44, 94–127. [Google Scholar] [CrossRef] [Green Version]
- Diddana, T.Z.; Kelkay, G.N.; Dola, A.N.; Sadore, A.A. Effect of nutrition education based on Health Belief Model on nutritional knowledge and dietary practice of pregnant women in Dessie Town, Northeast Ethiopia: A cluster randomized control trial. J. Nutr. Metab. 2018, 2018, 6731815. [Google Scholar] [CrossRef] [PubMed] [Green Version]
- Ikezoe, K.; Inoue, M.; Fujikawa, S.; Kato, Y.; Nakahashi, N.; Manabe, Y.; Takeuchi, M. Mother evaluation and childcare support issues for home visit services for families with infants by midwives in Kagawa Prefecture: A comparison between the 2008 survey and the 2016 survey. J. Kagawa Soc. Matern. Health 2018, 18, 59–70. [Google Scholar]
- Kobayashi, S.; Honda, S.; Murakami, K.; Sasaki, S.; Okubo, H.; Hirota, N.; Notsu, A.; Fukui, M.; Date, C. Both comprehensive and brief self-administered diet history questionnaires satisfactorily rank nutrient intakes In Japanese adults. J. Epidemiol. 2012, 22, 151–159. [Google Scholar] [CrossRef] [Green Version]
- Kobayashi, S.; Murakami, K.; Sasaki, S.; Okubo, H.; Hirota, N.; Notsu, A.; Fukui, M.; Date, C. Comparison of relative validity of food group intakes estimated by comprehensive and brief-type self-administered diet history questionnaires against 16 d dietary records In Japanese adults. Public Health Nutr. 2011, 14, 1200–1211. [Google Scholar] [CrossRef]
- Matsumoto, H.; Matsuzaki, M.; Shiraishi, M.; Haruna, M. Relationship between body image and dietary intake among women at one month postpartum. Jpn. J. Mater. Health 2018, 59, 406–415. (In Japanese) [Google Scholar]
- Falciglia, G.; Piazza, J.; Ritcher, E.; Reinerman, C.; Lee, S.Y. Nutrition education for postpartum women: A pilot study. J. Prim. Care Community Health 2014, 5, 275–278. [Google Scholar] [CrossRef]
- Tsutsumi, C.; Takano, A.; Mitsuhashi, F. Study on enhanced support for women’s dietary habits during the pregnancy and lactation periods (I); The current state of women’s dietary habits before and after giving birth. Rep. Stud. Jpn. Child Fam. Res. Inst. 2007, 44, 93–122. (In Japanese) [Google Scholar]
- Sakamoto, M.; Matsuoka, M.; Misumi, J.; Shimizu, K. Dietary habits and the related factors in 1-month postpartum women. Jpn. J. Mater. Health 2002, 43, 340–347. (In Japanese) [Google Scholar]
- Ikeda, H. A study of childrearing burden; association between time-course changes in childrearing burden and psychological status of mothers. Jpn. J. Mater. Health 2001, 42, 607–614. (In Japanese) [Google Scholar]
- Umezaki, M.; Ohi, N. Depression within 1 week and at 1 month postpartum in primipara. Jpn. J. Mater. Health 2015, 55, 67788. (In Japanese) [Google Scholar]
- Kobayashi, Y. Assistance received from parturients’ own mothers during Satogaeri (their perinatal visit and stay with their parents) and development of the mother-infant relationship and maternal identity. J. Jpn. Acad. Midwifery 2010, 24, 28–39. (In Japanese) [Google Scholar] [CrossRef]
- Minami, T.; Ohara, T.; Mutou, Y. Childbirth and child care support for mother: Focus on the experience of Childbirth satogaeri. J. Home Econ. Jap. 2006, 57, 807–817. (In Japanese) [Google Scholar]
- Dietary Reference Intakes for Japanese. Available online: https://www.mhlw.go.jp/file/04-Houdouhappyou-10904750-Kenkoukyoku-Gantaisakukenkouzoushinka/0000041955.pdf (accessed on 2 August 2021).
- Koletzko, B.; von Kries, R.; Closa, R.; Escribano, J.; Scaglioni, S.; Giovannini, M.; Beyer, J.; Demmelmair, H.; Gruszfeld, D.; Dobrzanska, A.; et al. Lower protein in infant formula is associated with lower weight up to age 2 y: A randomized clinical trial. Am. J. Clin. Nutr. 2009, 89, 1836–1845. [Google Scholar] [CrossRef] [Green Version]
- Okubo, H.; Miyake, Y.; Sasaki, S.; Tanaka, K.; Murakami, K.; Hirota, Y.; Child Health Study Group. Nutritional adequacy of three dietary patterns defined by cluster analysis in 997 pregnant Japanese women: The Osaka Maternal and Child Health Study. Public Health Nutr. 2011, 14, 611–621. [Google Scholar] [CrossRef] [PubMed] [Green Version]
- Takimoto, H.; Mitsuishi, C.; Kato, N. Attitudes toward pregnancy related changes and self-judged dieting behavior. Asia Pac. J. Clin. Nutr. 2011, 20, 212–219. [Google Scholar]
- Vital Statistics. 2015. Available online: https://www.e-stat.go.jp/en/stat-search/files?page=1&layout=datalist&toukei=00450011&tstat=000001028897&cycle=8&year=20151&month=0&tclass1=000001053122&tclass2=000001053124&result_back=1&tclass3val=0 (accessed on 2 August 2021).
- Hoshino, A.; Yamada, A.; Tanabe, R.; Noda, S.; Nakaoka, K.; Oku, Y.; Katayama, C.; Haraikawa, M.; Nakano, H.; Harada, M.; et al. Relationships between bone mass and dietary/lifestyle habits In Japanese women at 3-4 months postpartum. Public Health 2017, 152, 129–135. [Google Scholar] [CrossRef]
- Okamoto, N.; Hosono, A.; Shibata, K.; Tsujimura, S.; Oka, K.; Fujita, H.; Kamiya, M.; Kondo, F.; Wakabayashi, R.; Yamada, T.; et al. Accuracy of self-reported height, weight and waist circumference in a Japanese sample. Obes. Sci. Pract. 2017, 3, 417–424. [Google Scholar] [CrossRef]

| Intervention Group (n = 139) | Control Group (n = 121) | p | ||||
|---|---|---|---|---|---|---|
| Mean ± SD or n (%) | Mean ± SD or n (%) | |||||
| Age [year] | 35.4 | ±4.7 | 35.2 | ±4.5 | 0.694 † | |
| Parity: Primiparae [n (%)] | 83 | (59.7) | 76 | (62.7) | 0.609 | |
| Education level [n (%)] | ||||||
| High school | 9 | (6.5) | 9 | (7.4) | 0.680 | |
| Junior or technical college | 36 | (25.9) | 34 | (28.1) | ||
| University or above | 94 | (67.6) | 78 | (64.4) | ||
| Annual household income [n (%)] | ||||||
| < 5 million Japanese yen | 19 | (13.6) | 11 | (9.1) | 0.475 | |
| 5–9 million Japanese yen | 52 | (37.4) | 54 | (44.6) | ||
| > 9 million Japanese yen | 68 | (48.9) | 56 | (46.3) | ||
| Height [cm] | 158.7 | ±5.5 | 158.7 | ±5.5 | 0.750 † | |
| Pre-pregnancy weight [kg] | 52.2 | ±7.6 | 52.1 | ±7.6 | 0.966 † | |
| Gestational weight gain [kg] | 9.6 | ±3.3 | 9.6 | ±3.2 | 0.974 † | |
| Weight at 1 month postpartum [kg] | 54.6 | ±7.3 | 54.1 | ±7.2 | 0.642 † | |
| BMI at 1 month postpartum [kg/m2] | 21.6 | ±2.5 | 21.4 | ±2.5 | 0.485 † | |
| Underweight (BMI < 18.5) [n (%)] | 6 | (4.3) | 8 | (6.6) | 0.677 | |
| Normal (18.5 ≤ BMI < 25.0) [n (%)] | 121 | (87.7) | 105 | (86.8) | ||
| Overweight / Obesity (BMI > 25.0) [n (%)] | 11 | (8.0) | 8 | (6.6) | ||
| Regular supplement usage [n (%)] | 54 | (38.8) | 50 | (41.3) | 0.685 | |
| Folic acid supplements [n (%)] | 30 | (21.6) | 22 | (18.2) | 0.542 | |
| Multivitamins [n (%)] | 10 | (7.2) | 11 | (9.1) | 0.697 | |
| Vitamin C supplements [n (%)] | 10 | (7.2) | 4 | (3.3) | 0.673 | |
| Iron supplements [n (%)] | 28 | (20.1) | 27 | (22.3) | 0.987 | |
| Breastfeeding [n (%)] | 132 | (95.0) | 118 | (97.5) | 0.346 ‡ | |
| Birth weight (infant) [g] | 2948 | ±373 | 3034 | ±373 | 0.064 † | |
| Intervention Group (n = 139) | Control Group (n = 121) | p | ||||
|---|---|---|---|---|---|---|
| Median (Interquartile Range) | Median (Interquartile Range) | |||||
| Energy [kcal/day] | 1703 | (1443–1995) | 1868 | (1558–2109) | 0.090 | |
| Protein [% energy] | 15 | (14–17) | 15 | (14–17) | 0.845 | |
| Fat [% energy] | 29 | (25–33) | 29 | (26–31) | 0.709 | |
| Omega-3 PUFA [% energy] | 1.3 | (1.1–1.5) | 1.2 | (1.0–1.5) | 0.297 | |
| EPA [% energy] | 0.13 | (0.09–0.18) | 0.12 | (0.08–0.18) | 0.425 | |
| DHA [% energy] | 0.22 | (0.16–0.30) | 0.21 | (0.16–0.30) | 0.607 | |
| Omega-6 PUFA [% energy] | 5.2 | (4.6–6.1) | 5.3 | (4.5–5.9) | 0.935 | |
| Hydrocarbonate [% energy] | 54 | (50–59) | 55 | (51–59) | 0.445 | |
| Total dietary fiber [g/1000 kcal] | 6.8 | (5.9–8.1) | 6.8 | (5.7–8.2) | 0.968 | |
| Sodium [mg/1000 kcal] | 2125 | (1875–2483) | 2115 | (1816–2435) | 0.740 | |
| Potassium [mg/1000 kcal] | 1393 | (1151–1644) | 1389 | (1185–1619) | 0.827 | |
| Calcium [mg/1000 kcal] | 307 | (247–380) | 328 | (263–396) | 0.328 | |
| Magnesium [mg/1000 kcal] | 132 | (115–155) | 133 | (116–154) | 0.760 | |
| Phosphorus [mg/1000 kcal] | 572 | (507–666) | 583 | (526–655) | 0.692 | |
| Iron [mg/1000 kcal] | 4.3 | (3.6–4.9) | 4.2 | (3.7–5.0) | 0.861 | |
| Zinc [mg/1000 kcal] | 4.6 | (4.2–5.0) | 4.6 | (4.2–5.0) | 0.743 | |
| Vitamin D [μg/1000 kcal] | 6.2 | (4.7–9.2) | 6.0 | (4.3–8.5) | 0.359 | |
| α-tocopherol [mg/1000 kcal] | 4.3 | (3.8–4.9) | 4.2 | (3.8–4.9) | 0.878 | |
| Vitamin B6 [mg/1000 kcal] | 0.7 | (0.6–0.8) | 0.7 | (0.6–0.8) | 0.464 | |
| Vitamin B12 [μg/1000 kcal] | 4.3 | (3.2–6.0) | 4.2 | (3.3–5.8) | 0.956 | |
| Folate [μg/1000 kcal] | 177 | (139–216) | 172 | (141–223) | 0.821 | |
| Vitamin C [mg/1000 kcal] | 60 | (45–75) | 61 | (47–78) | 0.494 | |
| β-carotene [μg/1000 kcal] | 2069 | (1447–2746) | 1982 | (1225–2692) | 0.529 | |
| Intervention Group (n = 139) | Control Group (n = 121) | p | |||
|---|---|---|---|---|---|
| Median (Interquartile range) | Median (Interquartile range) | ||||
| Cereals [g/1000kcal] | 215 | (170–266) | 209 | (170–247) | 0.306 |
| Pulses [g/1000kcal] | 33 | (20–54) | 39 | (23–53) | 0.348 |
| Potatoes [g/1000kcal] | 28 | (14–38) | 27 | (14–39) | 0.753 |
| Sugar [g/1000kcal] | 2.3 | (1.3–3.2) | 2.1 | (1.3–3.1) | 0.831 |
| Confectioneries [g/1000kcal] | 25 | (15–38) | 29 | (17–44) | 0.068 |
| Oil [g/1000kcal] | 5.5 | (4.0–7.3) | 5.5 | (3.9–6.9) | 0.671 |
| Fruits [g/1000kcal] | 59 | (32–86) | 65 | (33–96) | 0.357 |
| Green and yellow vegetables [g/1000kcal] | 70 | (50–94) | 68 | (50–95) | 0.982 |
| Other vegetables [g/1000kcal] | 82 | (64–111) | 83 | (62–106) | 0.798 |
| Fish and shellfish [g/1000kcal] | 36 | (25–46) | 34 | (22–48) | 0.433 |
| Meat [g/1000kcal] | 41 | (31–51) | 38 | (32–46) | 0.117 |
| Eggs [g/1000kcal] | 16 | (11–28) | 22 | (13–30) | 0.039 |
| Dairy products [g/1000kcal] | 87 | (43–129) | 94 | (43–138) | 0.582 |
| Nutrient Intake at 6 Months Postpartum | Changes in Nutrient Intake from 1 Month to 6 Months Postpartum | ||||||||||
|---|---|---|---|---|---|---|---|---|---|---|---|
| Intervention Group (n = 100) | Control Group (n = 94) | p | Intervention Group (n = 100) | Control Group (n = 94) | p | ||||||
| Median (Interquartile Range) | Median (Interquartile Range) | Median (Interquartile Range) | Median (Interquartile Range) | ||||||||
| Energy [kcal/day] | 1678 | (1357–2007) | 1679 | (1441–1924) | 0.894 | −77 | (−366–189) | −142 | (−397–105) | 0.417 | |
| Protein [% energy] | 16 | (14–18) | 15 | (14–16) | 0.036 | 0.6 | (−0.9–2.5) | 0.1 | (−1.4–1.6) | 0.160 | |
| Fat [% energy] | 28 | (25–32) | 29 | (25–32) | 0.943 | 0.2 | (−4.1–3.2) | 0.5 | (−3.9–3.8) | 0.848 | |
| Omega-3 PUFA [% energy] | 1.3 | (1.0–1.5) | 1.2 | (1.0–1.4) | 0.177 | 0.1 | (−0.2–0.3) | 0.0 | (−0.2–0.3) | 0.452 | |
| EPA [% energy] | 0.13 | (0.09–0.20) | 0.12 | (0.09–0.15) | 0.169 | 0.00 | (−0.04–0.06) | 0.01 | (−0.04–0.04) | 0.611 | |
| DHA [% energy] | 0.22 | (0.16–0.33) | 0.21 | (0.16–0.26) | 0.145 | 0.00 | (−0.08–0.11) | 0.00 | (−0.07–0.06) | 0.450 | |
| Omega-6 PUFA [% energy] | 5.2 | (4.4–6.1) | 5.5 | (4.8–6.0) | 0.444 | 0.1 | (-0.7–0.9) | 0.1 | (−0.7–1.0) | 0.963 | |
| Hydrocarbonate [% energy] | 54 | (49–58) | 56 | (51–60) | 0.289 | −1 | (−5–4) | −1 | (−5–4) | 0.784 | |
| Total dietary fiber [g/1000 kcal] | 7.3 | (6.1–8.4) | 6.6 | (5.8–7.9) | 0.022 | 0.0 | (−0.8–0.8) | 0.0 | (−1.2–1.0) | 0.039 | |
| Sodium [mg/1000 kcal] | 2149 | (1822–2452) | 2127 | (1744–2457) | 0.718 | −3 | (−315–321) | 18 | (−336–285) | 0.529 | |
| Potassium [mg/1000 kcal] | 1456 | (1191–1703) | 1329 | (1149–1559) | 0.049 | 57 | (−177–268) | 9 | (−247–218) | 0.098 | |
| Calcium [mg/1000 kcal] | 326 | (258–402) | 297 | (247–364) | 0.074 | 6 | (−52–73) | −8 | (−70–43) | 0.088 | |
| Magnesium [mg/1000 kcal] | 141 | (121–160) | 130 | (116–150) | 0.046 | 9 | (−8–24) | 0 | (−16–17) | 0.052 | |
| Phosphorus [mg/1000 kcal] | 596 | (539–669) | 566 | (510–630) | 0.024 | 13 | (−40–96) | −10 | (−80–60) | 0.056 | |
| Iron [mg/1000 kcal] | 4.4 | (3.7–5.3) | 4.1 | (3.7–4.8) | 0.072 | 0.2 | (−0.5–0.8) | −0.1 | (−0.9–0.5) | 0.040 | |
| Zinc [mg/1000 kcal] | 4.7 | (4.4–5.2) | 4.5 | (4.2–4.8) | 0.020 | 0.1 | (−0.3–0.5) | −0.1 | (−0.4–0.3) | 0.053 | |
| Vitamin D [μg/1000 kcal] | 6.1 | (4.4–10.4) | 5.7 | (4.2–8.4) | 0.171 | 0.0 | (−1.8–2.0) | 0.0 | (−1.7–2.0) | 0.650 | |
| α-tocopherol [mg/1000 kcal] | 4.2 | (3.6–4.9) | 4.2 | (3.8–4.7) | 0.806 | 0.1 | (−0.6–0.7) | 0.1 | (−0.7–0.7) | 0.632 | |
| Vitamin B6 [mg/1000 kcal] | 0.7 | (0.6–0.8) | 0.7 | (0.6 - 0.8) | 0.022 | 0.0 | (−0.1–0.1) | 0.0 | (−0.1–0.1) | 0.293 | |
| Vitamin B12 [μg/1000 kcal] | 4.4 | (3.2–6.1) | 4.1 | (3.3–5.4) | 0.321 | 0.1 | (−1.4–1.2) | −0.4 | (−1.4–1.2) | 0.553 | |
| Folate [μg/1000 kcal] | 185 | (141–228) | 172 | (148–206) | 0.258 | 11 | (−33–50) | 2 | (−48–33) | 0.172 | |
| Vitamin C [mg/1000 kcal] | 59 | (45–79) | 58 | (46–67) | 0.279 | 1 | (−10–19) | 1 | (−18–11) | 0.201 | |
| β-carotene [μg/1000 kcal] | 2037 | (1561–3016) | 1805 | (1330–2530) | 0.047 | 217 | (−584–882) | 28 | (−682–651) | 0.292 | |
| Food Consumption at 6 Months Postpartum | Changes in Food Consumption from 1 Month to 6 Months Postpartum | |||||||||
|---|---|---|---|---|---|---|---|---|---|---|
| Intervention Group (n = 100) | Control Group (n = 94) | p | Intervention Group (n = 100) | Control Group (n = 94) | p | |||||
| Median (Interquartile Range) | Median (Interquartile Range) | Median (Interquartile Range) | Median (Interquartile Range) | |||||||
| Cereals [g/1000kcal] | 215 | (174–253) | 206 | (168–254) | 0.596 | −1 | (−45–34) | 3 | (−48–48) | 0.692 |
| Pulses [g/1000kcal] | 37 | (24–55) | 39 | (21–56) | 0.820 | 5 | (−7–17) | 1 | (−11–12) | 0.182 |
| Potatoes [g/1000kcal] | 30 | (15–42) | 27 | (13–38) | 0.460 | 1 | (−12–13) | 1 | (−14–16) | 0.914 |
| Sugar [g/1000kcal] | 1.8 | (1.1–2.6) | 1.9 | (1.1–2.9) | 0.784 | −0.2 | (−1.4–0.8) | −1.1 | (−0.1–0.8) | 0.978 |
| Confectioneries [g/1000kcal] | 24 | (14–36) | 33 | (23–45) | 0.002 | 1 | (−10–13) | 2 | (−10–14) | 0.732 |
| Oil [g/1000kcal] | 5.6 | (4.4–7.4) | 6.1 | (4.7–7.3) | 0.457 | 0.2 | (−1.6–1.8) | 0.5 | (−1.8–2.1) | 0.541 |
| Fruits [g/1000kcal] | 55 | (31–88) | 49 | (29–83) | 0.551 | −6 | (−28 –16) | −12 | (−41–16) | 0.258 |
| Green and yellow vegetables [g/1000kcal] | 64 | (44–92) | 59 | (41–85) | 0.143 | −2 | (−23–21) | −5 | (−33–17) | 0.249 |
| Other vegetables [g/1000kcal] | 86 | (66–119) | 80 | (55–108) | 0.156 | 6 | (−15–30) | 0 | (−29–26) | 0.278 |
| Fish and shellfish [g/1000kcal] | 35 | (24–59) | 33 | (24–44) | 0.257 | 1 | (−13–15) | 0 | (−12–12) | 0.677 |
| Meat [g/1000kcal] | 40 | (32–51) | 41 | (30–53) | 0.850 | 1 | (−13–8) | 1 | (−11–16) | 0.217 |
| Eggs [g/1000kcal] | 19 | (12–28) | 15 | (7–28) | 0.094 | 1 | (−5–9) | −2 | (−12–3) | 0.001 |
| Dairy products [g/1000kcal] | 87 | (47–137) | 87 | (45–118) | 0.455 | 3 | (−34–37) | 0 | (−49–28) | 0.526 |
Publisher’s Note: MDPI stays neutral with regard to jurisdictional claims in published maps and institutional affiliations. |
© 2021 by the authors. Licensee MDPI, Basel, Switzerland. This article is an open access article distributed under the terms and conditions of the Creative Commons Attribution (CC BY) license (https://creativecommons.org/licenses/by/4.0/).
Share and Cite
Shiraishi, M.; Matsuzaki, M.; Tsunematsu, R.; Watanabe, S.; Kobayashi, R.; Haruna, M. Effects of Individual Dietary Intervention on Nutrient Intake in Postpartum Japanese Women: A Randomized Controlled Trial. Nutrients 2021, 13, 3272. https://doi.org/10.3390/nu13093272
Shiraishi M, Matsuzaki M, Tsunematsu R, Watanabe S, Kobayashi R, Haruna M. Effects of Individual Dietary Intervention on Nutrient Intake in Postpartum Japanese Women: A Randomized Controlled Trial. Nutrients. 2021; 13(9):3272. https://doi.org/10.3390/nu13093272
Chicago/Turabian StyleShiraishi, Mie, Masayo Matsuzaki, Rina Tsunematsu, Sachi Watanabe, Risa Kobayashi, and Megumi Haruna. 2021. "Effects of Individual Dietary Intervention on Nutrient Intake in Postpartum Japanese Women: A Randomized Controlled Trial" Nutrients 13, no. 9: 3272. https://doi.org/10.3390/nu13093272
APA StyleShiraishi, M., Matsuzaki, M., Tsunematsu, R., Watanabe, S., Kobayashi, R., & Haruna, M. (2021). Effects of Individual Dietary Intervention on Nutrient Intake in Postpartum Japanese Women: A Randomized Controlled Trial. Nutrients, 13(9), 3272. https://doi.org/10.3390/nu13093272