
Cardiorespiratory Fitness Predicted by Fibrinogen and Leptin Concentrations in Children with Obesity and Risk for Diabetes: A Cross-Sectional Study and a ROC Curve Analysis


 , ,
, ,  , ,
, ,
Abstract
:1. Introduction
2. Materials and Methods
2.1. Participant Recruitment and Inclusion Criteria
2.2. Ethical Permission and Consent
2.3. Anthropometric Indices
2.4. Puberty Staging
2.5. Cardio-Pulmonary Exercise Test (CPET)
2.6. Blood and Biochemical Assays
2.7. Statistical Analyses
3. Results
3.1. Differences in Anthropometry, Hormonal Levels and CRF
3.2. Correlations between VO2max, Anthropometric Parameters and Hormonal Levels
3.3. Univariate and Multivariate Regression Models Predicting VO2max
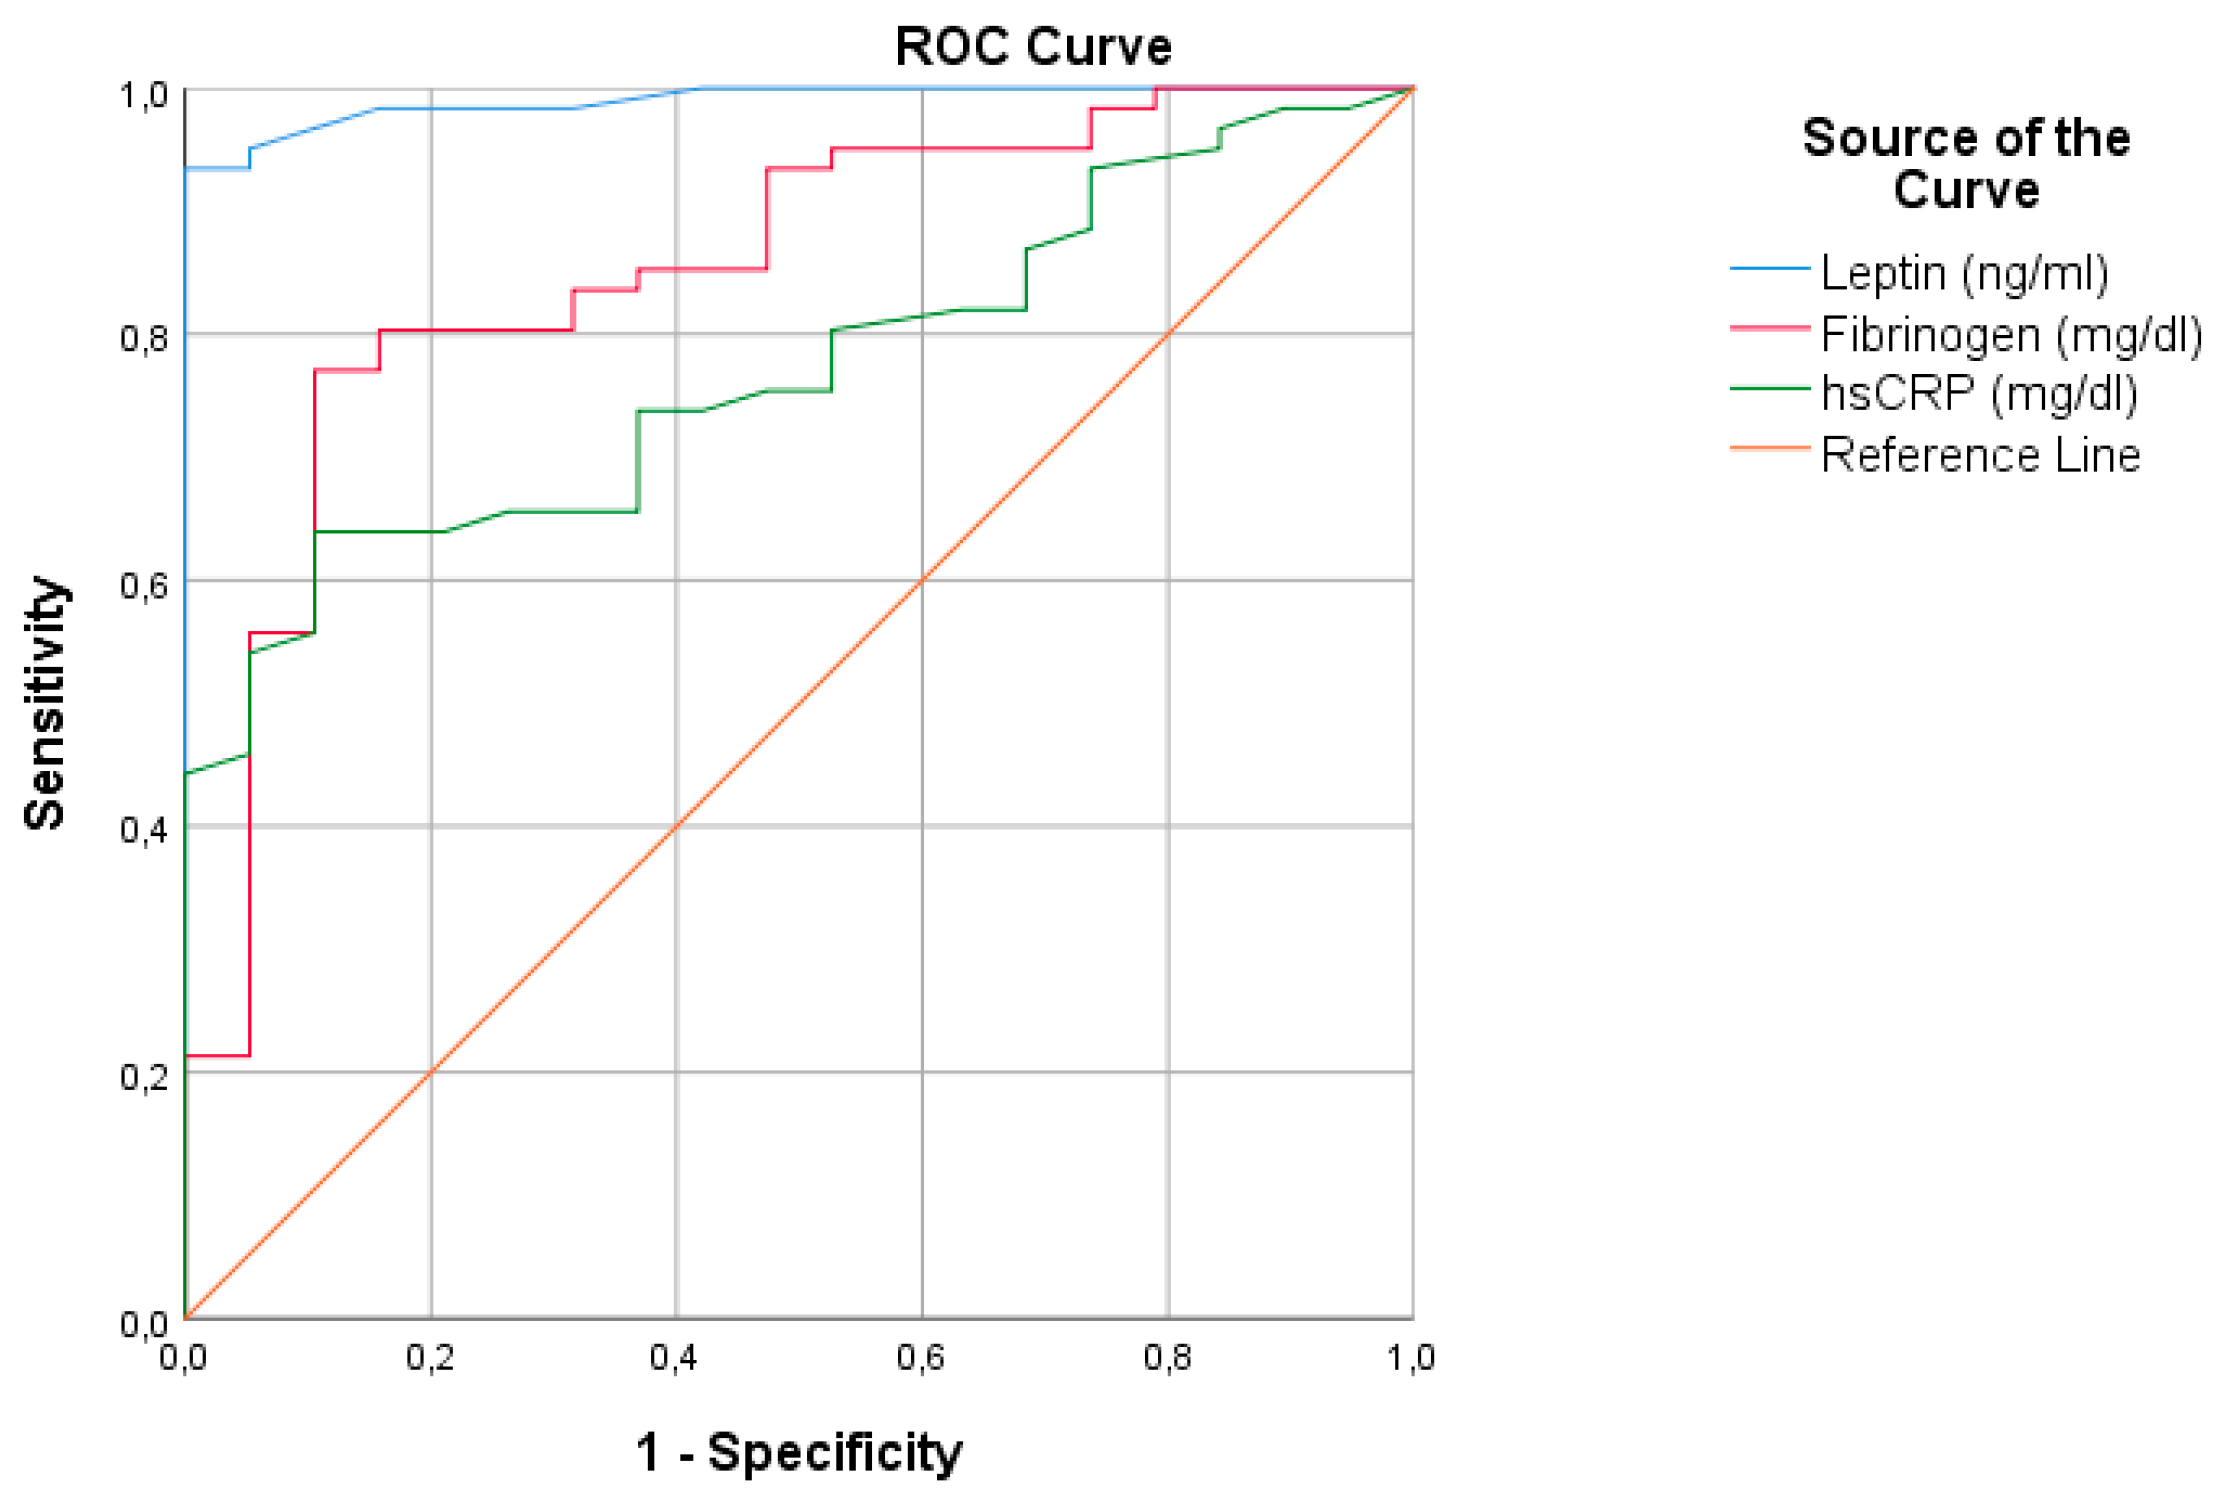
3.4. Diagnostic Accuracy of Leptin, hs-CRP and Fibrinogen for Predicting VO2max
4. Discussion
5. Conclusions
Author Contributions
Funding
Institutional Review Board Statement
Informed Consent Statement
Data Availability Statement
Conflicts of Interest
References
- Reilly, S.M.; Saltiel, A.R. Adapting to obesity with adipose tissue inflammation. Nat. Rev. Endocrinol. 2017, 13, 633–643. [Google Scholar] [CrossRef]
- Chooi, Y.C.; Ding, C.; Magkos, F. The epidemiology of obesity. Metabolism 2019, 92, 6–10. [Google Scholar] [CrossRef] [PubMed] [Green Version]
- Pilcová, R.; Sulcová, J.; Hill, M.; Bláha, P.; Lisá, L. Leptin levels in obese children: Effects of gender, weight reduction and androgens. Physiol. Res. 2003, 52, 53–60. [Google Scholar] [PubMed]
- Stylianou, C.; Tsinopoulou, G.A.; Farmakiotis, D.; Rousso, I.; Karamouzis, M.; Koliakos, G.; Arvanitakis, N.S. Ghrelin and leptin levels in obese adolescents. Relationship with body fat and insulin resistance. Hormones (Athens) 2007, 6, 295–303. [Google Scholar] [CrossRef] [PubMed] [Green Version]
- Cambuli, V.M.; Musiu, M.C.; Incani, M.; Paderi, M.; Serpe, R.; Marras, V.; Cossu, E.; Cavallo, M.G.; Mariotti, S.; Loche, S.; et al. Assessment of adiponectin and leptin as biomarkers of positive metabolic outcomes after lifestyle intervention in overweight and obese children. J. Clin. Endocrinol. Metab. 2008, 93, 3051–3057. [Google Scholar] [CrossRef] [Green Version]
- Gajewska, J.; Kuryłowicz, A.; Mierzejewska, E.; Ambroszkiewicz, J.; Chełchowska, M.; Weker, H.; Kuźnicka, P.M. Complementary Effects of Genetic Variations in LEPR on Body Composition and Soluble Leptin Receptor Concentration after 3-Month Lifestyle Intervention in Prepubertal Obese Children. Nutrients 2016, 8, 328. [Google Scholar] [CrossRef] [Green Version]
- Kannel, W.B.; Wolf, P.A.; Castelli, W.P.; Agostino, D.R.B. Fibrinogen and Risk of Cardiovascular Disease. JAMA 1987, 258, 1183. [Google Scholar] [CrossRef]
- Bao, W.; Srinivasan, S.R.; Berenson, G.S. Plasma fibrinogen and its correlates in children from a biracial community: The Bogalusa Heart Study. Pediatr. Res. 1993, 33, 323–326. [Google Scholar] [CrossRef]
- Tsinopoulou, G.A.; Grammatikopoulou, M.G.; Stylianou, C.; Emmanouilidou, E.; Kokka, P. Diabese youngsters have 3.7 more chances in developing metabolic syndrome compared with the obese. J. Endocrinol. Investig. 2010, 33, 549–553. [Google Scholar] [CrossRef]
- Danesh, J.; Collins, R.; Appleby, P.; Peto, R. Association of fibrinogen, C-reactive protein, albumin, or leukocyte count with coronary heart disease: Meta-analyses of prospective studies. JAMA 1998, 279, 1477–1482. [Google Scholar] [CrossRef]
- Vilar, R.; Fish, R.J.; Casini, A.; Arbez, N.M. Fibrin(ogen) in human disease: Both friend and foe. Haematologica 2020, 105, 284–296. [Google Scholar] [CrossRef] [PubMed] [Green Version]
- Azevedo, W.F.; Cantalice, A.S.C.; Gonzaga, N.C.; da Simões, M.O.S.; Guimarães, A.L.V.; de Carvalho, D.F.; Medeiros, C.C.M. Fibrinogen: Cardiometabolic risk marker in obese or overweight children and adolescents. J. Pediatr. (Rio. J) 2015, 91, 464–470. [Google Scholar] [CrossRef] [PubMed] [Green Version]
- Jiménez, V.M.; Estepa, R.M.; Camacho, R.M.M.; Estrada, R.C.; Luna, F.G.; Guitarte, F.B. Endothelial dysfunction is related to insulin resistance and inflammatory biomarker levels in obese prepubertal children. Eur. J. Endocrinol. 2007, 156, 497–502. [Google Scholar] [CrossRef]
- Thivel, D.; Aucouturier, J. Cardiorespiratory Fitness Evaluation in Obese Youth. In The ECOG Free Obesity eBook; European Childhood Obesity Group, Ed.; European Childhood Obesity Group: Brussels, Belgium, 2015. [Google Scholar]
- Watanabe, K.; Nakadomo, F.; Maeda, K. Relationship between body composition and cardiorespiratory fitness in Japanese junior high school boys and girls. Ann. Physiol. Anthropol. 1994, 13, 167–174. [Google Scholar] [CrossRef]
- Freedson, P.; Goodman, T. Measurements of Oxygen Consumption. Pediatric Laboratory Exercise Testing. In Clinical Guide; Human Kinetics: Rowland, IL, USA, 1993. [Google Scholar]
- Ortega, M.A.; Davis, L.C.; Barbeau, P.; Boyle, C.A. Oxygen uptake of overweight and obese children at different stages of a progressive treadmill test: Consumo de oxígeno de niños y niñas con sobrepeso y obesos en los diferentes estadios de una prueba progresiva en un tapiz rodante. Rev. Int. Cienc. Deporte 2010, 6, 74–90. [Google Scholar] [CrossRef]
- Breithaupt, P.G.; Colley, R.C.; Adamo, K.B. Using the oxygen uptake efficiency slope as an indicator of cardiorespiratory fitness in the obese pediatric population. Pediatr. Exerc. Sci. 2012, 24, 357–368. [Google Scholar] [CrossRef] [PubMed]
- Siconolfi, S.F.; Lasater, T.M.; McKinlay, S.; Boggia, P.; Carleton, R.A. Physical fitness and blood pressure: The role of age. Am. J. Epidemiol. 1985, 122, 452–457. [Google Scholar] [CrossRef] [PubMed]
- Hong, H.R.; Ha, C.D.; Kong, J.Y.; Lee, S.H.; Song, M.G.; Kang, H.S. Roles of physical activity and cardiorespiratory fitness on sex difference in insulin resistance in late elementary years. J. Exerc. Nutr. Biochem. 2014, 18, 361–369. [Google Scholar] [CrossRef] [Green Version]
- Nyström, C.D.; Henriksson, P.; Vizcaíno, M.V.; Medrano, M.; Sanchez, C.C.; Palencia, A.N.M.; Löf, M.; Ruiz, J.R.; Labayen, I.; López, S.M.; et al. Does Cardiorespiratory Fitness Attenuate the Adverse Effects of Severe/Morbid Obesity on Cardiometabolic Risk and Insulin Resistance in Children? A Pooled Analysis. Diabetes Care 2017, 40, 1580–1587. [Google Scholar] [CrossRef] [Green Version]
- Arenaza, L.; Medrano, M.; Amasene, M.; Vigil, R.B.; Díez, I.; Graña, M.; Tobalina, I.; Maiz, E.; Arteche, E.; Larrarte, E.; et al. Prevention of diabetes in overweight/obese children through a family based intervention program including supervised exercise (PREDIKID project): Study protocol for a randomized controlled trial. Trials 2017, 18, 372. [Google Scholar] [CrossRef] [Green Version]
- Pomerants, T.; Tillmann, V.; Karelson, K.; Jürimäe, J.; Jürimäe, T. Ghrelin response to acute aerobic exercise in boys at different stages of puberty. Horm. Metab. Res. 2006, 38, 752–757. [Google Scholar] [CrossRef] [PubMed]
- Gomez, M.D.; Eisenmann, J.C.; Martinez, G.S.; Veses, A.; Romeo, J.; Veiga, O.L.; Marcos, A.; AFINOS Study Group. Associations of physical activity and fitness with adipocytokines in adolescents: The AFINOS Study. Nutr. Metab. Cardiovasc. Dis. 2012, 22, 252–259. [Google Scholar] [CrossRef] [Green Version]
- Pavón, J.D.; Ortega, F.B.; Artero, E.G.; Labayen, I.; Rodriguez, V.G.; Huybrechts, I.; Moreno, L.A.; Manios, Y.; Béghin, L.; Polito, A.; et al. Physical Activity, Fitness, and Serum Leptin Concentrations in Adolescents. J. Pediatr. 2012, 160, 598–603.e2. [Google Scholar] [CrossRef]
- Tsiroukidou, K.; Papagianni, M.; Hatziagorou, E.; Tsinopoulou, G.A.; Giannopoulos, A.; Tsanakas, I. Exercise testing and adipokine levels for the evaluation of overweight and obesity in children. Hippokratia 2018, 21, 124–129. [Google Scholar]
- Lewitt, M.S.; Baker, J.S. Relationship between abdominal adiposity, cardiovascular fitness, and biomarkers of cardiovascular risk in British adolescents. J. Sport Heal. Sci. 2020, 9, 634–644. [Google Scholar] [CrossRef]
- Sobrinho, A.C.; Moreira, C.; Abreu, S.; Lopes, L.; Oliveira-Santos, J.; Johannessen, S.J.; Mota, J.; Santos, R. Serum Adiponectin Levels and Cardiorespiratory Fitness in Normoverweight and Overweight Portuguese Adolescents: The LabMed Physical Activity Study. Pediatr. Exerc. Sci. 2017, 29, 237–244. [Google Scholar] [CrossRef] [Green Version]
- Hermoso, G.A.; Ceballos, C.R.J.M.; Aro, P.C.E.; Hackney, A.C.; Mota, J.; Vélez, R.R. Exercise, adipokines and pediatric obesity: A meta-analysis of randomized controlled trials. Int. J. Obes. 2017, 41, 475–482. [Google Scholar] [CrossRef] [PubMed] [Green Version]
- Butte, N.F.; Garza, C.; de Onis, M. Evaluation of the Feasibility of International Growth Standards for School-Aged Children and Adolescents. J. Nutr. 2007, 137, 153–157. [Google Scholar] [CrossRef] [Green Version]
- de Onis, M.; Onyango, A.W.; Borghi, E.; Siyam, A.; Nishida, C.; Siekmann, J. Development of a WHO growth reference for school-aged children and adolescents. Bull. World Health Organ. 2007, 85, 660–667. [Google Scholar] [CrossRef] [PubMed]
- World Health Organization WHO Anthro for personal computers v 3.2.2. In Software for Assessing Growth and Development of the World’s Children; WHO: Geneva, Switzerland, 2010.
- de Onis, M.; Lobstein, T. Defining obesity risk status in the general childhood population: Which cut-offs should we use? Int. J. Pediatr. Obes. 2010, 5, 458–460. [Google Scholar] [CrossRef] [PubMed]
- WHO Expert Consultaion Waist Circumference and Waist-Hip Ratio: Report of a WHO Expert Consultation; World Health Organization: Geneva, Switzerland, 2008; ISBN 9789241501491.
- World Health Organization Who Step wise Approach to Surveillance (STEPS); WHO: Geneva, Switzerland, 2008.
- Tanner, J.M. Growth and maturation during adolescence. Nutr. Rev. 1981, 39, 43–55. [Google Scholar] [CrossRef]
- Geffken, D.F.; Keating, F.G.; Cornell, E.S.; Bovill, E.G.; Tracy, R.P. The measurement of fibrinogen in population-based research: Studies on instrumentation and methodology. Arch. Pathol. Lab. Med. 1994, 118, 1106–1109. [Google Scholar] [PubMed]
- Matthews, D.R.; Hosker, J.P.; Rudenski, A.S.; Naylor, B.A.; Treacher, D.F.; Turner, R.C. Homeostasis model assessment: Insulin resistance and beta-cell function from fasting plasma glucose and insulin concentrations in man. Diabetologia 1985, 28, 412–419. [Google Scholar] [CrossRef] [PubMed] [Green Version]
- Tilaki, H.K. Receiver Operating Characteristic (ROC) Curve Analysis for Medical Diagnostic Test Evaluation. Casp. J. Intern. Med. 2013, 4, 627–635. [Google Scholar]
- Bjornstad, P.; Truong, U.; Dorosz, J.L.; Green, C.M.; Baumgartner, A.; Coe, G.; Pyle, L.; Regensteiner, J.G.; Reusch, J.E.B.; Nadeau, K.J. Cardiopulmonary Dysfunction and Adiponectin in Adolescents with Type 2 Diabetes. J. Am. Heart Assoc. 2016, 5, 2804. [Google Scholar] [CrossRef] [Green Version]
- Ouwens, D.M.; Bekaert, M.; Lapauw, B.; Van Nieuwenhove, Y.; Lehr, S.; Hartwig, S.; Calders, P.; Kaufman, J.M.; Sell, H.; Eckel, J.; et al. Chemerin as biomarker for insulin sensitivity in males without typical characteristics of metabolic syndrome. Arch. Physiol. Biochem. 2012, 118, 135–138. [Google Scholar] [CrossRef]
- Trayhurn, P.; Beattie, J.H. Physiological role of adipose tissue: White adipose tissue as an endocrine and secretory organ. Proc. Nutr. Soc. 2001, 60, 329–339. [Google Scholar] [CrossRef] [PubMed] [Green Version]
- Hermoso, G.A.; Sobrinho, A.C.; Mota, J.; Santos, R.M.; Bautista, C.J.E.; Vélez, R.R. Adiposity as a full mediator of the influence of cardiorespiratory fitness and inflammation in schoolchildren: The FUPRECOL Study. Nutr. Metab. Cardiovasc. Dis. 2017, 27, 525–533. [Google Scholar] [CrossRef]
- Sun, C.; Magnussen, C.G.; Ponsonby, A.L.; Schmidt, M.D.; Carlin, J.B.; Huynh, Q.; Venn, A.J.; Dwyer, T. The contribution of childhood cardiorespiratory fitness and adiposity to inflammation in young adults. Obesity 2014, 22, 2598–2605. [Google Scholar] [CrossRef]
- Ford, E.S. National Health and Nutrition Examination Survey C-Reactive Protein Concentration and Cardiovascular Disease Risk Factors in Children. Circulation 2003, 108, 1053–1058. [Google Scholar] [CrossRef] [Green Version]
- Martins, C.; Freitas, I.; Pizarro, A.; Aires, L.; Silva, G.; Santos, M.P.; Mota, J. Cardiorespiratory fitness, but not central obesity or C-reactive protein, is related to liver function in obese children. Pediatr. Exerc. Sci. 2013, 25, 3–11. [Google Scholar] [CrossRef] [PubMed]
- Estruch, R.; Sacanella, E.; Badia, E.; Antúnez, E.; Nicolás, J.M.; Solá, F.J.; Rotilio, D.; de Gaetano, G.; Rubin, E.; Márquez, U.A. Different effects of red wine and gin consumption on inflammatory biomarkers of atherosclerosis: A prospective randomized crossover trial. Effects of wine on inflammatory markers. Atherosclerosis 2004, 175, 117–123. [Google Scholar] [CrossRef] [PubMed]
- Esposito, K.; Marfella, R.; Ciotola, M.; Di Palo, C.; Giugliano, F.; Giugliano, G.; Armiento, D.M.; Andrea, D.F.; Giugliano, D. Effect of a mediterranean-style diet on endothelial dysfunction and markers of vascular inflammation in the metabolic syndrome: A randomized trial. JAMA 2004, 292, 1440–1446. [Google Scholar] [CrossRef] [Green Version]
- Nicklas, J.M.; Sacks, F.M.; Smith, S.R.; LeBoff, M.S.; Rood, J.C.; Bray, G.A.; Ridker, P.M. Effect of dietary composition of weight loss diets on high-sensitivity c-reactive protein: The Randomized POUNDS LOST trial. Obesity (Silver Spring) 2013, 21, 681–689. [Google Scholar] [CrossRef]
- Azadbakht, L.; Izadi, V.; Surkan, P.J.; Esmaillzadeh, A. Effect of a High Protein Weight Loss Diet on Weight, High-Sensitivity C-Reactive Protein, and Cardiovascular Risk among Overweight and Obese Women: A Parallel Clinical Trial. Int. J. Endocrinol. 2013, 2013, 1–8. [Google Scholar] [CrossRef]
- Chan, R.; Yu, B.; Leung, J.; Lee, J.S.W.; Woo, J. Association of dietary patterns with serum high-sensitivity C-reactive protein level in community-dwelling older adults. Clin. Nutr. ESPEN 2019, 31, 38–47. [Google Scholar] [CrossRef]
- Khunger, J.M.; Kumar, N.; Punia, V.P.S.; Malhotra, M.K. Study of Prothrombotic Changes in Metabolic Syndrome. Indian J. Hematol. Blood Transfus. 2020, 36, 695–699. [Google Scholar] [CrossRef] [PubMed]
- Nienaber, C.; Pieters, M.; Kruger, S.H.; Stonehouse, W.; Vorster, H.H. Overfatness, stunting and physical inactivity are determinants of plasminogen activator inhibitor-1activity, fibrinogen and thrombin-antithrombin complex in African adolescents. Blood Coagul. Fibrinolysis 2008, 19, 361–368. [Google Scholar] [CrossRef]
- Miura, K.; Nakagawa, H.; Ueshima, H.; Okayama, A.; Saitoh, S.; Curb, J.D.; Rodriguez, B.L.; Sakata, K.; Okuda, N.; Yoshita, K.; et al. Dietary factors related to higher plasma fibrinogen levels of Japanese-Americans in Hawaii compared with Japanese in Japan. Arterioscler. Thromb. Vasc. Biol. 2006, 26, 1674–1679. [Google Scholar] [CrossRef] [Green Version]
- Freitas, R.N.; Luben, R.; Wareham, N.J.; Khaw, K.-T. Relationship between plasma fibrinogen and fiber intake in the EPIC-Norfolk cohort. Eur. J. Clin. Nutr. 2012, 66, 443–451. [Google Scholar] [CrossRef]
- Rodriguez, R.J.I.; Marcos, G.M.A.; Alonso, P.M.C.; Puigdomenech, E.; Pacheco, N.B.; Gallastegui, M.N.; de la Fuente, A. de la C.; Ilarduya, O.L.; Fernandez, M.J.A.; de Laso, C.A.; et al. Effects of kiwi consumption on plasma lipids, fibrinogen and insulin resistance in the context of a normal diet. Nutr. J. 2015, 14, 97. [Google Scholar] [CrossRef] [PubMed] [Green Version]
- Giordano, M.; Feo, D.E.; Lucidi, P.; Depascale, E.; Giordano, G.; Cirillo, D.; Dardo, G.; Signorelli, S.S.; Castellino, P. Effects of Dietary Protein Restriction on Fibrinogen and Albumin Metabolism in Nephrotic Patients; Elsevier: Amsterdam, The Netherlands, 2001; Volume 60. [Google Scholar]
- Kopec, A.K.; Abrahams, S.R.; Thornton, S.; Palumbo, J.S.; Mullins, E.S.; Divanovic, S.; Weiler, H.; Owens, A.P.; Mackman, N.; Goss, A.; et al. Thrombin promotes diet-induced obesity through fibrin-driven inflammation. J. Clin. Investig. 2017, 127, 3152–3166. [Google Scholar] [CrossRef] [PubMed]
- Takken, T.; Bongers, B.C.; van Brussel, M.; Haapala, E.A.; Hulzebos, E.H.J. Cardiopulmonary Exercise Testing in Pediatrics. Ann. Am. Thorac. Soc. 2017, 14, S123–S128. [Google Scholar] [CrossRef] [Green Version]
- Mintjens, S.; Menting, M.D.; Daams, J.G.; van Poppel, M.N.M.; Roseboom, T.J.; Gemke, R.J.B.J. Cardiorespiratory Fitness in Childhood and Adolescence Affects Future Cardiovascular Risk Factors: A Systematic Review of Longitudinal Studies. Sport Med. 2018, 48, 2577–2605. [Google Scholar] [CrossRef] [PubMed] [Green Version]
- Ruangnapaa, K.; Sritippayawana, S.; Sanguanrungsirikulb, S.; Deerojanawonga, J.; Nuanchan, P. Exercise intolerance in obese children and adolescents. Asian Biomed. 2014, 8, 659–664. [Google Scholar] [CrossRef]
- Henriksson, P.; Sanchez, C.C.; Leppänen, M.H.; Nyström, D.C.; Ortega, F.B.; Pomeroy, J.; Ruiz, J.R.; Löf, M. Associations of Fat Mass and Fat-Free Mass with Physical Fitness in 4-Year-Old Children: Results from the MINISTOP Trial. Nutrients 2016, 8, 473. [Google Scholar] [CrossRef] [Green Version]
- Fung, T.T.; Arasaratnam, M.H.; Grodstein, F.; Katz, J.N.; Rosner, B.; Willett, W.C.; Feskanich, D. Soda consumption and risk of hip fractures in postmenopausal women in the Nurses’ Health Study. Am. J. Clin. Nutr. 2014, 100, 953–958. [Google Scholar] [CrossRef] [PubMed] [Green Version]
- Ferretti, A.; Giampiccolo, P.; Cavalli, A.; Emili, M.J.; Tantucci, C. Expiratory flow limitation and orthopnea in massively obese subjects. Chest 2001, 119, 1401–1408. [Google Scholar] [CrossRef] [Green Version]
- Zerah, F.; Harf, A.; Perlemuter, L.; Lorino, H.; Lorino, A.M.; Atlan, G. Effects of obesity on respiratory resistance. Chest 1993, 103, 1470–1476. [Google Scholar] [CrossRef] [Green Version]
- Ray, C.S.; Sue, D.Y.; Bray, G.; Hansen, J.E.; Wasserman, K. Effects of obesity on respiratory function. Am. Rev. Respir. Dis. 1983, 128, 501–506. [Google Scholar] [CrossRef]
- Kotanidou, E.P.; Grammatikopoulou, M.G.; Spiliotis, B.E.; Gantenbein, K.C.; Tsigga, M.; Tsinopoulou, G.A. Ten-year obesity and overweight prevalence in Greek children: A systematic review and meta-analysis of 2001-2010 data. Hormones (Athens) 2013, 12, 537–549. [Google Scholar] [CrossRef] [PubMed] [Green Version]
- Grammatikopoulou, M.G.; Poulimeneas, D.; Gounitsioti, I.S.; Gerothanasi, K.; Tsigga, M.; Kiranas, E.; ADONUT Study Group. Prevalence of simple and abdominal obesity in Greek adolescents: The ADONUT study. Clin. Obes. 2014, 4, 303–308. [Google Scholar] [PubMed]
- Grammatikopoulou, M.G.; Theodoridis, X.; Chourdakis, M. International Aspects: Abdominal Obesity in Greece. In Nutrition in the Prevention and Treatment of Abdominal Obesity, 2nd ed.; Watson, R.R., Ed.; Elsevier Inc: Oxford, UK, 2018; ISBN 9780128137819. [Google Scholar]
- Grammatikopoulou, M.G.; Gkiouras, K.; Daskalou, E.; Apostolidou, E.; Theodoridis, X.; Stylianou, C.; Tsinopoulou, G.A.; Tsigga, M.; Dardavessis, T.; Chourdakis, M. Growth, the Mediterranean diet and the buying power of adolescents in Greece. J. Pediatr. Endocrinol. Metab. 2018, 31, 773–780. [Google Scholar] [CrossRef]
- Grammatikopoulou, M.G.; Chourdakis, M.; Gkiouras, K.; Roumeli, P.; Poulimeneas, D.; Apostolidou, E.; Chountalas, I.; Tirodimos, I.; Filippou, O.; Lagogianni, P.S.; et al. Edmonton obesity staging system among pediatric patients: A validation and obesogenic risk factor analysis. J. Endocrinol. Investig. 2018, 41, 947–957. [Google Scholar] [CrossRef] [PubMed]
- Tenório, T.R.S.; Balagopal, P.B.; Andersen, L.B.; Dias, R.R.M.; Hill, J.O.; Prado, L.M.C.; Prado, W.L. Effect of Low- Versus High-Intensity Exercise Training on Biomarkers of Inflammation and Endothelial Dysfunction in Adolescents with Obesity: A 6-Month Randomized Exercise Intervention Study. Pediatr. Exerc. Sci. 2018, 30, 96–105. [Google Scholar] [CrossRef] [PubMed]
- Livesey, G.; Taylor, R.; Livesey, H.F.; Buyken, A.E.; Jenkins, D.J.A.; Augustin, L.S.A.; Sievenpiper, J.L.; Barclay, A.W.; Liu, S.; Wolever, T.M.S.; et al. Dietary Glycemic Index and Load and the Risk of Type 2 Diabetes: Assessment of Causal Relations. Nutrients 2019, 11, 1436. [Google Scholar] [CrossRef] [Green Version]
- Cao, M.; Quan, M.; Zhuang, J. Effect of High-Intensity Interval Training versus Moderate-Intensity Continuous Training on Cardiorespiratory Fitness in Children and Adolescents: A Meta-Analysis. Int. J. Environ. Res. Public Health 2019, 16, 1533. [Google Scholar] [CrossRef] [Green Version]
- Pervanidou, P.; Bastaki, D.; Chouliaras, G.; Papanikolaou, K.; Gantenbein, K.C.; Chrousos, G. Internalizing and externalizing problems in obese children and adolescents: Associations with daily salivary cortisol concentrations. Hormones (Athens) 2015, 14, 623–631. [Google Scholar] [CrossRef]
- Plavsic, L.; Knezevic, O.M.; Sovtic, A.; Minic, P.; Vukovic, R.; Mazibrada, I.; Stanojlovic, D.; Hrncic, D.; Markovic, A.R.; Macut, D. Effects of high-intensity interval training and nutrition advice on cardiometabolic markers and aerobic fitness in adolescent girls with obesity. Appl. Physiol. Nutr. Metab. 2020, 45, 294–300. [Google Scholar] [CrossRef]
- Ingul, C.B.; Dias, K.A.; Tjonna, A.E.; Follestad, T.; Hosseini, M.S.; Timilsina, A.S.; Strand, H.S.M.; Ro, T.B.; Davies, P.S.W.; Cain, P.A.; et al. Effect of High Intensity Interval Training on Cardiac Function in Children with Obesity: A Randomised Controlled Trial. Prog. Cardiovasc. Dis. 2018, 61, 214–221. [Google Scholar] [CrossRef] [Green Version]
- Seo, Y.-G.; Lim, H.; Kim, Y.M.; Ju, Y.-S.; Lee, H.-J.; Jang, H.B.; Park, S.I.; Park, K.H. The Effect of a Multidisciplinary Lifestyle Intervention on Obesity Status, Body Composition, Physical Fitness, and Cardiometabolic Risk Markers in Children and Adolescents with Obesity. Nutrients. 2019, 11, 137. [Google Scholar] [CrossRef] [PubMed] [Green Version]
- Dias, K.A.; Ingul, C.B.; Tjønna, A.E.; Keating, S.E.; Gomersall, S.R.; Follestad, T.; Hosseini, M.S.; Strand, H.S.M.; Ro, T.B.; Haram, M.; et al. Effect of High-Intensity Interval Training on Fitness, Fat Mass and Cardiometabolic Biomarkers in Children with Obesity: A Randomised Controlled Trial. Sports Med. 2018, 48, 733–746. [Google Scholar] [CrossRef] [PubMed]
- Di Genova, L.; Penta, L.; Biscarini, A.; Di Cara, G.; Esposito, S. Children with Obesity and Asthma: Which Are the Best Options for Their Management? Nutrients 2018, 10, 1634. [Google Scholar] [CrossRef] [Green Version]
- Verduci, E.; Lassandro, C.; Giacchero, R.; Miniello, V.; Banderali, G.; Radaelli, G. Change in Metabolic Profile after 1-Year Nutritional-Behavioral Intervention in Obese Children. Nutrients 2015, 7, 10089–10099. [Google Scholar] [CrossRef] [PubMed] [Green Version]
- Myers, J.; Kokkinos, P.; Nyelin, E. Physical Activity, Cardiorespiratory Fitness, and the Metabolic Syndrome. Nutrients 2019, 11, 1652. [Google Scholar] [CrossRef] [Green Version]
- García, L.N.; Hermoso, G.A.; Tobarra, M.M.; Fernández, D.A.; Cano, S.A.; Vizcaíno, M.V. Cardiorespiratory Fitness as a Mediator of the Influence of Diet on Obesity in Children. Nutrients 2018, 10, 358. [Google Scholar] [CrossRef] [PubMed] [Green Version]
- Ibáñez, L.; Barouti, K.; Markantes, G.K.; Armeni, A.K.; Georgopoulos, N.A. Pediatric endocrinology: An overview of the last decade. Hormones 2018, 17, 439–449. [Google Scholar] [CrossRef]
- Ozsu, E.; Yazıcıoğlu, B. Obese boys with low concentrations of high-density lipoprotein cholesterol are at greater risk of hepatosteatosis. Hormones 2019, 18, 477–484. [Google Scholar] [CrossRef] [Green Version]
- Tzifi, F.; Fretzayas, A.; Chrousos, G.; Gantenbein, K.C. Non-alcoholic fatty liver infiltration in children: An underdiagnosed evolving disease. Hormones 2019, 18, 255–265. [Google Scholar] [CrossRef]

| Age (years) | 11.5 ± 2.0 |
| Sex (boys/girls) (n) | 42/42 |
| Prepubertal/pubertal (n) | 26/58 |
| BMIz | 2.26 ± 1.46 |
| Weight status (normoweight/overweight/obese) (n) | 21/22/41 |
| Characteristics | Normoweight | Overweight | Obese | p-Value between Weight Status Tiers | ||||||
|---|---|---|---|---|---|---|---|---|---|---|
| Boys (n = 9) | Girls (n = 12) | Total (n = 21) | Boys (n = 9) | Girls (n = 13) | Total (n = 22) | Boys (n = 24) | Girls (n = 17) | Total (n = 41) | ||
| Age (years) | 12.3 ± 2.2 | 11.9 ± 1.7 | 12.0 ± 1.9 | 12.0 ± 1.8 | 10.9 ± 2.1 | 11.4 ± 2.0 | 11.3 ± 2.3 | 11.1 ± 1.9 | 11.2 ± 2.1 | NS |
| Prepubertal/pubertal (n) | 4/5 | 1/11 | 5/16 | 2/7 | 3/10 | 5/17 | 13/11 | 3/14 | 16/25 | NS |
| Body weight (kg) | 45.2 ± 13.9 | 41.2 ± 11.6 ‡ | 42.8 ± 12.3 ‡‡‡ | 57.7 ± 13.3 | 55.9 ± 9.9 * | 56.6 ± 11.2 ‡‡* | 71.2 ± 24.3 * | 69.9 ± 14.0 *** | 70.6 ± 20.5 | <0.001 |
| Height (m) | 1.53 ± 0.16 | 1.48 ± 0.13 | 1.50 ± 0.14 | 1.55 ± 0.17 | 1.49 ± 0.1 | 1.52 ± 0.13 | 1.5 ± 0.12 | 1.5 ± 0.1 | 1.51 ± 0.11 | ΝS |
| BMI (kg/m2) | 18.8 ± 2.4 ‡‡‡ | 18.3 ± 2.6 ‡‡‡ | 18.5 ± 2.5 ‡‡‡ | 23.7 ± 1.0 ** | 24.9 ± 1.7 *** | 24.4 ± 1.6 ‡‡‡*** | 30.0 ± 3.2 *** | 29.6 ± 3.3 *** | 29.8 ± 3.22 | <0.001 |
| BMIz | 0.4 ± 0.62 ‡‡‡ | 0.03 ± 1.02 ‡ | 0.18 ± 0.88 ‡‡‡ | 2.03 ± 0.48 *** | 2.24 ± 0.4 *** | 2.15 ± 0.43 ‡‡‡*** | 3.57 ± 0.77 *** | 2.98 ± 0.56 *** | 3.33 ± 0.74 | <0.001 |
| Waist circumference (cm) | 64 ± 9.7 ‡ | 64.4 ± 8.1 ‡ | 64.2 ± 8.6 ‡‡‡ | 84.6 ± 4.7 * | 86.6 ± 9.3 *** | 85.8 ± 7.7 ‡‡‡*** | 100.3 ± 17.7 *** | 100.4 ± 12.4 *** | 100.33 ± 15.53 | <0.001 |
| Hips circumference (cm) | 78.1 ± 10.3 | 81.0 ± 9.3 ‡ | 79.7 ± 9.6 ‡‡‡ | 91.3 ± 8.5 | 94.3 ± 8.9 ** | 93.1 ± 8.6 ‡‡‡ ** | 101.3 ± 13.9 *** | 103.1 ± 7.8 *** | 102.05 ± 11.67 | <0.001 |
| Waist/hips ratio | 0.82 ± 0.02 | 0.8 ± 0.05 | 0.81 ± 0.04 ‡‡‡ | 0.93 ± 0.06 ** | 0.92 ± 0.04 *** | 0.92 ± 0.05 ‡‡‡** | 0.99 ± 0.08 *** | 0.97 ± 0.08 *** | 0.98 ± 0.08 | <0.001 |
| hs-CRP (mg/dL) | 0.13 ± 0.09 | 0.14 ± 0.09 | 0.13 ± 0.09 | 0.23 ± 0.16 | 0.28 ± 0.27 | 0.26 ± 0.23 | 0.78 ± 1.32 | 0.39 ± 0.33 | 0.62 ± 1.04 | 0.040 |
| Glucose (mg/dL) | 75.7 ± 7.0 | 82.4 ± 6.4 | 79.5 ± 7.3 ‡‡‡ | 84.2 ± 7.5 | 84.3 ± 8.1 | 84.3 ± 7.6 | 88.5 ± 7.8 *** | 87.5 ± 6.0 | 88.1 ± 7.03 | <0.001 |
| Insulin (μUI/mL) | 2.6 ± 1.5 | 3.1 ± 2.4 | 2.9 ± 2.1 ‡‡‡ | 5.6 ± 4.8 | 7.4 ± 5.1 | 6.6 ± 4.9 | 13.5 ± 17.1 | 12.4 ± 8.0 *** | 13.07 ± 13.93 | 0.001 |
| TG/HDL | 0.9 ± 0.5 | 1.3 ± 0.5 | 1.1 ± 0.5 ‡‡ | 1.8 ± 1.1 | 2.1 ± 1.3 | 1.9 ± 1.2 | 2.0 ± 1.3 * | 2.3 ± 1.4 | 2.13 ± 1.31 | 0.006 |
| HOMA-IR | 0.5 ± 0.3 | 0.6 ± 0.5 | 0.6 ± 0.4 ‡‡ | 1.2 ± 1.2 | 1.6 ± 1.2 | 1.4 ± 1.2 | 3.1 ± 4.2 | 2.7 ± 1.7 *** | 2.92 ± 3.34 | 0.001 |
| VO2max (mL/kg/min) | 48.3 ± 6.9 ‡ | 46.4 ± 7.6 | 48.7 ± 6.2 ‡‡‡ | 38.1 ± 6.7 ** | 33.6 ± 5.0 *** | 35.7 ± 6.0 ***‡‡‡ | 31.5 ± 5.9 *** | 28.4 ± 5.3 *** | 30.38 ± 5.95 | <0.001 |
| VO2max (%) | 95.7 ± 8.2 ‡ | 107.5 ± 15.4 | 102.9 ± 14.1 ‡‡‡ | 74.1 ± 14.0 ** | 74.9 ± 11.1 *** | 75.1 ± 12.1 ***‡‡‡ | 58.5 ± 11.1 *** | 65 ± 11.8 *** | 61.32 ± 11.74 | <0.001 |
| Leptin (ng/mL) | 4.0 ± 3.2 ‡ | 6.5 ± 3.5 | 5.5 ± 3.5 ‡‡‡ | 21.9 ± 12.7 * | 30 ± 9.3 *** | 25.5 ± 11.8 ***‡‡‡ | 37.1 ± 16.0 *** | 42.5 ± 20.7 *** | 39.65 ± 18.98 | <0.001 |
| Adiponectin (μg/mL) | 15.8 ± 6.5 | 14.9 ± 6.8 | 15.3 ± 6.5 | 14.5 ± 5.2 | 14.9 ± 9.2 | 14.7 ± 7.5 | 13.1 ± 5.7 | 10.5 ± 3.9 | 12.06 ± 5.15 | NS |
| Fibrinogen (mg/dL) | 235.6 ± 68.8 | 253.5 ± 69.3 | 245.0 ± 67.8 ‡‡‡ | 324.2 ± 61.7 * | 302.4 ± 87.9 | 311.0 ± 77.4 *‡‡ | 373.4 ± 61.2 *** | 384.4 ± 99.5 *** | 378.0 ± 78.4 | 0.001 |
| Prepubertal | Pubertal | |||||
|---|---|---|---|---|---|---|
| Characteristics | Normoweight (n = 5) | Overweight (n = 5) | Obese (n = 16) | Normoweight (n = 16) | Overweight (n = 17) | Obese (n = 25) |
| Age (years) | 10.3 ± 1.0 | 10.0 ± 1.4 | 9.6 ± 1.3 | 12.6 ± 1.8 | 11.8 ± 2.0 | 12.2 ± 1.9 |
| Boys/girls (n) | 4/1 | 2/3 | 13/3 | 5/11 | 7/10 | 11/14 |
| Body weight (kg) | 33.8 ± 5.0 | 46.5 ± 5.7 ‡ | 58.3 ± 9.1 *** | 45.8 ± 12.7 | 59.6 ± 10.7 ‡‡ | 78.5 ± 21.9 *** |
| Height (m) | 1.4 ± 0.07 | 1.39 ± 0.1 | 1.42 ± 0.06 | 1.54 ± 0.14 | 1.55 ± 0.13 | 1.57 ± 0.1 |
| BMI (kg/m2) | 17.1 ± 1.5 | 24.1 ± 1.4 ***‡‡ | 28.8 ± 2.7 *** | 19.0 ± 2.6 | 24.5 ± 1.6 ***‡‡‡ | 30.5 ± 3.4 *** |
| BMIz | 0.18 ± 0.59 | 2.41 ± 0.14 ***‡ | 3.74 ± 0.71 *** | 0.18 ± 0.98 | 2.08 ± 0.46 ***‡‡‡ | 3.06 ± 0.65 *** |
| Waist circumference (cm) | 57.0 ± 5.3 | 81.3 ± 6.8 ** | 93.7 ± 12.3 *** | 67.0 ± 8.0 | 87.1 ± 7.6 ***‡‡‡ | 104.6 ± 16.1 *** |
| Hips circumference (cm) | 70.2 ± 4.6 | 85.9 ± 5.8 * | 94.6 ± 8.7 *** | 83.4 ± 8.5 | 95.2 ± 8.3 **‡‡‡ | 106.8 ± 11.0 *** |
| Waist/hips ratio | 0.81 ± 0.02 | 0.95 ± 0.04 ** | 0.99 ± 0.07 *** | 0.8 ± 0.05 | 0.9 ± 0.1 ***‡ | 0.98 ± 0.08 *** |
| hs-CRP (mg/dL) | 0.18 ± 0.12 | 0.31 ± 0.24 | 0.69 ± 1.01 | 0.12 ± 0.08 | 0.24 ± 0.23 | 0.58 ± 1.08 |
| Glucose (mg/dL) | 76.6 ± 7.4 | 85.0 ± 4.6 | 86.7 ± 6.0 * | 80.4 ± 7.3 | 84.1 ± 8.4 | 89.0 ± 7.57 ** |
| Insulin (μUI/mL) | 2.0 ± 0.0 | 4.1 ± 4.0 | 13.1 ± 19.3 | 3.1 ± 2.3 | 7.2 ± 5.0 ‡ | 13.1 ± 9.6 *** |
| TG/HDL | 0.7 ± 0.3 | 2.5 ± 1.5 | 1.8 ± 1.5 | 1.3 ± 0.5 | 1.8 ± 1.1 | 2.3 ± 1.2 ** |
| HOMA-IR | 0.38 ± 0.04 | 0.86 ± 0.89 | 2.85 ± 4.42 | 0.63 ± 0.48 | 1.58 ± 1.22 | 2.97 ± 2.52 |
| VO2max (mL/kg/min) | 46.7 ± 8.4 | 35.9 ± 8.2 * | 32.2 ± 6.9 ** | 47.3 ± 7.1 | 35.3 ± 5.6 ***‡‡ | 29.0 ± 4.8 *** |
| VO2max (%) | 102.7 ± 21.9 | 73.4 ± 10.9 | 60.7 ± 13.5 *** | 102.9 ± 13.1 | 74.9 ± 12.7 ***‡‡ | 61.7 ± 10.83 *** |
| Leptin (ng/mL) | 4.1 ± 3.2 | 27.8 ± 8.6 | 38.9 ± 20.3 ** | 5.9 ± 3.6 | 26.4 ± 12.2 ***‡‡ | 39.6 ± 17.0 *** |
| Adiponectin (μg/mL) | 18.6 ± 4.0 | 18.0 ± 4.2 | 13.7 ± 4.1 | 14.3 ± 6.9 | 14.4 ± 7.8 | 11.0 ± 5.6 |
| Fibrinogen (mg/dL) | 244.2 ± 64.4 | 263.6 ± 42.2 ‡‡ | 367.6 ± 53.9 *** | 245.9 ± 71.1 | 325.3 ± 80.6 * | 384.6 ± 91.1 *** |
| Univariate Analysis | Multivariate Analysis | |||||
|---|---|---|---|---|---|---|
| Variables: | Unadjusted β | 95% CI | p-Value | Adjusted β | 95% CI | p-Value |
| Leptin (ng/mL) | 0.601 | (−0.739 to −0.463) | <0.001 | 0.492 | (−0.661 to −0.323) | <0.001 |
| Fibrinogen (mg/dL) | 0.092 | (−0.126 to −0.059) | <0.001 | 0038 | (−0.074 to −0.002) | 0.038 |
| Adiponectin (μg/dL) | 0.665 | (0.075 to 1.255) | 0.028 | 0.211 | (−0.302 to 0.725) | NS |
| hs-CRP (mg/dL) | 5.938 | (−10.419 to −1.457) | 0.010 | 0.691 | (−4.889 to 3.508) | NS |
| First Author | Study Origin | Participants | Intervention(s) | Comparator | Intervention Duration | Results |
|---|---|---|---|---|---|---|
| Plavsic [75] | Serbia | Adolescent girls with obesity (N = 44, aged 13–19 years) | Dietary advice on CV biomarkers, hormonal parameters, and cardiorespiratory fitness and HIIT (n = 22) | Dietary advice only (n = 22) | 12 weeks | The intervention group increased insulin sensitivity index and workload and decreased glucose AUC, insulin AUC, and hs-CRP compared with the diet group. |
| Ingul [76,77] | Norway | Children with obesity (N = 99) | (1) HIIT (n = 33), including 4 × 4 min bouts at 85–95% HRmax 3 times/week and nutrition advice (2) MICS (n = 32), 44 min at 60–70% HRmax, 3 times/week and nutrition advice | Nutrition advice only (n = 34) | 12 weeks | HIIT and MICS were equally efficacious and superior to nutrition alone, for improving LVS. HIIT was effective in increasing CRF when compared with the MICS and nutrition interventions. |
| Seo [78] | Korea | Children and adolescent with moderate to severe obesity(N = 103) | Exercise intervention (n = 32) | Usual care (including nutrition and exercise advice) (n = 71) | 16 weeks | Only the exercise group had a significantly lower BMIz compared to the baseline. Significant group by time interaction was observed in %BF, LBM, DBP, hs-CRP and wall-sit test. |
Publisher’s Note: MDPI stays neutral with regard to jurisdictional claims in published maps and institutional affiliations. |
© 2021 by the authors. Licensee MDPI, Basel, Switzerland. This article is an open access article distributed under the terms and conditions of the Creative Commons Attribution (CC BY) license (http://creativecommons.org/licenses/by/4.0/).
Share and Cite
Tsiroukidou, K.; Hatziagorou, E.; Grammatikopoulou, M.G.; Vamvakis, A.; Kontouli, K.; Tzimos, C.; Tsanakas, J.; Spiliotis, B.E. Cardiorespiratory Fitness Predicted by Fibrinogen and Leptin Concentrations in Children with Obesity and Risk for Diabetes: A Cross-Sectional Study and a ROC Curve Analysis. Nutrients 2021, 13, 674. https://doi.org/10.3390/nu13020674
Tsiroukidou K, Hatziagorou E, Grammatikopoulou MG, Vamvakis A, Kontouli K, Tzimos C, Tsanakas J, Spiliotis BE. Cardiorespiratory Fitness Predicted by Fibrinogen and Leptin Concentrations in Children with Obesity and Risk for Diabetes: A Cross-Sectional Study and a ROC Curve Analysis. Nutrients. 2021; 13(2):674. https://doi.org/10.3390/nu13020674
Chicago/Turabian StyleTsiroukidou, Kyriaki, Elpis Hatziagorou, Maria G. Grammatikopoulou, Anastasios Vamvakis, Kalliopi Kontouli, Christos Tzimos, John Tsanakas, and Bessie E. Spiliotis. 2021. "Cardiorespiratory Fitness Predicted by Fibrinogen and Leptin Concentrations in Children with Obesity and Risk for Diabetes: A Cross-Sectional Study and a ROC Curve Analysis" Nutrients 13, no. 2: 674. https://doi.org/10.3390/nu13020674
APA StyleTsiroukidou, K., Hatziagorou, E., Grammatikopoulou, M. G., Vamvakis, A., Kontouli, K., Tzimos, C., Tsanakas, J., & Spiliotis, B. E. (2021). Cardiorespiratory Fitness Predicted by Fibrinogen and Leptin Concentrations in Children with Obesity and Risk for Diabetes: A Cross-Sectional Study and a ROC Curve Analysis. Nutrients, 13(2), 674. https://doi.org/10.3390/nu13020674