
Infant Formula with Added Bovine Milk Fat Globule Membrane and Modified Iron Supports Growth and Normal Iron Status at One Year of Age: A Randomized Controlled Trial

 ,
,
Abstract
:1. Introduction
2. Materials and Methods
2.1. Study Objectives
2.2. Study Design and Participants
2.3. Randomization and Study Group Allocation
2.4. Study Objectives and Outcomes
2.5. Statistical Methods
3. Results
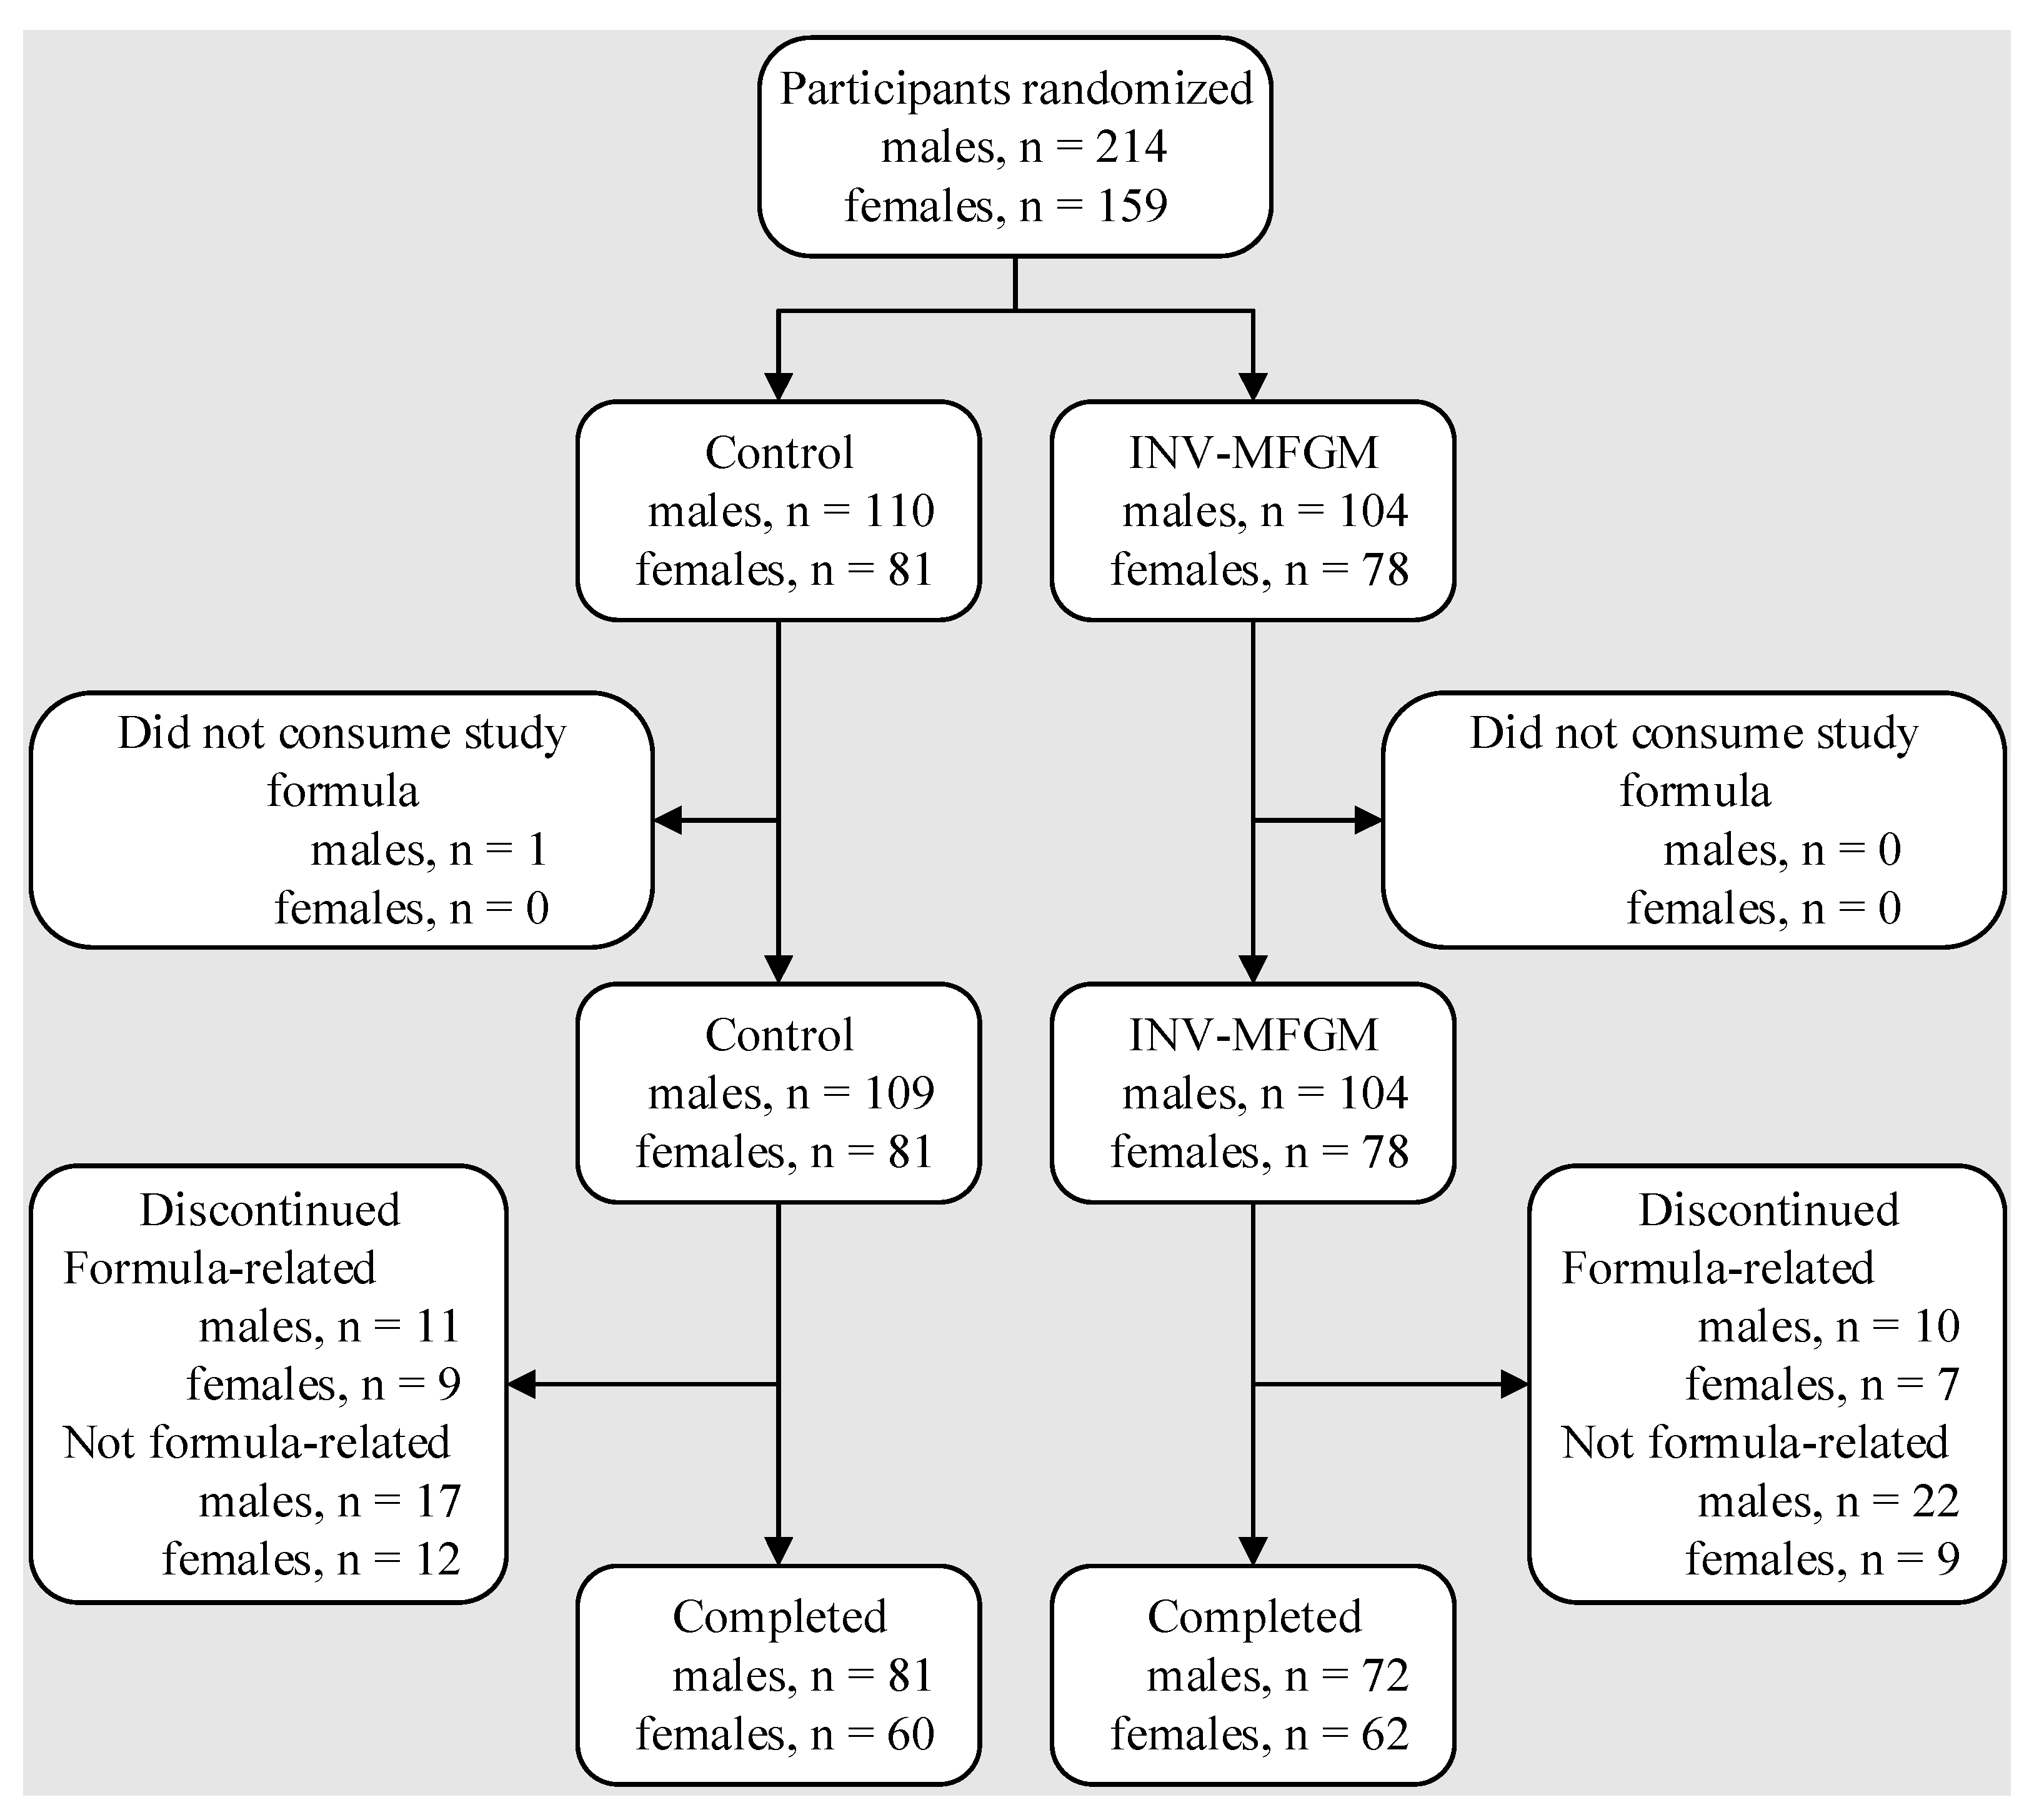
3.1. Participants
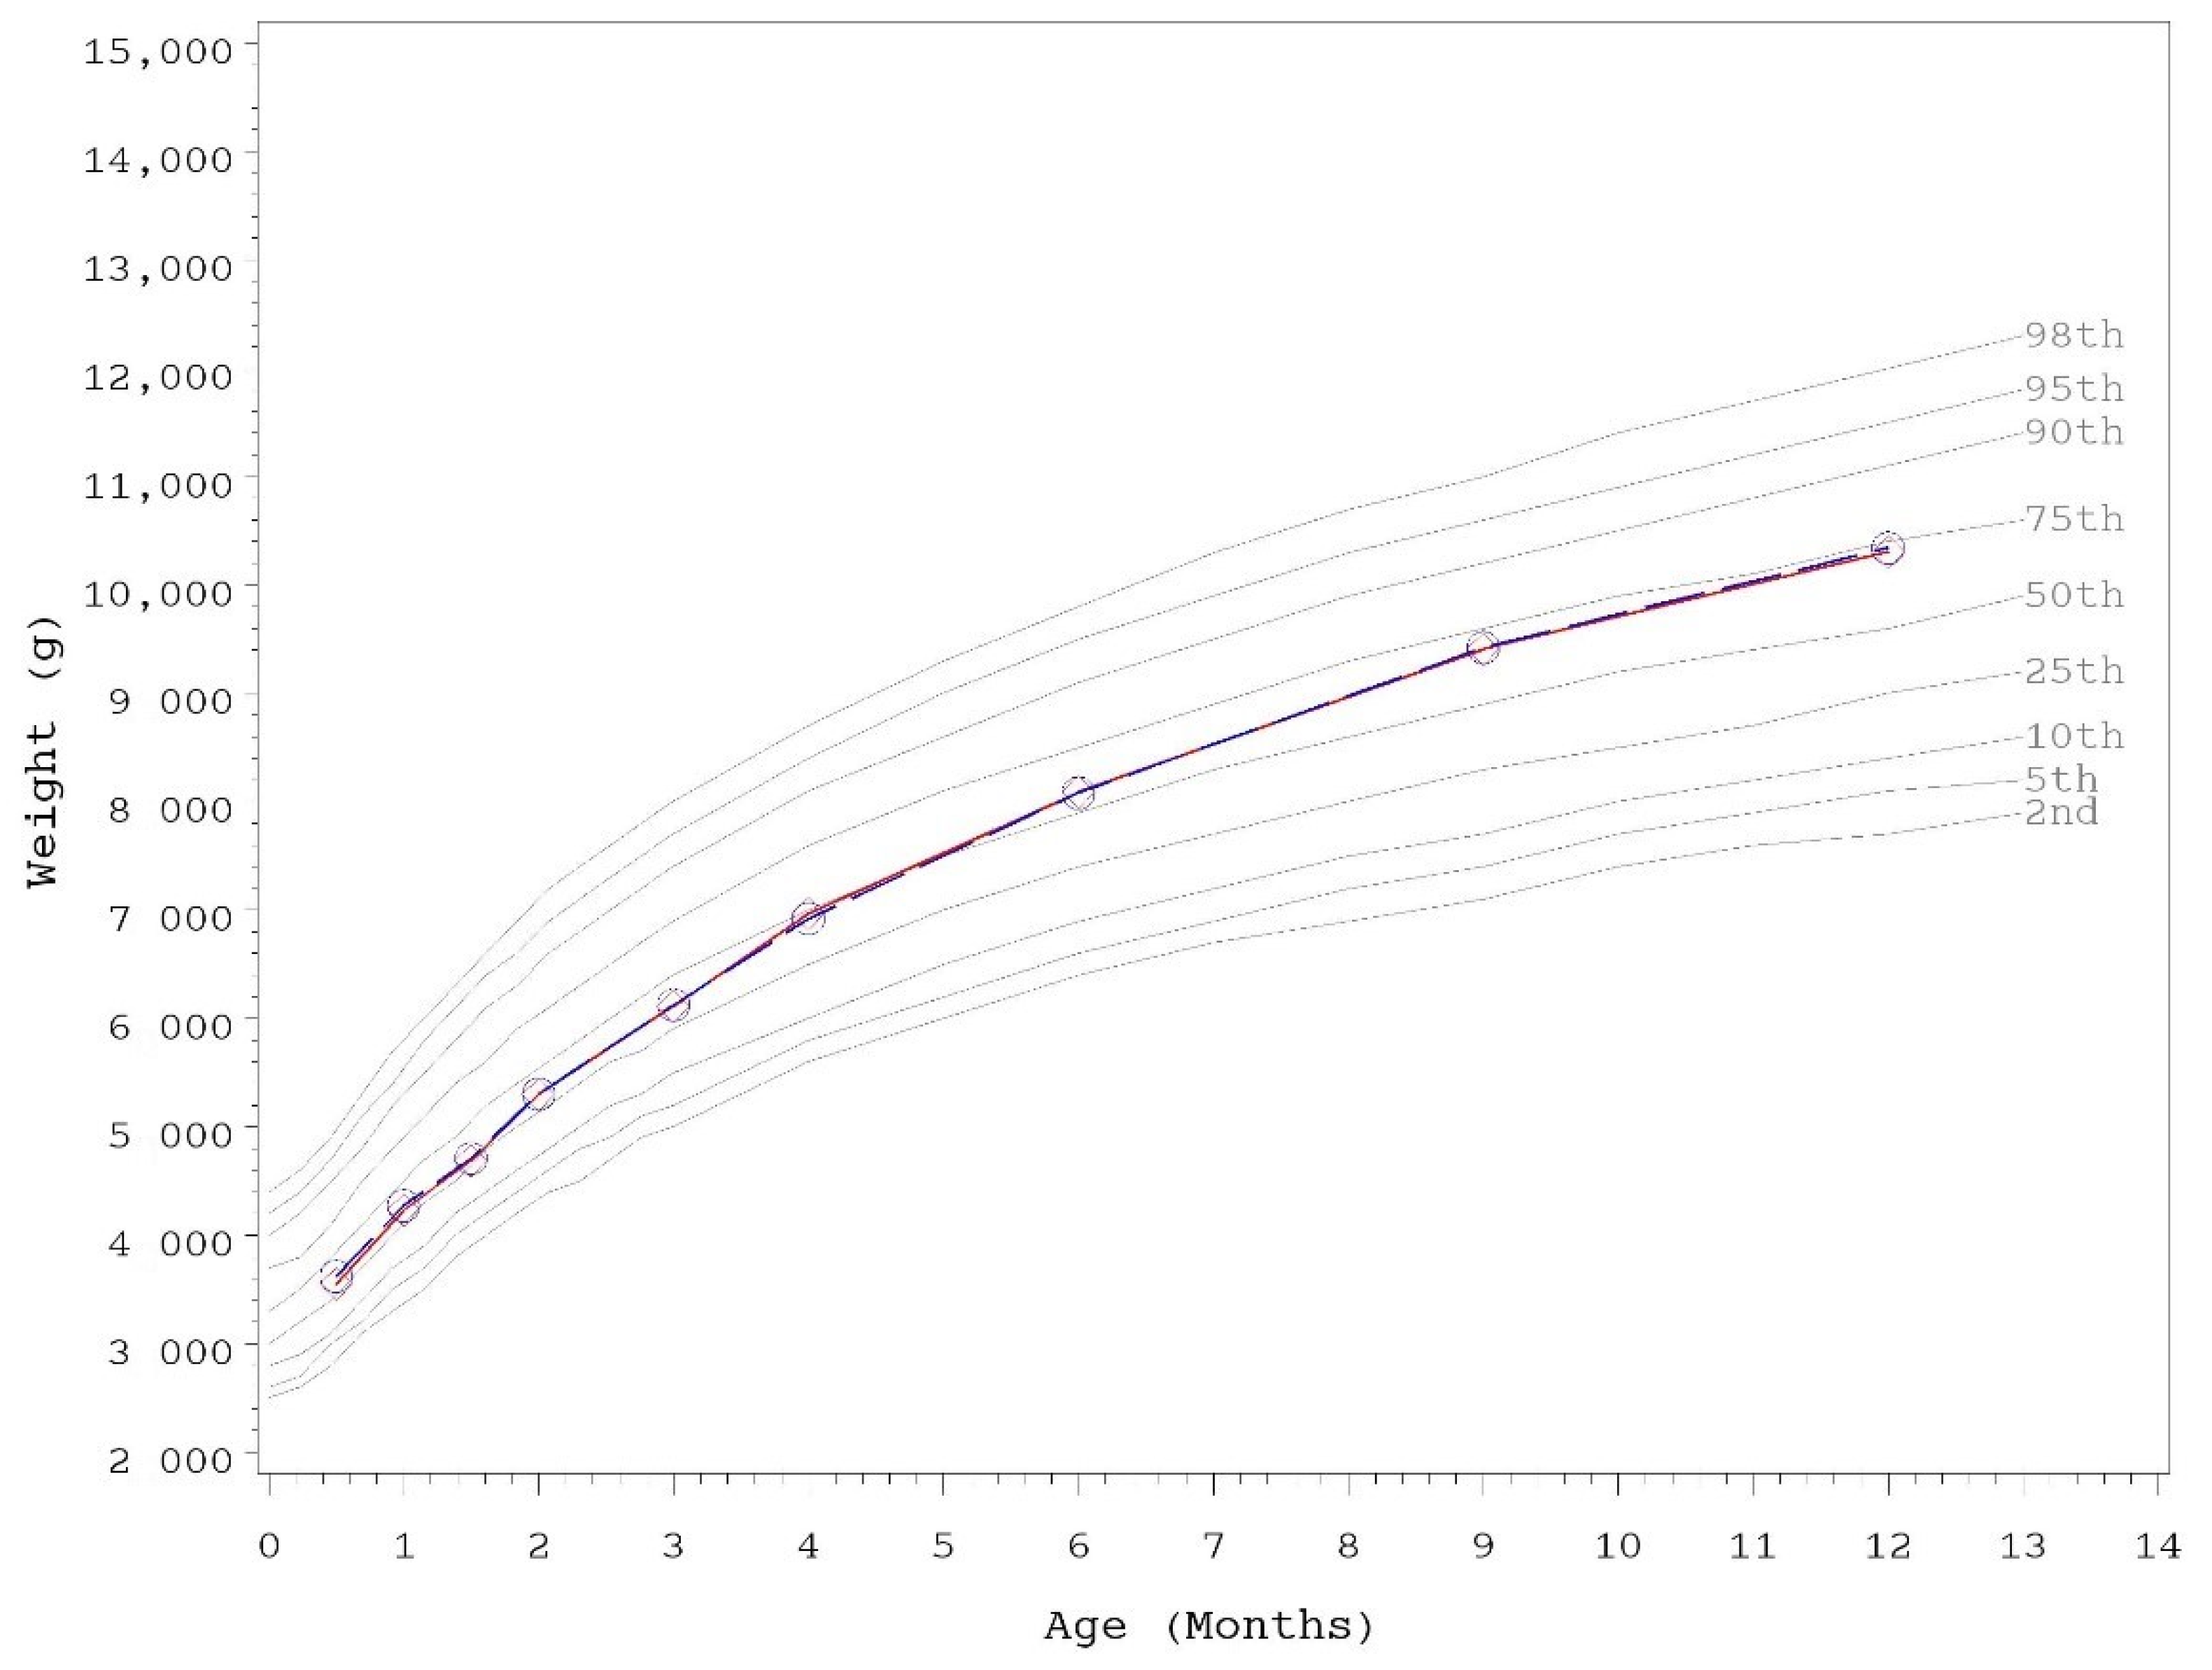
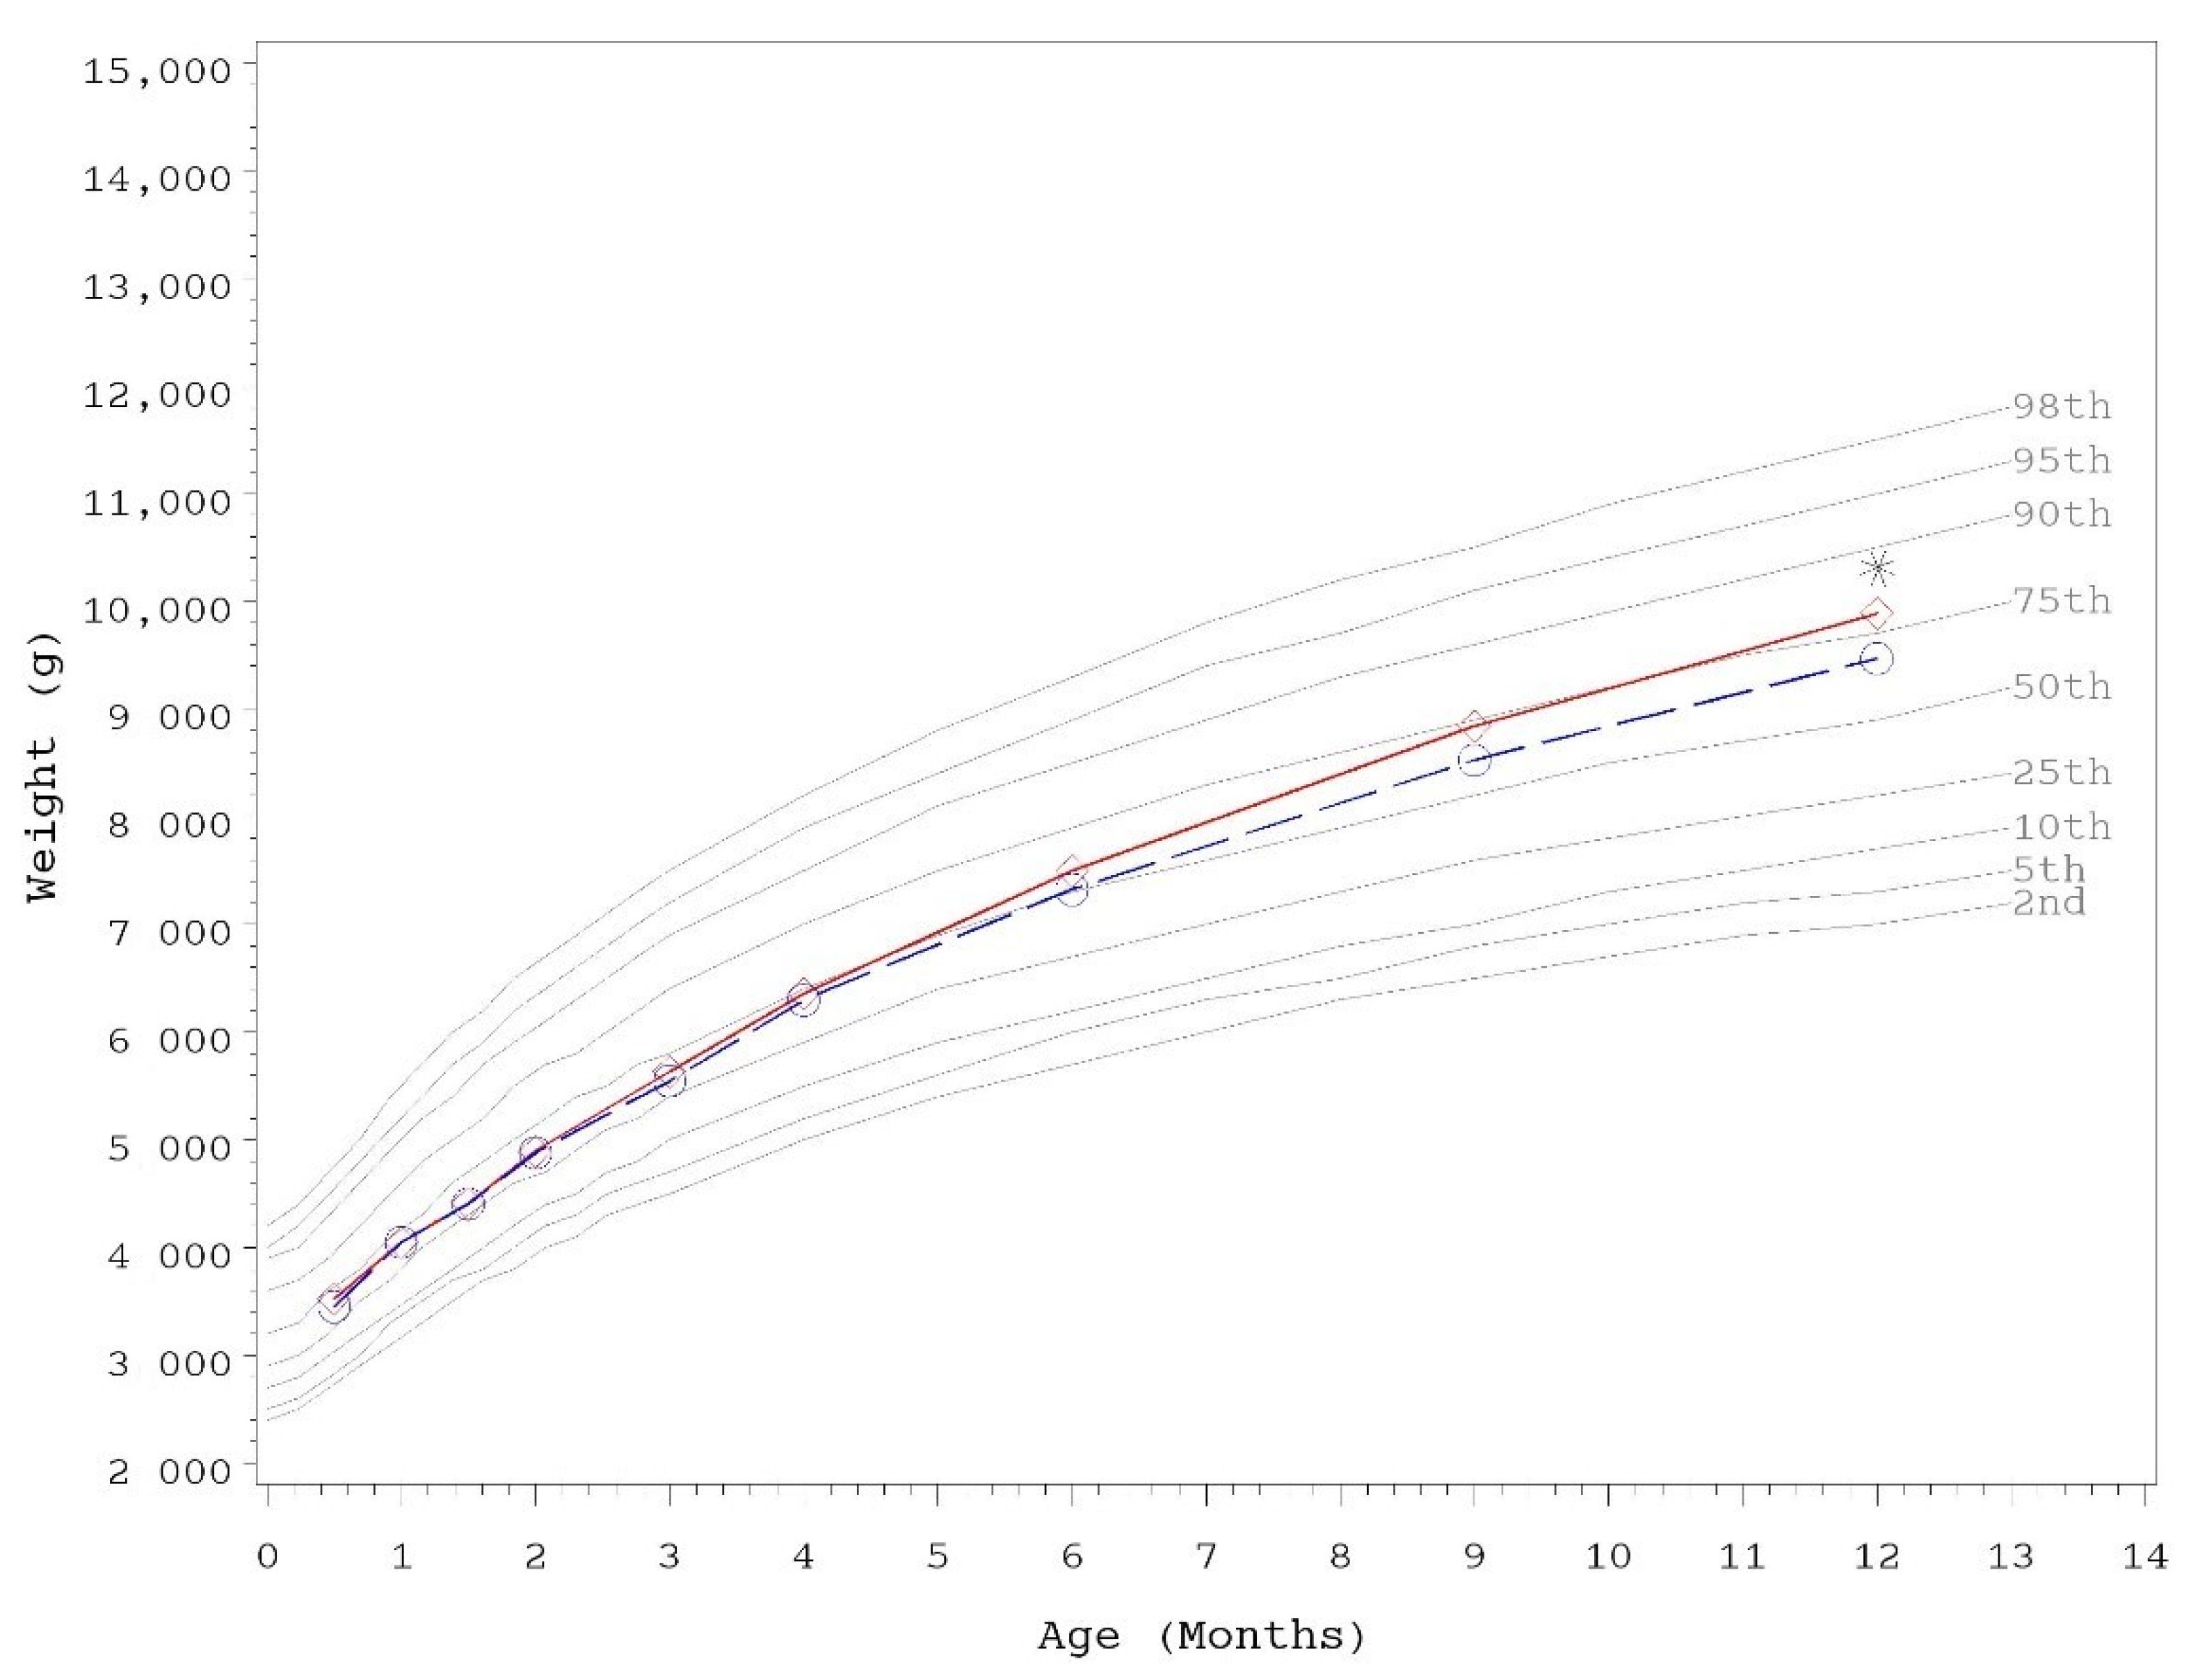
3.2. Growth
3.3. Tolerance
3.4. Iron Status
3.5. C-reactive Protein
4. Discussion
5. Conclusions
Author Contributions
Funding
Institutional Review Board Statement
Informed Consent Statement
Data Availability Statement
Acknowledgments
Conflicts of Interest
Abbreviations
References
- Heid, H.W.; Keenan, T.W. Intracellular origin and secretion of milk fat globules. Eur. J. Cell Biol. 2005, 84, 245–258. [Google Scholar] [CrossRef] [PubMed]
- Lopez, C.; Briard-Bion, V.; Menard, O.; Rousseau, F.; Pradel, P.; Besle, J.M. Phospholipid, sphingolipid, and fatty acid compositions of the milk fat globule membrane are modified by diet. J. Agric. Food Chem. 2008, 56, 5226–5236. [Google Scholar] [CrossRef] [PubMed]
- Gallier, S.; Gragson, D.; Cabral, C.; Jimenez-Flores, R.; Everett, D.W. Composition and fatty acid distribution of bovine milk phospholipids from processed milk products. J. Agric. Food Chem. 2010, 58, 10503–10511. [Google Scholar] [CrossRef] [PubMed] [Green Version]
- Lopez, C.; Menard, O. Human milk fat globules: Polar lipid composition and in situ structural investigations revealing the heterogeneous distribution of proteins and the lateral segregation of sphingomyelin in the biological membrane. Colloids Surf. B Biointerfaces 2011, 83, 29–41. [Google Scholar] [CrossRef] [PubMed]
- Lonnerdal, B. Infant formula and infant nutrition: Bioactive proteins of human milk and implications for composition of infant formulas. Am. J. Clin. Nutr. 2014, 99, 712S–717S. [Google Scholar] [CrossRef] [Green Version]
- Delplanque, B.; Gibson, R.; Koletzko, B.; Lapillonne, A.; Strandvik, B. Lipid quality in infant nutrition: Current knowledge and future opportunities. J. Pediatr. Gastroenterol. Nutr. 2015, 61, 8–17. [Google Scholar] [CrossRef] [Green Version]
- Garcia, C.; Lutz, N.W.; Confort-Gouny, S.; Cozzone, P.J.; Armand, M.; Bernard, M. Phospholipid fingerprints of milk from different mammalians determined by 31P NMR: Towards specific interest in human health. Food Chem. 2012, 135, 1777–1783. [Google Scholar] [CrossRef] [Green Version]
- Russo, M.; Cichello, F.; Ragonese, C.; Donato, P.; Cacciola, F.; Dugo, P.; Mondello, L. Profiling and quantifying polar lipids in milk by hydrophilic interaction liquid chromatography coupled with evaporative light-scattering and mass spectrometry detection. Anal. Bioanal. Chem. 2013, 405, 4617–4626. [Google Scholar] [CrossRef]
- Billeaud, C.; Puccio, G.; Saliba, E.; Guillois, B.; Vaysse, C.; Pecquet, S.; Steenhout, P. Safety and tolerance evaluation of milk fat globule membrane-enriched infant formulas: A randomized controlled multicenter non-inferiority trial in healthy term infants. Clin. Med. Insights Pediatr. 2014, 8, 51–60. [Google Scholar] [CrossRef] [Green Version]
- Timby, N.; Hernell, O.; Vaarala, O.; Melin, M.; Lönnerdal, B.; Domellöf, M. Infections in infants fed formula supplemented with bovine milk fat globule membranes. J. Pediatr. Gastroenterol. Nutr. 2015, 60, 384–389. [Google Scholar] [CrossRef]
- Timby, N.; Domellof, E.; Hernell, O.; Lonnerdal, B.; Domellof, M. Neurodevelopment, nutrition, and growth until 12 mo of age in infants fed a low-energy, low-protein formula supplemented with bovine milk fat globule membranes: A randomized controlled trial. Am. J. Clin. Nutr. 2014, 99, 860–868. [Google Scholar] [CrossRef] [Green Version]
- Li, F.; Wu, S.S.; Berseth, C.L.; Harris, C.L.; Richards, J.D.; Wampler, J.L.; Zhuang, W.; Cleghorn, G.; Rudolph, C.D.; Liu, B.; et al. Improved neurodevelopmental outcomes associated with bovine milk fat globule membrane and lactoferrin in infant formula: A randomized, controlled trial. J. Pediatr. 2019, 215, 24–31. [Google Scholar] [CrossRef]
- Li, X.; Peng, Y.; Li, Z.; Christensen, B.; Heckmann, A.B.; Stenlund, H.; Lönnerdal, B.; Hernell, O. Feeding infants formula with probiotics or milk fat globule membrane: A double-blind, randomized controlled trial. Front. Pediatr. 2019, 7, 347. [Google Scholar] [CrossRef] [PubMed]
- Gurnida, D.A.; Rowan, A.M.; Idjradinata, P.; Muchtadi, D.; Sekarwana, N. Association of complex lipids containing gangliosides with cognitive development of 6-month-old infants. Early Hum. Dev. 2012, 88, 595–601. [Google Scholar] [CrossRef]
- Veereman-Wauters, G.; Staelens, S.; Rombaut, R.; Dewettinck, K.; Deboutte, D.; Brummer, R.J.; Boone, M.; Le Ruyet, P. Milk fat globule membrane (INPULSE) enriched formula milk decreases febrile episodes and may improve behavioral regulation in young children. Nutrition 2012, 28, 749–752. [Google Scholar] [CrossRef] [PubMed]
- Zavaleta, N.; Kvistgaard, A.S.; Graverholt, G.; Respicio, G.; Guija, H.; Valencia, N.; Lonnerdal, B. Efficacy of an MFGM-enriched complementary food in diarrhea, anemia, and micronutrient status in infants. J. Pediatr. Gastroenterol. Nutr. 2011, 53, 561–568. [Google Scholar] [CrossRef]
- EFSA NDA Panel (EFSA Panel on Dietetic Products, Nutrition and Allergies). Scientific opinion on the essential composition of infant and follow-on formulae. EFSA J. 2014, 12, 3760. [Google Scholar] [CrossRef] [Green Version]
- Koletzko, B.; Baker, S.; Cleghorn, G.; Neto, U.F.; Gopalan, S.; Hernell, O.; Hock, Q.S.; Jirapinyo, P.; Lonnerdal, B.; Pencharz, P.; et al. Global standard for the composition of infant formula: Recommendations of an ESPGHAN coordinated international expert group. J. Pediatr. Gastroenterol. Nutr. 2005, 41, 584–599. [Google Scholar] [CrossRef] [PubMed] [Green Version]
- Trabulsi, J.; Capeding, R.; Lebumfacil, J.; Ramanujam, K.; Feng, P.; McSweeney, S.; Harris, B.; DeRusso, P. Effect of an α-lactalbumin-enriched infant formula with lower protein on growth. Eur. J. Clin. Nutr. 2011, 65, 167–174. [Google Scholar] [CrossRef] [Green Version]
- Totzauer, M.; Luque, V.; Escribano, J.; Closa-Monasterolo, R.; Verduci, E.; ReDionigi, A.; Hoyos, J.; Langhendries, J.P.; Gruszfeld, D.; Socha, P.; et al. Effect of lower versus higher protein content in infant formula through the first year on body composition from 1 to 6 Years: Follow-up of a randomized clinical trial. Obesity 2018, 26, 1203–1210. [Google Scholar] [CrossRef] [PubMed]
- Alexander, D.D.; Yan, J.; Bylsma, L.C.; Northington, R.S.; Grathwohl, D.; Steenhout, P.; Erdmann, P.; Spivey-Krobath, E.; Haschke, F. Growth of infants consuming whey-predominant term infant formulas with a protein content of 1.8 g/100 kcal: A multicenter pooled analysis of individual participant data. Am. J. Clin. Nutr. 2016, 104, 1083–1092. [Google Scholar] [CrossRef] [PubMed] [Green Version]
- Åkeson, P.M.K.; Axelsson, I.E.M.; Räihä, N.C.R. Growth and nutrient intake in three- to twelve-month-old infants fed human milk or formulas with varying protein concentrations. J. Pediatr. Gastroenterol. Nutr. 1998, 26, 1–8. [Google Scholar] [CrossRef] [PubMed]
- Koletzko, B.; von Kries, R.; Closa, R.; Escribano, J.; Scaglioni, S.; Giovannini, M.; Beyer, J.; Demmelmair, H.; Gruszfeld, D.; Dobrzanska, A.; et al. Lower protein in infant formula is associated with lower weight up to age 2 y: A randomized clinical trial. Am. J. Clin. Nutr. 2009, 89, 1836–1845. [Google Scholar] [CrossRef] [PubMed] [Green Version]
- Koletzko, B.; Demmelmair, H.; Grote, V.; Totzauer, M. Optimized protein intakes in term infants support physiological growth and promote long-term health. Semin. Perinatol. 2019, 43, 151153. [Google Scholar] [CrossRef]
- Kouwenhoven, S.M.P.; Antl, N.; Finken, M.J.J.; Twisk, J.W.R.; van der Beek, E.M.; Abrahamse-Berkeveld, M.; van de Heijning, B.J.M.; Schierbeek, H.; Holdt, L.M.; van Goudoever, J.B.; et al. A modified low-protein infant formula supports adequate growth in healthy, term infants: A randomized, double-blind, equivalence trial. Am. J. Clin. Nutr. 2020, 111, 962–974. [Google Scholar] [CrossRef]
- Institute of Medicine (IOM). Dietary Reference Intakes for vitamin A, Vitamin K, Arsenic, Boron, Chromium, Copper, Iodine, Iron, Manganese, Molybdenum, Nickel, Silicon, Vanadium, and Zinc; The National Academies Press: Washington, DC, USA, 2001; p. 800. [Google Scholar] [CrossRef] [Green Version]
- Baker, R.D.; Greer, F.R. Clinical Report—Diagnosis and prevention of iron deficiency and iron-deficiency anemia in infants and young children (0–3 years of age). Pediatrics 2010, 126, 1040–1050. [Google Scholar] [CrossRef] [PubMed] [Green Version]
- Raiten, D.J.; Talbot, J.M.; Waters, J.H. LSRO Report: Assessment of nutrient requirements for infant formulas. J. Nutr. 1998, 128, 2059S–2237S. [Google Scholar]
- Hernell, O.; Fewtrell, M.S.; Georgieff, M.K.; Krebs, N.F.; Lonnerdal, B. Summary of current recommendations on iron provision and monitoring of iron status for breastfed and formula-fed infants in resource-rich and resource-constrained countries. J. Pediatr. 2015, 167, S40–S47. [Google Scholar] [CrossRef]
- Birch, E.E.; Hoffman, D.R.; Uauy, R.; Birch, D.G.; Prestidge, C. Visual acuity and the essentiality of docosahexaenoic acid and arachidonic acid in the diet of term infants. Pediatr. Res. 1998, 44, 201–209. [Google Scholar] [CrossRef] [Green Version]
- Birch, E.E.; Garfield, S.; Hoffman, D.R.; Uauy, R.; Birch, D.G. A randomized controlled trial of early dietary supply of long-chain polyunsaturated fatty acids and mental development in term infants. Dev. Med. Child Neurol. 2000, 42, 174–181. [Google Scholar] [CrossRef]
- Birch, E.E.; Hoffman, D.R.; Castañeda, Y.S.; Fawcett, S.L.; Birch, D.G.; Uauy, R.D. A randomized controlled trial of long-chain polyunsaturated fatty acid supplementation of formula in term infants after weaning at 6 wk of age. Am. J. Clin. Nutr. 2002, 75, 570–580. [Google Scholar] [CrossRef] [Green Version]
- Hoffman, D.R.; Birch, E.E.; Castañeda, Y.S.; Fawcett, S.L.; Wheaton, D.H.; Birch, D.G.; Uauy, R. Visual function in breast-fed term infants weaned to formula with or without long-chain polyunsaturates at 4 to 6 months: A randomized clinical trial. J. Pediatr. 2003, 142, 669–677. [Google Scholar] [CrossRef] [PubMed]
- Birch, E.E.; Castaneda, Y.S.; Wheaton, D.H.; Birch, D.G.; Uauy, R.D.; Hoffman, D.R. Visual maturation of term infants fed long-chain polyunsaturated fatty acid-supplemented or control formula for 12 mo. Am. J. Clin. Nutr. 2005, 81, 871–879. [Google Scholar] [CrossRef] [Green Version]
- Brenna, J.T.; Varamini, B.; Jensen, R.G.; Diersen-Schade, D.A.; Boettcher, J.A.; Arterburn, L.M. Docosahexaenoic and arachidonic acid concentrations in human breast milk worldwide. Am. J. Clin. Nutr. 2007, 85, 1457–1464. [Google Scholar] [CrossRef] [Green Version]
- Johnston, W.H.; Ashley, C.; Yeiser, M.; Harris, C.L.; Stolz, S.I.; Wampler, J.L.; Wittke, A.; Cooper, T.R. Growth and tolerance of formula with lactoferrin in infants through one year of age: Double-blind, randomized, controlled trial. BMC Pediatr. 2015, 15, 173. [Google Scholar] [CrossRef] [PubMed] [Green Version]
- Ashley, C.; Johnston, W.H.; Harris, C.L.; Stolz, S.I.; Wampler, J.L.; Berseth, C.L. Growth and tolerance of infants fed formula supplemented with polydextrose (PDX) and/or galactooligosaccharides (GOS): Double-blind, randomized, controlled trial. Nutr. J. 2012, 11, 38. [Google Scholar] [CrossRef] [PubMed] [Green Version]
- Hoffman, D.R.; Harris, C.L.; Wampler, J.L.; Patterson, A.C.; Berseth, C.L. Growth, tolerance, and DHA and ARA status of healthy term infants receiving formula with two different ARA concentrations: Double-blind, randomized, controlled trial. Prostaglandins Leukot. Essent. Fat. Acids 2019, 146, 19–27. [Google Scholar] [CrossRef] [Green Version]
- US Food and Drug Administration. Title 21 Food and Drugs §106 Infant Formula Requirements Pertaining to Current Good Manufacturing Practice, Quality Control Procedures, Quality Factors, Recordsand Reports, and Notifications; US Congress: Silver Spring, MD, USA, 2014. Available online: https://ecfr.federalregister.gov/current/title-21/chapter-I/subchapter-B/part-106 (accessed on 12 December 2021).
- US Food and Drug Administration. Title 21 Food and Drugs §107 Infant Formula: General Provisions, Labeling, Exempt Infant Formulas, Nutrient Requirements, and Infant Formula Recalls; US Congress: Silver Spring, MD, USA, 1985. Available online: https://ecfr.federalregister.gov/current/title-21/chapter-I/subchapter-B/part-107 (accessed on 12 December 2021).
- Food and Agriculture Organization of the United Nations. World Health Organization. CXS 72-1981 Standard for infant formula and formulas for special medical purposes intended for infants. In Codex Alimentarius International Food Standards; Food and Agriculture Organization of the United Nations: Rome, Italy; World Health Organization: Geneva, Switzerland, 2007; pp. 1–18. [Google Scholar]
- European Union Commission. Commission Delegated Regulation (EU) 2016/127 of 25 September 2015 supplementing Regulation (EU) No. 609/2013 of the European Parliament and of the Council as regards the specific compositional and information requirements for infant formula and follow-on formula and as regards requirements on information relating to infant and young child feeding. O. J. 2016, 59, 1–29. [Google Scholar]
- AAP Task Force on Clinical Testing of Infant Formulas, Committee on Nutrition (Finberg, L.; Bell, E.F.; Cooke, R.J.; Fomon, S.J.; Kleinman, R.E.; Pencharz, P.B.; Reynolds, J.W.; Schanler, R.J.; Forbes, A.L.). Report: Clinical Testing of Infant Formulas with Respect to Nutritional Suitability for Term Infants; U.S. Food and Drug Administration: Silver Spring, MD, USA; Center for Food Safety and Applied Nutrition: College Park, MD, USA, 1988; pp. 1–16. Available online: https://wayback.archive-it.org/7993/20170722090324/https://www.fda.gov/Food/GuidanceRegulation/GuidanceDocumentsRegulatoryInformation/InfantFormula/ucm170649.htm (accessed on 12 December 2021).
- Fontecha, J.; Brink, L.; Wu, S.; Pouliot, Y.; Visioli, F.; Jimenez-Flores, R. Sources, production, and clinical treatments of milk fat globule membrane for infant nutrition and well-being. Nutrients 2020, 12, 1607. [Google Scholar] [CrossRef] [PubMed]
- Centers for Disease Control and Prevention (CDC) and Centers for Medicare & Medicaid Services (CMS), US Dept of Health and Human Services (HHS). Medicare, Medicaid and CLIA Programs; Regulations Implementing the Clinical Laboratory Improvement Amendments of 1988 (CLIA). Fed. Regist. 1992, 57, 7002–7186. [Google Scholar]
- Centers for Medicare & Medicaid Services. How to Obtain a CLIA Certificate; Centers for Medicare & Medicaid Services: Baltimore, MD, USA, 2019. [Google Scholar]
- World Health Organization. WHO Child Growth Standards: Length/Height-for-Age, Weight-for-Age, Weight-for-Length, Weight-for-Height and Body Mass Index-for-Age: Methods and Development; World Health Organization: Geneva, Switzerland, 2006; pp. 1–312. [Google Scholar]
- Tanaka, K.; Hosozawa, M.; Kudo, N.; Yoshikawa, N.; Hisata, K.; Shoji, H.; Shinohara, K.; Shimizu, T. The pilot study: Sphingomyelin-fortified milk has a positive association with the neurobehavioural development of very low birth weight infants during infancy, randomized control trial. Brain Dev. 2013, 35, 45–52. [Google Scholar] [CrossRef] [PubMed]
- Lönnerdal, B.; Chen, C.L. Effects of formula protein level and ratio on infant growth, plasma amino acids and serum trace elements. I. Cow’s milk formula. Acta Paediatr. Scand. 1990, 79, 257–265. [Google Scholar] [CrossRef]
- Bradley, C.K.; Hillman, L.; Sherman, A.R.; Leedy, D.; Cordano, A. Evaluation of two iron-fortified, milk-based formulas during infancy. Pediatrics 1993, 91, 908–914. [Google Scholar] [CrossRef] [PubMed]
- European Commission. Infant formulae and follow-on formulae and amending Directive 1999/21/EC. 2006. Regulation (EC) No 2006/141. O. J. 2006, 49, 1–33. [Google Scholar]
- Committee on Nutrition. Iron fortification of infant formulas. Pediatrics 1999, 104, 119–123. [Google Scholar] [CrossRef] [Green Version]
- Scientific Committee on Food. Report of the Scientific Committee on Food on the Revision of Essential Requirements of Infant Formulae and Follow-On Formulae (Adopted on 4 April 2003); European Commission: Brussels, Belgium, 2003. [Google Scholar]
- Koletzko, B.; Bhutta, Z.A.; Cai, W.; Cruchet, S.; El Guindi, M.; Fuchs, G.J.; Goddard, E.A.; van Goudoever, J.B.; Quak, S.H.; Kulkarni, B.; et al. Compositional requirements of follow-up formula for use in infancy: Recommendations of an international expert group coordinated by the Early Nutrition Academy. Ann. Nutr. Metab. 2013, 62, 44–54. [Google Scholar] [CrossRef] [PubMed] [Green Version]


| Nutrient | Study Formula (Target Values) | |
|---|---|---|
| Control | INV-MFGM | |
| Total Protein, g † | 2.1 | 1.9 |
| Total Fat, g ‡ | 5.3 | 5.3 |
| ARA, mg ‡ | 34 | 25 |
| DHA, mg ‡ | 17 | 17 |
| Total Carbohydrate, g § | 11.2 | 11.4 |
| Vitamin A, IU | 300 | 300 |
| Vitamin D, IU | 60 | 60 |
| Vitamin E, IU | 2 | 2 |
| Vitamin K, mcg | 9 | 9 |
| Thiamin, mcg | 80 | 80 |
| Riboflavin, mcg | 140 | 140 |
| Vitamin B6, mcg | 60 | 60 |
| Vitamin B12, mcg | 0.3 | 0.3 |
| Niacin, mcg | 1000 | 1000 |
| Folic Acid, mcg | 16 | 16 |
| Pantothenic Acid, mcg | 500 | 500 |
| Biotin, mcg | 3 | 3 |
| Vitamin C, mg | 12 | 12 |
| Choline, mg | 24 | 24 |
| Inositol, mg | 6 | 6 |
| Calcium, mg | 78 | 78 |
| Phosphorus, mg | 43 | 43 |
| Magnesium, mg | 8 | 8 |
| Iron, mg | 1.8 | 1.2 |
| Zinc, mg | 1 | 1 |
| Manganese, mcg | 15 | 15 |
| Copper, mcg | 75 | 75 |
| Iodine, mcg | 15 | 15 |
| Selenium, mcg | 2.8 | 2.8 |
| Sodium, mg | 27 | 27 |
| Potassium, mg | 108 | 108 |
| Chloride, mg | 63 | 63 |
| Infant Characteristic | Study Group | p | |
|---|---|---|---|
| Control | INV-MFGM | ||
| Sex, n (%) a | 1.000 | ||
| Female | 81 (43) | 78 (43) | |
| Male | 109 (57) | 104 (57) | |
| Race, n (%) a | 0.371 | ||
| White | 156 (83) | 142 (78) | |
| Black | 20 (11) | 20 (11) | |
| Other | 13 (7) | 20 (11) | |
| Ethnicity, n (%) a | 1.000 | ||
| Hispanic | 13 (7) | 12 (7) | |
| Not Hispanic | 177 (93) | 170 (93) | |
| Birth anthropometrics b | Study Group, n | mean ± SE | p |
| Weight (g) | Control, 190 | 3374.3 ± 30.3 | 0.655 |
| INV-MFGM, 182 | 3393.5 ± 31.0 | ||
| Length (cm) | Control, 188 | 50.9 ± 0.2 | 0.676 |
| INV-MFGM, 182 | 50.8 ± 0.2 | ||
| Head circumference (cm) | Control, 185 | 34.3 ± 0.1 | 0.884 |
| INV-MFGM, 181 | 34.3 ± 0.1 | ||
| Anthropometrics at Study Entry b | Study Group, n | mean ± SE | p |
| males | |||
| Weight (g) | Control, 109 | 3550.6 ± 38.5 | 0.187 |
| MFGM-10, 104 | 3623.6 ± 39.4 | ||
| Length (cm) | Control, 109 | 51.7 ± 0.2 | 0.595 |
| MFGM-10, 104 | 51.9 ± 0.2 | ||
| Head circumference (cm) | Control, 109 | 36.1 ± 0.1 | 0.947 |
| MFGM-10, 104 | 36.1 ± 0.1 | ||
| females | |||
| Weight (g) | Control, 81 | 3526.4 ± 43.2 | 0.233 |
| INV-MFGM, 77 | 3452.2 ± 44.3 | ||
| Length (cm) | Control, 81 | 51.3 ± 0.2 | 0.729 |
| INV-MFGM, 78 | 51.2 ± 0.2 | ||
| Head circumference (cm) | Control, 81 | 35.6 ± 0.1 | 0.625 |
| INV-MFGM, 78 | 35.5 ± 0.1 | ||
| Day | Study | Weight b | Length c | Head Circumference c | ||||||
|---|---|---|---|---|---|---|---|---|---|---|
| Group | n | g/day | p | n | cm/day | p | n | cm/day | p | |
| males | ||||||||||
| 30 | Control | 104 | 40.0 ± 1.1 | 0.115 | 103 | 0.13 ± 0.007 | 0.644 | 103 | 0.09 ± 0.003 | 0.955 |
| INV-MFGM | 101 | 38.2 ± 1.1 | 101 | 0.13 ± 0.007 | 101 | 0.09 ± 0.003 | ||||
| 42 | Control | 98 | 39.0 ± 0.9 | 0.137 | 98 | 0.12 ± 0.005 | 0.321 | 98 | 0.09 ± 0.002 | 0.55 |
| INV-MFGM | 96 | 37.5 ± 0.9 | 96 | 0.13 ± 0.005 | 96 | 0.08 ± 0.002 | ||||
| 60 | Control | 96 | 36.5 ± 0.9 | 0.191 | 96 | 0.12 ± 0.003 | 0.869 | 96 | 0.07 ± 0.002 | 0.965 |
| INV-MFGM | 92 | 35.4 ± 0.9 | 92 | 0.12 ± 0.003 | 92 | 0.07 ± 0.002 | ||||
| 90 | Control | 91 | 33.1 ± 0.8 | 0.245 | 91 | 0.12 ± 0.002 | 0.268 | 91 | 0.06 ± 0.001 | 0.602 |
| INV-MFGM | 85 | 32.3 ± 0.8 | 84 | 0.11 ± 0.002 | 84 | 0.06 ± 0.001 | ||||
| 120 | Control | 86 | 30.5 ± 0.7 | 0.271 | 86 | 0.11 ± 0.002 | 0.53 | 86 | 0.05 ± 0.001 | 0.596 |
| INV-MFGM | 81 | 29.9 ± 0.7 | 81 | 0.11 ± 0.002 | 81 | 0.06 ± 0.001 | ||||
| females | ||||||||||
| 30 | Control | 70 | 31.7 ± 1.3 | 0.723 | 70 | 0.12 ± 0.008 | 0.699 | 70 | 0.08 ± 0.004 | 0.432 |
| INV-MFGM | 71 | 32.7 ± 1.3 | 72 | 0.12 ± 0.008 | 72 | 0.08 ± 0.004 | ||||
| 42 | Control | 68 | 31.0 ± 1.1 | 0.551 | 68 | 0.12 ± 0.005 | 0.675 | 68 | 0.08 ± 0.003 | 0.215 |
| INV-MFGM | 69 | 31.2 ± 1.1 | 70 | 0.12 ± 0.005 | 70 | 0.07 ± 0.003 | ||||
| 60 | Control | 66 | 29.2 ± 1.0 | 0.452 | 66 | 0.11 ± 0.003 | 0.868 | 66 | 0.06 ± 0.002 | 0.334 |
| INV-MFGM | 66 | 29.0 ± 1.0 | 67 | 0.11 ± 0.003 | 67 | 0.07 ± 0.002 | ||||
| 90 | Control | 64 | 27.1 ± 0.8 | 0.309 | 64 | 0.10 ± 0.002 | 0.534 | 64 | 0.06 ± 0.001 | 0.863 |
| INV-MFGM | 65 | 26.5 ± 0.8 | 66 | 0.11 ± 0.002 | 66 | 0.06 ± 0.001 | ||||
| 120 | Control | 62 | 25.5 ± 0.7 | 0.343 | 61 | 0.10 ± 0.002 | 0.834 | 61 | 0.05 ± 0.001 | 0.813 |
| INV-MFGM | 64 | 25.1 ± 0.7 | 65 | 0.10 ± 0.002 | 65 | 0.05 ± 0.001 | ||||
| Age (Days) | Male | Female | |||||||
|---|---|---|---|---|---|---|---|---|---|
| Study Group | n | Mean | (s.e.) | p | n | Mean | (s.e.) | p | |
| 30 | Control | 97 | 30.1 | (0.9) | 0.331 | 70 | 27.5 | (1.0) | 0.777 |
| INV-MFGM | 97 | 28.8 | (0.9) | 70 | 27.9 | (1.0) | |||
| 42 | Control | 96 | 32.2 | (0.9) | 0.999 | 68 | 29.7 | (0.8) | 0.431 |
| INV-MFGM | 92 | 32.2 | (0.9) | 68 | 28.8 | (0.8) | |||
| 60 | Control | 92 | 34.8 | (1.0) | 0.951 | 63 | 31.8 | (0.8) | 0.131 |
| INV-MFGM | 90 | 34.9 | (1.0) | 67 | 30.1 | (0.8) | |||
| 90 | Control | 87 | 38.4 | (1.1) | 0.849 | 61 | 34.5 | (1.1) | 0.647 |
| INV-MFGM | 83 | 38.7 | (1.1) | 66 | 33.8 | (1.0) | |||
| 120 | Control | 85 | 40.6 | (1.3) | 0.345 | 58 | 36.4 | (1.0) | 0.348 |
| INV-MFGM | 79 | 38.9 | (1.3) | 65 | 35.1 | (1.0) | |||
| 180 | Control | 84 | 39.2 | (1.2) | 0.932 | 61 | 38.2 | (1.2) | 0.269 |
| INV-MFGM | 74 | 39.1 | (1.3) | 63 | 36.4 | (1.2) | |||
| 275 | Control | 83 | 36.8 | (1.1) | 0.856 | 59 | 33.6 | (1.5) | 0.167 |
| INV-MFGM | 74 | 37.1 | (1.2) | 62 | 36.5 | (1.4) | |||
| 365 | Control | 76 | 30.0 | (1.2) | 0.533 | 55 | 31.2 | (1.6) | 0.487 |
| INV-MFGM | 67 | 28.9 | (1.3) | 55 | 29.6 | (1.6) | |||
| Stool Frequency a | Stool Consistency, n (%) b | |||||||||
|---|---|---|---|---|---|---|---|---|---|---|
| Day | Group | n | Mean ± SE | p | Hard | Formed | Soft | Unformed or Seedy | Watery | p |
| 14 | Control | 190 | 3.3 ± 0.2 | 0.182 | 2 (1) | 5 (3) | 86 (46) | 93 (49) | 2 (1) | 0.249 |
| INV-MFGM | 182 | 3.7 ± 0.2 | 1 (1) | 4 (2) | 74 (41) | 97 (54) | 3 (2) | |||
| 30 | Control | 166 | 2.9 ± 0.1 | 0.416 | 0 (0) | 1 (1) | 67 (41) | 88 (54) | 8 (5) | 0.926 |
| INV-MFGM | 167 | 2.7 ± 0.1 | 1 (1) | 1 (1) | 62 (38) | 93 (57) | 7 (4) | |||
| 42 | Control | 162 | 2.4 ± 0.1 | 0.303 | 1 (1) | 0 (0) | 68 (43) | 84 (53) | 7 (4) | 0.308 |
| INV-MFGM | 159 | 2.2 ± 0.1 | 2 (1) | 4 (3) | 66 (44) | 68 (46) | 9 (6) | |||
| 60 | Control | 154 | 2.1 ± 0.1 | 0.986 | 0 (0) | 3 (2) | 80 (53) | 62 (41) | 7 (5) | 0.221 |
| INV-MFGM | 153 | 2.1 ± 0.1 | 0 (0) | 1 (1) | 71 (47) | 70 (47) | 8 (5) | |||
| 90 | Control | 146 | 2.3 ± 0.1 | 0.804 | 0 (0) | 4 (3) | 77 (55) | 56 (40) | 3 (2) | 0.004 * |
| INV-MFGM | 147 | 2.2 ± 0.1 | 0 (0) | 1 (1) | 63 (44) | 69 (48) | 11 (8) | |||
| 120 | Control | 139 | 2.2 ± 0.1 | 0.843 | 1 (1) | 4 (3) | 81 (57) | 50 (35) | 5 (4) | 0.094 |
| INV-MFGM | 143 | 2.1 ± 0.1 | 2 (1) | 0 (0) | 71 (50) | 61 (43) | 8 (6) | |||
| 180 | Control | 144 | 2.5 ± 0.1 | 0.104 | 1 (1) | 8 (6) | 105 (72) | 30 (21) | 1 (1) | 0.053 |
| INV-MFGM | 136 | 2.2 ± 0.1 | 1 (1) | 6 (5) | 86 (65) | 31 (23) | 8 (6) | |||
| 275 | Control | 142 | 2.3 ± 0.1 | 0.997 | 1 (1) | 24 (17) | 95 (68) | 16 (11) | 4 (3) | 0.991 |
| INV-MFGM | 136 | 2.3 ± 0.1 | 0 (0) | 23 (17) | 91 (69) | 15 (11) | 3 (2) | |||
| 365 | Control | 131 | 2.1 ± 0.1 | 0.333 | 5 (4) | 32 (25) | 80 (62) | 6 (5) | 6 (5) | 0.411 |
| INV-MFGM | 120 | 2.3 ± 0.1 | 3 (3) | 25 (21) | 74 (62) | 16 (13) | 1 (1) | |||
| Concentration a | Relative to Laboratory References, n (%) b | Relative to 2010 AAP Guidelines c, n (%) | ||||||||||
|---|---|---|---|---|---|---|---|---|---|---|---|---|
| Study Group | n | Median | IQR | p | Below | Within | Above | p | Hb < 11.0 g/dL d | Hb ≥ 11.0 g/dL | p | |
| Hemoglobin, g/dL | Control | 141 | 12.1 | 11.5–12.6 | 0.275 | 14 (10) | 124 (88) | 3 (2) | 0.703 | 13 (9) | 128 (91) | 0.433 |
| INV-MFGM | 127 | 12.0 | 11.3–12.4 | 10 (8) | 115 (91) | 2 (2) | 16 (13) | 111 (87) | ||||
| Hematocrit, % | Control | 141 | 35.9 | 34.2–37.7 | 0.262 | 15 (11) | 122 (87) | 4 (3) | 0.389 | |||
| INV-MFGM | 126 | 35.5 | 33.9–37.1 | 11 (9) | 109 (87) | 6 (5) | ||||||
| Serum Ferritin, μg/L | Control | 129 | 50.0 | 32.3–65.0 | 0.048 * | 4 (3) | 109 (84) | 16 (12) | 0.472 | |||
| INV-MFGM | 114 | 42.0 | 28.8–59.0 | 2 (2) | 104 (90) | 9 (8) | ||||||
| C-reactive Protein Relative to Laboratory References a | Study Group, n (%) | p | |
|---|---|---|---|
| Control | INV-MFGM | ||
| Not Above | 128 (95) | 113 (92) | 0.342 |
| Above | 7 (5) | 10 (8) | |
Publisher’s Note: MDPI stays neutral with regard to jurisdictional claims in published maps and institutional affiliations. |
© 2021 by the authors. Licensee MDPI, Basel, Switzerland. This article is an open access article distributed under the terms and conditions of the Creative Commons Attribution (CC BY) license (https://creativecommons.org/licenses/by/4.0/).
Share and Cite
Hedrick, J.; Yeiser, M.; Harris, C.L.; Wampler, J.L.; London, H.E.; Patterson, A.C.; Wu, S.S. Infant Formula with Added Bovine Milk Fat Globule Membrane and Modified Iron Supports Growth and Normal Iron Status at One Year of Age: A Randomized Controlled Trial. Nutrients 2021, 13, 4541. https://doi.org/10.3390/nu13124541
Hedrick J, Yeiser M, Harris CL, Wampler JL, London HE, Patterson AC, Wu SS. Infant Formula with Added Bovine Milk Fat Globule Membrane and Modified Iron Supports Growth and Normal Iron Status at One Year of Age: A Randomized Controlled Trial. Nutrients. 2021; 13(12):4541. https://doi.org/10.3390/nu13124541
Chicago/Turabian StyleHedrick, James, Michael Yeiser, Cheryl L. Harris, Jennifer L. Wampler, Hila Elisha London, Ashley C. Patterson, and Steven S. Wu. 2021. "Infant Formula with Added Bovine Milk Fat Globule Membrane and Modified Iron Supports Growth and Normal Iron Status at One Year of Age: A Randomized Controlled Trial" Nutrients 13, no. 12: 4541. https://doi.org/10.3390/nu13124541
APA StyleHedrick, J., Yeiser, M., Harris, C. L., Wampler, J. L., London, H. E., Patterson, A. C., & Wu, S. S. (2021). Infant Formula with Added Bovine Milk Fat Globule Membrane and Modified Iron Supports Growth and Normal Iron Status at One Year of Age: A Randomized Controlled Trial. Nutrients, 13(12), 4541. https://doi.org/10.3390/nu13124541