Exploring the Association between Urine Caffeine Metabolites and Urine Flow Rate: A Cross-Sectional Study


Abstract
1. Introduction
2. Materials and Methods
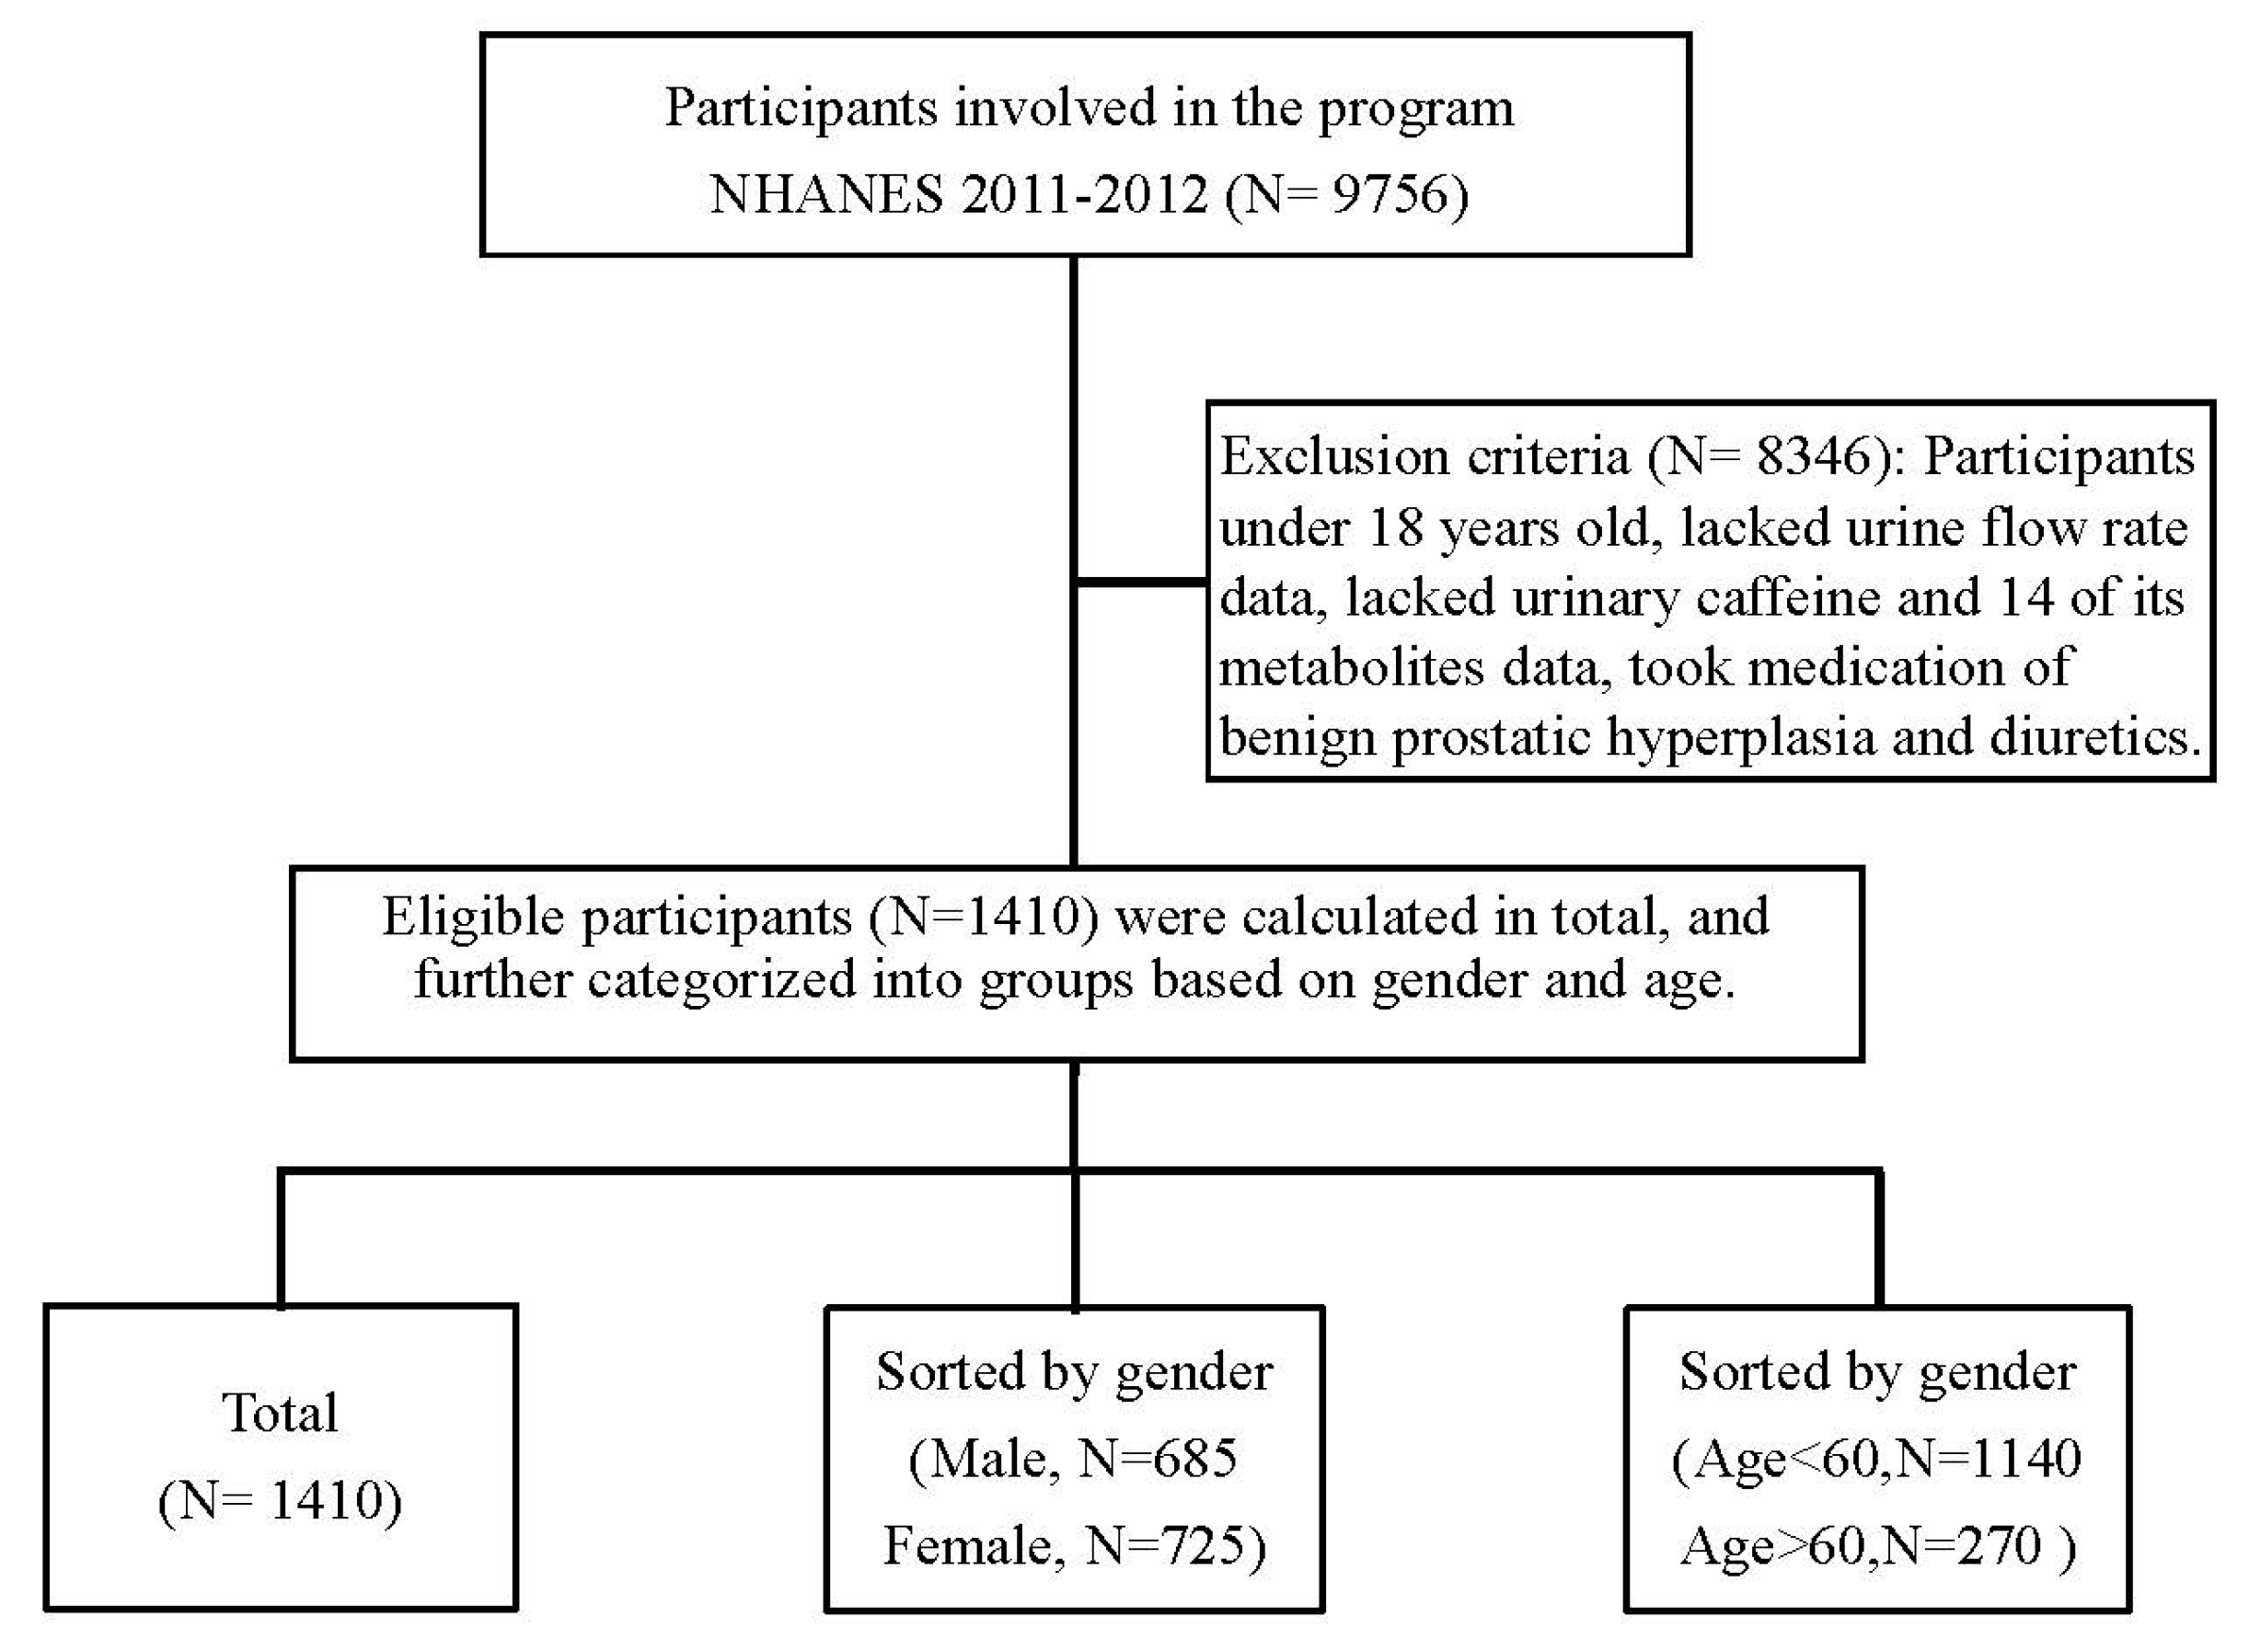
2.1. Design and Participants
2.2. Measurement of Caffeine Metabolites in Urine
2.3. Measurement of Urine Flow Rate
2.4. Covariates
2.5. Statistical Analysis
3. Results
3.1. Characteristics of the Study Population
3.2. Urinary Caffeine Metabolite Concentrations and Urine Flow Rate
4. Discussion
5. Conclusions
Author Contributions
Funding
Conflicts of Interest
Appendix A

| Variables | Model 1 β(95% CI) | p Value | Model 2 β(95% CI) | p Value | Model 3 β(95% CI) | p Value | Model 4 β(95% CI) | p Value |
|---|---|---|---|---|---|---|---|---|
| 1-methyluric acid | 0.041 | 0.008 | 0.049 | 0.001 | 0.050 | 0.001 | 0.032 | 0.072 |
| (0.011, 0.070) | (0.019, 0.079) | (0.020, 0.080) | (−0.003, 0.066) | |||||
| 3-methyluric acid | −1.087 | 0.307 | 0.096 | 0.930 | 0.826 | 0.073 | 1.281 | 0.399 |
| (−3.174, 1.000) | (−2.045, 2.236) | (−0.244, 3.027) | (−1.698, 2.282) | |||||
| 7-methyluric acid | −0.002 | 0.968 | 0.061 | 0.287 | 0.072 | 0.215 | 0.025 | 0.670 |
| (−0.112, 0.228) | (−0.052, 0.260) | (−0.042, 0.271) | (−2.157, 0.192) | |||||
| 1,3-dimethyluric acid | 0.006 | 0.851 | 0.015 | 0.626 | 0.014 | 0.630 | 0.008 | 0.783 |
| (−0.064, 0.065) | (−0.045, 0.074) | (−0.046, 0.073) | (−0.051, 0.067) | |||||
| 1,7-dimethyluric acid | 0.097 | 0.008 | 0.136 | <0.001 | 0.137 | <0.001 | 0.088 | 0.031 |
| (0.025, 0.169) | (0.064, 0.209) | (0.064, 0.209) | (0.008, 0.167) | |||||
| 3,7-dimethyluric acid | 0.561 | 0.557 | 1.367 | 0.154 | 1.323 | 0.169 | 0.714 | 0.462 |
| (−1.314, 2.435) | (−0.515, 3.249) | (−0.561, 3.207) | (−1.191, 2.618) | |||||
| 1,3,7-trimethyluric acid | 2.345 | <0.001 | 2.759 | <0.001 | 2.770 | <0.001 | 2.373 | <0.001 |
| (1.405, 3.285) | (1.819, 3.698) | (1.832, 3.709) | (1.383, 3.363) | |||||
| 1-methylxanthine | 0.124 | <0.001 | 0.131 | <0.001 | 0.127 | <0.001 | 0.101 | 0.002 |
| (0.067, 0.180) | (0.075, 0.187) | (0.071, 0.184) | (0.037, 0.166) | |||||
| 3-methylxanthine | 0.022 | 0.526 | 0.064 | 0.071 | 0.063 | 0.073 | 0.038 | 0.280 |
| (−0.043, 0.090) | (−0.005, 0.132) | (−0.006, 0.132) | (−0.016, 0.108) | |||||
| 7-methylxanthine | 0.037 | 0.125 | 0.052 | 0.028 | 0.050 | 0.037 | 0.032 | 0.189 |
| (−0.010, 0.083) | (0.006, 0.099) | (0.003, 0.097) | (0.010, 0.081) | |||||
| 1,3-dimethylxanthine (theophylline) | 0.897 | <0.001 | 1.004 | <0.001 | 0.986 | <0.001 | 0.896 | 0.002 |
| (0.494, 1.300) | (0.604, 1.405) | (0.586, 1.387) | (0.496, 1.296) | |||||
| 1,7-dimethylxanthine (paraxanthine) | 0.538 | <0.001 | 0.565 | <0.001 | 0.558 | <0.001 | 0.552 | <0.001 |
| (0.446, 0.631) | (0.473, 0.656) | (0.466, 0.650) | (0.454, 0.650) | |||||
| 3,7-dimethylxanthine (theobromine) | 0.358 | <0.001 | 0.409 | <0.001 | 0.403 | <0.001 | 0.382 | <0.001 |
| (0.271, 0.445) | (0.323, 0.496) | (0.316, 0.490) | (0.295, 0.469) | |||||
| 1,3,7-trimethylxanthine (caffeine) | 1.079 | <0.001 | 1.153 | <0.001 | 1.153 | <0.001 | 1.097 | <0.001 |
| (0.910, 1.248) | (0.985, 1.321) | (0.985, 1.321) | (0.924, 1.270) | |||||
| 5-acetylamino-6-amino-3-methyluracil | 0.036 | 0.031 | 0.046 | 0.006 | 0.045 | 0.006 | 0.024 | 0.213 |
| (0.003, 0.068) | (0.013, 0.078) | (0.013, 0.078) | (−0.014, 0.061) |
References
- Nehlig, A.; Daval, J.L.; Debry, G. Caffeine and the central nervous system: Mechanisms of action, biochemical, metabolic and psychostimulant effects. Brain Res. Brain Res. Rev. 1992, 17, 139–170. [Google Scholar] [CrossRef]
- Sattin, A.; Rall, T.W. The effect of adenosine and adenine nucleotides on the cyclic adenosine 3′, 5′-phosphate content of guinea pig cerebral cortex slices. Mol. Pharmacol. 1970, 6, 13–23. [Google Scholar]
- Huang, Z.-L.; Qu, W.-M.; Eguchi, N.; Chen, J.-F.; Schwarzschild, M.A.; Fredholm, B.B.; Urade, Y.; Hayaishi, O. Adenosine A 2A, but not A 1, receptors mediate the arousal effect of caffeine. Nat. Neurosci. 2005, 8, 858–859. [Google Scholar] [CrossRef]
- Shi, D.; Nikodijević, O.; Jacobson, K.A.; Daly, J.W. Chronic caffeine alters the density of adenosine, adrenergic, cholinergic, GABA, and serotonin receptors and calcium channels in mouse brain. Cell. Mol. Neurobiol. 1993, 13, 247–261. [Google Scholar] [CrossRef] [PubMed]
- Nawrot, P.; Jordan, S.; Eastwood, J.; Rotstein, J.; Hugenholtz, A.; Feeley, M. Effects of caffeine on human health. Food Addiv. Contam. 2003, 20, 1–30. [Google Scholar] [CrossRef] [PubMed]
- Pelchovitz, D.J.; Goldberger, J.J. Caffeine and cardiac arrhythmias: A review of the evidence. Am. J. Med. 2011, 124, 284–289. [Google Scholar] [CrossRef] [PubMed]
- Rieg, T.; Steigele, H.; Schnermann, J.; Richter, K.; Osswald, H.; Vallon, V. Requirement of intact adenosine A1 receptors for the diuretic and natriuretic action of the methylxanthines theophylline and caffeine. J. Pharmacol. Exp. Ther. 2005, 313, 403–409. [Google Scholar] [CrossRef] [PubMed]
- Ogawa, N.; Ueki, H.J.P.; Neurosciences, C. Clinical importance of caffeine dependence and abuse. Psychiatry Clin. Neurosci. 2007, 61, 263–268. [Google Scholar] [CrossRef]
- Roehrs, T.; Roth, T. Caffeine: Sleep and daytime sleepiness. Sleep Med. Rev. 2008, 12, 153–162. [Google Scholar] [CrossRef]
- Angelucci, M.E.; Vital, M.A.; Cesário, C.; Zadusky, C.R.; Rosalen, P.L.; Da Cunha, C. The effect of caffeine in animal models of learning and memory. Eur. J. Pharmacol. 1999, 373, 135–140. [Google Scholar] [CrossRef]
- Kalow, W.; Tang, B.K. Use of caffeine metabolite ratios to explore CYP1A2 and xanthine oxidase activities. Clin. Pharmacol. Ther. 1991, 50, 508–519. [Google Scholar] [CrossRef] [PubMed]
- Butler, M.; Lang, N.; Young, J.; Caporaso, N.; Vineis, P.; Hayes, R.; Teitel, C.; Massengill, J.; Lawsen, M.; Kadlubar, F.J.P. Determination of CYP1A2 and NAT2 phenotypes in human populations by analysis of caffeine urinary metabolites. Pharmacogenetics 1992, 2, 116–127. [Google Scholar] [CrossRef] [PubMed]
- Fujimaki, M.; Saiki, S.; Li, Y.; Kaga, N.; Taka, H.; Hatano, T.; Ishikawa, K.-I.; Oji, Y.; Mori, A.; Okuzumi, A.J.N. Serum caffeine and metabolites are reliable biomarkers of early Parkinson disease. Neurology 2018, 90, e404–e411. [Google Scholar] [CrossRef] [PubMed]
- Benowitz, N.L. Clinical pharmacology of caffeine. Ann. Rev. Med. 1990, 41, 277–288. [Google Scholar] [CrossRef] [PubMed]
- Faber, M.S.; Jetter, A.; Fuhr, U. Assessment of CYP1A2 activity in clinical practice: Why, how, and when? Basic Clin. Pharmacol. Toxicol. 2005, 97, 125–134. [Google Scholar] [CrossRef]
- Birkett, D.; Dahlqvist, R.; Miners, J.; Lelo, A.; Billing, B. Comparison of theophylline and theobromine metabolism in man. Drug Metab. Dispos. 1985, 13, 725–728. [Google Scholar]
- Levy, G.; Koysooko, R. Renal clearance of theophylline in man. J. Clin. Pharmacol. 1976, 16, 329–332. [Google Scholar] [CrossRef]
- Tang-Liu, D.; Williams, R.; Riegelman, S. Disposition of caffeine and its metabolites in man. J. Pharmacol. Exp. Ther. 1983, 224, 180–185. [Google Scholar]
- Roebuck, J. When does old age begin?: The evolution of the English definition. J. Soc. Hist. 1979, 12, 416–428. [Google Scholar] [CrossRef]
- United Nations. Department of Economic; Affairs, S. World Population Ageing, 1950-2050; United Nations Publications: New York, NY, USA, 2002. [Google Scholar]
- St-Pierre, M.V.; Spino, M.; Isles, A.F.; Tesoro, A.; MacLeod, S.M. Temporal variation in the disposition of theophylline and its metabolites. Clin. Pharmacol. Ther. 1985, 38, 89–95. [Google Scholar] [CrossRef]
- Bonnacker, I.; Berdel, D.; Süverkrüp, R.; Berg, A.V. Renal clearance of theophylline and its major metabolites: Age and urine flow dependency in paediatric patients. Eur. J. Clin. Pharmacol. 1989, 36, 145–150. [Google Scholar] [CrossRef]
- Agbaba, D.; Pokrajac, M.; Varagić, V.M.; Pešić, V. Dependence of the renal excretion of theophylline on its plasma concentrations and urine flow rate in asthmatic children. J. Pharm. Pharmacol. 1990, 42, 827–830. [Google Scholar] [CrossRef] [PubMed]
- Tang-Liu, D.D.-S.; Tozer, T.N.; Riegelman, S. Dependence of renal clearance on urine flow: A mathematical model and its application. J. Pharm. Sci. 1983, 72, 154–158. [Google Scholar] [CrossRef]
- Tang-Liu, D.D.-S.; Tozer, T.N.; Riegelman, S. Urine flow-dependence of theophylline renal clearance in man. J. Pharmacokinet. Biopharm. 1982, 10, 351–364. [Google Scholar] [CrossRef] [PubMed]
- Trang, J.M.; Blanchard, J.; Conrad, K.A.; Harrison, G.G. Relationship between total body clearance of caffeine and urine flow rate in elderly men. Biopharm. Drug Dispos. 1985, 6, 51–56. [Google Scholar] [CrossRef]
- Blanchard, J.; Sawers, S.J.A. Relationship between urine flow rate and renal clearance of caffeine in man. J. Clin. Pharmacol. 1983, 23, 134–138. [Google Scholar] [CrossRef]
- Sinués, B.; Sáenz, M.A.; Lanuza, J.; Bernal, M.L.; Fanlo, A.; Juste, J.L.; Mayayo, E. Five caffeine metabolite ratios to measure tobacco-induced CYP1A2 activity and their relationships with urinary mutagenicity and urine flow. Cancer Epidemiol. Prev. Biomark. 1999, 8, 159–166. [Google Scholar]
- Sinués, B.; Fanlo, A.; Bernal, M.L.; Mayayo, E.; Soriano, M.A.; Martínez-Ballarin, E. Influence of the urine flow rate on some caffeine metabolite ratios used to assess CYP1A2 activity. Ther. Drug Monit. 2002, 24, 715–721. [Google Scholar] [CrossRef]
- Kalow, W.; Tang, B.K. Caffeine as a metabolic probe: Exploration of the enzyme-inducing effect of cigarette smoking. Clin. Pharmacol. Ther. 1991, 49, 44–48. [Google Scholar] [CrossRef]
- George, J.; Murphy, T.; Roberts, R.; Cooksley, W.G.; Halliday, J.W.; Powell, L.W. Influence of alcohol and caffeine consumption on caffeine elimination. Clin. Exp. Pharmacol. Physiol. 1986, 13, 731–736. [Google Scholar] [CrossRef]
- Carrillo, J.A.; Benitez, J. Clinically significant pharmacokinetic interactions between dietary caffeine and medications. Clin. Pharmacokinet. 2000, 39, 127–153. [Google Scholar] [CrossRef] [PubMed]
- Relling, M.V.; Lin, J.S.; Ayers, G.D.; Evans, W.E. Racial and gender differences in N-acetyltransferase, xanthine oxidase, and CYP1A2 activities. Clin. Pharmacol. Ther. 1992, 52, 643–658. [Google Scholar] [CrossRef] [PubMed]
- Tracy, T.S.; Venkataramanan, R.; Glover, D.D.; Caritis, S.N. Temporal changes in drug metabolism (CYP1A2, CYP2D6 and CYP3A Activity) during pregnancy. Am. J. Obstet. Gynecol. 2005, 192, 633–639. [Google Scholar] [CrossRef] [PubMed]
- Haylen, B.T.; Ashby, D.; Sutherst, J.R.; Frazer, M.I.; West, C.R. Maximum and average urine flow rates in normal male and female populations--the Liverpool nomograms. Br. J. Urol. 1989, 64, 30–38. [Google Scholar] [CrossRef]

| Variables | Median (IQR) or Percent (%) |
|---|---|
| Continuous variables | |
| Age (years) | 47.70 ± 17.79 |
| BMI (kg/m2) | 28.89 ± 6.85 |
| Aspartate aminotransferase (AST)(U/L) | 25.54 ± 14.01 |
| urine creatinine (mg/dL) | 0.89 ± 0.29 |
| serum fasting glucose (mg/dL) | 102.92 ± 41.51 |
| 1-methyluric acid (umol/L) | 0.91 ± 1.19 |
| 3-methyluric acid (umol/L) | 0.01 ± 0.02 |
| 7-methyluric acid (umol/L) | 0.22 ± 0.34 |
| 1,3-dimethyluric acid (umol/L) | 0.11 ± 0.26 |
| 1,7-dimethyluric acid (umol/L) | 0.42 ± 0.49 |
| 3,7-dimethyluric acid (umol/L) | 0.01 ± 0.02 |
| 1,3,7-trimethyluric acid (umol/L) | 0.03 ± 0.03 |
| 1-methylxanthine (umol/L) | 0.48 ± 0.68 |
| 3-methylxanthine (umol/L) | 0.42 ± 0.61 |
| 7-methylxanthine (umol/L) | 0.67 ± 0.92 |
| 1,3-dimethylxanthine (theophylline) (umol/L) | 0.03 ± 0.07 |
| 1,7-dimethylxanthine (paraxanthine) (umol/L) | 0.29 ± 0.40 |
| 3,7-dimethylxanthine (theobromine) (umol/L) | 0.28 ± 0.44 |
| 1,3,7-trimethylxanthine (caffeine) (umol/L) | 0.09 ± 0.18 |
| 5-acetylamino-6-amino-3-methyluracil (uM/L) | 0.96 ± 1.25 |
| Caffeine intake on the exam day (mg) | 142.74 ± 192.73 |
| Total plain water drank the day before exam (mg) | 1130.95 ± 1213.59 |
| Categorical variables | |
| Gender | |
| Male | 49.8 |
| Female | 50.2 |
| Race | |
| Mexican American | 9.5 |
| Other Hispanic | 10.5 |
| Non-Hispanic White | 36.9 |
| Non-Hispanic Black | 26.8 |
| Other Race—including Multi-Racial | 16.4 |
| Heart disease—ever had a diagnosis | |
| Congestive heart failure | 3.5 |
| Coronary heart disease | 4 |
| Angina | 2.6 |
| Heart attack | 3.8 |
| Smoking | 43.5 |
| Variables | Model 1 β(95% CI) | p Value | Model 2 β(95% CI) | p Value | Model 3 β(95% CI) | p Value | Model 4 β(95% CI) | p Value |
|---|---|---|---|---|---|---|---|---|
| 1-methyluric acid | 0.072 | <0.001 | 0.074 | <0.001 | 0.083 | <0.001 | 0.055 | 0.015 |
| (0.035, 0.110) | (0.037, 0.112) | (0.045, 0.121) | (0.011, 0.099) | |||||
| 3-methyluric acid | 1.472 | 0.310 | 2.048 | 0.163 | 2.651 | 0.073 | 1.281 | 0.399 |
| (−1.373, 4.318) | (−0.833, 4.930) | (−0.244, 5.546) | (−1.698, 4.260) | |||||
| 7-methyluric acid | 0.083 | 0.260 | 0.114 | 0.126 | 0.125 | 0.092 | 0.042 | 0.582 |
| (−0.061, 0.228) | (−0.032, 0.260) | (−0.021, 0.271) | (−0.108, 0.192) | |||||
| 1,3-dimethyluric acid | 0.048 | 0.565 | 0.046 | 0.585 | 0.055 | 0.510 | −0.012 | 0.885 |
| (−0.116, 0.213) | (−0.118, 0.210) | (−0.109, 0.219) | (−0.177, 0.153) | |||||
| 1,7-dimethyluric acid | 0.108 | 0.020 | 0.135 | 0.005 | 0.147 | 0.002 | 0.054 | 0.322 |
| (0.017, 0.200) | (0.041, 0.228) | (0.053, 0.240) | (−0.053, 0.161) | |||||
| 3,7-dimethyluric acid | 2.291 | 0.052 | 2.825 | 0.016 | 2.720 | 0.02 | 1.802 | 0.126 |
| (−0.022, 4.604) | (0.527, 5.123) | (0.427, 5.013) | (−0.507, 4.110) | |||||
| 1,3,7-trimethyluric acid | 1.936 | 0.005 | 2.400 | 0.001 | 2.637 | <0.001 | 1.508 | 0.046 |
| (0.598, 3.274) | (1.049, 3.751) | (1.287, 3.988) | (0.029, 2.987) | |||||
| 1-methylxanthine | 0.164 | <0.001 | 0.170 | <0.001 | 0.170 | <0.001 | 0.130 | 0.001 |
| (0.100, 0.229) | (0.105, 0.234) | (0.105, 0.235) | (0.056, 0.204) | |||||
| 3-methylxanthine | 0.098 | 0.024 | 0.125 | 0.004 | 0.120 | 0.006 | 0.078 | 0.081 |
| (0.013, 0.183) | (0.040, 0.211) | (0.035, 0.206) | (−0.010, 0.165) | |||||
| 7-methylxanthine | 0.080 | 0.002 | 0.091 | <0.001 | 0.087 | 0.001 | 0.063 | 0.019 |
| (0.029, 0.131) | (0.040, 0.141) | (0.035, 0.138) | (0.010, 0.115) | |||||
| 1,3-dimethylxanthine (theophylline) | 1.146 | <0.001 | 1.187 | <0.001 | 1.173 | <0.001 | 0.941 | 0.002 |
| (0.549, 1.743) | (0.594, 1.780) | (0.579, 1.766) | (0.343, 1.540) | |||||
| 1,7-dimethylxanthine (paraxanthine) | 0.590 | <0.001 | 0.607 | <0.001 | 0.609 | <0.001 | 0.607 | <0.001 |
| (0.483, 0.697) | (0.500, 0.713) | (0.502, 0.717) | (0.488, 0.725) | |||||
| 3,7-dimethylxanthine (theobromine) | 0.368 | <0.001 | 0.398 | <0.001 | 0.386 | <0.001 | 0.347 | <0.001 |
| (0.256, 0.479) | (0.287, 0.509) | (0.275, 0.498) | (0.235, 0.459) | |||||
| 1,3,7-trimethylxanthine (caffeine) | 1.091 | <0.001 | 1.177 | <0.001 | 1.186 | <0.001 | 1.097 | <0.001 |
| (0.855, 1.327) | (0.942, 1.413) | (0.950, 1.422) | (0.845, 1.348) | |||||
| 5-acetylamino-6-amino-3-methyluracil | 0.061 | 0.001 | 0.064 | 0.001 | 0.065 | <0.001 | 0.029 | 0.188 |
| (0.025, 0.097) | (0.028, 0.100) | (0.029, 0.102) | (−0.014, 0.073) |
| Variables | Male | Female | |||||||
|---|---|---|---|---|---|---|---|---|---|
| Model 1 | Model 2 | Model 3 | Model 4 | Model 1 | Model 2 | Model 3 | Model 4 | ||
| 1-methyluric acid | β(95% CI) | 0.094 (0.046, 0.142) | 0.099 (0.050, 0.148) | 0.110 (0.061, 0.159) | 0.089 (0.028,0.149) | 0.051 (−0.006,0.108) | 0.050 (−0.007,0.108) | 0.053 (−0.006,0.111) | 0.026 (−0.039,0.091) |
| p value | <0.001 | <0.001 | <0.001 | 0.004 | 0.078 | 0.087 | 0.078 | 0.436 | |
| 3-methyluric acid | β(95% CI) | 2.721 (−0.861,6.303) | 2.878 (−0.771,6.526) | 3.305 (−0.353,6.962) | 2.007 (−1.785,5.798) | 1.262 (−3.159,5.683) | 1.089 (−3.441,5.620) | 1.492 (−3.083,6.067) | −0.043 (−4.770,4.685) |
| p value | 0.136 | 0.122 | 0.077 | 0.299 | 0.575 | 0.637 | 0.522 | 0.986 | |
| 7-methyluric acid | β(95% CI) | 0.203 (−0.005,0.412) | 0.214 (0.002,0.426) | 0.231 (0.020,0.443) | 0.130 (−0.094,0.354) | 0.052 (−0.147,0.252) | 0.045 (−0.158,0.249) | 0.043 (−0.160,0.246) | −0.024 (−0.236,0.187) |
| p value | 0.056 | 0.048 | 0.032 | 0.256 | 0.607 | 0.661 | 0.677 | 0.823 | |
| 1,3-dimethyluric acid | β(95% CI) | 0.012 (−0.145,0.170) | 0.013 (−0.145,0.171) | 0.021 (−0.136,0.179) | 0.015 (−0.173,0.142) | 0.433 (−0.175,1.042) | 0.428 (−0.195,1.052) | 0.468 (−0.160,1.096) | 0.039 (−0.679,0.758) |
| p value | 0.876 | 0.869 | 0.789 | 0.847 | 0.163 | 0.178 | 0.144 | 0.915 | |
| 1,7-dimethyluric acid | β(95% CI) | 0.254 (0.129,0.378) | 0.271 (0.143,0.400) | 0.281 (0.153,0.409) | 0.205 (0.051,0.359) | 0.032 (−0.100,0.163) | 0.027 (−0.108,0.162) | 0.032 (−0.103,0.167) | −0.061 (−0.212,0.091) |
| p value | <0.001 | <0.001 | <0.001 | 0.009 | 0.637 | 0.695 | 0.644 | 0.433 | |
| 3,7-dimethyluric acid | β(95% CI) | 3.537 (0.185,6.889) | 3.551 (0.192,6.910) | 3.487 (0.139,6.836) | 2.580 (−0.812,5.973) | 2.357 (−0.829,5.542) | 2.377 (−0.814,5.568) | 2.123 (−1.061,5.308) | 1.214 (−2.026,4.453) |
| p value | 0.039 | 0.038 | 0.041 | 0.136 | 0.147 | 0.144 | 0.191 | 0.462 | |
| 1,3,7-trimethyluric acid | β(95% CI) | 3.807 (1.895,5.720) | 4.005 (2.046,5.965) | 4.325 (2.365,6.284) | 3.194 (0.958,5.431) | 1.367 (−0.496,3.229) | 1.340 (−0.542,3.222) | 1.439 (−0.445,3.323) | 0.431 (−1.559,2.482) |
| p value | <0.001 | <0.001 | <0.001 | 0.005 | 0.150 | 0.162 | 0.134 | 0.654 | |
| 1-methylxanthine | β(95% CI) | 0.218 (0.133,0.303) | 0.221 (0.135,0.306) | 0.223 (0.137,0.309) | 0.190 (0.088,0.292) | 0.125 (0.030,0.221) | 0.125 (0.029,0.221) | 0.119 (0.022,0.217) | 0.088 (−0.018,0.194) |
| p value | <0.001 | <0.001 | <0.001 | <0.001 | 0.010 | 0.011 | 0.017 | 0.103 | |
| 3-methylxanthine | β(95% CI) | 0.169 (0.048,0.290) | 0.173 (0.051,0.295) | 0.170 (0.051,0.295) | 0.123 (−0.002,0.249) | 0.093 (−0.026,0.213) | 0.092 (−0.029,0.212) | 0.081 (−0.040,0.202) | 0.042 (−0.082,0.167) |
| p value | 0.006 | 0.006 | 0.007 | 0.054 | 0.126 | 0.135 | 0.191 | 0.503 | |
| 7-methylxanthine | β (95% CI) | 0.129 (0.052,0.205) | 0.129 (0.052,0.206) | 0.129 (0.052,0.207) | 0.101 (0.021,0.182) | 0.068 (0.000,0.137) | 0.069 (0.000,0.137) | 0.060 (−0.009,0.130) | 0.043 (−0.029,0.115) |
| p value | 0.001 | 0.001 | 0.001 | 0.013 | 0.050 | 0.050 | 0.088 | 0.238 | |
| 1,3-dimethylxanthine (theophylline) | β(95% CI) | 0.515 (−0.072,1.101) | 0.519 (−0.070,1.109) | 0.530 (−0.057,1.118) | 0.403 (−0.182,0.988) | 5.657 (3.490,7.373) | 5.696 (3.967,7.425) | 5.681 (3.922,7.440) | 5.309 (3.376,7.242) |
| p value | 0.085 | 0.084 | 0.077 | 0.177 | <0.001 | <0.001 | <0.001 | <0.001 | |
| 1,7-dimethylxanthine (paraxanthine) | β(95% CI) | 0.596 (0.460,0.732) | 0.607 (0.470,0.744) | 0.602 (0.465,0.740) | 0.607 (0.453, 0.760) | 0.609 (0.446,0.773) | 0.609 (0.445,0.774) | 0.610 (0.442,0.777) | 0.605 (0.421,0.789) |
| p value | <0.001 | <0.001 | <0.001 | <0.001 | <0.001 | <0.001 | <0.001 | <0.001 | |
| 3,7-dimethylxanthine (theobromine) | β(95% CI) | 0.436 (0.279,0.593) | 0.439 (0.282,0.597) | 0.425 (0.267,0.583) | 0.409 (0.249,0.568) | 0.370 (0.213,0.527) | 0.371 (0.214,0.529) | 0.356 (0.198,0.514) | 0.308 (0.147,0.468) |
| p value | <0.001 | <0.001 | <0.001 | <0.001 | <0.001 | <0.001 | <0.001 | <0.001 | |
| 1,3,7-trimethylxanthine (caffeine) | β(95% CI) | 1.496 (1.136,1.856) | 1.526 (1.163,1.890) | 1.514 (1.152,1.876) | 1.429 (1.033,1.826) | 0.983 (0.670,1.297) | 0.989 (0.672,1.306) | 0.988 (0.670,1.307) | 0.890 (0.552,1.227) |
| p value | <0.001 | <0.001 | <0.001 | <0.001 | <0.001 | <0.001 | <0.001 | <0.001 | |
| 5-acetylamino-6-amino-3-methyluracil | β(95% CI) | 0.094 (0.051,0.138) | 0.098 (0.054,0.143) | 0.097 (0.052,0.141) | 0.074 (0.019,0.129) | 0.023 (−0.034,0.080) | 0.022 (−0.037,0.080) | 0.023 (−0.037,0.082) | −0.025 (−0.095,0.044) |
| p value | <0.001 | <0.001 | <0.001 | 0.008 | 0.429 | 0.468 | 0.454 | 0.472 | |
| Variables | Age <60 | Age ≥ 60 | |||||||
|---|---|---|---|---|---|---|---|---|---|
| Model 1 | Model 2 | Model 3 | Model 4 | Model 1 | Model 2 | Model 3 | Model 4 | ||
| 1-methyluric acid | β(95% CI) | 0.102 (0.0538, 0.146) | 0.098 (0.053, 0.142) | 0.103 (0.058, 0.148) | 0.076 (0.025,0.127) | 0.004 (−0.068,0.075) | 0.001 (−0.070,0.072) | 0.006 (−0.066,0.079) | −0.003 (−0.126,0.060) |
| p value | <0.001 | <0.001 | <0.001 | 0.004 | 0.920 | 0.987 | 0.861 | 0.483 | |
| 3-methyluric acid | β(95% CI) | 3.936 (0.409,7.462) | 3.833 (0.299,7.368) | 4.190 (0.641,7.740) | 2.595 (−1.129,6.318) | −2.656 (−7.598,2.286) | −1.480 (−6.431,3.471) | −1.003 (−6.017,4.011) | −1.733 (−7.035,3.569) |
| p value | 0.029 | 0.034 | 0.021 | 0.172 | 0.291 | 0.557 | 0.694 | 0.521 | |
| 7-methyluric acid | β(95% CI) | 0.212 (0.033,0.391) | 0.212 (0.033,0.391) | 0.214 (0.035,0.394) | 0.130 (−0.057,0.011) | −0.134 (−0.384,0.115) | −0.063 (−0.313,0.187) | −0.065 (−0.315,0.185) | −0.156 (−0.423,0.112) |
| p value | 0.021 | 0.021 | 0.019 | 0.172 | 0.290 | 0.619 | 0.609 | 0.253 | |
| 1,3-dimethyluric acid | β(95% CI) | 0.912 (0.428,1.395) | 0.894 (0.401,1.387) | 0.943 (0.447,1.438) | 0.546 (−0.022,1.114) | −0.056 (−0.233,0.121) | −0.080 (−0.256,0.095) | −0.086 (−0.261,0.089) | −0.100 (−0.276,0.077) |
| p value | <0.001 | 0.001 | <0.001 | 0.059 | 0.536 | 0.369 | 0.333 | 0.268 | |
| 1,7-dimethyluric acid | β(95% CI) | 0.220 (0.104,0.337) | 0.224 (0.105,0.344) | 0.229 (0.110,0.349) | 0.132 (−0.003,0.267) | −0.056 (−0.206,0.095) | −0.045 (−0.196,0.106) | −0.044 (−0.196,0.109) | −0.124 (−0.305,0.057) |
| p value | <0.001 | <0.001 | <0.001 | 0.056 | 0.466 | 0.554 | 0.572 | 0.179 | |
| 3,7-dimethyluric acid | β(95% CI) | 2.883 (0.280,5.485) | 3.333 (0.754,5.912) | 3.317 (0.736,5.897) | 2.314 (−0.299,4.926) | −0.044 (−5.104,5.015) | −0.319 (−4.697,5.335) | −0.350 (−5.344,4.644) | −1.263 (−6.403,3.877) |
| p value | 0.030 | 0.011 | 0.012 | 0.083 | 0.986 | 0.900 | 0.890 | 0.629 | |
| 1,3,7-trimethyluric acid | β(95% CI) | 2.977 (1.365,4.589) | 3.220 (1.587,4.853) | 3.366 (1.729,5.002) | 2.180 (0.420,3.939) | −0.146 (−2.565,2.273) | −0.058 (−2.482,2.366) | 0.294 (−2.149,2.737) | −0.487 (−3.270,2.297) |
| p value | <0.001 | <0.001 | <0.001 | 0.015 | 0.906 | 0.962 | 0.813 | 0.731 | |
| 1-methylxanthine | β(95% CI) | 0.164 (0.094,0.233) | 0.160 (0.090,0.229) | 0.164 (0.093,0.235) | 0.122 (0.043,0.201) | 0.162 (−0.012,0.337) | 0.144 (−0.030,0.317) | 0.108 (−0.069,0.285) | 0.068 (−0.146,0.283) |
| p value | <0.001 | <0.001 | <0.001 | 0.002 | 0.068 | 0.105 | 0.232 | 0.531 | |
| 3-methylxanthine | β(95% CI) | 0.142 (0.039,0.244) | 0.159 (0.056,0.262) | 0.159 (0.056,0.263) | 0.105 (−0.001,0.0211) | 0.009 (−0.146,0.164) | 0.036 (−0.118,0.191) | 0.004 (−0.151,0.159) | −0.015 (−0.175,0.145) |
| p value | 0.007 | 0.002 | 0.003 | 0.051 | 0.908 | 0.643 | 0.957 | 0.855 | |
| 7-methylxanthine | β(95% CI) | 0.086 (0.029,0.143) | 0.094 (0.038,0.150) | 0.093 (0.036,0.150) | 0.068 (0.010,0.127) | 0.054 (−0.062,0.170) | 0.066 (−0.049,0.181) | 0.035 (−0.081,0.152) | 0.013 (−0.110,0.135) |
| p value | 0.003 | 0.001 | 0.001 | 0.022 | 0.361 | 0.258 | 0.549 | 0.839 | |
| 1,3-dimethylxanthine (theophylline) | β(95% CI) | 5.900 (4.433,7.367) | 6.267 (4.792,7.742) | 6.401 (4.911,7.891) | 5.823 (4.204,7.442) | 0.283 (−0.378,0.943) | 0.185 (−0.470,0.841) | 0.110 (−0.544,0.764) | 0.059 (−0.602,0.721) |
| p value | <0.001 | <0.001 | <0.001 | <0.001 | 0.401 | 0.578 | 0.741 | 0.860 | |
| 1,7-dimethylxanthine (paraxanthine) | β(95% CI) | 0.618 (0.487,0.749) | 0.627 (0.496,0.759) | 0.640 (0.508,0.773) | 0.613 (0.469,0.757) | 0.536 (0.349,0.724) | 0.513 (0.326,0.700) | 0.479 (0.287,0.671) | 0.532 (0.314,0.750) |
| p value | <0.001 | <0.001 | <0.001 | <0.001 | <0.001 | <0.001 | <0.001 | <0.001 | |
| 3,7-dimethylxanthine (theobromine) | β(95% CI) | 0.376 (0.245,0.507) | 0.407 (0.278,0.537) | 0.405 (0.275,0.536) | 0.358 (0.227,0.488) | 0.340 (0.123,0.557) | 0.344 (0.130,0.559) | 0.289 (0.071,0.507) | 0.260 (0.036,0.484) |
| p value | <0.001 | <0.001 | <0.001 | <0.001 | 0.002 | 0.002 | 0.009 | 0.023 | |
| 1,3,7-trimethylxanthine (caffeine) | β(95% CI) | 1.319 (1.020,1.618) | 1.377 (1.078,1.676) | 1.398 (1.097,1.698) | 1.265 (0.948,1.582) | 0.763 (0.374,1.152) | 0.791 (0.405,1.176) | 0.749 (0.361,1.137) | 0.762 (0.338,1.186) |
| p value | <0.001 | <0.001 | <0.001 | <0.001 | <0.001 | <0.001 | <0.001 | <0.001 | |
| 5-acetylamino-6-amino-3-methyluracil | β(95% CI) | 0.094 (0.048,0.141) | 0.088 (0.040,0.135) | 0.088 (0.040,0.136) | 0.045 (−0.001,0.102) | 0.020 (−0.037,0.077) | 0.018 (−0.039,0.074) | 0.016 (−0.041,0.072) | −0.002 (−0.073,0.068) |
| p value | <0.001 | <0.001 | <0.001 | 0.117 | 0.486 | 0.539 | 0.591 | 0.946 | |
| Study Details | Study Design | Participants | Caffeine Metabolites | Evaluation of Urine Flow Rate | Findings on Urinary Caffeine Metabolites and Urine Flow Rate |
|---|---|---|---|---|---|
| Caffeine | |||||
| Our study | cross-sectional study | N = 1410 | Caffeine and 14 of its metabolites | Average flow rate | Positive correlations were shown between several urinary metabolites and urine flow rate. Men showed more correlation than females, and the young (age < 60) showed more correlation than the elderly (age > 60). |
| Blanchard, J. et al. (1983), Scotland [25] | cross-sectional study | N = 16 | Caffeine | Average flow rate | Positive correlation between the renal clearance of both unbound (CLU) and total (CLR) caffeine and the mean urine flow rate. |
| Trang, J.M. et al. (1985), USA [24] | cross-sectional study | N = 10 | Caffeine | Average flow rate | Positive correlations were observed between total body clearance (CL), renal clearance (CL), and nonrenal clearance (CL) and urine flow rate (UFR) |
| Sinués, B. et al. (1999), Spain [26] | cross-sectional study | N = 125 | 5 urinary caffeine metabolite ratios (MRs) | Average flow rate | MR1, MR3, and MR4 were the most flow-dependent. MR2 was flow-independent. MR5 was less flow-dependent. |
| Sinués, B. et al. (2002), Spain [27] | cross-sectional study | N = 152 | 8 caffeine metabolites and 5 urinary caffeine metabolite ratios (MRs) | Average flow rate | 7 caffeine metabolites were flow-dependent. MR1, MR3, and MR4 were flow-dependent. MR2 and MR5 were flow-independent. |
| Theophylline | |||||
| Our study | cross-sectional study | N = 1410 | Theophylline | Average flow rate | Positive correlations were shown between theophylline and urine flow rate in the female subgroup and the young (age <60) subgroup. |
| Gerhard Levy. et al. (1976), USA [17] | cross-sectional study | N = 6 | Theophylline | Average flow rate | Positive correlation was shown between the renal clearance of theophylline and the urine flow rate. |
| Tang-Liu, D.D.S. et al. (1982), USA [23] | cross-sectional study | N = 14 | Theophylline | Average flow rate | Theophylline renal clearance is highly dependent on urine flow rate and is neither concentration- nor dose-related. |
| St-Pierre, M.V. et al. (1985), USA [19] | cross-sectional study | N = 8 | Theophylline and 3 of its major metabolites | Average flow rate | Renal clearance of metabolites was greater after morning dosing, the time with enhanced urine flow rate. |
| Bonnacker, I. et al. (1989), Germany [20] | cross-sectional study | N = 10 | Theophylline and 3 of its metabolites | Average flow rate | The renal clearance of 1,3-DMU, the main metabolite of theophylline, was found to depend both upon urine flow rate and age. |
| Agbaba, D. et al., (1990), Yugoslavia [21] | cross-sectional study | N = 22 | Theophylline | Average flow rate | The dependence of the renal excretion of theophylline on urine flow rate was found after both IV administration and at steady state. |
© 2020 by the authors. Licensee MDPI, Basel, Switzerland. This article is an open access article distributed under the terms and conditions of the Creative Commons Attribution (CC BY) license (http://creativecommons.org/licenses/by/4.0/).
Share and Cite
Wu, S.E.; Chen, W.-L. Exploring the Association between Urine Caffeine Metabolites and Urine Flow Rate: A Cross-Sectional Study. Nutrients 2020, 12, 2803. https://doi.org/10.3390/nu12092803
Wu SE, Chen W-L. Exploring the Association between Urine Caffeine Metabolites and Urine Flow Rate: A Cross-Sectional Study. Nutrients. 2020; 12(9):2803. https://doi.org/10.3390/nu12092803
Chicago/Turabian StyleWu, Shou En, and Wei-Liang Chen. 2020. "Exploring the Association between Urine Caffeine Metabolites and Urine Flow Rate: A Cross-Sectional Study" Nutrients 12, no. 9: 2803. https://doi.org/10.3390/nu12092803
APA StyleWu, S. E., & Chen, W.-L. (2020). Exploring the Association between Urine Caffeine Metabolites and Urine Flow Rate: A Cross-Sectional Study. Nutrients, 12(9), 2803. https://doi.org/10.3390/nu12092803