Eating Fast Is Associated with Nonalcoholic Fatty Liver Disease in Men But Not in Women with Type 2 Diabetes: A Cross-Sectional Study

 , , ,
, , ,  , ,
, ,  ,
, 
Abstract
1. Introduction
2. Methods
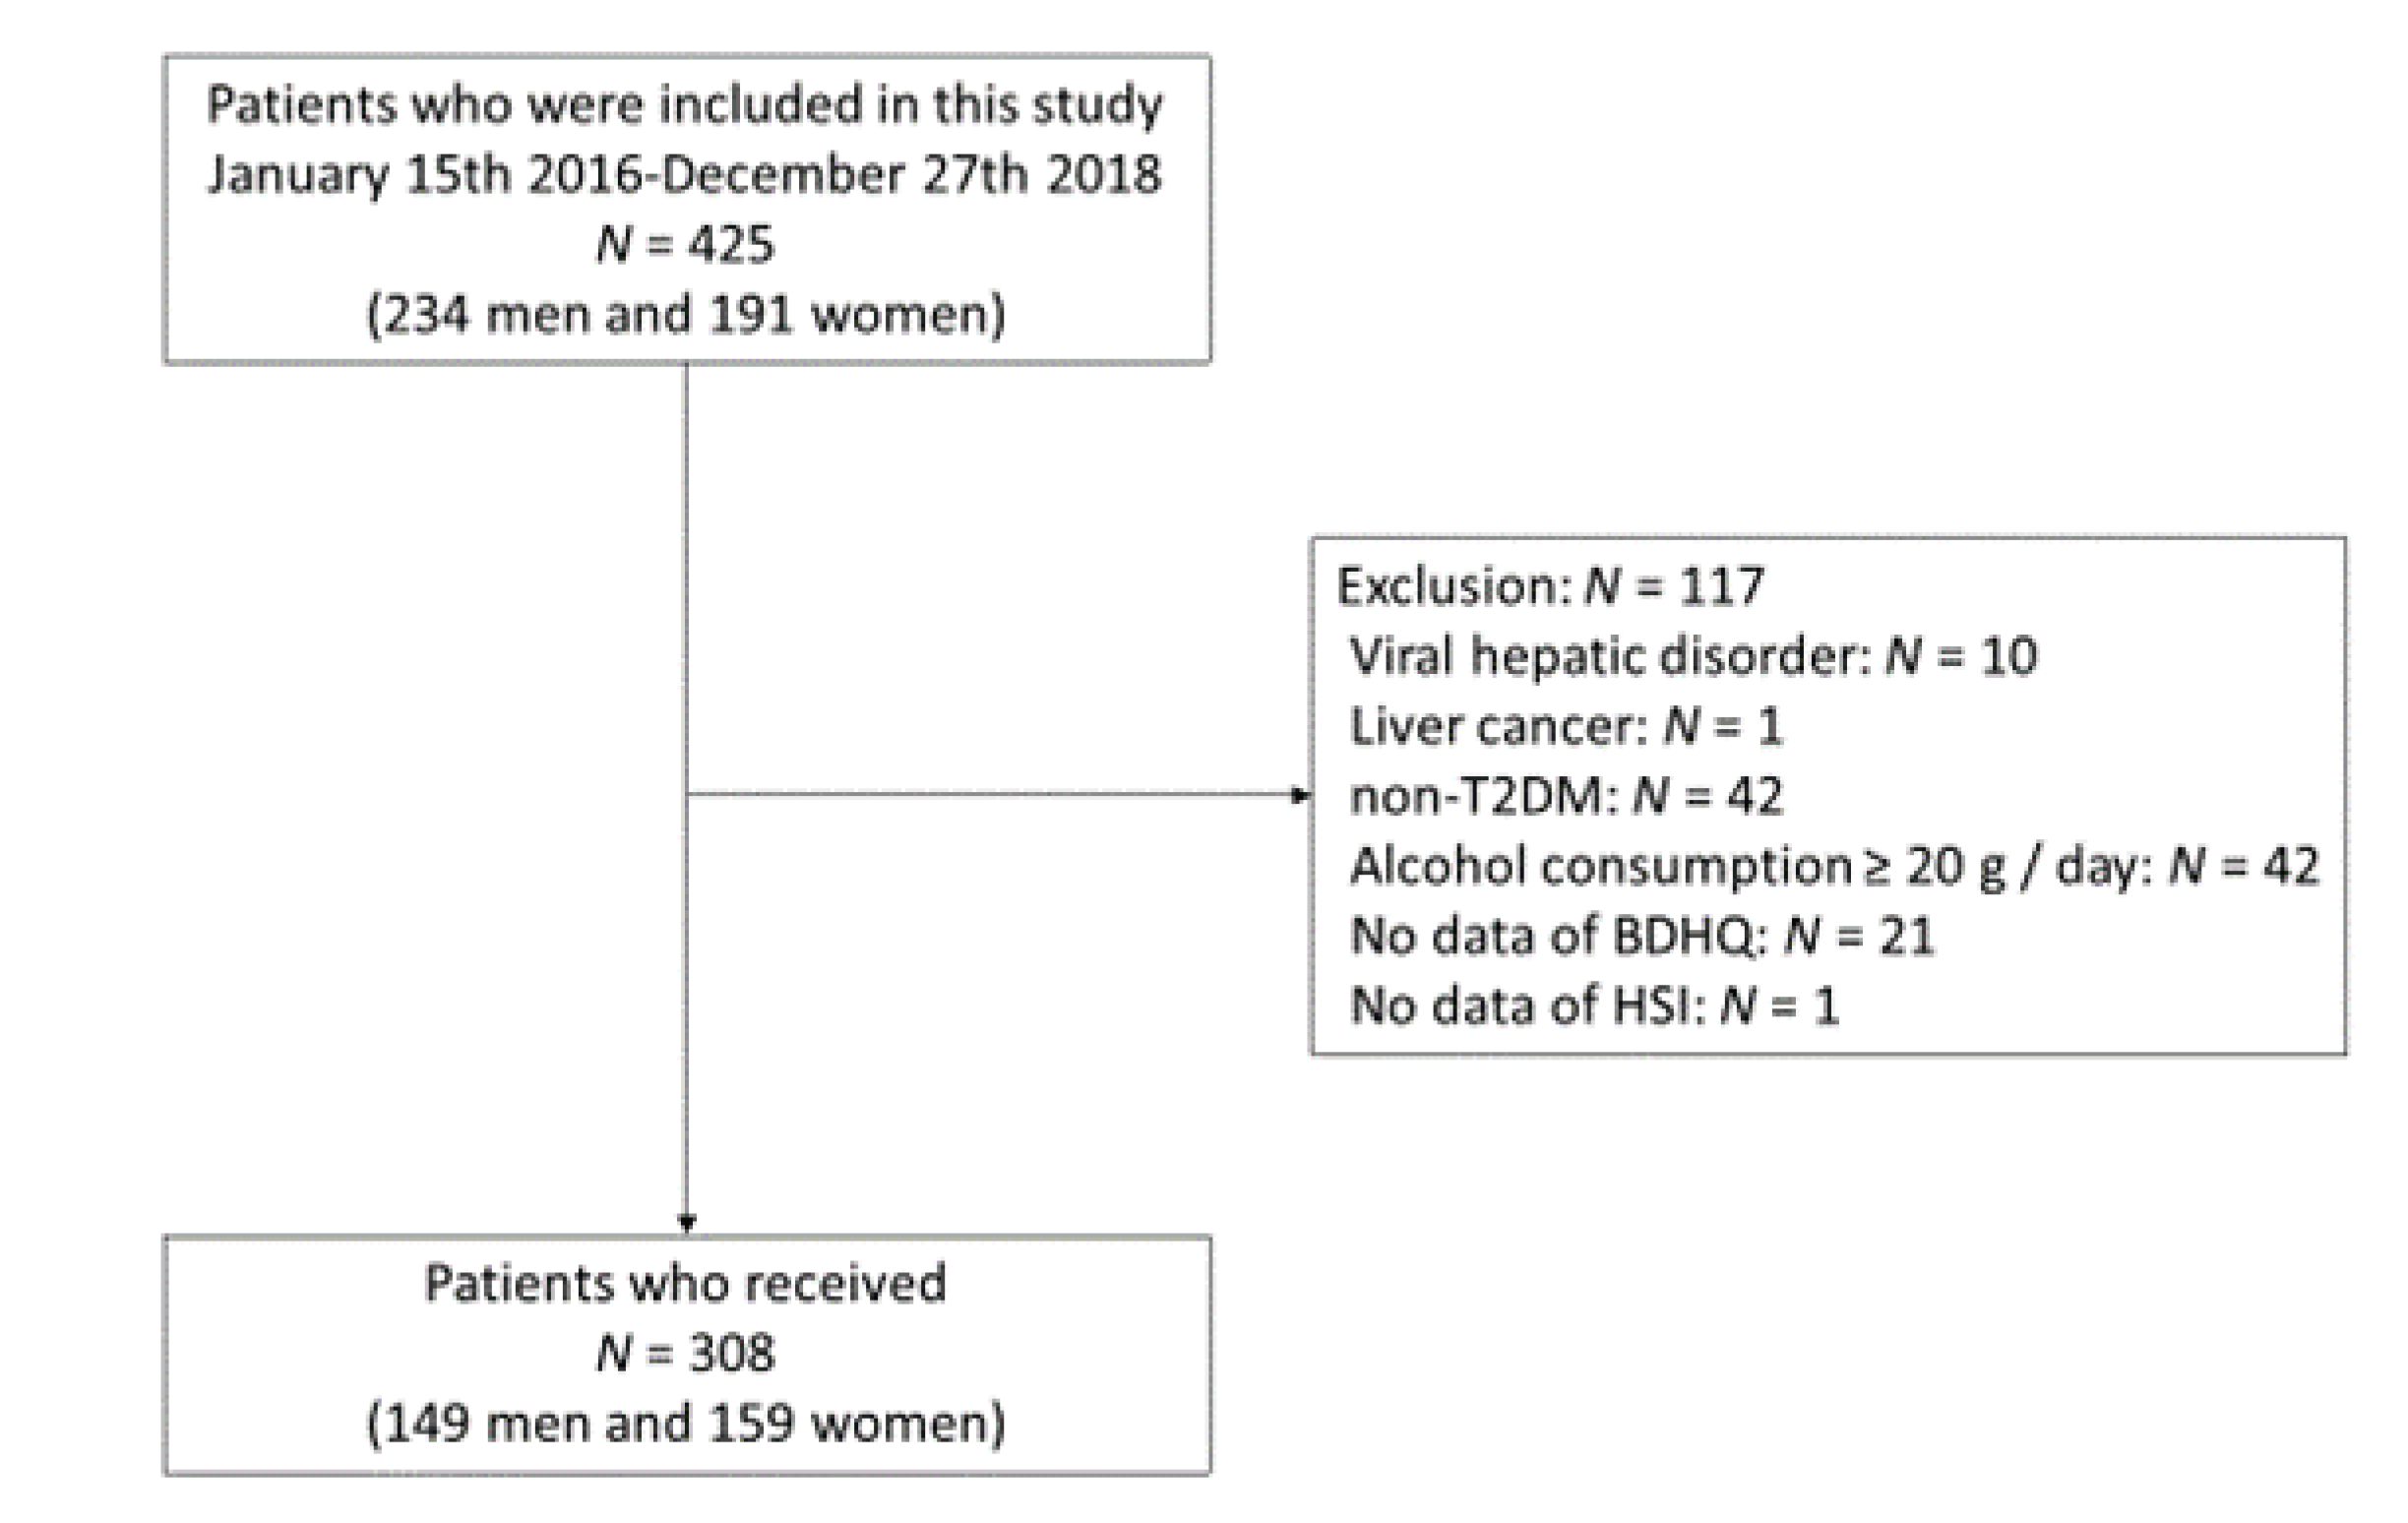
2.1. Study Participants
2.2. Lifestyle Characteristics and Measurement
2.3. Questionnaire for Dietary Habit
2.4. Definition of NAFLD
2.5. Statistical Analysis
3. Results
4. Discussion
Author Contributions
Funding
Acknowledgments
Conflicts of Interest
References
- Ballestri, S.; Zona, S.; Targher, G.; Romagnoli, D.; Baldelli, E.; Nascimbeni, F.; Roverato, A.; Guaraldi, G.; Lonardo, A. Nonalcoholic fatty liver disease is associated with an almost twofold increased risk of incident type 2 diabetes and metabolic syndrome. Evidence from a systematic review and meta-analysis. J. Gastroenterol. Hepatol. 2016, 31, 936–944. [Google Scholar] [CrossRef]
- Dong, Q.; Liu, H.; Yang, D.; Zhang, Y. Diabetes mellitus and arthritis: Is it a risk factor or comorbidity?: A systematic review and meta-analysis. Medicine (Baltim.) 2017, 96, e6627. [Google Scholar] [CrossRef] [PubMed]
- Tasali, E.; Mokhlesi, B.; Van Cauter, E. Obstructive sleep apnea and type 2 diabetes: Interacting epidemics. Chest 2008, 133, 496–506. [Google Scholar] [CrossRef]
- Cai, J.; Zhang, X.J.; Ji, Y.X.; Zhang, P.; She, Z.G.; Li, H. Nonalcoholic Fatty Liver Disease Pandemic Fuels the Upsurge in Cardiovascular Diseases. Circ. Res. 2020, 126, 679–704. [Google Scholar] [CrossRef]
- Tilg, H.; Moschen, A.R.; Roden, M. NAFLD and diabetes mellitus. Nat. Rev. Gastroenterol. Hepatol. 2017, 14, 32–42. [Google Scholar] [CrossRef]
- Adams, L.A.; Anstee, Q.M.; Tilg, H.; Targher, G. Non-alcoholic fatty liver disease and its relationship with cardiovascular disease and other extrahepatic diseases. Gut 2017, 66, 1138–1153. [Google Scholar] [CrossRef]
- Chalasani, N.; Younossi, Z.; Lavine, J.E.; Charlton, M.; Cusi, K.; Rinella, M.; Harrison, S.A.; Brunt, E.M.; Sanyal, A.J. The diagnosis and management of non-alcoholic fatty liver disease: Practice Guideline by the American Association for the Study of Liver Diseases, American College of Gastroenterology, and the American Gastroenterological Association. Hepatology 2012, 55, 2005–2023. [Google Scholar] [CrossRef]
- Dai, W.; Ye, L.; Liu, A.; Wen, S.W.; Deng, J.; Wu, X.; Lai, Z. Prevalence of nonalcoholic fatty liver disease in patients with type 2 diabetes mellitus: A meta-analysis. Medicine (Baltimore) 2017, 96, e8179. [Google Scholar] [CrossRef]
- Fukuda, H.; Saito, T.; Mizuta, M.; Moromugi, S.; Ishimatsu, T.; Nishikado, S.; Takagi, H.; Konomi, Y. Chewing number is related to incremental increases in body weight from 20 years of age in Japanese middle-aged adults. Gerodontology 2013, 30, 214–219. [Google Scholar] [CrossRef]
- Nagahama, S.; Kurotani, K.; Pham, N.M.; Nanri, A.; Kuwahara, K.; Dan, M.; Nishiwaki, Y.; Mizoue, T. Self-reported eating rate and metabolic syndrome in Japanese people: Cross-sectional study. BMJ Open 2014, 4, e005241. [Google Scholar] [CrossRef] [PubMed]
- Sasaki, S.; Katagiri, A.; Tsuji, T.; Shimoda, T.; Amano, K. Self-reported rate of eating correlates with body mass index in 18-y-old Japanese women. Int. J. Obes. Relat. Metab. Disord. 2003, 27, 1405–1410. [Google Scholar] [CrossRef] [PubMed]
- Robinson, E.; Almiron-Roig, E.; Rutters, F.; de Graaf, C.; Forde, C.G.; Tudur Smith, C.; Nolan, S.J.; Jebb, S.A. A systematic review and meta-analysis examining the effect of eating rate on energy intake and hunger. Am. J. Clin Nutr. 2014, 100, 123–151. [Google Scholar] [CrossRef] [PubMed]
- Kral, J.G.; Buckley, M.C.; Kissileff, H.R.; Schaffner, F. Metabolic correlates of eating behavior in severe obesity. Int. J. Obes. Relat. Metab. Disord. 2001, 25, 258–264. [Google Scholar] [CrossRef]
- Cassady, B.A.; Hollis, J.H.; Fulford, A.D.; Considine, R.V.; Mattes, R.D. Mastication of almonds: Effects of lipid bioaccessibility, appetite, and hormone response. Am. J. Clin. Nutr. 2009, 89, 794–800. [Google Scholar] [CrossRef]
- Zhu, Y.; Hollis, J.H. Increasing the number of chews before swallowing reduces meal size in normal-weight, overweight, and obese adults. J. Acad. Nutr. Diet. 2014, 114, 926–931. [Google Scholar] [CrossRef]
- Otsuka, R.; Tamakoshi, K.; Yatsuya, H.; Wada, K.; Matsushita, K.; OuYang, P.; Hotta, Y.; Takefuji, S.; Mitsuhashi, H.; Sugiura, K.; et al. Eating fast leads to insulin resistance: Findings in middle-aged Japanese men and women. Prev. Med. 2008, 46, 154–159. [Google Scholar] [CrossRef]
- Tao, L.; Yang, K.; Huang, F.; Liu, X.; Li, X.; Luo, Y.; Wu, L.; Guo, X. Association between self-reported eating speed and metabolic syndrome in a Beijing adult population: A cross-sectional study. BMC Public Health 2018, 18, 855. [Google Scholar] [CrossRef]
- Sakurai, M.; Nakamura, K.; Miura, K.; Takamura, T.; Yoshita, K.; Nagasawa, S.Y.; Morikawa, Y.; Ishizaki, M.; Kido, T.; Naruse, Y.; et al. Self-reported speed of eating and 7-year risk of type 2 diabetes mellitus in middle-aged Japanese men. Metabolism 2012, 61, 1566–1571. [Google Scholar] [CrossRef]
- Lee, S.; Ko, B.J.; Gong, Y.; Han, K.; Lee, A.; Han, B.D.; Yoon, Y.J.; Park, S.; Kim, J.H.; Mantzoros, C.S. Self-reported eating speed in relation to non-alcoholic fatty liver disease in adults. Eur. J. Nutr. 2016, 55, 327–333. [Google Scholar] [CrossRef] [PubMed]
- Mansour-Ghanaei, R.; Mansour-Ghanaei, F.; Naghipour, M.; Joukar, F. The Lifestyle Characteristics in Non-Alcoholic Fatty Liver Disease in the PERSIAN Guilan Cohort Study. Open Access Maced. J. Med. Sci. 2019, 7, 3313–3318. [Google Scholar] [CrossRef] [PubMed]
- Cao, X.; Gu, Y.; Bian, S.; Zhang, Q.; Meng, G.; Liu, L.; Wang, X. Association between eating speed and newly diagnosed non-alcoholic fatty liver disease among the general population. Nutr. Res. 2020, in press. [Google Scholar] [CrossRef]
- Sakai, R.; Hashimoto, Y.; Ushigome, E.; Miki, A.; Okamura, T.; Matsugasumi, M.; Fukuda, T.; Majima, S.; Matsumoto, S.; Senmaru, T.; et al. Late-night-dinner is associated with poor glycemic control in people with type 2 diabetes: The KAMOGAWA-DM cohort study. Endocr. J. 2018, 65, 395–402. [Google Scholar] [CrossRef] [PubMed]
- Kaji, A.; Hashimoto, Y.; Sakai, R.; Okada, H.; Hamaguchi, M.; Ushigome, E.; Majima, S.; Yamazaki, M.; Fukui, M. Frequent Usage of Convenience Stores is Associated with Low Diet Quality. Nutrients 2019, 11, 1212. [Google Scholar] [CrossRef] [PubMed]
- Lemmens, H.J.; Brodsky, J.B.; Bernstein, D.P. Estimating ideal body weight—A new formula. Obes. Surg. 2005, 15, 1082–1083. [Google Scholar] [CrossRef]
- Kobayashi, S.; Honda, S.; Murakami, K.; Sasaki, S.; Okubo, H.; Hirota, N.; Notsu, A.; Fukui, M.; Date, C. Both comprehensive and brief self-administered diet history questionnaires satisfactorily rank nutrient intakes in Japanese adults. J. Epidemiol. 2012, 22, 151–159. [Google Scholar] [CrossRef]
- Hashimoto, Y.; Tanaka, M.; Miki, A.; Kobayashi, Y.; Wada, S.; Kuwahata, M.; Kido, Y.; Yamazaki, M.; Fukui, M. Intake of Carbohydrate to Fiber Ratio Is a Useful Marker for Metabolic Syndrome in Patients with Type 2 Diabetes: A Cross-Sectional Study. Ann. Nutr. Metab. 2018, 72, 329–335. [Google Scholar] [CrossRef]
- Lee, J.H.; Kim, D.; Kim, H.J.; Lee, C.H.; Yang, J.I.; Kim, W.; Kim, Y.J.; Yoon, J.H.; Cho, S.H.; Sung, M.W.; et al. Hepatic steatosis index: A simple screening tool reflecting nonalcoholic fatty liver disease. Dig. Liver Dis. 2010, 42, 503–508. [Google Scholar] [CrossRef]
- Kanda, Y. Investigation of the freely available easy-to-use software ’EZR’ for medical statistics. Bone Marrow Transplant. 2013, 48, 452–458. [Google Scholar] [CrossRef]
- Hashimoto, Y.; Hamaguchi, M.; Fukuda, T.; Nakamura, N.; Ohbora, A.; Kojima, T.; Fukui, M. BMI history and risk of incident fatty liver: A population-based large-scale cohort study. Eur. J. Gastroenterol. Hepatol. 2016, 28, 1188–1193. [Google Scholar] [CrossRef]
- Saito, A.; Kawai, K.; Yanagisawa, M.; Yokoyama, H.; Kuribayashi, N.; Sugimoto, H.; Oishi, M.; Wada, T.; Iwasaki, K.; Kanatsuka, A.; et al. Self-reported rate of eating is significantly associated with body mass index in Japanese patients with type 2 diabetes. Japan Diabetes Clinical Data Management Study Group (JDDM26). Appetite 2012, 59, 252–255. [Google Scholar] [CrossRef]
- Paz-Graniel, I.; Babio, N.; Mendez, I.; Salas-Salvadó, J. Association between Eating Speed and Classical Cardiovascular Risk Factors: A Cross-Sectional Study. Nutrients 2019, 11, 83. [Google Scholar] [CrossRef]
- Ballestri, S.; Capitelli, M.; Fontana, M.C.; Arioli, D.; Romagnoli, E.; Graziosi, C.; Lonardo, A.; Marietta, M.; Dentali, F.; Cioni, G. Direct Oral Anticoagulants in Patients with Liver Disease in the Era of Non-Alcoholic Fatty Liver Disease Global Epidemic: A Narrative Review. Adv. Ther. 2020, 37, 1910–1932. [Google Scholar] [CrossRef]
- Li, J.; Zhang, N.; Hu, L.; Li, Z.; Li, R.; Li, C.; Wang, S. Improvement in chewing activity reduces energy intake in one meal and modulates plasma gut hormone concentrations in obese and lean young Chinese men. Am. J. Clin. Nutr. 2011, 94, 709–716. [Google Scholar] [CrossRef]
- Sakata, T.; Yoshimatsu, H.; Masaki, T.; Tsuda, K. Anti-obesity actions of mastication driven by histamine neurons in rats. Exp. Biol. Med. (Maywood) 2003, 228, 1106–1110. [Google Scholar] [CrossRef]
- Kokkinos, A.; le Roux, C.W.; Alexiadou, K.; Tentolouris, N.; Vincent, R.P.; Kyriaki, D.; Perrea, D.; Ghatei , M.A.; Bloom, S.R.; Katsilambros, N. Eating slowly increases the postprandial response of the anorexigenic gut hormones, peptide YY and glucagon-like peptide-1. J. Clin. Endocrinol. Metab. 2010, 95, 333–337. [Google Scholar] [CrossRef] [PubMed]
- Chaudhri, O.; Small, C.; Bloom, S. Gastrointestinal hormones regulating appetite. Philos. Trans. R. Soc. Lond. B Biol. Sci. 2006, 361, 1187–1209. [Google Scholar] [CrossRef]
- Murakami, K.; Sasaki, S.; Takahashi, Y.; Uenishi, K.; Yamasaki, M.; Hayabuchi, H.; Goda, T.; Oka, J.; Baba, K.; Ohki, K.; et al. Misreporting of dietary energy, protein, potassium and sodium in relation to body mass index in young Japanese women. Eur. J. Clin. Nutr. 2008, 62, 111–118. [Google Scholar] [CrossRef]
- Hücking, K.; Kostic, Z.; Pox, C.; Ritzel, R.; Holst, J.J.; Schmiegel, W.; Nauck, M.A. alpha-Glucosidase inhibition (acarbose) fails to enhance secretion of glucagon-like peptide 1 (7-36 amide) and to delay gastric emptying in Type 2 diabetic patients. Diabet Med. 2005, 22, 470–476. [Google Scholar] [CrossRef]
- Kalra, S. Incretin enhancement without hyperinsulinemia: α-glucosidase inhibitors. Expert Rev. Endocrinol. Metab. 2014, 9, 423–425. [Google Scholar] [CrossRef][Green Version]
- Reddy, N.L.; Peng, C.; Carreira, M.C.; Halder, L.; Hattersley, J.; Piya, M.K.; Tripathi, G.; Randeva, H.S.; Casanueva, F.F.; McTernan, P.G.; et al. Enhanced thermic effect of food, postprandial NEFA suppression and raised adiponectin in obese women who eat slowly. Clin. Endocrinol. (Oxf.) 2015, 82, 831–837. [Google Scholar] [CrossRef]
- Hamada, Y.; Kashima, H.; Hayashi, N. The number of chews and meal duration affect diet-induced thermogenesis and splanchnic circulation. Obesity (Silver Spring) 2014, 22, E62–E69. [Google Scholar] [CrossRef] [PubMed]
- Takase, H.; Sakane, N.; Morimoto, T.; Uchida, T.; Mori, K.; Katashima, M.; Katsuragi, Y. Development of a Dietary Factor Assessment Tool for Evaluating Associations between Visceral Fat Accumulation and Major Nutrients in Japanese Adults. J. Obes. 2019, 2019, 9497861. [Google Scholar] [CrossRef] [PubMed]
- Park, S.; Shin, W.S. Differences in eating behaviors and masticatory performances by gender and obesity status. Physiol. Behav. 2015, 138, 69–74. [Google Scholar] [CrossRef] [PubMed]
- Musso, G.; Gambino, R.; De Michieli, F.; Cassader, M.; Rizzetto, M.; Durazzo, M.; Fagà, E.; Silli, B.; Pagano, G. Dietary habits and their relations to insulin resistance and postprandial lipemia in nonalcoholic steatohepatitis. Hepatology 2003, 37, 909–916. [Google Scholar] [CrossRef]
- Ma, H.; Xu, C.; Xu, L.; Yu, C.; Miao, M.; Li, Y. Independent association of HbA1c and nonalcoholic fatty liver disease in an elderly Chinese population. BMC Gastroenterol. 2013, 13, 3. [Google Scholar] [CrossRef]
- Hamaguchi, M.; Kojima, T.; Ohbora, A.; Takeda, N.; Fukui, M.; Kato, T. Aging is a risk factor of nonalcoholic fatty liver disease in premenopausal women. World J. Gastroenterol. 2012, 18, 237–243. [Google Scholar] [CrossRef]
- Ekuni, D.; Furuta, M.; Takeuchi, N.; Tomofuji, T.; Morita, M. Self-reports of eating quickly are related to a decreased number of chews until first swallow, total number of chews, and total duration of chewing in young people. Arch. Oral Biol. 2012, 57, 981–986. [Google Scholar] [CrossRef]
- Ballestri, S.; Nascimbeni, F.; Baldelli, E.; Marrazzo, A.; Romagnoli, D.; Targher, G.; Lonardo, A. Ultrasonographic fatty liver indicator detects mild steatosis and correlates with metabolic/histological parameters in various liver diseases. Metabolism 2017, 72, 57–65. [Google Scholar] [CrossRef]


| All | Men | Women | p | |
|---|---|---|---|---|
| 308 | 149 (48.4%) | 159 (51.6%) | ||
| Age (years) | 66.8 (10.6) | 67.6 (10.8) | 66.1 (10.4) | 0.320 |
| BMI (kg/m2) | 24.2 (4.0) | 23.9 (3.0) | 24.6 (4.7) | 0.475 |
| Duration of diabetes (years) | 14.4 (10.2) | 15.5 (9.7) | 13.3 (10.6) | 0.008 |
| SBP (mm Hg) | 133.8 (18.8) | 132.6 (17.6) | 135.0 (19.8) | 0.386 |
| DBP (mm Hg) | 78.5 (11.3) | 78.7 (10.8) | 78.3 (11.8) | 0.351 |
| Hemoglobin A1c (%) | 7.3 (1.2) | 7.3 (1.2) | 7.3 (1.2) | 0.951 |
| Hemoglobin A1c (mmol/mol) | 56.5 (13.6) | 56.7 (13.6) | 56.4 (13.5) | 0.951 |
| Glucose (mmol/L) | 8.1 (2.6) | 8.3 (2.4) | 8.0 (2.8) | 0.186 |
| Total cholesterol (mmol/L) | 5.0 (1.2) | 4.8 (0.9) | 5.1 (1.3) | <0.001 |
| Triglyceride (mmol/L) | 1.5 (0.8) | 1.5 (0.9) | 1.5 (0.8) | 0.701 |
| AST (IU/L) | 22.8 (9.6) | 24.0 (10.6) | 21.7 (8.5) | 0.014 |
| ALT (IU/L) | 23.3 (14.5) | 25.6 (15.3) | 21.2 (13.5) | 0.001 |
| γ-GTP (IU/L) | 32.7 (32.0) | 37.0 (40.8) | 28.6 (20.1) | 0.018 |
| HSI (point) | 35.3 (5.9) | 34.2 (4.8) | 36.4 (6.7) | 0.006 |
| Habit of exercise | - | - | - | 0.211 |
| No | 155 (50.3%) | 69 (46.3%) | 86 (54.1%) | - |
| Yes | 153 (49.7%) | 80 (53.7%) | 73 (45.9%) | - |
| Habit of smoking | - | - | - | 0.002 |
| No | 270 (87.7%) | 121 (81.2%) | 149 (93.7%) | - |
| Yes | 38 (12.3%) | 28 (18.8%) | 10 (6.3%) | - |
| Insulin treatment | - | - | - | 0.827 |
| No | 235 (76.3%) | 115 (77.2%) | 120 (75.5%) | - |
| Yes | 73 (23.7%) | 34 (22.8%) | 39 (24.5%) | - |
| Fatty liver | 0.016 | |||
| No | 195 (63.3%) | 105 (70.5%) | 90 (56.6%) | - |
| Yes | 113 (36.7%) | 44 (29.5%) | 69 (43.4%) | - |
| Eating speed | - | - | - | 0.340 |
| Fast | 145 (47.1%) | 75 (50.3%) | 70 (44.0%) | - |
| Moderate | 112 (36.4%) | 48 (32.2%) | 64 (40.3%) | - |
| Slow | 51 (16.6%) | 26 (17.4%) | 25 (15.7%) | - |
| Total energy intake (kcal/kg IBW/day) | 29.8 (10.1) | 30.0 (9.0) | 29.7 (11.1) | 0.426 |
| Protein intake (% Energy) | 17.1 (3.4) | 16.3 (3.1) | 17.9 (3.6) | <0.001 |
| Fat intake (% Energy) | 29.2 (6.2) | 28.5 (6.3) | 29.8 (6.0) | 0.022 |
| Carbohydrate intake (% Energy) | 52.0 (8.3) | 52.9 (8.4) | 51.1 (8.2) | 0.033 |
| Dietary fiber intake (g/day) | 12.3 (4.9) | 12.9 (5.1) | 11.8 (4.7) | 0.047 |
| Carbohydrate/fiber | 19.0 (6.9) | 20.4 (7.6) | 17.7 (6.0) | <0.001 |
| Men | Women | |||||||
|---|---|---|---|---|---|---|---|---|
| Fast, n = 75 (50.3%) | Moderate, n = 48 (32.2%) | Slow, n = 26 (17.4%) | p | Fast, n = 70 (44.0%) | Moderate, n = 64 (40.3%) | Slow, n = 25 (15.7%) | p | |
| Age (years) | 66.3 (11.0) | 67.1 (10.7) | 72.5 (9.4) * | 0.012 | 65.7 (11.1) | 65.3 (10.0) | 69.2 (9.6) | 0.109 |
| BMI (kg/m2) | 24.3 (2.9) | 24.1 (3.0) | 22.2 (2.6) * | 0.007 | 25.3 (4.9) | 24.2 (4.5) | 23.6 (4.7) | 0.147 |
| Duration of diabetes (years) | 15.6 (10.3) | 15.9 (9.2) | 14.8 (9.1) | 0.891 | 13.5 (10.2) | 12.0 (10.3) | 16.0 (12.4) | 0.244 |
| SBP (mm Hg) | 133.2 (16.3) | 134.2 (19.7) | 128.2 (17.1) | 0.421 | 137.0 (20.5) | 132.5 (19.6) | 135.7 (18.1) | 0.442 |
| DBP (mm Hg) | 78.9 (9.7) | 80.5 (12.1) | 74.7 (10.6) | 0.186 | 78.9 (12.5) | 77.8 (11.4) | 77.7 (11.1) | 0.886 |
| HbA1c (%) | 7.3 (1.2) | 7.4 (1.6) | 7.3 (0.8) | 0.475 | 7.4 (1.1) | 7.3 (1.5) | 7.1 (0.7) | 0.358 |
| HbA1c (mmol/mol) | 56.5 (12.6) | 57.1 (17.2) | 56.4 (8.6) | 0.475 | 57.4 (11.6) | 56.4 (16.9) | 54.0 (8.1) | 0.358 |
| Glucose (mmol/L) | 8.1 (2.4) | 8.4 (2.5) | 8.4 (2.5) | 0.577 | 8.1 (3.0) | 8.0 (2.5) | 7.9 (2.7) | 0.947 |
| Total cholesterol (mmol/L) | 4.8 (0.9) | 4.6 (1.0) | 4.9 (0.7) | 0.135 | 5.1 (1.4) | 5.0 (1.4) | 5.4 (0.9) | 0.531 |
| Triglyceride (mmol/L) | 1.5 (0.8) | 1.6 (0.9) | 1.3 (0.9) | 0.201 | 1.5 (0.8) | 1.5 (1.0) | 1.3 (0.6) | 0.670 |
| AST (IU/L) | 24.5 (12.3) | 23.6 (9.6) | 23.5 (6.0) | 0.716 | 22.0 (7.1) | 22.4 (10.8) | 19.3 (3.9) | 0.329 |
| ALT (IU/L) | 27.2 (17.5) | 23.9 (12.6) | 24.1 (13.1) | 0.762 | 22.0 (12.3) | 22.1 (16.3) | 16.4 (5.7) | 0.127 |
| γ-GTP (IU/L) | 39.5 (50.1) | 33.5 (29.1) | 36.3 (27.9) | 0.722 | 27.8 (18.7) | 31.1 (21.3) | 24.2 (20.7) | 0.043 |
| HSI (point) | 35.0 (5.0) | 34.2 (4.3) | 32.2 (4.5) | 0.047 | 37.0 (6.3) | 36.2 (7.5) | 34.5 (5.0) | 0.115 |
| Habit of exercise | - | - | - | 0.266 | - | - | - | 0.491 |
| No | 34 (45.3%) | 26 (54.2%) | 9 (34.6%) | - | 38 (54.3%) | 32 (50.0%) | 16 (64.0%) | - |
| Yes | 41 (54.7%) | 22 (45.8%) | 17 (65.4%) | - | 32 (45.7%) | 32 (50.0%) | 9 (36.0%) | - |
| Habit of smoking | - | - | - | 0.331 | - | - | - | 0.166 |
| No | 52 (82.7%) | 36 (75.0%) | 23 (88.5%) | - | 63 (90.0%) | 61 (95.3%) | 25 (100.0%) | - |
| Yes | 13 (17.3%) | 12 (25.0%) | 3 (11.5%) | - | 7 (10.0%) | 3 (4.7%) | 0 (0.0%) | - |
| Insulin treatment | - | - | - | 0.500 | - | - | - | 0.795 |
| No | 58 (77.3%) | 39 (81.2%) | 18 (69.2%) | - | 52 (74.3%) | 50 (78.1%) | 18 (72.0%) | - |
| Yes | 17 (22.7%) | 9 (18.8%) | 8 (30.8%) | - | 18 (25.7%) | 14 (21.9%) | 7 (28.0%) | - |
| Fatty liver | - | - | - | 0.041 | - | - | - | 0.422 |
| No | 47 (62.7%) | 35 (72.9%) | 23 (88.5%) | - | 37 (52.9%) | 36 (56.2%) | 17 (68.0%) | - |
| Yes | 28 (37.3%) | 13 (27.1%) | 3 (11.5%) | - | 33 (47.1%) | 28 (43.8%) | 8 (32.0%) | - |
| Total energy intake (kcal/kg IBW/day) | 31.2 (9.9) | 28.7 (7.5) | 28.8 (8.3) | 0.402 | 29.1 (9.3) | 29.8 (10.8) | 31.2 (16.1) | 0.993 |
| Protein intake (% Energy) | 15.9 (2.8) | 16.6 (3.3) | 17.0 (3.2) | 0.325 | 17.6 (3.4) | 18.4 (3.9) | 17.1 (3.0) | 0.312 |
| Fat intake (% Energy) | 27.9 (6.4) | 29.5 (6.3) | 28.7 (6.3) | 0.371 | 30.3 (6.0) | 29.6 (5.9) | 29.1 (6.4) | 0.722 |
| Carbohydrate intake (% Energy) | 53.6 (8.4) | 52.0 (8.4) | 52.1 (8.2) | 0.552 | 51.0 (8.1) | 50.6 (8.1) | 53.0 (8.6) | 0.573 |
| Dietary fiber intake (g/day) | 12.6 (5.4) | 13.1 (5.4) | 13.3 (3.9) | 0.453 | 11.5 (4.7) | 11.7 (4.3) | 12.9 (5.5) | 0.682 |
| Carbohydrate/fiber | 22.3 (8.3) | 19.0 (6.3) | 17.7 (6.4) | 0.002 | 17.8 (6.0) | 17.8 (6.0) | 17.0 (6.1) | 0.924 |
| All | Model 1 | Model 2 | Model 3 | |||
|---|---|---|---|---|---|---|
| OR (95% CI) | p | OR (95%CI) | p | OR (95% CI) | p | |
| Eating speed | ||||||
| Fast | 2.64 (1.25–5.56) | 0.011 | 2.13 (0.95–4.81) | 0.068 | 2.10 (0.90–4.91) | 0.087 |
| Moderate | 2.10 (0.97–4.54) | 0.060 | 1.45 (0.62–3.38) | 0.390 | 1.42 (0.59–3.44) | 0.436 |
| Slow | Ref | - | Ref | - | Ref | - |
| Women | - | - | 1.87 (1.08–3.22) | 0.025 | 1.59 (0.90–2.81) | 0.108 |
| Age (years) | - | - | 0.95 (0.92–0.97) | <0.001 | 0.95 (0.92–0.98) | <0.001 |
| Duration of diabetes (years) | - | - | 0.95 (0.92–0.98) | 0.002 | 0.95 (0.92–0.98) | 0.001 |
| Hemoglobin A1c (mmol/mol) | - | - | 1.33 (1.04–1.71) | 0.022 | 1.32 (1.03–1.69) | 0.027 |
| Energy intake (kcal/kg IBW/day) | - | - | - | - | 1.03 (1.00–1.06) | 0.079 |
| Carbohydrate intake (% Energy) | - | - | - | - | 1.00 (0.97–1.03) | 0.987 |
| Dietary fiber intake (g/day) | - | - | - | - | 0.91 (0.85–0.98) | 0.011 |
| Habit of exercise | - | - | 1.10 (0.65–1.87) | 0.713 | 1.13 (0.66–1.94) | 0.662 |
| Habit of smoking | - | - | 1.47 (0.67–3.26) | 0.340 | 1.37 (0.62–3.05) | 0.440 |
| Insulin treatment | - | - | 0.71 (0.36–1.38) | 0.311 | 0.77 (0.39–1.53) | 0.456 |
| Men | Model 1 | Model 2 | Model 3 | |||
| OR (95% CI) | p | OR (95%CI) | p | OR (95% CI) | p | |
| Eating speed | ||||||
| Fast | 4.57 (1.26–16.6) | 0.021 | 4.34 (1.08–17.4) | 0.038 | 4.48 (1.09–18.5) | 0.038 |
| Moderate | 2.85 (0.73–11.1) | 0.132 | 2.73 (0.61–12.1) | 0.186 | 2.97 (0.66–13.4) | 0.156 |
| Slow | Ref | - | Ref | - | Ref | - |
| Age (years) | - | - | 0.96 (0.92–1.00) | 0.045 | 0.96 (0.92–1.00) | 0.063 |
| Duration of diabetes (years) | - | - | 0.94 (0.89–0.99) | 0.017 | 0.93 (0.88–0.99) | 0.014 |
| Hemoglobin A1c (mmol/mol) | - | - | 1.14 (0.43–3.02) | 0.798 | 1.04 (1.00–1.08) | 0.031 |
| Energy intake (kcal/kg IBW/day) | - | - | - | - | 1.00 (0.95–1.06) | 0.865 |
| Carbohydrate intake (% Energy) | - | - | - | - | 0.99 (0.94–1.04) | 0.558 |
| Dietary fiber intake (g/day) | - | - | - | - | 0.95 (0.86–1.05) | 0.351 |
| Habit of exercise | - | - | 2.05 (0.89–4.76) | 0.093 | 2.09 (0.88–4.93) | 0.094 |
| Habit of smoking | - | - | 1.14 (0.43–3.02) | 0.798 | 1.04 (0.39–2.79) | 0.940 |
| Insulin treatment | - | - | 0.51 (0.18–1.51) | 0.225 | 0.56 (0.18–1.69) | 0.300 |
| Women | Model 1 | Model 2 | Model 3 | |||
| OR (95% CI) | p | OR (95%CI) | p | OR (95% CI) | p | |
| Eating speed | ||||||
| Fast | 1.90 (0.72–4.96) | 0.193 | 1.33 (0.45–3.95) | 0.606 | 1.30 (0.39–4.31) | 0.665 |
| Moderate | 1.65 (0.62–4.38) | 0.312 | 1.07 (0.35–3.23) | 0.906 | 0.92 (0.28–3.09) | 0.896 |
| Slow | Ref | - | Ref | - | Ref | - |
| Age (years) | - | - | 0.93 (0.90–0.97) | 0.001 | 0.94 (0.90–0.98) | 0.006 |
| Duration of diabetes (years) | - | - | 0.95 (0.91–0.99) | 0.025 | 0.95 (0.90–0.99) | 0.018 |
| Hemoglobin A1c (mmol/mol) | - | - | 1.01 (0.98–1.04) | 0.429 | 1.01 (0.98–1.04) | 0.513 |
| Energy intake (kcal/kg IBW/day) | - | - | - | - | 1.05 (1.00–1.09) | 0.044 |
| Carbohydrate intake (% Energy) | - | - | - | - | 1.01 (0.96–1.06) | 0.743 |
| Dietary fiber intake (g/day) | - | - | - | - | 0.85 (0.76–0.96) | 0.010 |
| Habit of exercise | - | - | 0.63 (0.31–1.31) | 0.216 | 0.65 (0.30–1.40) | 0.272 |
| Habit of smoking | - | - | 3.08 (0.64–14.8) | 0.160 | 3.30 (0.67–16.2) | 0.142 |
| Insulin treatment | - | - | 0.91 (0.36–2.27) | 0.836 | 0.92 (0.35–2.40) | 0.868 |
© 2020 by the authors. Licensee MDPI, Basel, Switzerland. This article is an open access article distributed under the terms and conditions of the Creative Commons Attribution (CC BY) license (http://creativecommons.org/licenses/by/4.0/).
Share and Cite
Takahashi, F.; Hashimoto, Y.; Kawano, R.; Kaji, A.; Sakai, R.; Kawate, Y.; Okamura, T.; Ushigome, E.; Kitagawa, N.; Majima, S.; et al. Eating Fast Is Associated with Nonalcoholic Fatty Liver Disease in Men But Not in Women with Type 2 Diabetes: A Cross-Sectional Study. Nutrients 2020, 12, 2174. https://doi.org/10.3390/nu12082174
Takahashi F, Hashimoto Y, Kawano R, Kaji A, Sakai R, Kawate Y, Okamura T, Ushigome E, Kitagawa N, Majima S, et al. Eating Fast Is Associated with Nonalcoholic Fatty Liver Disease in Men But Not in Women with Type 2 Diabetes: A Cross-Sectional Study. Nutrients. 2020; 12(8):2174. https://doi.org/10.3390/nu12082174
Chicago/Turabian StyleTakahashi, Fuyuko, Yoshitaka Hashimoto, Rena Kawano, Ayumi Kaji, Ryosuke Sakai, Yuka Kawate, Takuro Okamura, Emi Ushigome, Noriyuki Kitagawa, Saori Majima, and et al. 2020. "Eating Fast Is Associated with Nonalcoholic Fatty Liver Disease in Men But Not in Women with Type 2 Diabetes: A Cross-Sectional Study" Nutrients 12, no. 8: 2174. https://doi.org/10.3390/nu12082174
APA StyleTakahashi, F., Hashimoto, Y., Kawano, R., Kaji, A., Sakai, R., Kawate, Y., Okamura, T., Ushigome, E., Kitagawa, N., Majima, S., Sennmaru, T., Okada, H., Nakanishi, N., Hamaguchi, M., Asano, M., Yamazaki, M., & Fukui, M. (2020). Eating Fast Is Associated with Nonalcoholic Fatty Liver Disease in Men But Not in Women with Type 2 Diabetes: A Cross-Sectional Study. Nutrients, 12(8), 2174. https://doi.org/10.3390/nu12082174