Nutritional Status and Risk Factors for Frailty in Community-Dwelling Older People: A Cross-Sectional Study

 ,
,  ,
, 
Abstract
1. Introduction
2. Materials and Methods
2.1. Study Design and Participants
2.2. Sample Size Description
2.3. Data Collection
2.4. Ethics
2.5. Statistical Analysis
3. Results
4. Discussion
5. Conclusions
Author Contributions
Funding
Acknowledgments
Conflicts of Interest
References
- Envejecimiento|Naciones Unidas. Available online: https://www.un.org/es/sections/issues-depth/ageing/index.html (accessed on 11 January 2020).
- Envejecimiento y Salud. Available online: https://www.who.int/es/news-room/fact-sheets/detail/envejecimiento-y-salud (accessed on 11 January 2020).
- Cesari, M. The frailty phenotype and sarcopenia: Similar but not the same. Aging Med. (Milton) 2019, 2, 97–98. [Google Scholar] [CrossRef]
- Rockwood, K.; Song, X.; MacKnight, C.; Bergman, H.; Hogan, D.B.; McDowell, I.; Mitnitski, A. A global clinical measure of fitness and frailty in elderly people. CMAJ 2005, 173, 489–495. [Google Scholar] [CrossRef]
- Fried, L.P.; Tangen, C.M.; Walston, J.; Newman, A.B.; Hirsch, C.; Gottdiener, J.; Seeman, T.; Tracy, R.; Kop, W.J.; Burke, G.; et al. Frailty in older adults: Evidence for a phenotype. J. Gerontol. Ser. A Biol. Sci. Med. Sci. 2001, 56, M146–M157. [Google Scholar] [CrossRef] [PubMed]
- Siriwardhana, D.D.; Hardoon, S.; Rait, G.; Weerasinghe, M.C.; Walters, K.R. Prevalence of frailty and prefrailty among community-dwelling older adults in low-income and middle-income countries: A systematic review and meta-analysis. BMJ Open 2018, 8, e018195. [Google Scholar] [CrossRef]
- Rodríguez-Mañas, L.; Féart, C.; Mann, G.; Viña, J.; Chatterji, S.; Chodzko-Zajko, W.; Gonzalez-Colaço Harmand, M.; Bergman, H.; Carcaillon, L.; Nicholson, C.; et al. Searching for an operational definition of frailty: A Delphi method based consensus statement: The frailty operative definition-consensus conference project. J. Gerontol. Ser. A Biol. Sci. Med. Sci. 2013, 68, 62–67. [Google Scholar] [CrossRef]
- Hernández Morante, J.J.; Gómez Martínez, C.; Morillas-Ruiz, J.M. Dietary Factors Associated with Frailty in Old Adults: A Review of Nutritional Interventions to Prevent Frailty Development. Nutrients 2019, 11, 102. [Google Scholar] [CrossRef] [PubMed]
- Pivetta, N.R.S.; Marincolo, J.C.S.; Neri, A.L.; Aprahamian, I.; Yassuda, M.S.; Borim, F.S.A. Multimorbidity, frailty and functional disability in octogenarians: A structural equation analysis of relationship. Arch. Gerontol. Geriatr. 2020, 86, 103931. [Google Scholar] [CrossRef]
- Su, P.; Ding, H.; Zhang, W.; Duan, G.; Yang, Y.; Chen, R.; Duan, Z.; Du, L.; Xie, C.; Jin, C.; et al. The association of multimorbidity and disability in a community-based sample of elderly aged 80 or older in Shanghai, China. BMC Geriatr. 2016, 16, 178. [Google Scholar] [CrossRef]
- Liu, L.-K.; Lee, W.-J.; Chen, L.-Y.; Hwang, A.-C.; Lin, M.-H.; Peng, L.-N.; Chen, L.-K. Association between Frailty, Osteoporosis, Falls and Hip Fractures among Community-Dwelling People Aged 50 Years and Older in Taiwan: Results from I-Lan Longitudinal Aging Study. PLoS ONE 2015, 10, e0136968. [Google Scholar] [CrossRef] [PubMed]
- Liu, H.X.; Ding, G.; Yu, W.J.; Liu, T.F.; Yan, A.Y.; Chen, H.Y.; Zhang, A.H. Association between frailty and incident risk of disability in community-dwelling elder people: Evidence from a meta-analysis. Public Health 2019, 175, 90–100. [Google Scholar] [CrossRef]
- Artaza-Artabe, I.; Sáez-López, P.; Sánchez-Hernández, N.; Fernández-Gutierrez, N.; Malafarina, V. The relationship between nutrition and frailty: Effects of protein intake, nutritional supplementation, vitamin D and exercise on muscle metabolism in the elderly. A systematic review. Maturitas 2016, 93, 89–99. [Google Scholar] [CrossRef] [PubMed]
- Cruz-Jentoft, A.J.; Kiesswetter, E.; Drey, M.; Sieber, C.C. Nutrition, frailty, and sarcopenia. Aging Clin. Exp. Res. 2017, 29, 43–48. [Google Scholar] [CrossRef]
- Capurso, C.; Bellanti, F.; Lo Buglio, A.; Vendemiale, G. The Mediterranean Diet Slows Down the Progression of Aging and Helps to Prevent the Onset of Frailty: A Narrative Review. Nutrients 2019, 12, 35. [Google Scholar] [CrossRef]
- Lorenzo-López, L.; Maseda, A.; de Labra, C.; Regueiro-Folgueira, L.; Rodríguez-Villamil, J.L.; Millán-Calenti, J.C. Nutritional determinants of frailty in older adults: A systematic review. BMC Geriatr. 2017, 17, 108. [Google Scholar] [CrossRef]
- Martínez-Arnau, F.M.; Fonfría-Vivas, R.; Cauli, O. Beneficial Effects of Leucine Supplementation on Criteria for Sarcopenia: A Systematic Review. Nutrients 2019, 11, 2504. [Google Scholar] [CrossRef]
- Crow, R.S.; Lohman, M.C.; Titus, A.J.; Cook, S.B.; Bruce, M.L.; Mackenzie, T.A.; Bartels, S.J.; Batsis, J.A. Association of Obesity and Frailty in Older Adults: NHANES 1999–2004. J. Nutr. Health Aging 2019, 23, 138–144. [Google Scholar] [CrossRef] [PubMed]
- Lee, M.-M.; Jebb, S.A.; Oke, J.; Piernas, C. Reference values for skeletal muscle mass and fat mass measured by bioelectrical impedance in 390 565 UK adults. J. Cachexia Sarcopenia Muscle 2020, 11, 487–496. [Google Scholar] [CrossRef]
- Turner, G.; Clegg, A.; British Geriatrics Society; Age UK; Royal College of General Practioners. Best practice guidelines for the management of frailty: A British Geriatrics Society, Age UK and Royal College of General Practitioners report. Age Ageing 2014, 43, 744–747. [Google Scholar] [CrossRef] [PubMed]
- Dent, E.; Lien, C.; Lim, W.S.; Wong, W.C.; Wong, C.H.; Ng, T.P.; Woo, J.; Dong, B.; de la Vega, S.; Hua Poi, P.J.; et al. The Asia-Pacific Clinical Practice Guidelines for the Management of Frailty. J. Am. Med. Dir. Assoc. 2017, 18, 564–575. [Google Scholar] [CrossRef]
- Woo, J. Nutrition and Frailty. J. Nutr. Health Aging 2018, 22, 1025–1027. [Google Scholar] [CrossRef]
- Russell, M.K. Functional assessment of nutrition status. Nutr. Clin. Pract. 2015, 30, 211–218. [Google Scholar] [CrossRef]
- Zhang, Y.; Xu, X.-J.; Lian, T.-Y.; Huang, L.-F.; Zeng, J.-M.; Liang, D.-M.; Yin, M.-J.; Huang, J.-X.; Xiu, L.-C.; Yu, Z.-W.; et al. Development of frailty subtypes and their associated risk factors among the community-dwelling elderly population. Aging (Albany NY) 2020, 12, 1128. [Google Scholar] [CrossRef]
- Ahmed, T.; Haboubi, N. Assessment and management of nutrition in older people and its importance to health. Clin. Interv. Aging 2010, 5, 207–216. [Google Scholar]
- Folstein, M.F.; Folstein, S.E.; McHugh, P.R. “Mini-mental state”. A practical method for grading the cognitive state of patients for the clinician. J. Psychiatr. Res. 1975, 12, 189–198. [Google Scholar] [CrossRef]
- Mahoney, F.I.; Barthel, D.W. Functional Evaluation: The Barthel Index. Md State Med. J. 1965, 14, 61–65. [Google Scholar]
- Vergara, I.; Bilbao, A.; Orive, M.; Garcia-Gutierrez, S.; Navarro, G.; Quintana, J.M. Validation of the Spanish version of the Lawton IADL Scale for its application in elderly people. Health Qual. Life Outcomes 2012, 10, 130. [Google Scholar] [CrossRef]
- Guevara, C.R.; Lugo, L.H. Validez y confiabilidad de la Escala de Tinetti para población colombiana. Rev. Colomb. Reumatol. 2012, 19, 218–233. [Google Scholar] [CrossRef]
- Vellas, B.; Villars, H.; Abellan, G.; Soto, M.E.; Rolland, Y.; Guigoz, Y.; Morley, J.E.; Chumlea, W.; Salva, A.; Rubenstein, L.Z.; et al. Overview of the MNA—Its history and challenges. J. Nutr. Health Aging 2006, 10, 456–463; discussion 463–465. [Google Scholar]
- Hirase, T.; Inokuchi, S.; Matsusaka, N.; Nakahara, K.; Okita, M. A modified fall risk assessment tool that is specific to physical function predicts falls in community-dwelling elderly people. J. Geriatr. Phys. Ther. 2014, 37, 159–165. [Google Scholar] [CrossRef]
- Herdman, M.; Badia, X.; Berra, S. [EuroQol-5D: A simple alternative for measuring health-related quality of life in primary care]. Aten. Primaria 2001, 28, 425–430. [Google Scholar] [CrossRef]
- Kojima, G.; Iliffe, S.; Jivraj, S.; Walters, K. Association between frailty and quality of life among community-dwelling older people: A systematic review and meta-analysis. J. Epidemiol. Community Health 2016, 70, 716–721. [Google Scholar] [CrossRef]
- Kojima, G.; Taniguchi, Y.; Iliffe, S.; Jivraj, S.; Walters, K. Transitions between frailty states among community-dwelling older people: A systematic review and meta-analysis. Ageing Res. Rev. 2019, 50, 81–88. [Google Scholar] [CrossRef]
- Huang, C.-Y.; Lee, W.-J.; Lin, H.-P.; Chen, R.-C.; Lin, C.-H.; Peng, L.-N.; Chen, L.-K. Epidemiology of frailty and associated factors among older adults living in rural communities in Taiwan. Arch. Gerontol. Geriatr. 2019, 87, 103986. [Google Scholar] [CrossRef]
- He, B.; Ma, Y.; Wang, C.; Jiang, M.; Geng, C.; Chang, X.; Ma, B.; Han, L. Prevalence and Risk Factors for Frailty among Community-Dwelling Older People in China: A Systematic Review and Meta-Analysis. J. Nutr. Health Aging 2019, 23, 442–450. [Google Scholar] [CrossRef]
- Welch, A.A. Nutritional influences on age-related skeletal muscle loss. Proc. Nutr. Soc. 2014, 73, 16–33. [Google Scholar] [CrossRef]
- Zukeran, M.S.; Ritti-Dias, R.M.; Franco, F.G.M.; Cendoroglo, M.S.; de Matos, L.D.N.; Lima Ribeiro, S.M. Nutritional Risk by Mini Nutritional Assessment (MNA), but Not Anthropometric Measurements, Has a Good Discriminatory Power for Identifying Frailty in Elderly People: Data from Brazilian Secondary Care Clinic. J. Nutr. Health Aging 2019, 23, 217–220. [Google Scholar] [CrossRef]
- Ahmed, A.M.; Ahmed, D.; Alfaris, M.; Holmes, A.; Aljizeeri, A.; Al-Mallah, M.H. Prevalence and predictors of frailty in a high-income developing country: A cross-sectional study. Qatar Med. J. 2019, 2019, 20. [Google Scholar]
- Landré, B.; Czernichow, S.; Goldberg, M.; Zins, M.; Ankri, J.; Herr, M. Association Between Life-Course Obesity and Frailty in Older Adults: Findings in the GAZEL Cohort. Obesity (Silver Spring) 2020, 28, 388–396. [Google Scholar] [CrossRef]
- Soysal, P.; Veronese, N.; Arik, F.; Kalan, U.; Smith, L.; Isik, A.T. Mini Nutritional Assessment Scale-Short Form can be useful for frailty screening in older adults. Clin. Interv. Aging 2019, 14, 693–699. [Google Scholar] [CrossRef]
- Feng, Z.; Lugtenberg, M.; Franse, C.; Fang, X.; Hu, S.; Jin, C.; Raat, H. Risk factors and protective factors associated with incident or increase of frailty among community-dwelling older adults: A systematic review of longitudinal studies. PLoS ONE 2017, 12, e0178383. [Google Scholar] [CrossRef]
- Ruan, Y.; Guo, Y.; Kowal, P.; Lu, Y.; Liu, C.; Sun, S.; Huang, Z.; Zheng, Y.; Wang, W.; Li, G.; et al. Association between anemia and frailty in 13,175 community-dwelling adults aged 50 years and older in China. BMC Geriatr. 2019, 19, 327. [Google Scholar] [CrossRef]
- Caseiro, A.; Rocha, C.; Silva, A.M.; Ferreira, C.; Silva, I.; Clemente, M.; Cipriano, I.; Saraiva, M.; Barreira, R.; Azenha, J.; et al. Effects of A Personalized Intervention Program on the Biochemical and Hematological Profile in Community Dwelling Old Adults-The AGA@4life Intervention Model. Int. J. Environ. Res. Public Health 2020, 17, 718. [Google Scholar] [CrossRef]
- Kojima, G. Frailty as a Predictor of Future Falls Among Community-Dwelling Older People: A Systematic Review and Meta-Analysis. J. Am. Med. Dir. Assoc. 2015, 16, 1027–1033. [Google Scholar] [CrossRef]
- Cheng, M.-H.; Chang, S.-F. Frailty as a Risk Factor for Falls Among Community Dwelling People: Evidence From a Meta-Analysis. J. Nurs. Scholarsh. 2017, 49, 529–536. [Google Scholar] [CrossRef]
- Esbrí-Víctor, M.; Huedo-Rodenas, I.; López-Utiel, M.; Navarro-López, J.L.; Martínez-Reig, M.; Serra-Rexach, J.A.; Romero-Rizos, L.; Abizanda, P. Frailty and Fear of Falling: The FISTAC Study. J. Frailty Aging 2017, 6, 136–140. [Google Scholar]
- Lavedán, A.; Viladrosa, M.; Jürschik, P.; Botigué, T.; Nuín, C.; Masot, O.; Lavedán, R. Fear of falling in community-dwelling older adults: A cause of falls, a consequence, or both? PLoS ONE 2018, 13, e0194967. [Google Scholar] [CrossRef]
- Tarazona-Santabalbina, F.J.; Gómez-Cabrera, M.C.; Pérez-Ros, P.; Martínez-Arnau, F.M.; Cabo, H.; Tsaparas, K.; Salvador-Pascual, A.; Rodriguez-Mañas, L.; Viña, J. A Multicomponent Exercise Intervention that Reverses Frailty and Improves Cognition, Emotion, and Social Networking in the Community-Dwelling Frail Elderly: A Randomized Clinical Trial. J. Am. Med. Dir. Assoc. 2016, 17, 426–433. [Google Scholar] [CrossRef]
- Pérez-Ros, P.; Martínez-Arnau, F.M.; Tarazona-Santabalbina, F.J. Risk Factors and Number of Falls as Determinants of Quality of Life of Community-Dwelling Older Adults. J. Geriatr. Phys. Ther. 2019, 42, 63–72. [Google Scholar] [CrossRef]
- Suthutvoravut, U.; Tanaka, T.; Takahashi, K.; Akishita, M.; Iijima, K. Living with Family yet Eating Alone is Associated with Frailty in Community-Dwelling Older Adults: The Kashiwa Study. J. Frailty Aging 2019, 8, 198–204. [Google Scholar]
- Jayanama, K.; Theou, O.; Blodgett, J.M.; Cahill, L.; Rockwood, K. Frailty, nutrition-related parameters, and mortality across the adult age spectrum. BMC Med. 2018, 16, 188. [Google Scholar]


| Robust Group (n = 91) | Prefrail/Frail Group (n = 473) | p-Value * | ||
|---|---|---|---|---|
| Gender | Women | 31 (34.1) | 325 (68.7) | <0.001 |
| Men | 60 (65.9) | 148 (31.3) | ||
| Cohabitation | Partner | 70 (76.9) | 288 (60.9) | <0.001 |
| Alone | 15 (16.5) | 141 (29.8) | ||
| Children or other relatives | 6 (6.6) | 44 (9.3) | ||
| Physical activity | <3 h/week | 0 (0) | 228 (48.2) | <0.001 |
| 3–6 h/week | 41 (45.1) | 141 (29.8) | ||
| >6 h/week | 50 (54.9) | 104 (22) | ||
| Comorbidity | Hypertension | 60 (65.9) | 310 (65.5) | 0.942 |
| Diabetes mellitus | 20 (22) | 142 (30) | 0.120 | |
| Hyperlipidemia | 36 (36.9) | 207 (43.8) | 0.458 | |
| Metabolic syndrome | 14 (15.4) | 89 (18.8) | 0.438 | |
| Variable | Robust N = 91 | Prefrail/Frail N = 473 | |||
|---|---|---|---|---|---|
| Mean (SD) | Mean (SD) | Mean Difference | 95% CI | p-Value * | |
| Age, years | 74.37 (3.23) | 76.37 (4.02) | −1.99 | −2.76, −1.23 | <0.001 |
| Daily prescribed drugs, n | 3.91 (2.61) | 4.86 (3.09) | −0.95 | −1.63, −0.27 | 0.006 |
| Barthel, points 1 | 94.89 (7.96) | 93.45 (9.87) | 1.44 | −0.71, 3.60 | 0.189 |
| Lawton, points 2 | 7.46 (0.95) | 7.30 (1.17) | 0.17 | −0.06, 0.39 | 0.145 |
| Tinetti, points 3 | 25.96 (3.23) | 25.75 (3.36) | 0.20 | −0.55, 0.95 | 0.595 |
| MMSE, points 4 | 27.45 (1.50) | 27.87 (1.69) | −0.42 | −1.14, 0.31 | 0.261 |
| Falls over previous 12 months, n | 0.23 (0.67) | 0.79 (1.41) | −0.56 | −0.75, −0.37 | <0.001 |
| FES-I, points 5 | 10.90 (11.78) | 20.27 (17.07) | −9.37 | −12.26, −6.48 | <0.001 |
| EQ-5D Index, points 6 | 0.80 (0.22) | 0.79 (0.22) | 0.01 | −0.43, 0.06 | 0.787 |
| EQ-5D VAS, points 7 | 75.82 (20.29) | 74.94 (20.77) | 0.89 | −3.77, 5.55 | 0.708 |
| Variable | Robust Group | Prefrail/Frail Group | Mean Difference | 95% CI | p-Value * | ||
|---|---|---|---|---|---|---|---|
| N | Mean (SD) | n | Mean (SD) | ||||
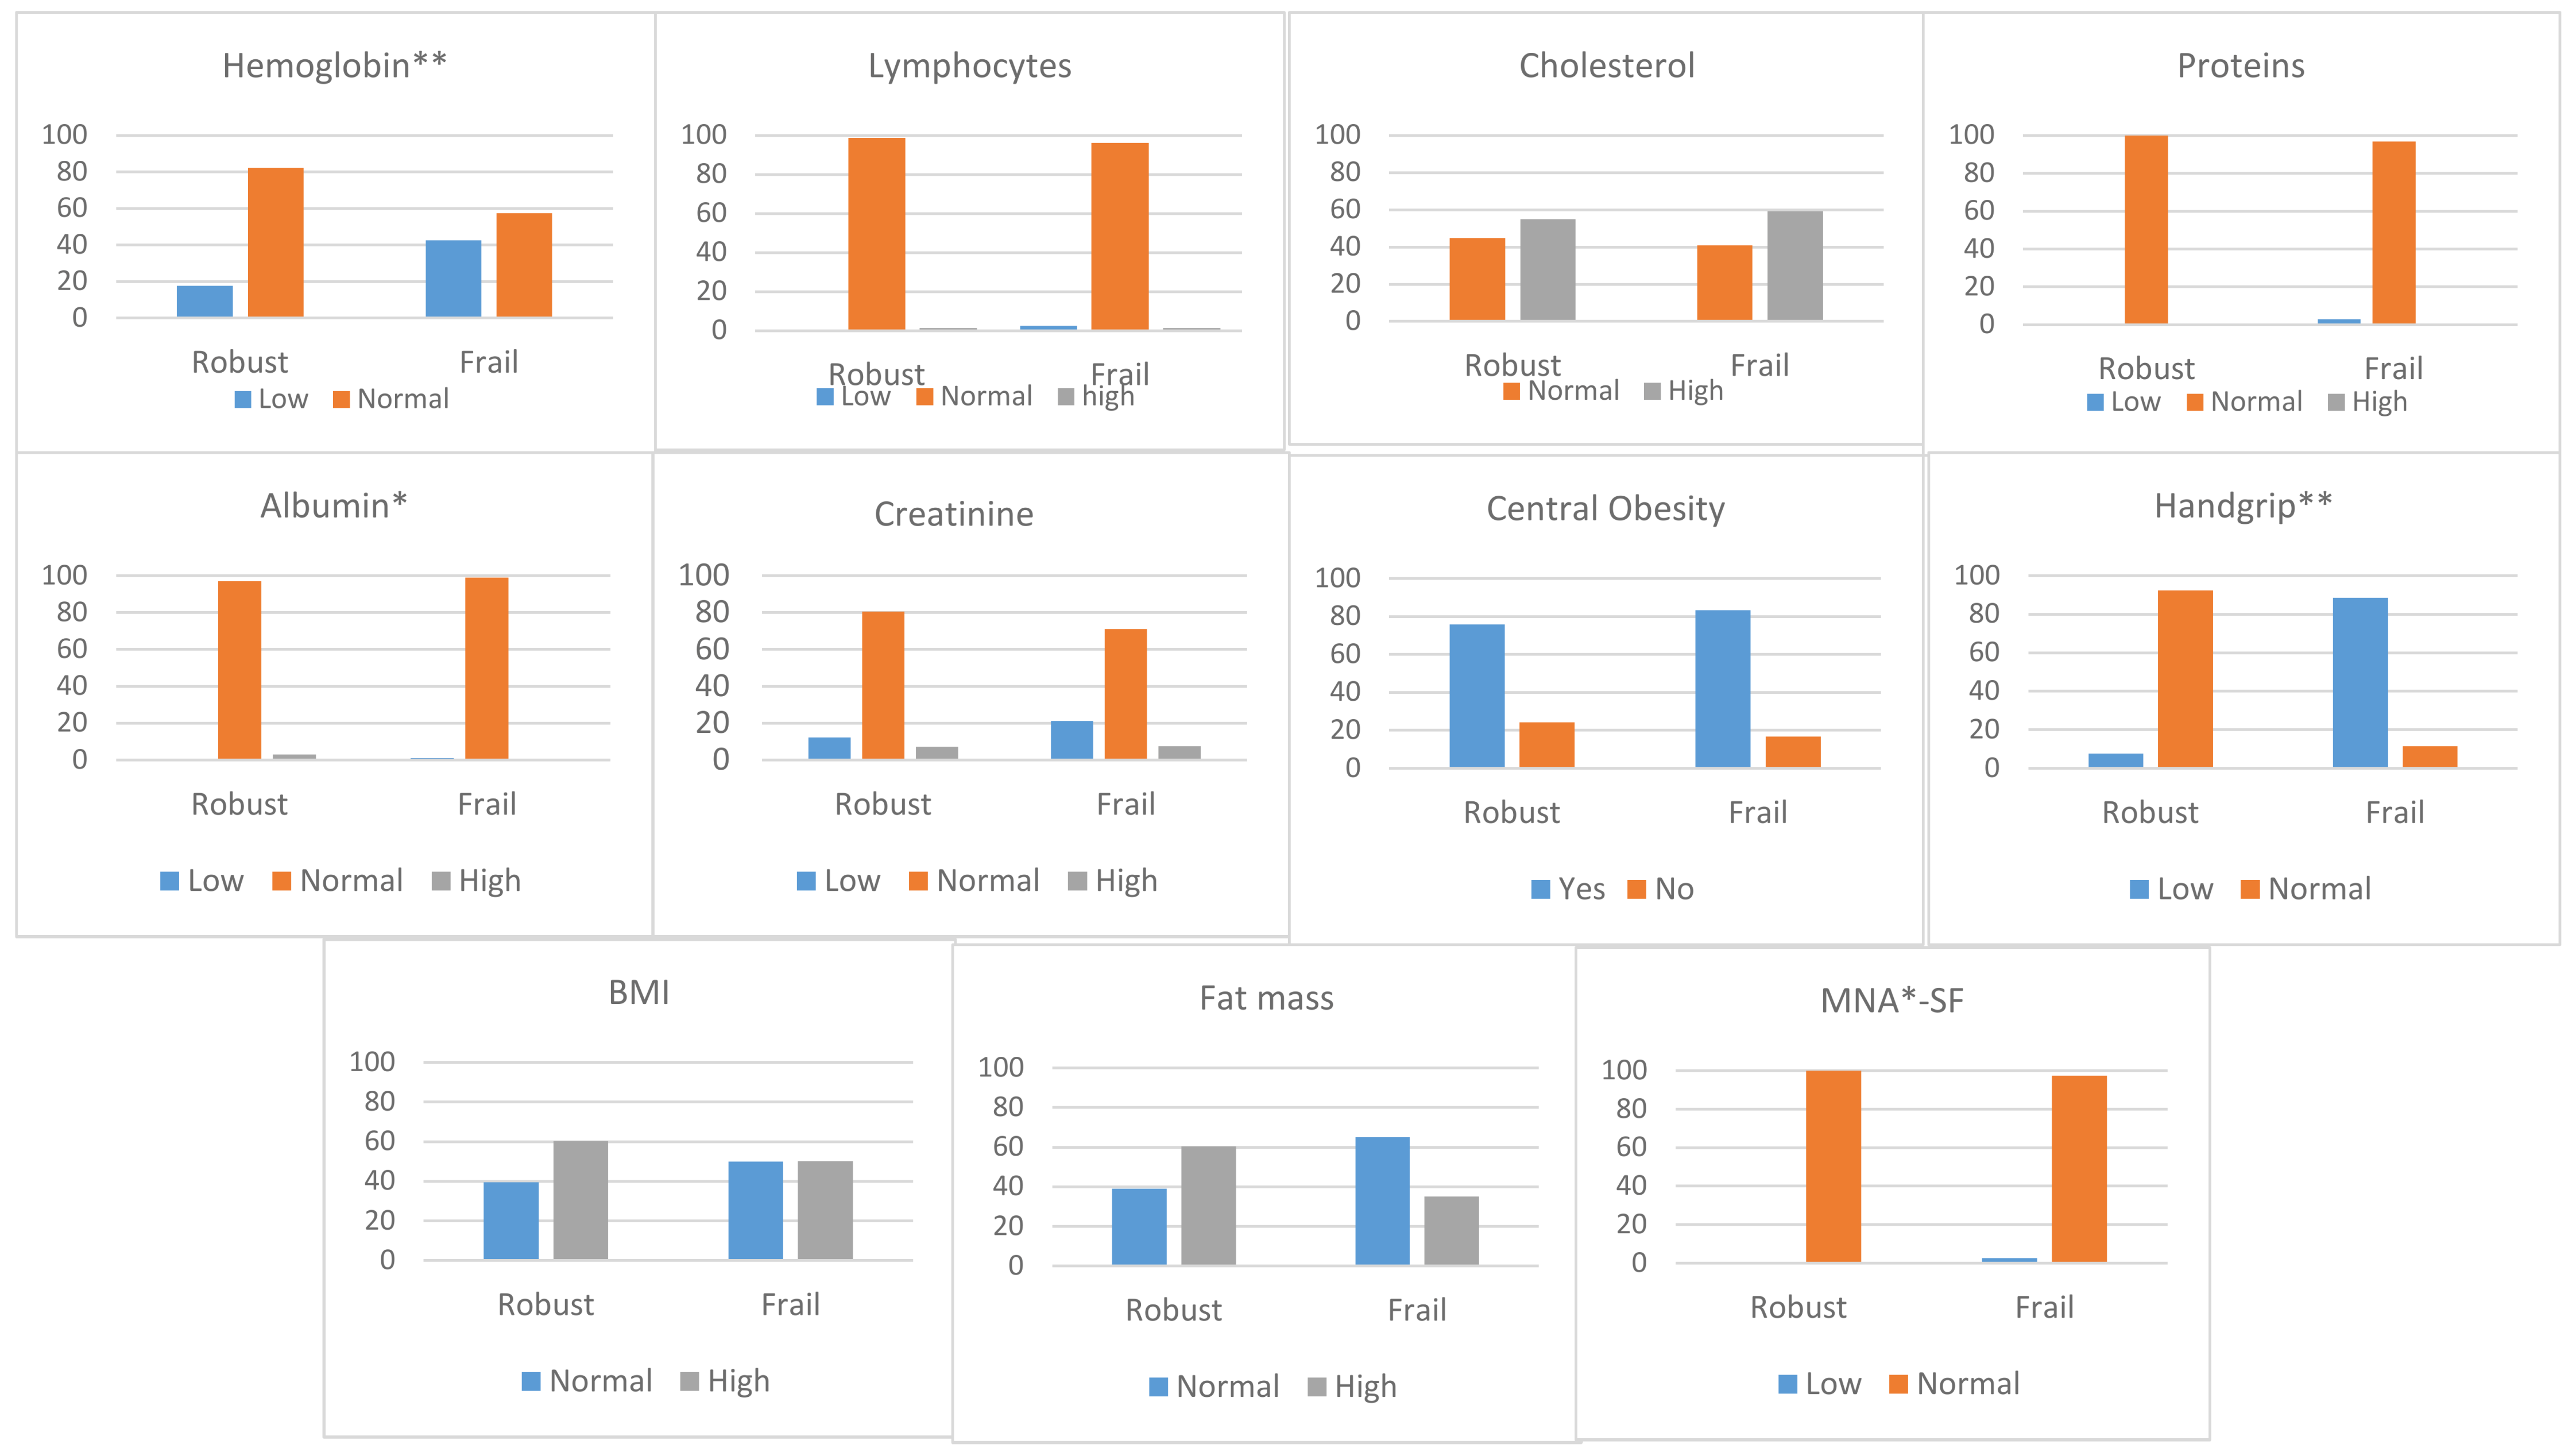
| MNA-SF, points 1 | 91 | 13.69 (0.49) | 473 | 13.55 (0.73) | 0.14 | 0.02, 0.27 | 0.019 |
| Hemoglobin, g/dL | 79 | 14.69 (1.38) | 413 | 13.63 (1.42) | 1.06 | 0.71, 1.40 | <0.001 |
| Total lymphocyte count, ×103/mm3 | 79 | 2.26 (0.84) | 407 | 2.32(2.43) | −0.05 | −0.60, 0.49 | 0.850 |
| Total cholesterol, mg/dL | 78 | 194.95 (35.21) | 400 | 192.15 (36.94) | 2.80 | −6.12, 11.72 | 0.537 |
| Total proteins, mg/dL | 64 | 7.06 (0.34) | 345 | 7.32 (5.05) | −0.25 | −1.50, 0.99 | 0.690 |
| Albumin, mg/dL | 34 | 4.56 (0.45) | 196 | 4.37 (0.83) | 0.18 | −0.11, 0.47 | 0.220 |
| Creatinine, mg/dL | 82 | 1.00 (0.25) | 423 | 0.95 (0.38) | 0.05 | −0.04, 0.13 | 0.261 |
| BMI, kg/m2 | 91 | 29.08 (3.45) | 473 | 30.25 (4.61) | −1.16 | −1.99, −0.34 | 0.006 |
| Waist circumference, cm | 91 | 103.76 (9.37) | 473 | 104.18 (11.66) | −0.42 | −2.63, 1.79 | 0.709 |
| Brachial circumference, cm | 91 | 30.12 (3.15) | 473 | 30.60 (3.78) | −0.48 | −1.22, 0.25 | 0.197 |
| Thigh circumference, cm | 91 | 46.63 (4.93) | 473 | 47.23 (6.68) | −0.60 | −2.05, 0.84 | 0.411 |
| Handgrip strength, kg | 91 | 31.17 (6.85) | 473 | 18.29 (7.57) | 12.88 | 11.20, 14.55 | <0.001 |
| Body fat % | 91 | 34.64 (6.49) | 471 | 39.40 (7.07) | −4.77 | −6.34, −3.20 | <0.001 |
| Factor | Crude OR (95% CI) | p Value * | Adjusted OR (95% CI) | p Value ** |
|---|---|---|---|---|
| Female gender | 1.25 (2.64, 6.83) | <0.001 | 2.37 (1.24, 4.53) | 0.009 |
| Age > 75 | 2.33 (1.46, 3.71) | <0.001 | 3.31 (1.76, 6.21) | <0.001 |
| Living at home alone | 2.15(1.19, 3.87) | 0.007 | ns | |
| Hypertension | 0.98 (0.61, 1.57) | ns | ||
| Diabetes mellitus | 1.52 (0.89, 2.59) | ns | ||
| Hyperlipidemia | 1.19 (0.75, 1.88) | ns | ||
| Metabolic syndrome | 1.27 (0.69, 2.35) | ns | ||
| ≥3 comorbidities | 1.27 (0.69, 2.35) | ns | ||
| Polypharmacy (≥ 5 drugs per day) | 1.65 (1.03, 2.62) | 0.032 | ns | |
| Activities of Daily Living, Barthel <90 points | 1.71 (0.23, 3.56) | ns | ||
| Instrumental. Activities of Daily Living Lawton ≤ 4 points | 0.96 (0.11, 8.33) | ns | ||
| Gait and speed, Tinetti < 25 points | 1.24 (0.77, 2.08) | ns | ||
| Previous fall in the last 12 months | 3.89 (2.1, 7.19) | <0.001 | 1.91 (1.13, 3.25) | 0.016 |
| Fear of falling, FES-I ≥ 20 points | 4.88 (2.53, 9.14) | <0.001 | 4.01 (1.76, 9.16) | 0.001 |
| Hemoglobin, low | 3.45 (1.87, 6.34) | <0.001 | 2.45 (1.19, 5.03) | 0.015 |
| Central obesity | 1.59 (0.93, 2.72) | ns | ns | |
| Obesity (BMI ≥ 30 kg/m2) | 1.52 (0.96, 2.40) | ns | ns | |
| Body fat percentage, high | 1.21 (0.76, 1.92) | ns | ||
| Physical activity (≥3 h/week) | 0.31 (0.12, 0.38) | <0.001 | 0.23 (0.15, 0.35) | <0.001 |
© 2020 by the authors. Licensee MDPI, Basel, Switzerland. This article is an open access article distributed under the terms and conditions of the Creative Commons Attribution (CC BY) license (http://creativecommons.org/licenses/by/4.0/).
Share and Cite
Pérez-Ros, P.; Vila-Candel, R.; López-Hernández, L.; Martínez-Arnau, F.M. Nutritional Status and Risk Factors for Frailty in Community-Dwelling Older People: A Cross-Sectional Study. Nutrients 2020, 12, 1041. https://doi.org/10.3390/nu12041041
Pérez-Ros P, Vila-Candel R, López-Hernández L, Martínez-Arnau FM. Nutritional Status and Risk Factors for Frailty in Community-Dwelling Older People: A Cross-Sectional Study. Nutrients. 2020; 12(4):1041. https://doi.org/10.3390/nu12041041
Chicago/Turabian StylePérez-Ros, Pilar, Rafael Vila-Candel, Lourdes López-Hernández, and Francisco Miguel Martínez-Arnau. 2020. "Nutritional Status and Risk Factors for Frailty in Community-Dwelling Older People: A Cross-Sectional Study" Nutrients 12, no. 4: 1041. https://doi.org/10.3390/nu12041041
APA StylePérez-Ros, P., Vila-Candel, R., López-Hernández, L., & Martínez-Arnau, F. M. (2020). Nutritional Status and Risk Factors for Frailty in Community-Dwelling Older People: A Cross-Sectional Study. Nutrients, 12(4), 1041. https://doi.org/10.3390/nu12041041