Impact of Vigorous-Intensity Physical Activity on Body Composition Parameters, Lipid Profile Markers, and Irisin Levels in Adolescents: A Cross-Sectional Study

 ,
,  ,
,  , ,
, , 
Abstract
1. Introduction
2. Materials and Methods
2.1. Study Population
2.2. Nutritional History Assessment
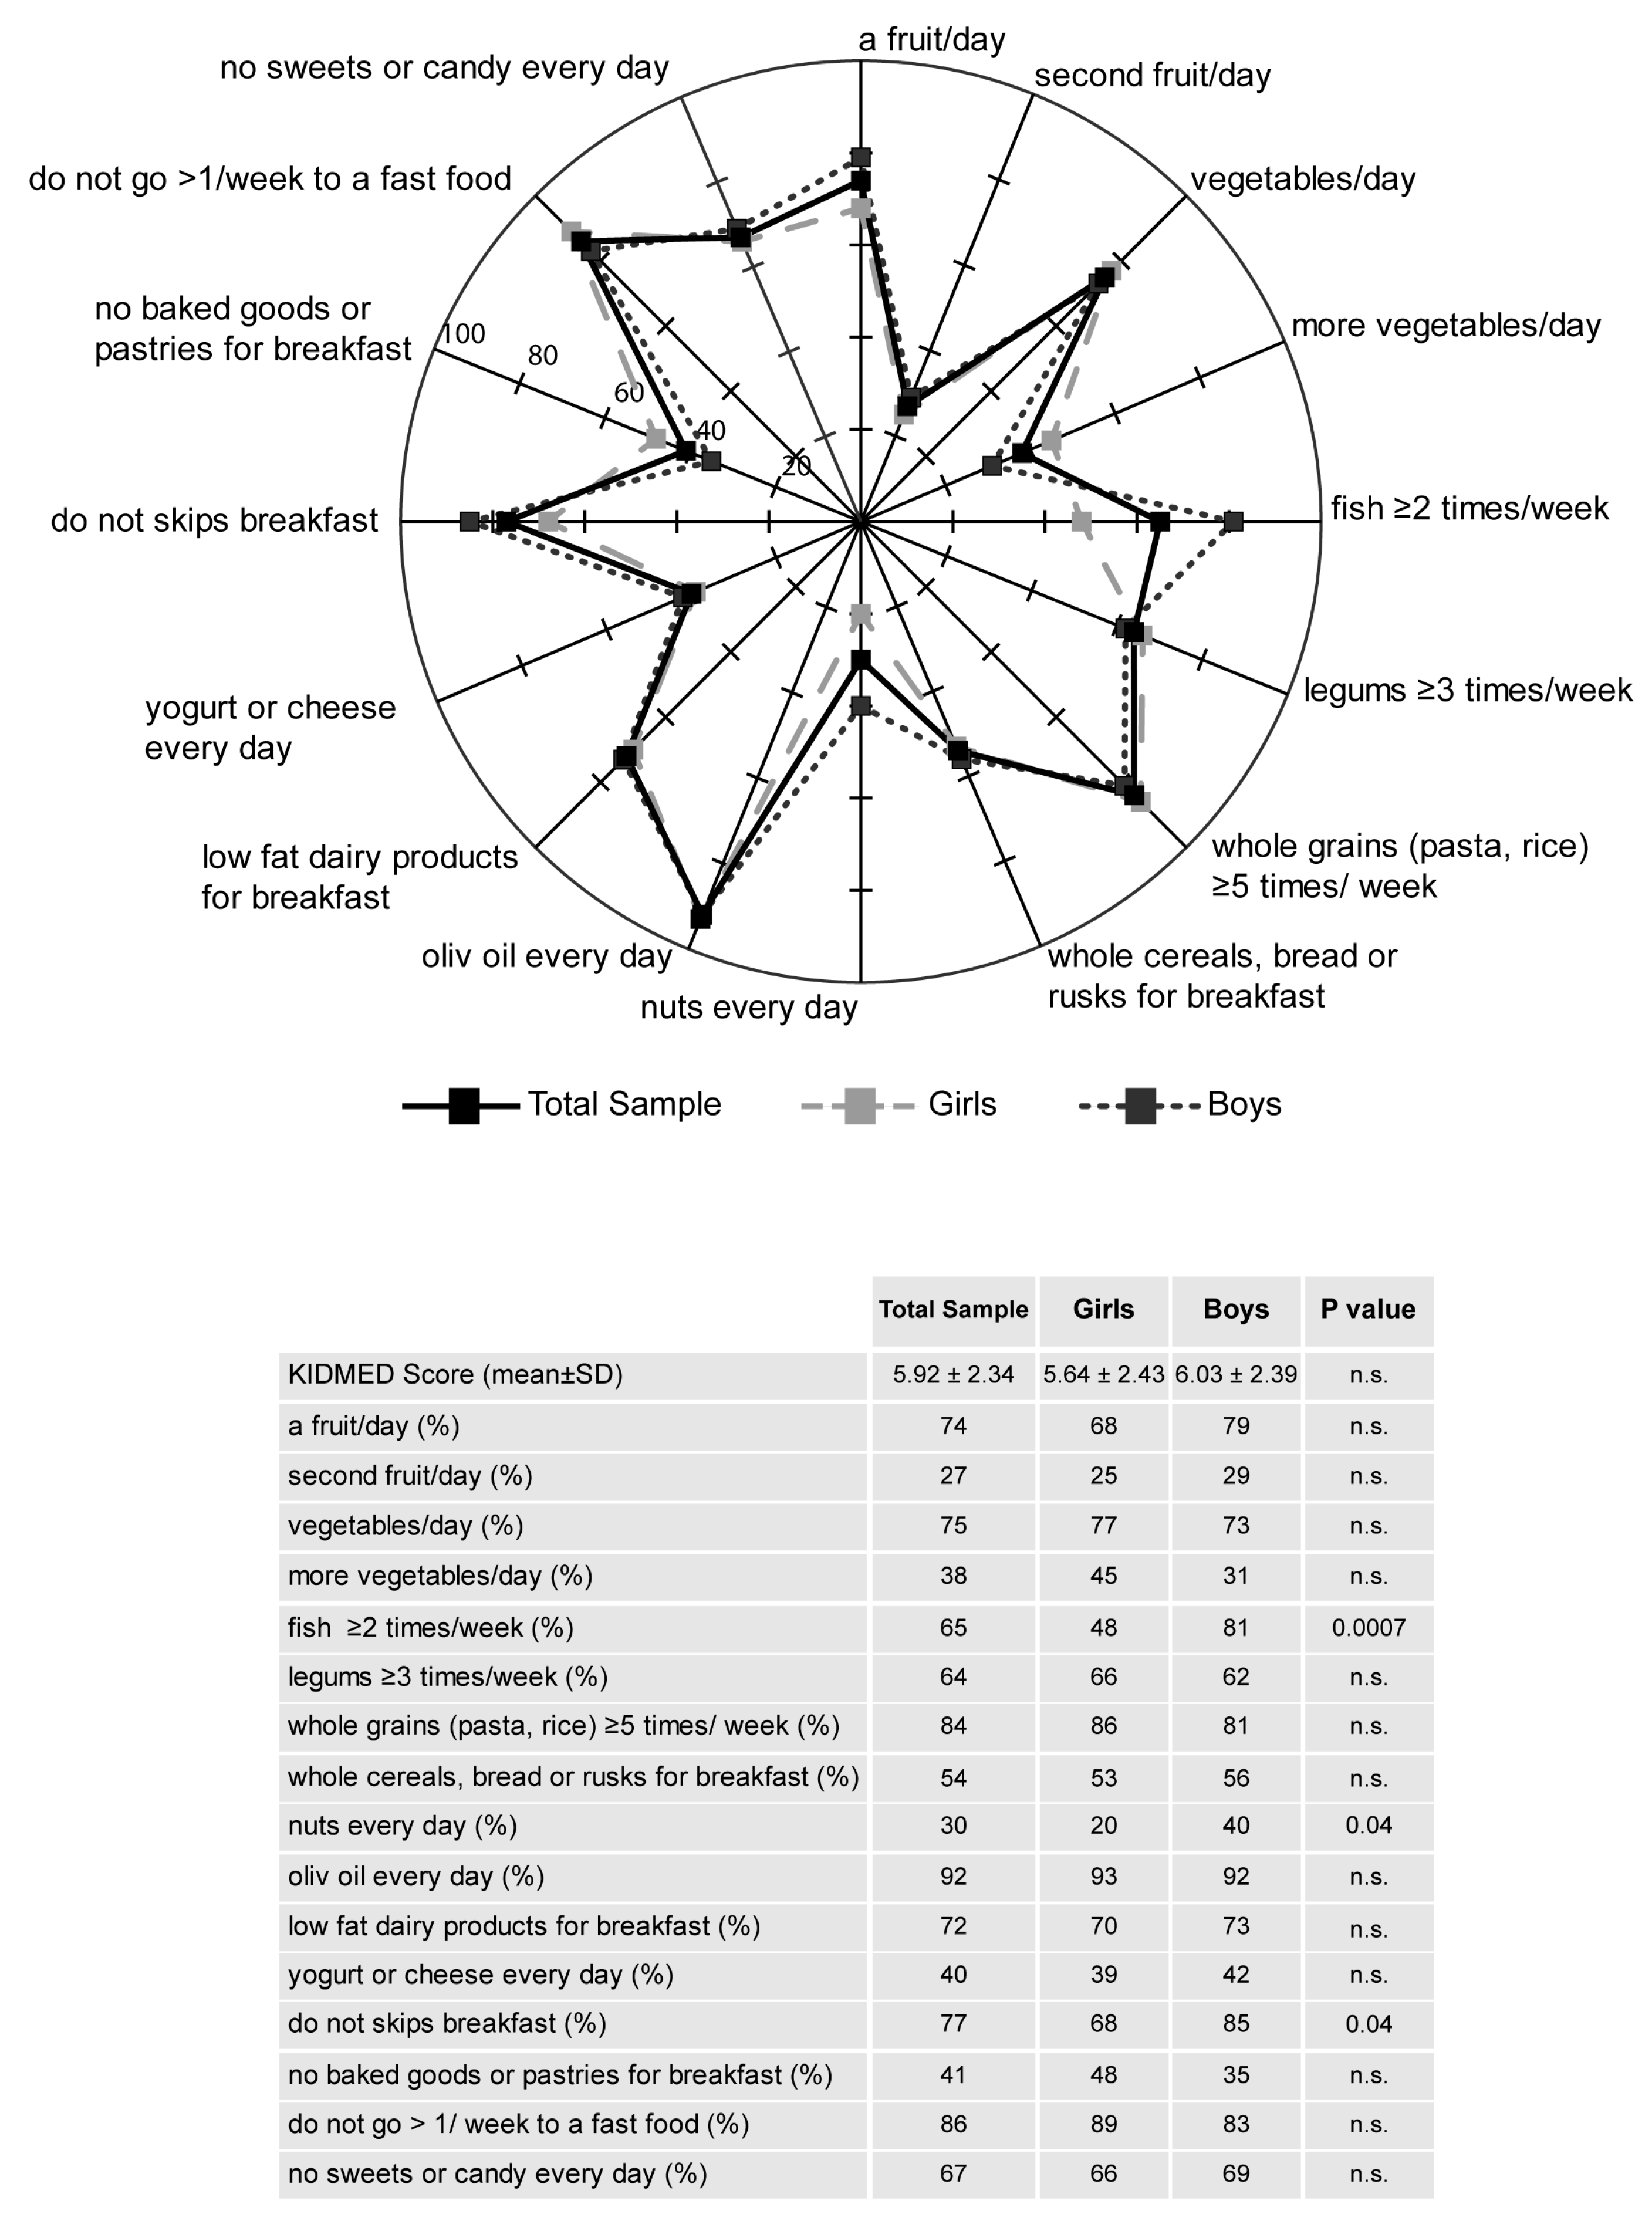
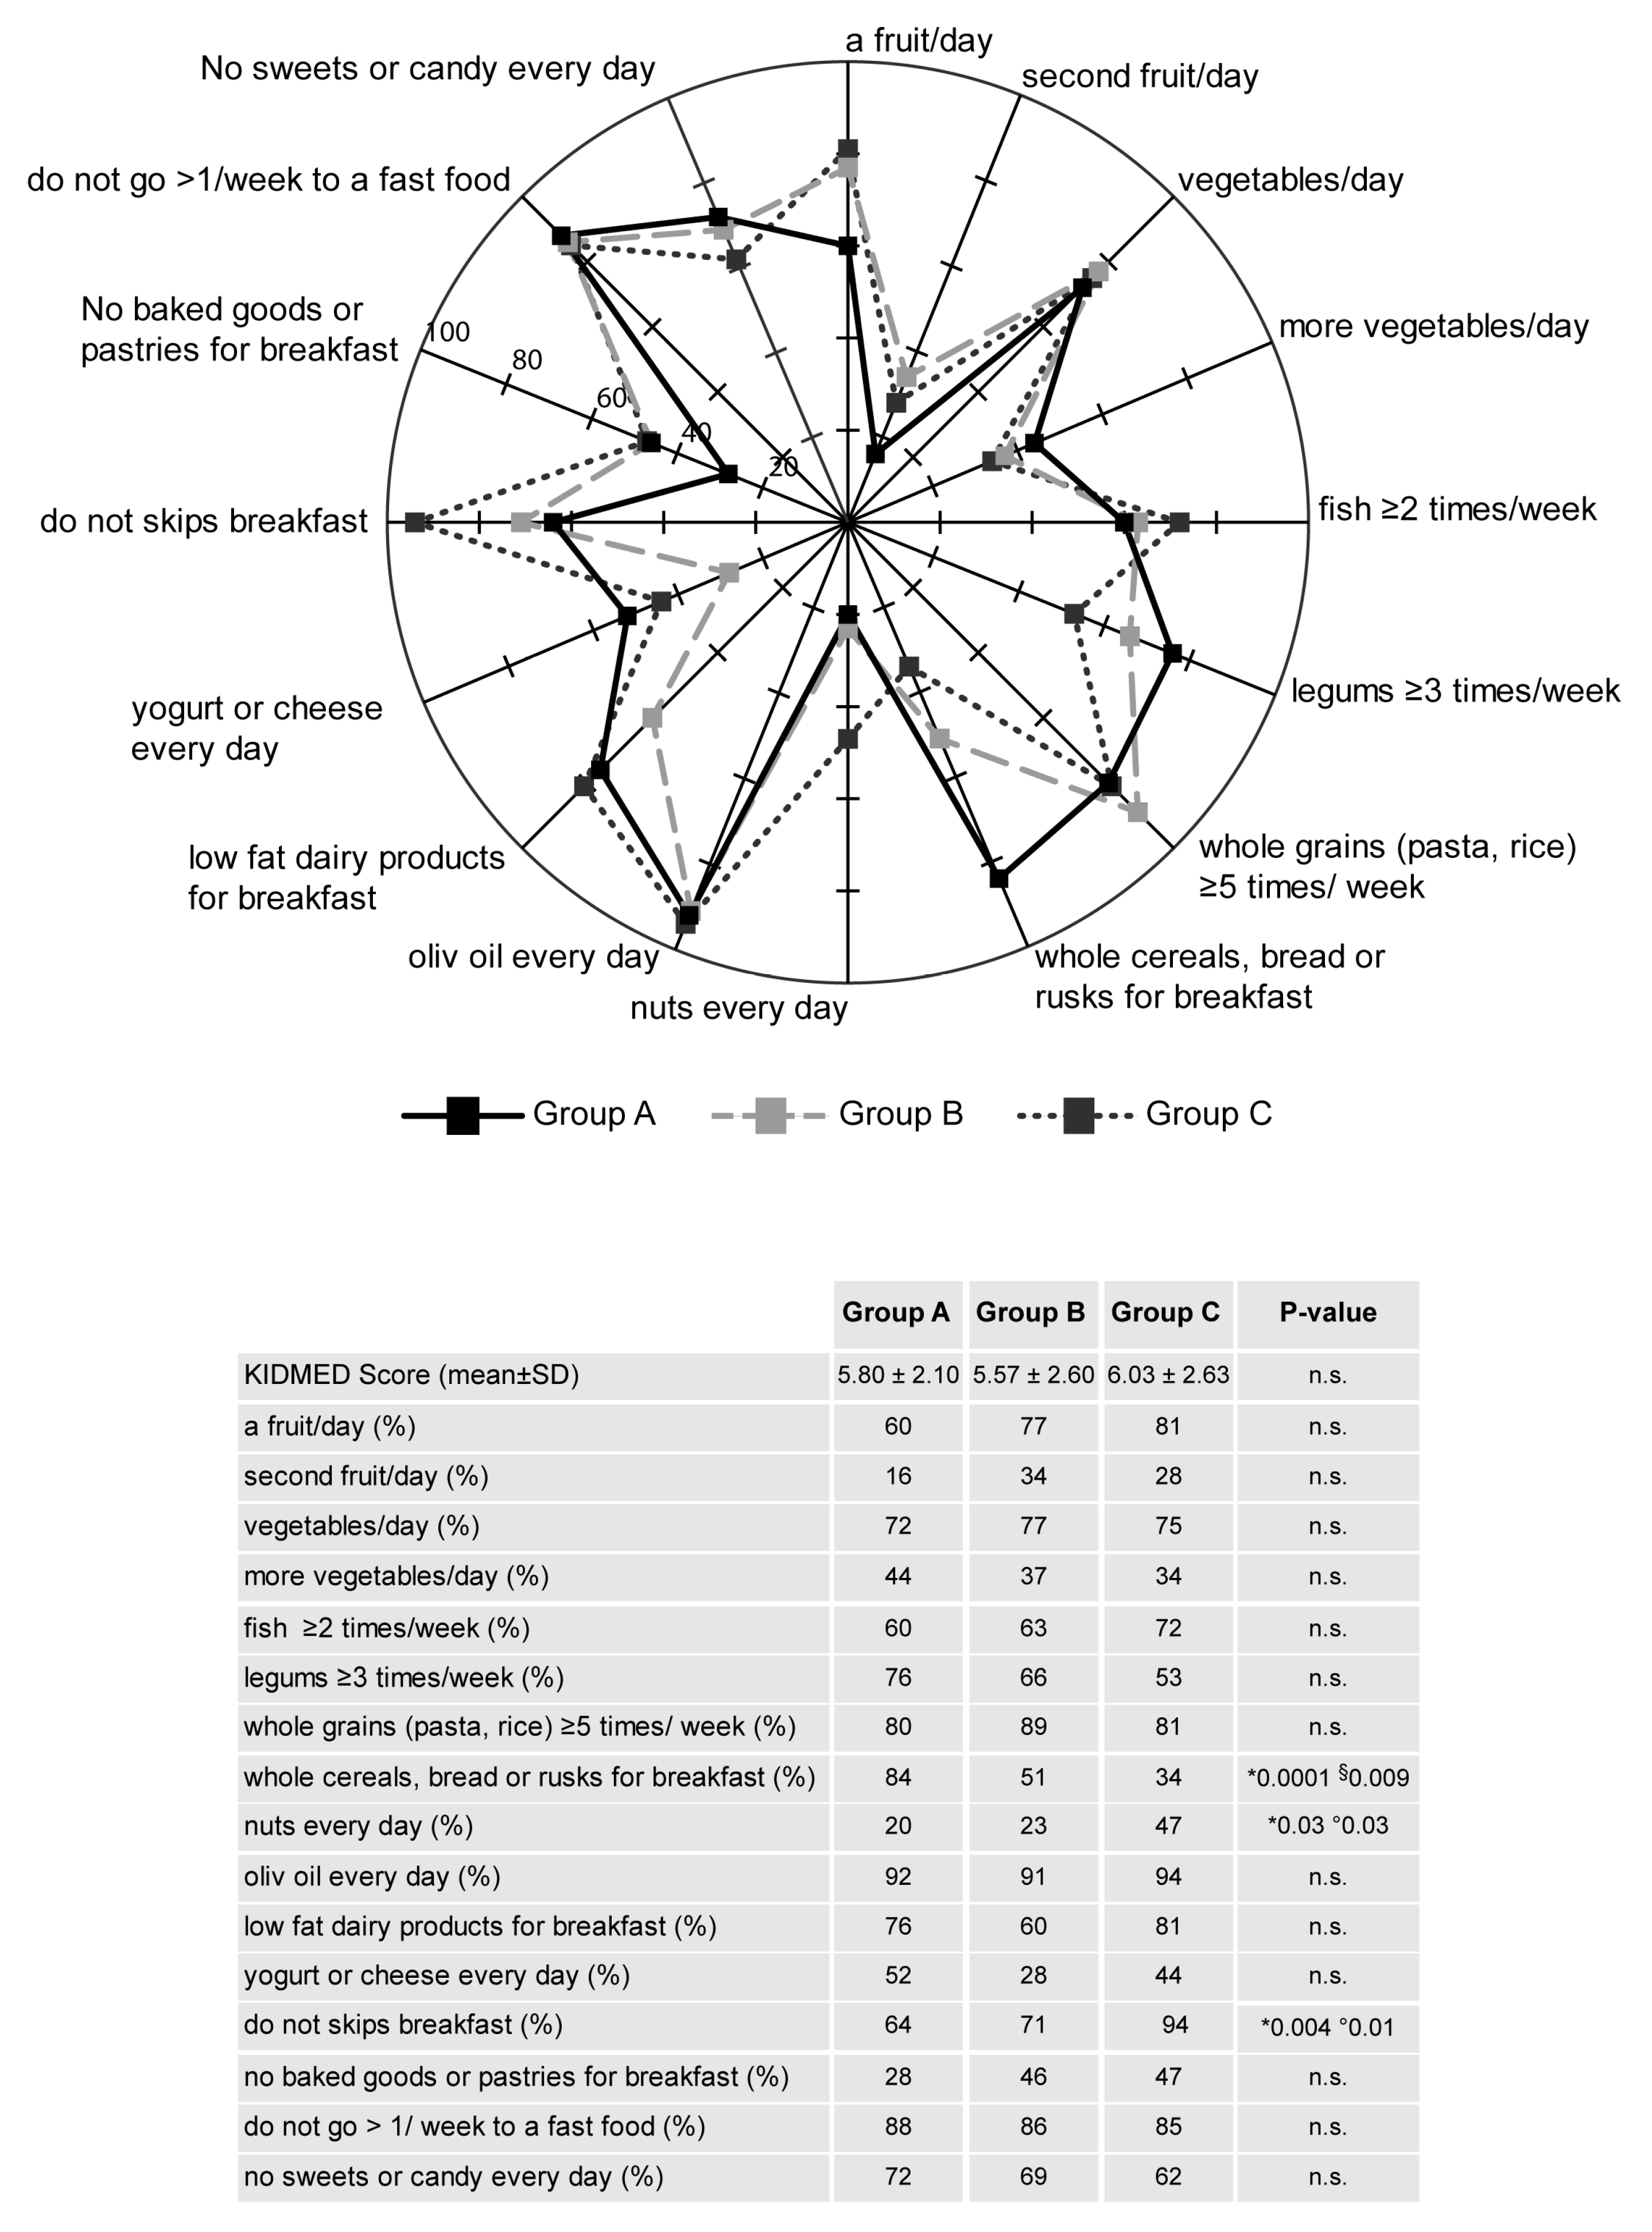
2.3. Questionnaire of Adherence to the Mediterranean Diet (KIDMED Test)
2.4. Anthropometric Parameters
2.5. Bioelectrical Impedance Analysis
2.6. Biochemical Measurements
2.7. Hormonal Level Assessments
2.8. Statistical Analysis
3. Results
4. Discussion
5. Conclusions
Supplementary Materials
Author Contributions
Funding
Acknowledgments
Conflicts of Interest
References
- Lake, A.A.; Mathers, J.C.; Rugg-Gunn, A.J.; Adamson, A.J. Longitudinal change in food habits between adolescence (11–12 years) and adulthood (32–33 years): The ASH30 Study. J. Public Health 2006, 28, 10–16. [Google Scholar] [CrossRef] [PubMed]
- Delgado, A.M.; Vaz Almeida, M.D.; Parisi, S. Food and Nutrient Features of the Mediterranean Diet; Springer: Cham, Switzerland, 2017. [Google Scholar]
- Bach-Faig, A.; Berry, E.M.; Lairon, D.; Reguant, J.; Trichopoulou, A.; Dernini, S.; Medina, F.X.; Battino, M.; Belahsen, R.; Miranda, G.; et al. Mediterranean Diet Foundation Expert, G. Mediterranean diet pyramid today. Science and cultural updates. Public Health Nutr. 2011, 14, 2274–2284. [Google Scholar] [CrossRef] [PubMed]
- Mediterranean food consumption patterns: Diet, environment, society, economy and health. In A White Paper Priority 5 of Feeding Knowledge Programme, Expo Milan 2015; CIHEAM, FAO, Eds.; CIHEAM-IAMB: Rome, Italy, 2015. [Google Scholar]
- Serra-Majem, L.; Roman, B.; Estruch, R. Scientific evidence of interventions using the Mediterranean diet: A systematic review. Nutr. Rev. 2006, 64, S27–S47. [Google Scholar] [CrossRef]
- Sofi, F.; Cesari, F.; Abbate, R.; Gensini, G.F.; Casini, A. Adherence to Mediterranean diet and health status: Meta-analysis. BMJ 2008, 337, a1344. [Google Scholar] [CrossRef] [PubMed]
- Martinez-Gonzalez, M.A.; Bes-Rastrollo, M.; Serra-Majem, L.; Lairon, D.; Estruch, R.; Trichopoulou, A. Mediterranean food pattern and the primary prevention of chronic disease: Recent developments. Nutr. Rev. 2009, 67 (Suppl. 1), S111–S116. [Google Scholar] [CrossRef] [PubMed]
- Schwingshackl, L.; Schwedhelm, C.; Galbete, C.; Hoffmann, G. Adherence to Mediterranean Diet and Risk of Cancer: An Updated Systematic Review and Meta-Analysis. Nutrients 2017, 9, 1063. [Google Scholar] [CrossRef]
- Garcia Cabrera, S.; Herrera Fernandez, N.; Rodriguez Hernandez, C.; Nissensohn, M.; Roman-Vinas, B.; Serra-Majem, L. Kidmed Test; Prevalence of Low Adherence to the Mediterranean Diet in Children and Young; a Systematic Review. Nutr. Hosp. 2015, 32, 2390–2399. [Google Scholar] [CrossRef]
- Caspersen, C.J.; Merritt, R.K. Physical activity trends among 26 states, 1986–1990. Med. Sci. Sports Exerc. 1995, 27, 713–720. [Google Scholar] [CrossRef]
- Thivel, D.; Tremblay, A.; Genin, P.M.; Panahi, S.; Riviere, D.; Duclos, M. Physical Activity, Inactivity, and Sedentary Behaviors: Definitions and Implications in Occupational Health. Front. Public Health 2018, 6, 288. [Google Scholar] [CrossRef]
- Longmuir, P.; Colley, R.; Wherley, V.; Tremblay, M. Risks and benefits of childhood physical activity. Lancet Diabetes Endocrinol. 2014, 2, 861–862. [Google Scholar] [CrossRef]
- Tremblay, M.S.; Gray, C.E.; Akinroye, K.; Harrington, D.M.; Katzmarzyk, P.T.; Lambert, E.V.; Liukkonen, J.; Maddison, R.; Ocansey, R.T.; Onywera, V.O.; et al. Physical activity of children: A global matrix of grades comparing 15 countries. J. Phys. Act. Health 2014, 11, S113–S125. [Google Scholar] [CrossRef] [PubMed]
- Tremblay, M.S.; Barnes, J.D.; Gonzalez, S.A.; Katzmarzyk, P.T.; Onywera, V.O.; Reilly, J.J.; Tomkinson, G.R.; Global Matrix 2.0 Research, Team. Global Matrix 2.0: Report Card Grades on the Physical Activity of Children and Youth Comparing 38 Countries. J. Phys. Act. Health 2016, 13, S343–S366. [Google Scholar] [CrossRef] [PubMed]
- Berrington de Gonzalez, A.; Hartge, P.; Cerhan, J.R.; Flint, A.J.; Hannan, L.; MacInnis, R.J.; Moore, S.C.; Tobias, G.S.; Anton-Culver, H.; Freeman, L.B.; et al. Body-mass index and mortality among 1.46 million white adults. N. Engl. J. Med. 2010, 363, 2211–2219. [Google Scholar] [CrossRef] [PubMed]
- de Onis, M.; Blossner, M.; Borghi, E. Global prevalence and trends of overweight and obesity among preschool children. Am. J. Clin. Nutr. 2010, 92, 1257–1264. [Google Scholar] [CrossRef] [PubMed]
- Global Action Plan on Physical Activity 2018–2030: More Active People for a Healthier World; World Health Organization, Ed.; WHO: Geneva, Switzerland, 2018. [Google Scholar]
- Golden, N.H.; Abrams, S.A.; Committee on, N. Optimizing bone health in children and adolescents. Pediatrics 2014, 134, e1229–e1243. [Google Scholar] [CrossRef]
- Janz, K.F.; Burns, T.L.; Levy, S.M.; Iowa Bone Development, S. Tracking of activity and sedentary behaviors in childhood: The Iowa Bone Development Study. Am. J. Prev. Med. 2005, 29, 171–178. [Google Scholar] [CrossRef]
- Ekelund, U.; Anderssen, S.A.; Froberg, K.; Sardinha, L.B.; Andersen, L.B.; Brage, S.; European Youth Heart Study, G. Independent associations of physical activity and cardiorespiratory fitness with metabolic risk factors in children: The European youth heart study. Diabetologia 2007, 50, 1832–1840. [Google Scholar] [CrossRef]
- Egan, B.; Zierath, J.R. Exercise metabolism and the molecular regulation of skeletal muscle adaptation. Cell Metab. 2013, 17, 162–184. [Google Scholar] [CrossRef]
- Pedersen, B.K.; Febbraio, M.A. Muscles, exercise and obesity: Skeletal muscle as a secretory organ. Nat. Rev. Endocrinol. 2012, 8, 457–465. [Google Scholar] [CrossRef]
- Bostrom, P.; Wu, J.; Jedrychowski, M.P.; Korde, A.; Ye, L.; Lo, J.C.; Rasbach, K.A.; Bostrom, E.A.; Choi, J.H.; Long, J.Z.; et al. A PGC1-alpha-dependent myokine that drives brown-fat-like development of white fat and thermogenesis. Nature 2012, 481, 463–468. [Google Scholar] [CrossRef]
- Huh, J.Y.; Panagiotou, G.; Mougios, V.; Brinkoetter, M.; Vamvini, M.T.; Schneider, B.E.; Mantzoros, C.S. FNDC5 and irisin in humans: I. Predictors of circulating concentrations in serum and plasma and II. mRNA expression and circulating concentrations in response to weight loss and exercise. Metabolism 2012, 61, 1725–1738. [Google Scholar] [CrossRef] [PubMed]
- Kraemer, R.R.; Shockett, P.; Webb, N.D.; Shah, U.; Castracane, V.D. A transient elevated irisin blood concentration in response to prolonged, moderate aerobic exercise in young men and women. Horm. Metab. Res. 2014, 46, 150–154. [Google Scholar] [CrossRef] [PubMed]
- Nygaard, H.; Slettalokken, G.; Vegge, G.; Hollan, I.; Whist, J.E.; Strand, T.; Ronnestad, B.R.; Ellefsen, S. Irisin in blood increases transiently after single sessions of intense endurance exercise and heavy strength training. PLoS ONE 2015, 10, e0121367. [Google Scholar] [CrossRef] [PubMed]
- Loffler, D.; Muller, U.; Scheuermann, K.; Friebe, D.; Gesing, J.; Bielitz, J.; Erbs, S.; Landgraf, K.; Wagner, I.V.; Kiess, W.; et al. Serum irisin levels are regulated by acute strenuous exercise. J. Clin. Endocrinol. Metab. 2015, 100, 1289–1299. [Google Scholar] [CrossRef]
- Tsuchiya, Y.; Ando, D.; Takamatsu, K.; Goto, K. Resistance exercise induces a greater irisin response than endurance exercise. Metabolism 2015, 64, 1042–1050. [Google Scholar] [CrossRef]
- Pekkala, S.; Wiklund, P.K.; Hulmi, J.J.; Ahtiainen, J.P.; Horttanainen, M.; Pollanen, E.; Makela, K.A.; Kainulainen, H.; Hakkinen, K.; Nyman, K.; et al. Are skeletal muscle FNDC5 gene expression and irisin release regulated by exercise and related to health? J. Physiol. 2013, 591, 5393–5400. [Google Scholar] [CrossRef]
- Ellefsen, S.; Vikmoen, O.; Slettalokken, G.; Whist, J.E.; Nygaard, H.; Hollan, I.; Rauk, I.; Vegge, G.; Strand, T.A.; Raastad, T.; et al. Irisin and FNDC5: Effects of 12-week strength training, and relations to muscle phenotype and body mass composition in untrained women. Eur. J. Appl. Physiol. 2014, 114, 1875–1888. [Google Scholar] [CrossRef]
- Hark, L.; Deen, D., Jr. Taking a nutrition history: A practical approach for family physicians. Am. Fam. Physician. 1999, 59, 1521–1528. [Google Scholar]
- Biro, G.; Hulshof, K.F.; Ovesen, L.; Amorim Cruz, J.A.; EFCOSUM Group. Selection of methodology to assess food intake. Eur. J. Clin. Nutr. 2002, 56, S25–S32. [Google Scholar] [CrossRef]
- Global Strategy on Diet, Physical Activity and Health—What is Moderate-Intensity and Vigorous-Intensity Physical Activity? Available online: https://www.who.int/dietphysicalactivity/physical_activity_intensity/en/ (accessed on 20 December 2019).
- Revitalizing the Mediterranean Diet. In Proceedings of the 1st World Conference on the Mediterranean Diet, Milan, Italy, 6–8 July 2016; Available online: http://www.ifmed.org/1st-world-conference-on-the-mediterranean-diet (accessed on 20 December 2019).
- Bedogni, G.; Borghi, A.; Battistini, N.C. Manuale di Valutazione Antropometrica Dello Stato Nutrizionale; EDRA: Milan, Italy, 2001. [Google Scholar]
- Dittmar, M.; Reber, H. Validation of different bioimpedance analyzers for predicting cell mass against whole-body counting of potassium (40K) as a reference method. Am. J. Hum. Biol. 2004, 16, 697–703. [Google Scholar] [CrossRef]
- Trichopoulou, A.; Costacou, T.; Bamia, C.; Trichopoulos, D. Adherence to a Mediterranean diet and survival in a Greek population. N. Engl. J. Med. 2003, 348, 2599–2608. [Google Scholar] [CrossRef]
- Grosso, G.; Mistretta, A.; Frigiola, A.; Gruttadauria, S.; Biondi, A.; Basile, F.; Vitaglione, P.; D’Orazio, N.; Galvano, F. Mediterranean diet and cardiovascular risk factors: A systematic review. Crit. Rev. Food Sci. Nutr. 2014, 54, 593–610. [Google Scholar] [CrossRef]
- Pelucchi, C.; Bosetti, C.; Rossi, M.; Negri, E.; La Vecchia, C. Selected aspects of Mediterranean diet and cancer risk. Nutr. Cancer 2009, 61, 756–766. [Google Scholar] [CrossRef]
- Esteban-Gonzalo, L.; Turner, A.I.; Torres, S.J.; Esteban-Cornejo, I.; Castro-Pinero, J.; Delgado-Alfonso, A.; Marcos, A.; Gomez-Martinez, S.; Veiga, O.L. Diet quality and well-being in children and adolescents: The UP&DOWN longitudinal study. Br. J. Nutr. 2019, 121, 221–231. [Google Scholar] [CrossRef] [PubMed]
- Galan-Lopez, P.; Ries, F.; Gisladottir, T.; Dominguez, R.; Sanchez-Oliver, A.J. Healthy Lifestyle: Relationship between Mediterranean Diet, Body Composition and Physical Fitness in 13 to 16-Years Old Icelandic Students. Int. J. Environ. Res. Public Health 2018, 15, 2632. [Google Scholar] [CrossRef] [PubMed]
- Grosso, G.; Marventano, S.; Buscemi, S.; Scuderi, A.; Matalone, M.; Platania, A.; Giorgianni, G.; Rametta, S.; Nolfo, F.; Galvano, F.; et al. Factors associated with adherence to the Mediterranean diet among adolescents living in Sicily, Southern Italy. Nutrients 2013, 5, 4908–4923. [Google Scholar] [CrossRef] [PubMed]
- Muros, J.J.; Cofre-Bolados, C.; Arriscado, D.; Zurita, F.; Knox, E. Mediterranean diet adherence is associated with lifestyle, physical fitness, and mental wellness among 10-y-olds in Chile. Nutrition 2017, 35, 87–92. [Google Scholar] [CrossRef]
- Santomauro, F.; Lorini, C.; Tanini, T.; Indiani, L.; Lastrucci, V.; Comodo, N.; Bonaccorsi, G. Adherence to Mediterranean diet in a sample of Tuscan adolescents. Nutrition 2014, 30, 1379–1383. [Google Scholar] [CrossRef]
- Grosso, G.; Galvano, F. Mediterranean diet adherence in children and adolescents in southern European countries. NSF J. 2016, 3, 13–19. [Google Scholar] [CrossRef]
- Caparello, G.; Galluccio, A.; Giordano, C.; Lofaro, D.; Barone, I.; Morelli, C.; Sisci, D.; Catalano, S.; Andò, S.; Bonofiglio, D. Adherence to the Mediterranean diet pattern among university staff: A cross-sectional web-based epidemiological study in Southern Italy. Int. J. Food Sci. Nutr. 2019, 1–12. [Google Scholar] [CrossRef]
- Martucci, M.; Ostan, R.; Biondi, F.; Bellavista, E.; Fabbri, C.; Bertarelli, C.; Salvioli, S.; Capri, M.; Franceschi, C.; Santoro, A. Mediterranean diet and inflammaging within the hormesis paradigm. Nutr. Rev. 2017, 75, 442–455. [Google Scholar] [CrossRef] [PubMed]
- Colberg, S.R.; Sigal, R.J.; Fernhall, B.; Regensteiner, J.G.; Blissmer, B.J.; Rubin, R.R.; Chasan-Taber, L.; Albright, A.L.; Braun, B.; American College of Sports, Medicine; et al. Exercise and type 2 diabetes: The American College of Sports Medicine and the American Diabetes Association: Joint position statement executive summary. Diabetes Care 2010, 33, 2692–2696. [Google Scholar] [CrossRef] [PubMed]
- Sigal, R.J.; Kenny, G.P.; Wasserman, D.H.; Castaneda-Sceppa, C.; White, R.D. Physical activity/exercise and type 2 diabetes: A consensus statement from the American Diabetes Association. Diabetes Care 2006, 29, 1433–1438. [Google Scholar] [CrossRef] [PubMed]
- Evaristo, O.S.; Moreira, C.; Lopes, L.; Abreu, S.; Agostinis-Sobrinho, C.; Oliveira-Santos, J.; Povoas, S.; Oliveira, A.; Santos, R.; Mota, J. Associations between physical fitness and adherence to the Mediterranean diet with health-related quality of life in adolescents: Results from the LabMed Physical Activity Study. Eur. J. Public Health 2018, 28, 631–635. [Google Scholar] [CrossRef] [PubMed]
- Bacopoulou, F.; Landis, G.; Rentoumis, A.; Tsitsika, A.; Efthymiou, V. Mediterranean diet decreases adolescent waist circumference. Eur. J. Clin. Invest. 2017, 47, 447–455. [Google Scholar] [CrossRef]
- Norman, K.; Stobaus, N.; Pirlich, M.; Bosy-Westphal, A. Bioelectrical phase angle and impedance vector analysis--clinical relevance and applicability of impedance parameters. Clin. Nutr. 2012, 31, 854–861. [Google Scholar] [CrossRef]
- Mundstock, E.; Amaral, M.A.; Baptista, R.R.; Sarria, E.E.; Dos Santos, R.R.G.; Filho, A.D.; Rodrigues, C.A.S.; Forte, G.C.; Castro, L.; Padoin, A.V.; et al. Association between phase angle from bioelectrical impedance analysis and level of physical activity: Systematic review and meta-analysis. Clin. Nutr. 2019, 38, 1504–1510. [Google Scholar] [CrossRef]
- Rohling, M.; Herder, C.; Stemper, T.; Mussig, K. Influence of Acute and Chronic Exercise on Glucose Uptake. J. Diabetes Res. 2016, 2016, 2868652. [Google Scholar] [CrossRef]
- Eisenmann, J.C. Physical activity and cardiovascular disease risk factors in children and adolescents: An overview. Can. J. Cardiol. 2004, 20, 295–301. [Google Scholar]
- Janssen, I.; Leblanc, A.G. Systematic review of the health benefits of physical activity and fitness in school-aged children and youth. Int. J. Behav. Nutr. Phys. Act. 2010, 7, 40. [Google Scholar] [CrossRef]
- LeBlanc, A.G.; Janssen, I. Dose-response relationship between physical activity and dyslipidemia in youth. Can. J. Cardiol. 2010, 26, 201–205. [Google Scholar] [CrossRef]
- Wang, Y.; Xu, D. Effects of aerobic exercise on lipids and lipoproteins. Lipids Health Dis. 2017, 16, 132. [Google Scholar] [CrossRef] [PubMed]
- Sorate, B. The effects of progressive low to high intensity exercise training on blood lipids and lipoprotein profiles in collegiate adolescents. Turk. J. Sport Exerc. 2014, 16, 84–88. [Google Scholar] [CrossRef][Green Version]
- Baran, J.; Weres, A.; Czenczek-Lewandowska, E.; Wyszynska, J.; Luszczki, E.; Deren, K.; Sobek, G.; Wiech, P. Blood lipid profile and body composition in a pediatric population with different levels of physical activity. Lipids Health Dis. 2018, 17, 171. [Google Scholar] [CrossRef]


| Characteristics | Total (n = 92) | Girls (n = 44) | Boys (n = 48) |
|---|---|---|---|
| Age (years) | 15.76 ± 0.99 | 15.82 ± 0.99 | 15.71 ± 1.01 |
| Weight (Kg) | 62.23 ± 12.28 | 56.86 ± 7.54 | 67.15 ± 13.72 |
| Height (cm) | 167.01 ± 12.42 | 162.51 ± 15.96 | 171.12 ± 5.43 |
| BMI (Kg/m2) | 22.58 ± 3.59 | 22.12 ± 2.34 | 23.01 ± 4.45 |
| Waist (cm) | 72.43 ± 8.05 | 69.44 ± 5.22 | 75.17 ± 9.18 |
| Hip (cm) | 94.74 ± 8.34 | 93.37 ± 7.12 | 94.07 ± 9.39 |
| Waist/hip ratio | 0.78 ± 0.06 | 0.75 ± 0.04 | 0.78 ± 0.04 |
| KIDMED score | 5.86 ± 2.41 | 5.64 ± 2.43 | 5.94 ± 2.52 |
| PA | |||
| Group A | n = 25 | n = 13 | n = 12 |
| Group B | n = 35 | n = 23 | n = 12 |
| Group C | n = 32 | n = 8 | n = 24 |
| Group A | Group B | Group C | p Value | ||
|---|---|---|---|---|---|
| Total n = 25 | Total n = 35 | Total n = 32 | |||
| Girls n = 13 | Girls n = 23 | Girls n = 8 | |||
| Boys n = 12 | Boys n = 12 | Boys n = 24 | |||
| Height (cm) | Total | 165.76 ± 8.88 | 164.69 ± 7.64 | 167.39 ± 7.47 | n.s. |
| Girls | 159.62 ± 5.96 | 160.78 ± 5.48 | 159.70 ± 8.67 | n.s. | |
| Boys | 172.42 ± 6.36 | 172.17 ± 5.25 | 169.96 ± 4.99 | n.s. | |
| Weight (kg) | Total | 67.76 ± 18.19 | 59.49 ± 7.14 | 60.91 ± 9.37 | n.s. |
| Girls | 59.31 ± 8.70 | 56.91 ± 6.95 | 52.75 ± 6.11 | n.s. | |
| Boys | 76.92 ± 21.53 | 64.42 ± 6.49 | 63.63 ± 8.72 | * 0.014, § 0.021 | |
| BMI (Kg/m2) | Total | 24.56 ± 5.41 | 21.93 ± 2.17 | 21.72 ± 2.29 | * 0.001, § 0.001 |
| Girls | 23.18 ± 2.42 | 22.02 ± 2.25 | 20.65 ± 1.73 | * 0.001, § 0.001, ° 0.027 | |
| Boys | 26.05 ± 7.27 | 21.72 ± 2.19 | 22.08 ± 2.37 | * 0.001, § 0.001 | |
| PhA (°) | Total | 5.89 ± 0.53 | 6.10 ± 0.84 | 6.36 ± 0.53 | * 0.02 |
| Girls | 5.80 ± 0.41 | 5.82 ± 0.78 | 6.06 ± 0.50 | n.s. | |
| Boys | 5.98 ± 0.63 | 6.65 ± 0.66 | 6.46 ± 0.51 | * 0.02, § 0.02 | |
| BCM (kg) | Total | 31.95 ± 5.08 | 32.19 ± 5.32 | 33.79 ± 5.73 | * 0.001, § 0.001 |
| Girls | 32.18 ± 5.32 | 29.91 ± 4.21 | 28.45 ± 3.46 | * 0.001, § 0.001, ° 0.027 | |
| Boys | 31.71 ± 5.03 | 36.56 ± 4.50 | 35.58 ± 5.23 | * 0.001, § 0.001 | |
| BCM (%) | Total | 53.07 ± 2.72 | 53.99 ± 4.16 | 55.39 ± 2.47 | * 0.02 |
| Girls | 52.61 ± 2.17 | 52.58 ± 4.01 | 53.96 ± 2.41 | n.s. | |
| Boys | 53.56 ± 3.23 | 56.72 ± 3.00 | 55.87 ± 2.35 | * 0.02, § 0.02 | |
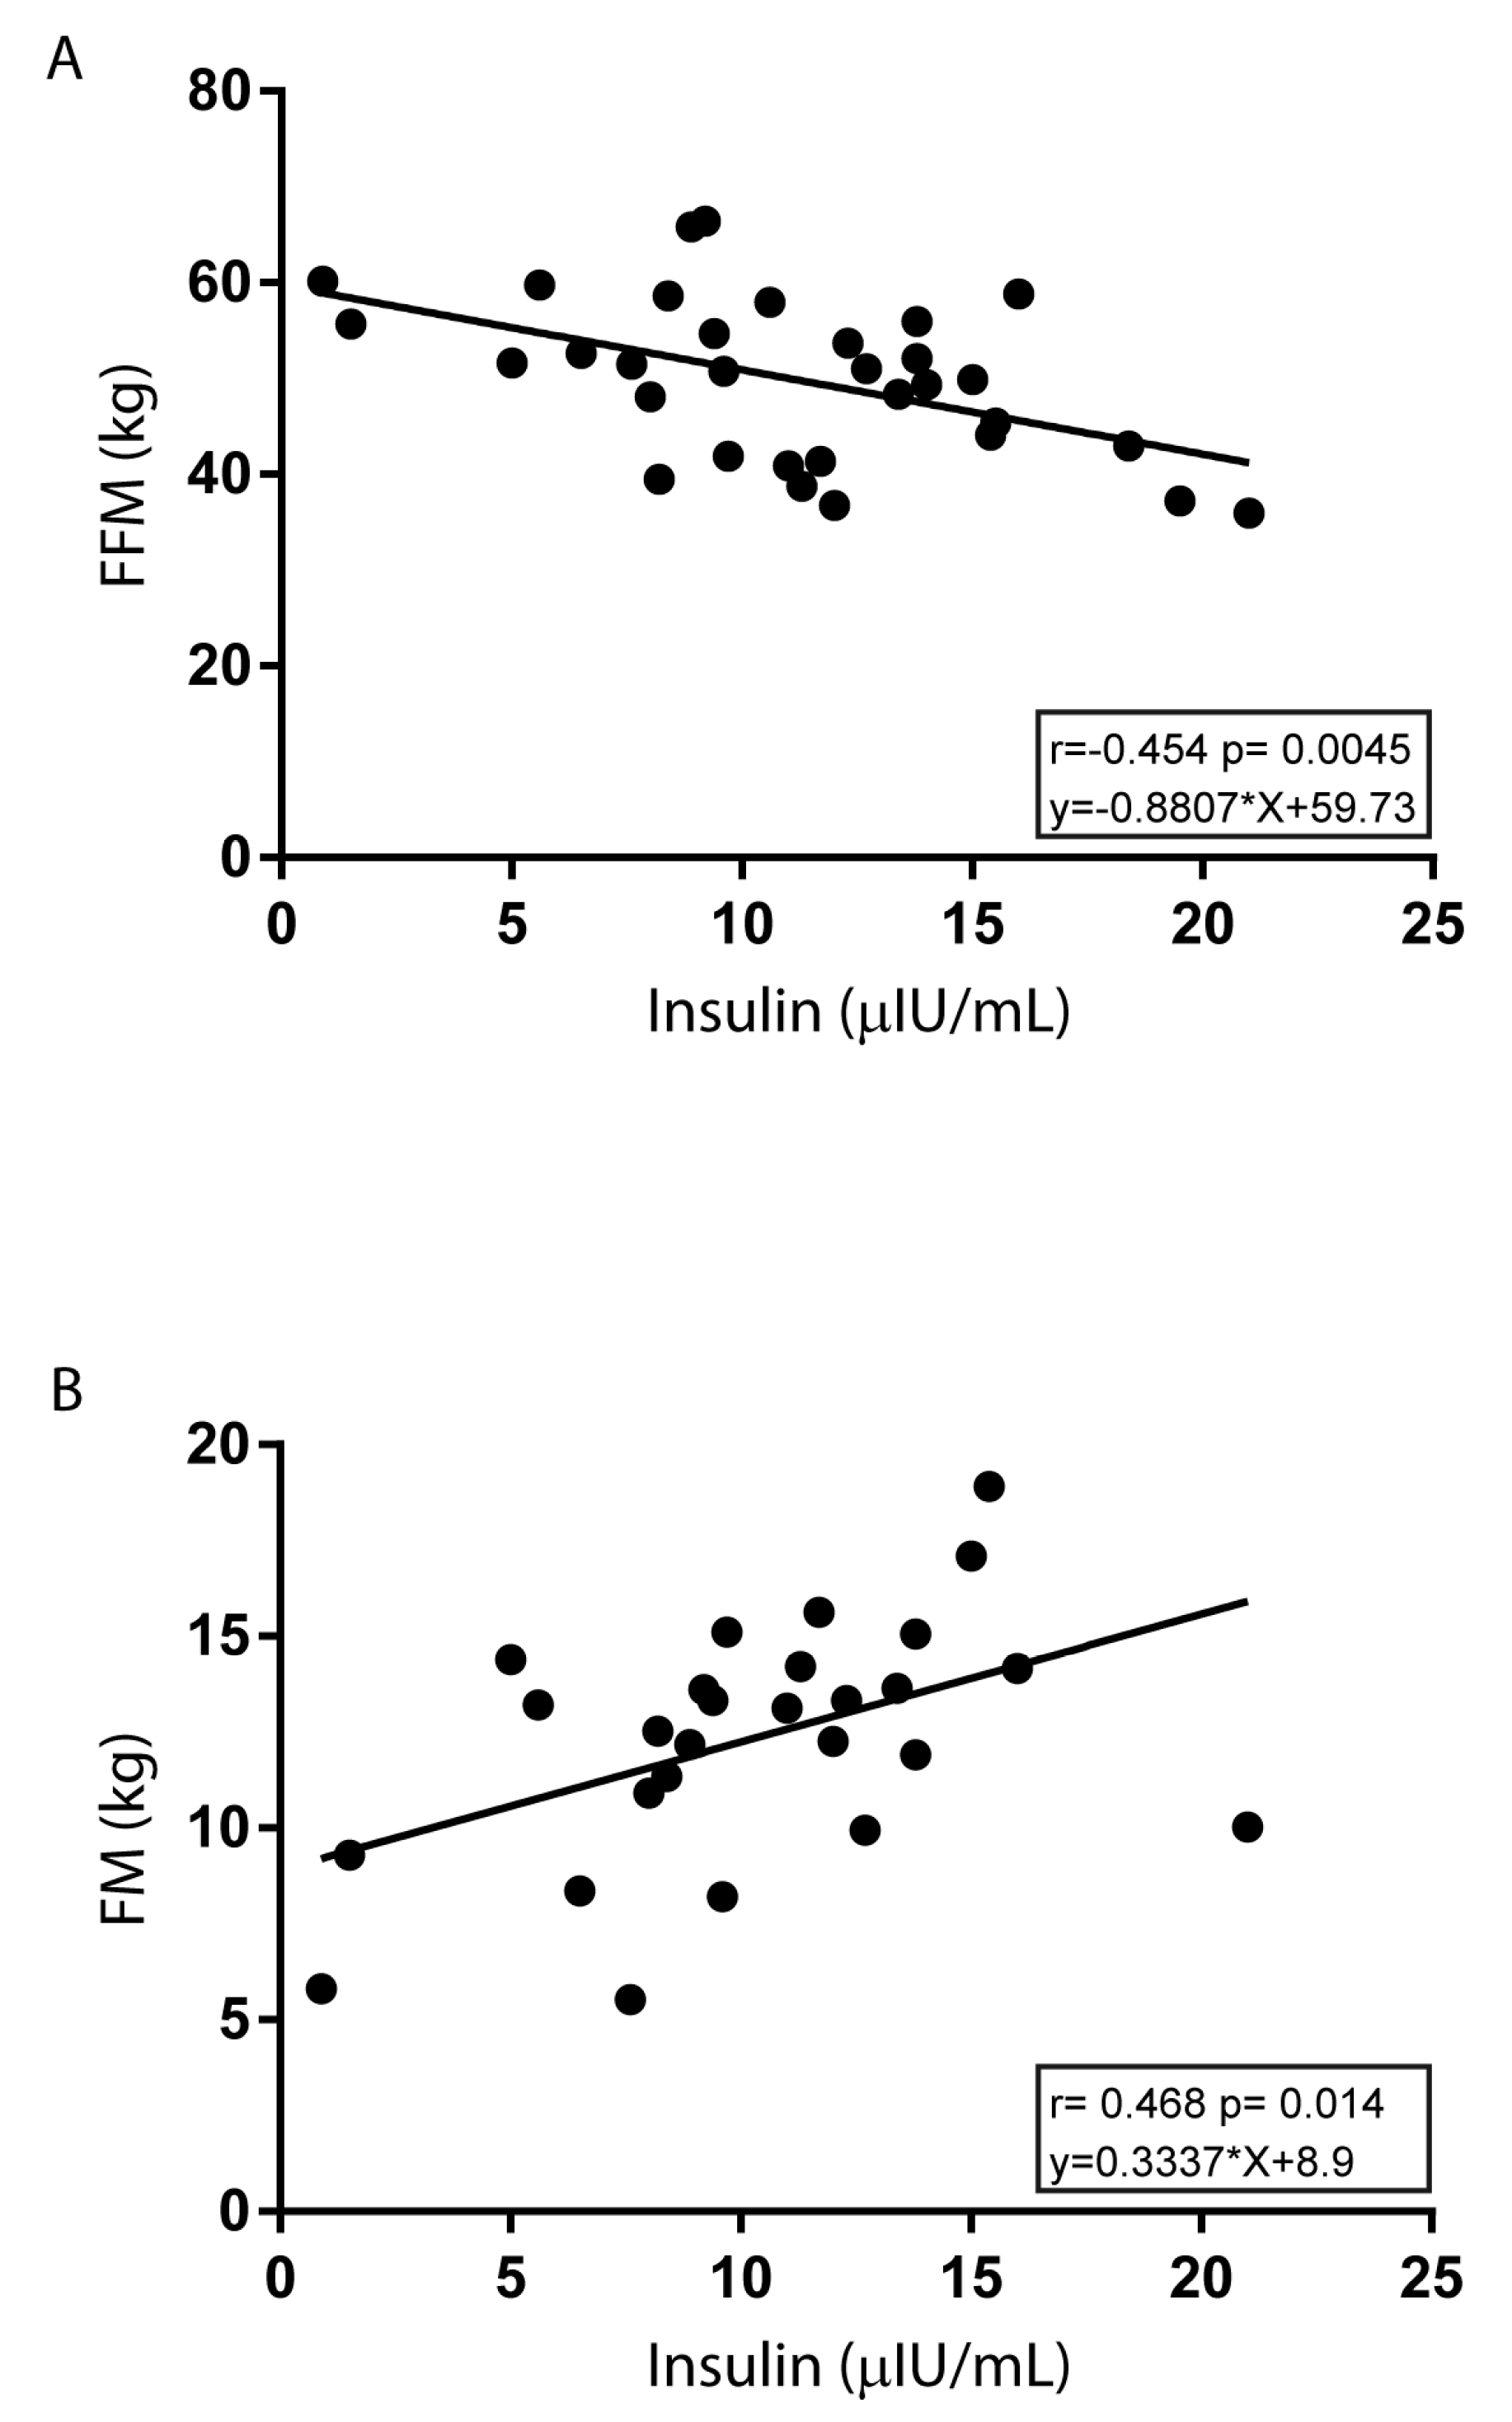
| FFM (kg) | Total | 49.67 ± 11.03 | 46.68 ± 7.76 | 49.93 ± 8.35 | n.s |
| Girls | 41.84 ± 4.01 | 41.82 ± 3.09 | 39.45 ± 2.83 | n.s. | |
| Boys | 58.16 ± 9.84 | 55.99 ± 4.82 | 53.43 ± 6.38 | n.s. | |
| FFM (%) | Total | 73.74 ± 10.61 | 78.62 ± 8.88 | 82.09 ± 7.01 | * 0.002, § 0.03 |
| Girls | 69.79 ± 9.08 | 74.15 ± 6.84 | 75.15 ± 3.93 | n.s. | |
| Boys | 78.01 ± 10.83 | 87.19 ± 5.34 | 84.40 ± 6.26 | * 0.02, § 0.01 | |
| FM (kg) | Total | 18.09 ± 9.99 | 12.80 ± 5.67 | 10.98 ± 4.38 | * 0.003, § 0.037 |
| Girls | 17.47 ± 6.83 | 15.09 ± 5.08 | 13.30 ± 3.47 | n.s. | |
| Boys | 18.76 ± 12.88 | 8.42 ± 3.99 | 10.20 ± 4.44 | * 0.006, § 0.014 | |
| FM (%) | Tota | 25.46 ± 9.87 | 21.37 ± 8.88 | 17.91 ± 7.01 | * 0.004 |
| Girls | 28.67 ± 8.00 | 25.85 ± 6.84 | 24.85 ± 3.93 | n.s. | |
| Boys | 21.99 ± 10.83 | 12.81 ± 5.34 | 15.60 ± 6.26 | * 0.02, § 0.01 | |
| TBW (%) | Total | 55.66 ± 7.83 | 57.68 ± 6.35 | 62.55 ± 4.98 | * <0.001, ° 0.003 |
| Girls | 53.61 ± 7.06 | 54.34 ± 4.66 | 60.1 ± 4.73 | * 0.03, ° 0.01 | |
| Boys | 57.88 ± 8.31 | 64.08 ± 3.64 | 63.37 ± 4.89 | * 0.009, § 0.02 | |
| Group A | Group B | Group C | p Value | ||
|---|---|---|---|---|---|
| Biochemical Parameters | Total n = 25 | Total n = 35 | Total n = 32 | ||
| Girls n = 13 | Girls n = 23 | Girls n = 8 | |||
| Boys n = 12 | Boys n = 12 | Boys n = 24 | |||
| Glucose (mg/dL) | Total | 81.72 ± 7.05 | 81.91 ± 8.41 | 85.85 ± 6.37 | * 0.03 |
| Girls | 79.08 ± 6.62 | 79.48 ± 8.31 | 84.20 ± 4.32 | n.s. | |
| Boys | 84.58 ± 6.59 | 86.58 ± 6.68 | 86.24 ± 6.80 | n.s. | |
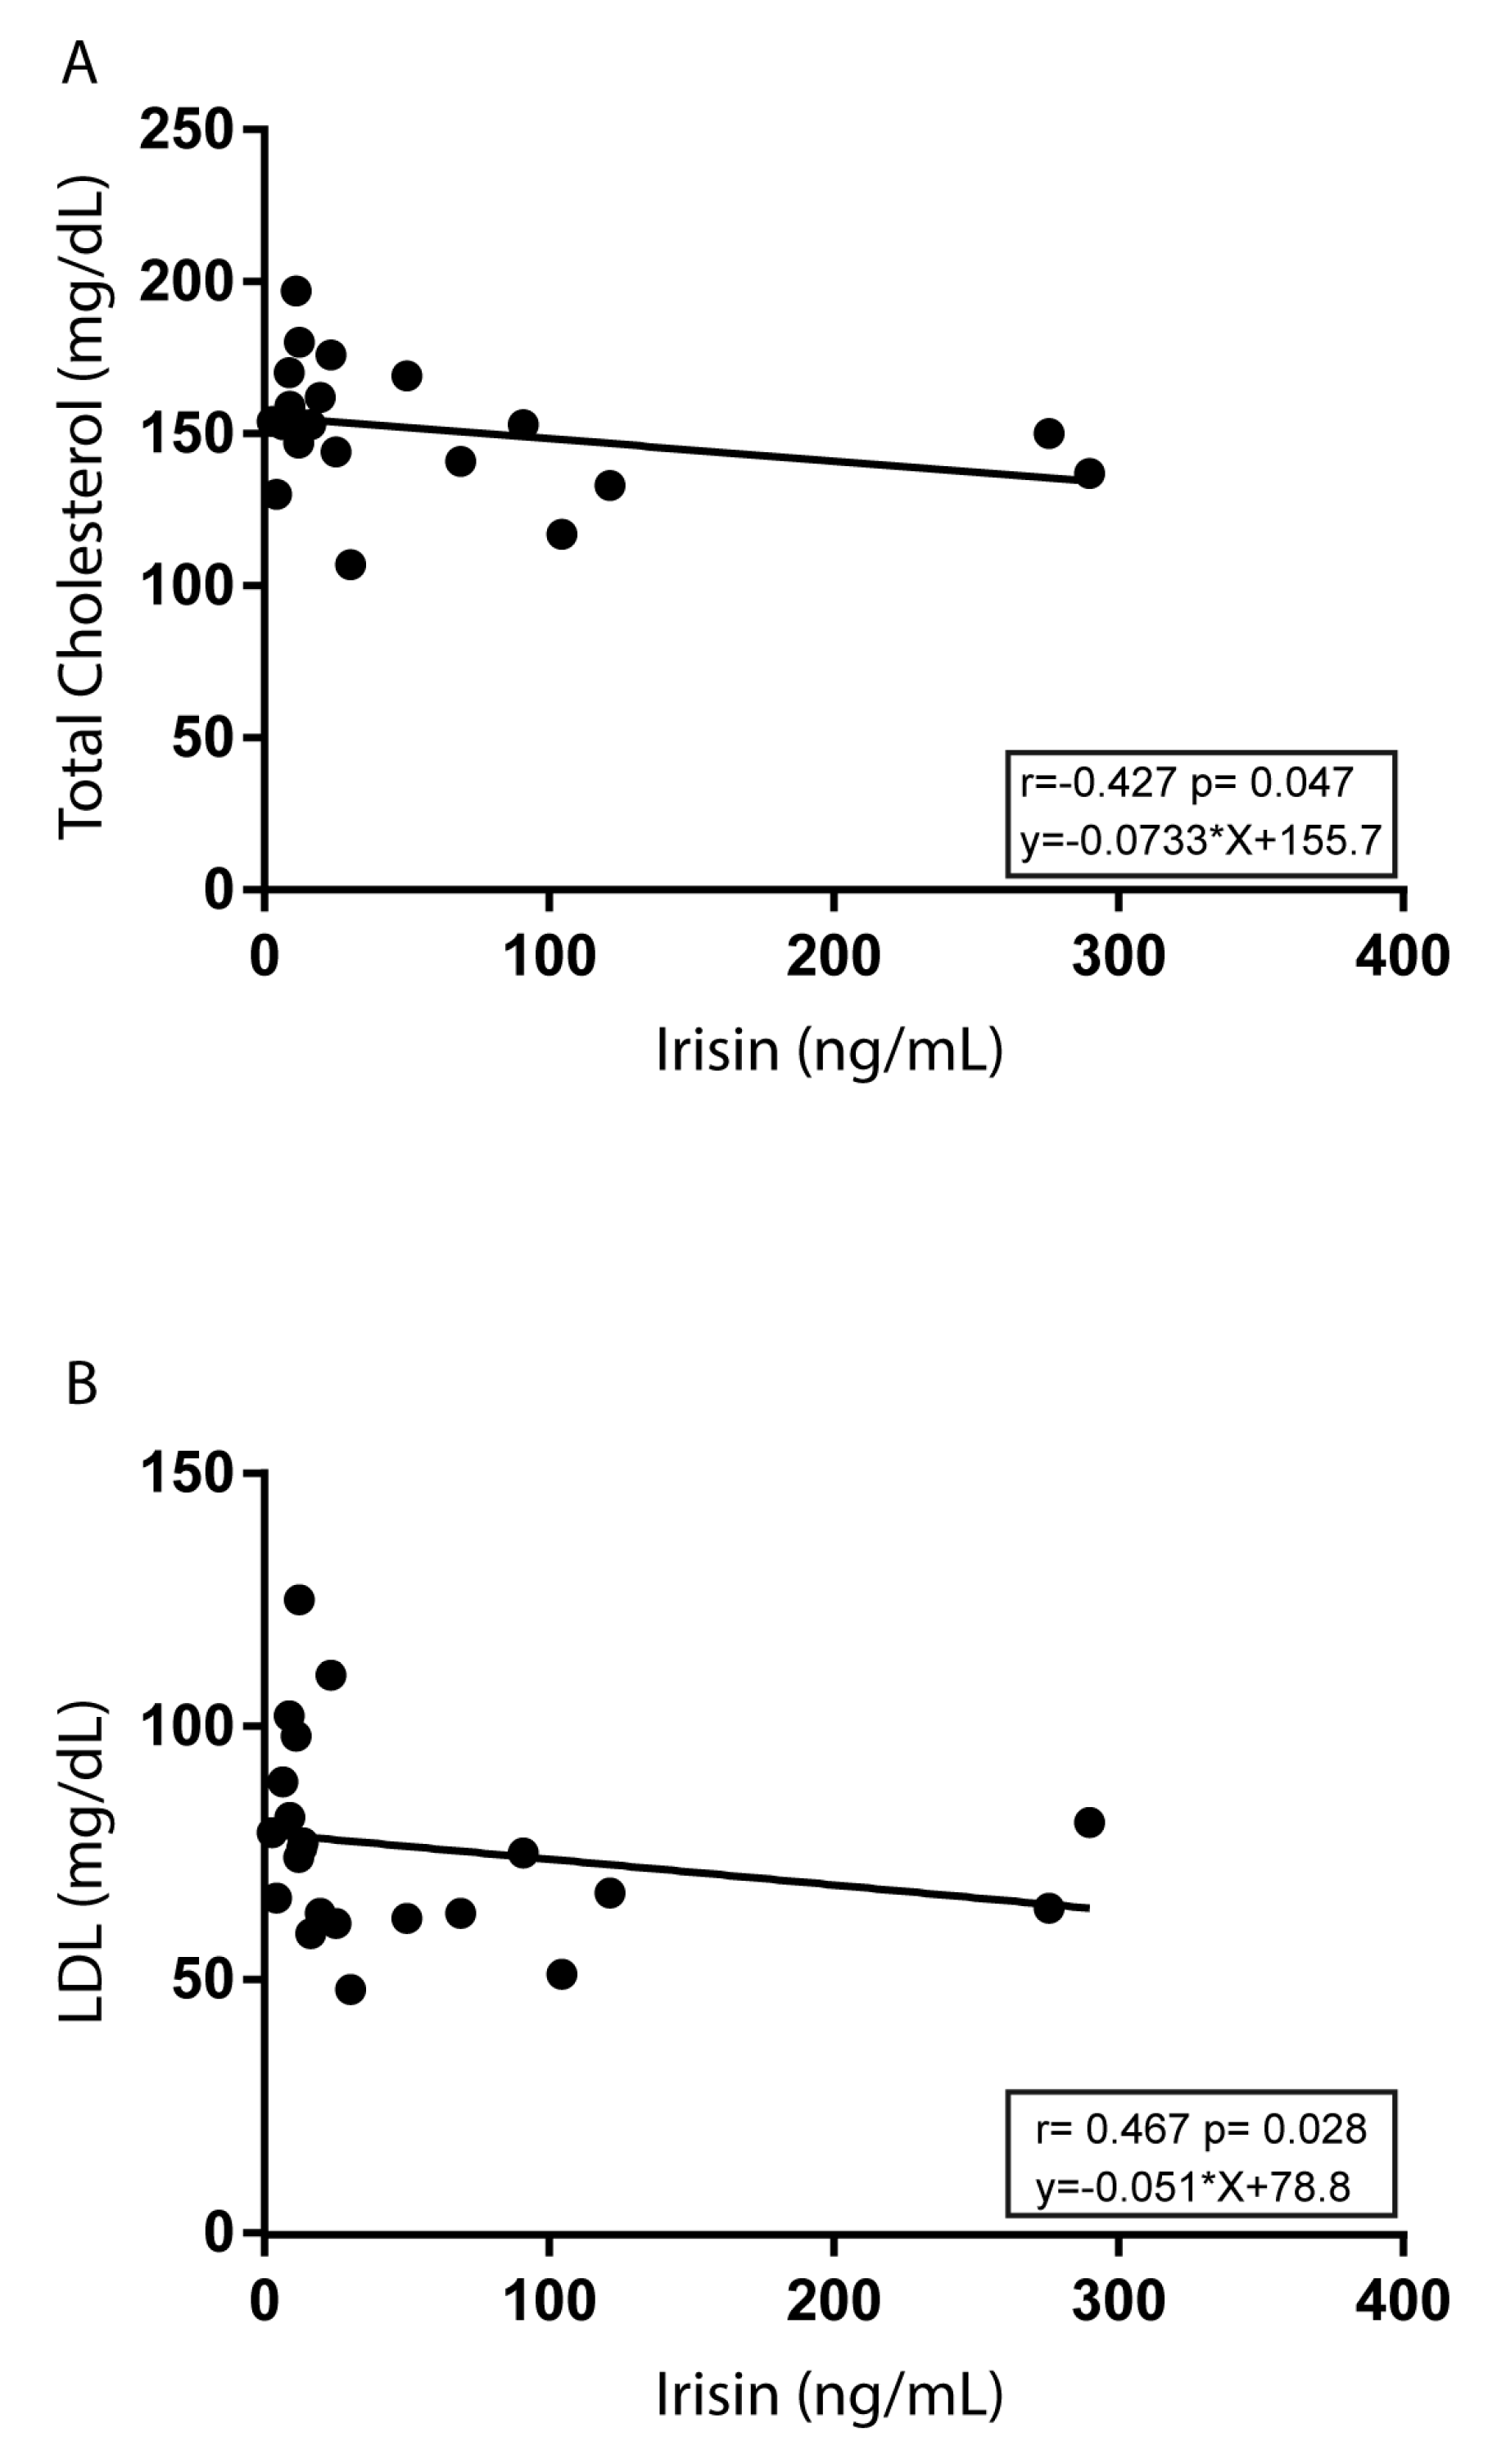
| Total cholesterol (mg/dL) | Total | 162.32 ± 28.60 | 153.60 ± 29.75 | 150.75 ± 23.80 | n.s. |
| Girls | 171.69 ± 29.70 | 161.35 ± 29.42 | 155.75 ± 29.27 | n.s. | |
| Boys | 152.17 ± 24.60 | 138.75 ± 25.29 | 149.08 ± 22.16 | n.s. | |
| LDL (mg/dL) | Total | 97.91 ± 29.42 | 81.03 ± 23.76 | 75.91 ± 20.97 | * 0.02 |
| Girls | 108.08 ± 26.63 | 85.30 ± 24.31 | 71.12 ± 23.48 | § 0.02, * 0.01 | |
| Boys | 87.75 ± 29.57 | 72.83 ± 21.23 | 76.18 ± 19.78 | n.s. | |
| HDL (mg/dL) | Total | 53.80 ± 12.52 | 58.46 ± 15.61 | 63.47 ± 12.44 | * 0.02 |
| Girls | 54.46 ± 12.04 | 62.69 ± 15.82 | 69.87 ± 13.96 | n.s. | |
| Boys | 53.08 ± 13.52 | 50.33 ± 11.96 | 61.33 ± 11.41 | * 0.05, ° 0.03 | |
| Triglycerides (mg/dL) | Total | 60.12 ± 20.82 | 69.97 ± 39.01 | 61.90 ± 25.11 | n.s. |
| Girls | 63.50 ± 24.29 | 65.82 ± 31.28 | 73.87 ± 27.38 | n.s. | |
| Boys | 56.75 ± 17.07 | 77.92 ± 51.39 | 57.92 ± 23.57 | n.s. | |
| Uric acid (mg/dL) | Total | 4.41 ± 1.07 | 4.05 ± 0.93 | 4.46 ± 0.77 | n.s. |
| Girls | 3.91 ± 0.84 | 3.65 ± 0.55 | 4.29 ± 1.06 | n.s. | |
| Boys | 4.95 ± 1.06 | 4.81 ± 1.05 | 4.85 ± 0.96 | n.s. | |
| Urea (mg/dL) | Total | 27.48 ± 6.72 | 28.54 ± 7.00 | 33.09 ± 5.88 | * 0.005, ° 0.006 |
| Girls | 24.30 ± 5.51 | 25.91 ± 6.34 | 30.00 ± 4.50 | * 0.02 | |
| Boys | 30.92 ± 6.37 | 33.58 ± 5.38 | 34.12 ± 5.99 | n.s. | |
| Creatinine (mg/dL) | Total | 0.68 ± 0.07 | 0.69 ± 0.10 | 0.70 ± 0.09 | n.s. |
| Girls | 0.67 ± 0.07 | 0.65 ± 0.08 | 0.64 ± 0.05 | n.s. | |
| Boys | 0.70 ± 0.07 | 0.77 ± 0.08 | 0.73 ± 0.08 | n.s. | |
| Total bilirubin (mg/dL) | Total | 0.68 ± 0.20 | 0.80 ± 0.55 | 0.77 ± 0.32 | n.s. |
| Girls | 0.64 ± 0.17 | 0.68 ± 031 | 0.67 ± 0.24 | n.s. | |
| Boys | 0.72 ± 0.22 | 1.02 ± 0.82 | 0.80 ± 0.34 | n.s. | |
| Direct bilirubin (mg/dL) | Total | 0.23 ± 0.08 | 0.23 ± 0.08 | 0.22 ± 0.07 | n.s. |
| Girls | 0.23 ± 0.11 | 0.21 ± 0.07 | 0.19 ± 0.05 | n.s. | |
| Boys | 0.24 ± 0.07 | 0.27 ± 0.09 | 0.23 ± 0.07 | n.s. | |
| GOT (UI/L) | Total | 19.00 ± 7.09 | 22.57 ± 11.60 | 23.31 ± 7.80 | n.s. |
| Girls | 19.08 ± 7.83 | 22.04 ± 13.31 | 18.00 ± 3.07 | n.s. | |
| Boys | 20.50 ± 3.63 | 23.58 ± 7.74 | 25.08 ± 8.12 | n.s. | |
| GPT (UI/L) | Total | 17.84 ± 8.36 | 17.28 ± 9.73 | 19.18 ± 11.75 | n.s. |
| Girls | 15.92 ± 9.19 | 15.30 ± 6.86 | 14.75 ± 8.34 | n.s. | |
| Boys | 19.91 ± 7.17 | 21.08 ± 13.21 | 21.50 ± 12.37 | n.s. | |
| Hormonal serum levels | |||||
| Insulin (μIU/mL) | Total | 12.61 ± 5.97 | 9.13 ± 4.20 | 9.74 ± 3.78 | § 0.01, * 0.04 |
| Girls | 11.29 ± 2.78 | 10.12 ± 4.59 | 10.58 ± 1.60 | n.s. | |
| Boys | 13.93 ± 7.94 | 6.47 ± 2.95 | 9.54 ± 4.14 | § 0.02, ° 0.03 | |
| Irisin (ng/mL) | Total | 12.30 ± 8.88 | 29.55 ± 34.51 | 55.02 ± 81.19 | * 0.01 |
| Girls | 12.93 ± 8.92 | 27.86 ± 39.02 | 27.05 ± 16.14 | * 0.05 | |
| Boys | 11.60 ± 9.26 | 18.02 ± 17.64 | 61.23 ± 88 | n.s. | |
| HOMA-IR | Total | 2.56 ± 1.22 | 1.84 ± 0.85 | 2.08 ± 0.83 | § 0.01 |
| Girls | 2.23 ± 0.55 | 1.99 ± 0.93 | 2.13 ± 0.44 | n.s. | |
| Boys | 2.89 ± 1.61 | 1.40 ± 0.69 | 2.06 ± 0.91 | § 0.03, ° 0.04 | |
| KIDMED score | Total | 5.80 ± 2.10 | 5.57 ± 2.60 | 6.03 ± 2.63 | n.s. |
| Girls | 5.31 ± 1.89 | 5.56 ± 2.76 | 6.37 ± 2.33 | n.s. | |
| Boys | 6.33 ± 2.27 | 5.58 ± 2.39 | 6.17 ± 2.52 | n.s | |
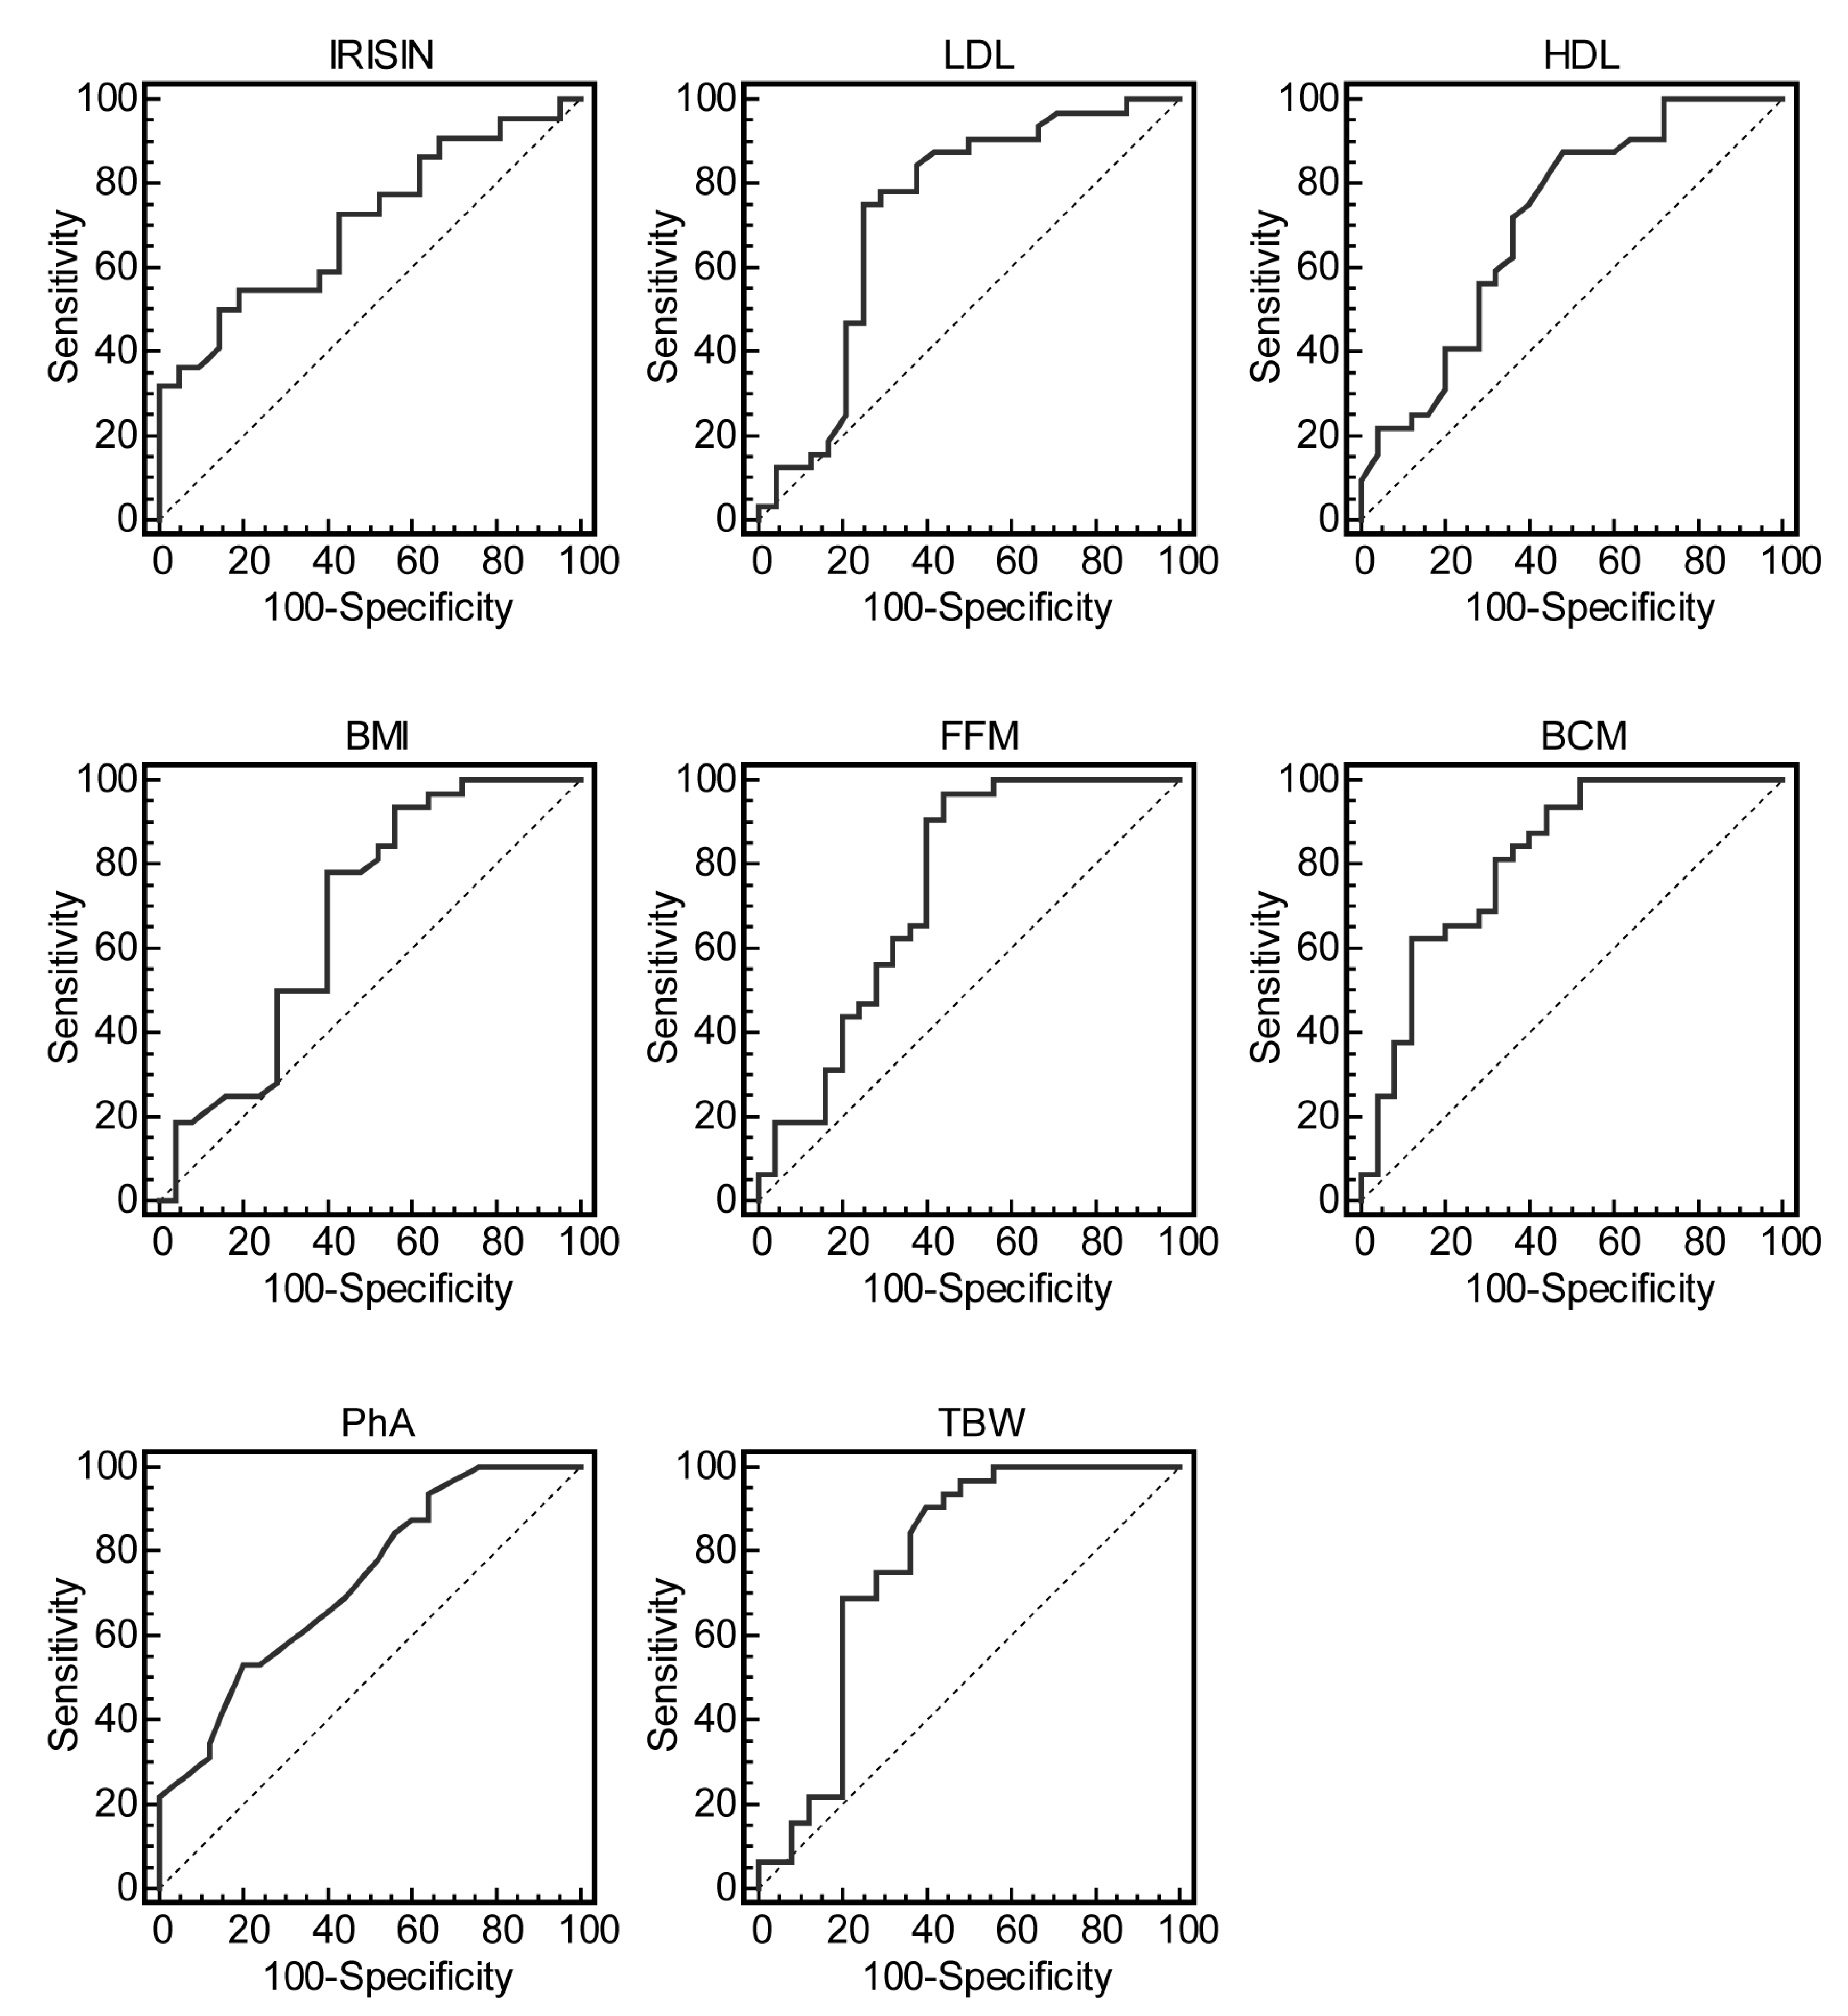
| Characteristics | AUC | Optimal Cutoff | Sensitivity (%) (95% C.I.) | Specificity (%) (95% C.I.) | p Value |
|---|---|---|---|---|---|
| Irisin (ng/mL) | 0.705 | >17.6 | 50 (28.2–71.8) | 85.7 (63.6–96.8) | 0.01 |
| LDL (mg/dL) | 0.729 | ≤82 | 75 (56.6–88.5) | 75 (53.3–90.2) | 0.001 |
| HDL (mg/dL) | 0.711 | >51 | 87.5 (71.0–96.4) | 52 (31.3–72.2) | 0.002 |
| BMI (Kg/m2) | 0.676 | ≤23.5 | 78.1 (60.0–90.7) | 60 (38.7–78.8) | 0.01 |
| FFM (%) | 0.740 | >71 | 96.9 (83.7–99.5) | 56 (34.9–75.6) | 0.0002 |
| BCM (Kg) | 0.814 | >33.6 | 62.5 (43.7–78.9) | 88 (68.8–97.3) | <0.0001 |
| PhA (°) | 0.727 | >6.3 | 53.1 (34.8–70.9) | 80 (59.3–93.1) | 0.0006 |
| TBW (%) | 0.770 | >57.4 | 90.6 (75.0–97.9) | 60 (38.7–78.8) | <0.0001 |
© 2020 by the authors. Licensee MDPI, Basel, Switzerland. This article is an open access article distributed under the terms and conditions of the Creative Commons Attribution (CC BY) license (http://creativecommons.org/licenses/by/4.0/).
Share and Cite
Morelli, C.; Avolio, E.; Galluccio, A.; Caparello, G.; Manes, E.; Ferraro, S.; De Rose, D.; Santoro, M.; Barone, I.; Catalano, S.; et al. Impact of Vigorous-Intensity Physical Activity on Body Composition Parameters, Lipid Profile Markers, and Irisin Levels in Adolescents: A Cross-Sectional Study. Nutrients 2020, 12, 742. https://doi.org/10.3390/nu12030742
Morelli C, Avolio E, Galluccio A, Caparello G, Manes E, Ferraro S, De Rose D, Santoro M, Barone I, Catalano S, et al. Impact of Vigorous-Intensity Physical Activity on Body Composition Parameters, Lipid Profile Markers, and Irisin Levels in Adolescents: A Cross-Sectional Study. Nutrients. 2020; 12(3):742. https://doi.org/10.3390/nu12030742
Chicago/Turabian StyleMorelli, Catia, Ennio Avolio, Angelo Galluccio, Giovanna Caparello, Emanuele Manes, Simona Ferraro, Daniela De Rose, Marta Santoro, Ines Barone, Stefania Catalano, and et al. 2020. "Impact of Vigorous-Intensity Physical Activity on Body Composition Parameters, Lipid Profile Markers, and Irisin Levels in Adolescents: A Cross-Sectional Study" Nutrients 12, no. 3: 742. https://doi.org/10.3390/nu12030742
APA StyleMorelli, C., Avolio, E., Galluccio, A., Caparello, G., Manes, E., Ferraro, S., De Rose, D., Santoro, M., Barone, I., Catalano, S., Andò, S., Sisci, D., Giordano, C., & Bonofiglio, D. (2020). Impact of Vigorous-Intensity Physical Activity on Body Composition Parameters, Lipid Profile Markers, and Irisin Levels in Adolescents: A Cross-Sectional Study. Nutrients, 12(3), 742. https://doi.org/10.3390/nu12030742