Article

High Glycemic Load Is Associated with Cognitive Decline in Apolipoprotein E ε4 Allele Carriers

1
Neuropsychiatry: Epidemiological & Clinical Research, University of Montpellier, INSERM, 34093 Montpellier, France
2
ISEM, University of Montpellier, CNRS, EPHE, IRD, 34095 Montpellier, France
3
Bordeaux Population Health Research Center, University of Bordeaux, Inserm, UMR 1219, F-33000 Bordeaux, France
*
Author to whom correspondence should be addressed.
These authors contributed equally to this work.
Nutrients 2020, 12(12), 3619; https://doi.org/10.3390/nu12123619
Submission received: 12 October 2020 / Revised: 13 November 2020 / Accepted: 23 November 2020 / Published: 25 November 2020
(This article belongs to the Special Issue Nutrition in Cognitive Impairment, Dementia, and Alzheimer's Disease)

Abstract

:
Recent evidence suggests that a high glycemic load (GL) diet is a risk factor for dementia, especially among apolipoprotein E ε4 allele (APOE4) carriers, while its association with cognitive decline is poorly known. Here, we investigated the association of high-GL meals with cognitive decline in older adults during a 12-year follow-up, according to their APOE4 carrier status. We used random-effect models and data from 2539 elderly participants from the Three-City study who completed a food frequency questionnaire (FFQ) to longitudinally assess the association of GL with changes in different cognitive domains (verbal fluency, visual memory, attention, visual motor processing speed, episodic memory). In APOE4 carriers, afternoon snack with high GL was significantly associated with cognitive decline in visual memory, episodic memory, and global cognition compared with APOE4 non-carriers. This study suggests a detrimental association between a high-GL diet and cognitive decline. The promotion of a low GL diet as a target to prevent cognitive decline in high-risk populations deserves more research.

1. Introduction

In aging societies, cognitive health has become a major concern. Currently, there is no effective pharmacological treatment for dementia and cognitive decline. Therefore, the identification of modifiable risk factors that could delay or prevent cognitive decline has become a key public health research axis [1]. Promisingly, some evidences suggest that cognitive function integrity may be promoted by healthy diets and some nutritional factors [2]. Moreover, diet can interact with the apolipoprotein E ε4 allele (APOE4) [3,4], the main genetic risk factor of dementia.
APOE4 carriers represent 14 to 15% of the general population and are quite stable [5,6]. They had three fold-increased risk of Alzheimer’s disease than APOE4 non-carriers [7] and represent around 65% among Alzheimer’s disease patients [6,8]. ApoE is mostly involved in lipid transport, cholesterol homeostasis and synaptic plasticity but also mitochondrial function and insulin signaling [9]. Specifically, APOE4 status may modulate the metabolic response to diet interventions [10]. Notably, APOE4 carriers show early deficits in cerebral glucose metabolism [11,12], and recent findings strongly suggest that APOE4 carriers are less sensitive to insulin [8,13]. A causal link between insulin metabolism and the pathogenesis of dementia has been suggested [14,15]. Thus, optimizing blood glucose and insulin responses through nutritional interventions based on a low glycemic load (GL) diet could be particularly relevant to prevent cognitive decline in these individuals.
In this context, our recent work highlighted that high-GL diet, which reflects an elevated intake of refined carbohydrates, increases the risk of dementia in APOE4 carriers [16]. Yet, the impact of the diet GL on long-term cognitive performance, especially in the different cognitive domains (verbal fluency, visual memory, attention, visual motor processing speed, episodic memory), is poorly understood. Only one longitudinal study found that the diet GL was significantly related to lower decline in verbal ability [17], and no study tested the potential interaction with APOE4 status. Cognitive decline precedes the onset of dementia but may also be a marker of brain aging. The use of cognitive tests enables the identification of the different cognitive functions effectively associated with the GL diet and which ones are the most affected.
Moreover, meals have a different nutritional composition that will not bring the same glycemic response [18]. During meals, carbohydrates are rarely ingested alone, and their degradation and absorption rates during digestion are modified by the other macronutrients (i.e., matrix effect). The glycemic response will be more important after intake of a meal rich in refined carbohydrates, and poor in fibers, fat, and proteins [19,20]. Thus, meals that are generally higher in refined carbohydrates, such as breakfast and snacks, may induce a higher glycemic response and consequently increase the risk of cognitive decline. However, the effect of the GL of the different meals on the different cognitive domains has been rarely studied.
In the present study, we determined whether high-GL diet was associated with cognitive changes in the different cognitive domains during a 12-year follow-up using data from a large population-based prospective cohort study (the Three-City study). We evaluated the role of APOE4 status on the association between GL and cognitive changes, and the impact of the GL of each meal type (daily, breakfast, lunch, afternoon snack, and dinner) on this association.
As we previously observed an interaction between GL and APOE4 only for the afternoon snack (snack between lunch and dinner) [16], we hypothesized that, in APOE4 carriers, the afternoon -snack GL might be associated with a greater decline in cognitive performance over time.

2. Materials and Methods

2.1. Study Sample

Participants (n = 9294) were recruited from the Three-City (3C) cohort of community-dwelling individuals, aged 65 years and over, from the electoral rolls of three French cities (Bordeaux, n = 2104; Dijon, n = 4931; and Montpellier, n = 2259), enrolled between 1999 and 2001. A detailed description of the 3C study has been provided elsewhere [21]. The Ethical Committee of the University Hospital of Kremlin-Bicêtre (France) approved the 3C protocol (Project no. 99-28, June 1999), and all participants signed an informed consent. Participants from the Bordeaux and Montpellier 3C centers had face-to-face interviews with trained nurses and neuropsychologists at baseline, and at 2, 4, 7, 10, 12 and 15 years of follow-up. Standardized questionnaires were used to collect data on socio-demographic, clinical and lifestyle characteristics. A Food Frequency Questionnaire (FFQ) was administered to participants from the Bordeaux and Montpellier 3C centers at the 2-year follow-up and 4-year follow-up visit, respectively (Figure 1). Thus, the baseline of the present analyses was the 2-year follow-up visit for Bordeaux and the 4-year follow-up visit for Montpellier. This subsample has been previously described [16]. Participants with prevalent dementia at the baseline of the present analyses were excluded (n = 174). Participants with type 2 diabetes (defined as treated diabetes, fasting glycemia > 7mmol.L−1, and self-reported) at baseline were excluded from the analyses (n = 341, 18% were APOE4 carriers) because they were at risk of cognitive decline and followed a low GL diet (due to their treatment and diet changes). Finally, the maximum sample for the main analyses included 2539 participants (Figure 2).

2.2. Dietary Data

Dietary data were collected using the 148-item FFQ. The FFQ was divided into breakfast, lunch, dinner, and snacks between meals, and was described elsewhere [16]. For each FFQ item (i.e., food/beverage categories), the GL was calculated as the product of the glycemic index (GI) and the amount of available carbohydrates in a standard serving size, divided by 100 [22]. Foods with low carbohydrate content (e.g., meat, fish, fats, vegetables) were assigned a null GL value. GI values and serving sizes were obtained from the International Table of Glycemic Index [23] and internet updates [24], using glucose as a reference. Then, the GL of each item was multiplied by the reported frequency of that item per week. Finally, the sum of this last value for all the items consumed during a meal gave the total GL for breakfast, lunch, afternoon snack (“goûter” in French, corresponding to a snack between lunch and dinner), and dinner. The sum of all GL gave the daily GL. Energy intakes (EI) were obtained from the Anses-Ciqual database [25]. The EI per serving of each item was multiplied by the reported frequency. Then, the sum of the EI for the items consumed during a meal gave the EI for breakfast, lunch, afternoon snack, and dinner. The sum of all EI gave the daily EI.

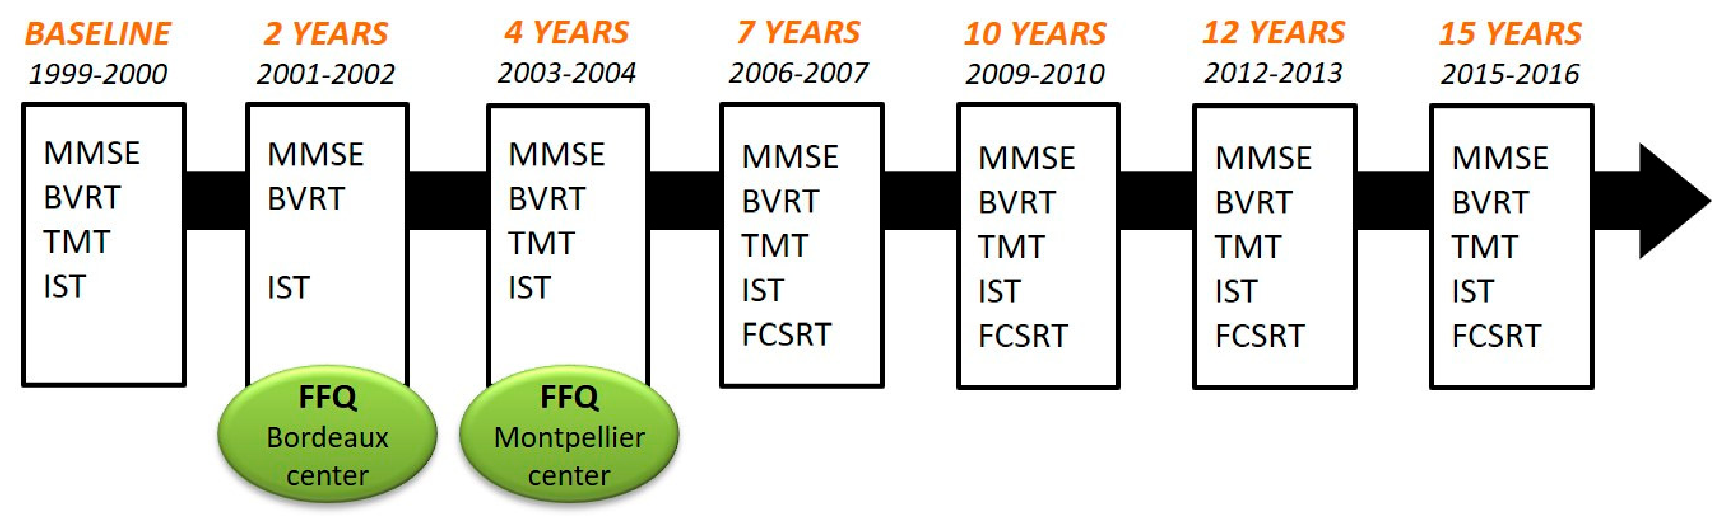
2.3. Neuropsychological Evaluation and Dementia Diagnosis

A battery of cognitive tests was administered by trained neuropsychologists with standard procedures at baseline and at each follow-up (2, 4, 7, 10, 12 and 15 years). The evaluation took place at any time of the day, depending on the time of participants’ enrollment. Cognitive tests evaluated different cognitive domains (Figure 1). The Isaacs Set Test (IST) [26] measures verbal fluency: participants had 30 s to generate as many words as possible within a given semantic category (animals, colors, fruits and cities). The Benton Visual Retention Test (BVRT) [27] evaluates immediate visual memory. The scores range from 0 to 15. The Trail Making Test, forms A and B (TMTA and TMTB) [28], evaluates attention and visual motor processing speed. TMTB also assesses executive functions. The score is the task execution time (time in seconds). Thus, a higher score corresponds to a lower cognitive performance. The French version [29] of the Free and Cued Selective Reminding Test (FCSRT) [30] evaluates verbal episodic memory [31]. Free and cued recalls are repeated three times, and the delayed recall phase is performed 20 min later. Given the non-normal distribution of the “total immediate recall score” and the “total delayed recall score”, only the “free immediate recall score” (FIRS, sum of the number of words retrieved at the three free recall trials) and the “free delayed recall score” (FDRS, number of words retrieved at the delayed free recall trial) were used. Finally, the widely used Mini Mental State Examination (MMSE) [32] was used as an index of global cognitive performance. The score ranges from 0 to 30.
All cognitive tests were administered at baseline and at each follow-up, except the TMT that was not proposed at the 2-year follow-up visit, and the FCSRT that was administered only at the 7-, 10-, 12- and 15-year follow-up visit. For each cognitive test, participants with at least two measures during the follow-up where included in the analyses. Finally, because of sparse missing data, the analyses involved, in APOE4 non-carriers and APOE4 carriers respectively: 1815 and 401 participants for IST, 1794 and 401 for BVRT, 1612 and 348 for TMTA, 1593 and 348 for TMTB, 1351 and 278 for FIRS, 1348 and 275 for FDRS, 1831 and 409 for MMSE.
To identify prevalent and incident dementia cases, according to their neuropsychological test scores, participants with suspected dementia, at baseline and at each follow-up, were examined by a neurologist. Then, an independent committee of neurologists evaluated all potential cases of dementia to obtain a consensus on the diagnosis and etiology based on the Diagnostic and Statistical Manual of Mental Disorders, Fourth Edition [33].

2.4. Covariates

Apolipoprotein E genotyping was described elsewhere [34]. APOE4 carriers had at least one ε4 allele. Education level was defined as no school, primary school, high school, or graduated level. Body mass index (BMI) was calculated as weight (kg)/height2 (m). Hypertension was defined by systolic blood pressure ≥ 140 mmHg, or diastolic blood pressure ≥ 90 mmHg, or use of antihypertensive drugs [35]. History of stroke was established using standardized questions. Cardiovascular history included history of myocardial infarction, coronary surgery, coronary angioplasty, and arterial surgery of the legs for arteritis. Hypercholesterolemia was defined as total cholesterol ≥ 6.2 mmol.L−1. Depressive symptomatology was evaluated with the Center for Epidemiological Studies-Depression (CES-D) scale [36] using the recommended French cut-off scores of 17 and 23 for clinically relevant depressive symptom burden in older men and women, respectively [37]. Smoking status (never, past, or current) was also investigated. The Mediterranean-like diet score was used to control for diet quality, as previously described [16]. Physical activity was defined as none, or low/regular [38].

2.5. Statistical Analyses

2.5.1. Main Analyses

Linear random-effect models were used to evaluate the association between GL and cognitive score changes over the 12-year follow-up. We used the lme function from the nlme R package with random intercept and slope (time), and unstructured covariance structure. Normal distributions of cognitive scores were checked with histograms. To normalize distributions, TMT scores were transformed using the natural logarithm function. The linearity assumption between cognitive score and GL was assessed by testing the loglikehood difference between two models: one model with GL tertiles as continuous variable and one model with GL tertiles as categorical variable. As the relationship between GL and cognitive scores was nonlinear, cut-offs were chosen a priori according to tertiles. The GL categories were defined as low, middle and high tertile. For daily GL, the cut-offs were: <93, 93 to <119 and ≥119 per day. For breakfast GL, the cut-offs were: <19, 19 to 28, ≥28 per day. For lunch GL, the cut-offs were: <29, 29 to 36, ≥36 per day. For afternoon snack, the cut-offs were: null value, 0 to 10, ≥10 per day. For dinner, the cut-offs were: <28, 28 to 36, ≥36 per day.
The β coefficient for the GL tertiles represents the association of GL with each baseline mean cognitive score. The β coefficient for the GL tertile × time interaction represents the association of GL with the cognitive score changes over time, expressed as a score change per year. For MMSE, BVRT, IST and FCSRT, a negative β coefficient indicates a decrease in the cognitive change slope. For TMT, a negative β coefficient indicates an increase in the cognitive change slope.
These models were adjusted for potential confounding factors (based on literature data) including time, center, age, sex, education level, APOE4, EI, BMI, hypertension, cardiovascular history, stroke history, hypercholesterolemia, CES-D score, smoking status, Mediterranean-like diet, and physical activity. For each confounding factor, the interaction with time was tested and was added it to the models when significant (i.e., center × time, age × time, sex × time, and education level × time).
To test the APOE4 effect on the relationship between GL and cognitive performance, an interaction term with APOE4 status was added to the GL tertile and GL tertile x time in each model. In that case, the β coefficient for the GL tertile × time × APOE4 interaction represents the additive effect of APOE4 status to the main effect (i.e., the β coefficient for the GL tertile × time alone) on the cognitive score changes over time, expressed as a score change per year.
As some models showed a significant GL tertile × time × APOE4 interaction, analyses were stratified by APOE4 status (i.e., APOE4 non-carriers and APOE4 carriers).

2.5.2. Sensitivity Analyses

In sensitivity analyses, the same analyses were repeated after excluding individuals with incident dementia (n = 337).

2.5.3. Imputation of Missing Values

Data on physical activity were missing for 14%, on Mediterranean-like diet for 7%, and on hypercholesterolemia for 3% of the main study sample. Incomplete variables were imputed by multiple imputation using the mice R package [39], as previously described [16].
All statistical analyses were carried out with the R 3.4.3 software [40].

3. Results

3.1. Population Characteristics

Table 1 describes the demographic and clinical characteristics of the 2539 participants selected for this study and grouped according to their daily GL tertile (low, middle and high). The participants’ mean age at the time of FFQ completion (i.e., baseline) was 76 years ± 4.9. The high daily GL group was characterized by a lower percentage of women, older age, higher level of physical activity, higher Mediterranean-like diet score, higher EI, lower BMI, and lower percentage of participants with hypertension. Participants from the Montpellier center were more numerous in the high daily GL tertile.
Participants consuming afternoon snack were more likely to be women. They had a higher energy intake but they also tended to practice more often physical activity, had a better Mediterranean diet score and had a slightly lower BMI (Table S1).

3.2. Main Analyses

The GL tertile × time × APOE4 interaction was not significant for daily GL, lunch GL, and dinner GL (Table S2). The interaction high breakfast GL x time x APOE4 was associated with reduced BVRT, the interaction middle breakfast GL × time × APOE4 was associated with reduced MMSE. As expected, the interaction afternoon snack GL × time × APOE4 was significant. The interaction high afternoon snack GL × time × APOE4 was associated with decreased of cognitive score through time regarding IST, TMTA, FIRS, and MMSE.

3.2.1. Association between GL and Cognitive Changes in APOE4 Non-Carriers (12-Year Follow-up)

In APOE4 non-carriers (Table 2), the middle daily GL tertile was significantly associated with better TMTA performance over time (−0.30 s per year). Likewise, the middle and high-GL tertiles for lunch were associated with improved TMT performance over time. The GL high tertile for lunch was associated with lower baseline scores for IST, BVRT, and TMTA. Breakfast, afternoon snack and dinner GL did not seem to be related to cognitive changes. However, the high-GL tertile for dinner was associated with a lower baseline TMT scores compared with the low tertile (i.e., the reference) (−3.43 s for TMTA and −7.76 s for TMTB).

3.2.2. Association between Glycemic Load and Cognitive Changes in APOE4 Carriers (12-Year Follow-up)

In APOE4 carriers (Table 3), the middle GL tertile for breakfast was associated with decreasing MMSE scores (−0.14 points per year). The afternoon snack GL was associated with cognitive decline, particularly between middle tertile and BVRT score (−0.07 points per year), high tertile and FDRS score (−0.18 points per year), and high tertile and MMSE score (−0.16 points per year).

3.3. Sensitivity Analyses

Participants who developed dementia during the 12-year follow-up (n = 337) were older (78.1 vs. 75.6 years; p < 0.0001, Table S3) at the time of FFQ completion than those who remained free from dementia. Participants with incident dementia were more likely to be women and to be APOE4 carriers. At baseline, they had lower MMSE and Mediterranean-like diet scores. In sensitivity analyses that evaluated the association between GL tertiles and cognitive performance by excluding participants with incident dementia (Tables S4 and S5), the afternoon snack GL × time × APOE4 interaction was no longer significant.
In APOE4 non-carriers, the results of the sensitivity analyses were qualitatively comparable to those of the main analyses, except for the association between lunch GL tertile and baseline IST score that was no longer significant. In APOE4 carriers, no association remained significant.
Taken together, these results suggest that in APOE4 carriers, the afternoon snack GL is associated with cognitive decline, but not in the sample without participants with incident dementia.

4. Discussion

Our results suggest that high afternoon snack GL is associated with cognitive decline in visual memory (BVRT), episodic memory (FCSRT) and global cognition (MMSE) in APOE4 carriers during a 12-year follow-up.
To our knowledge, no study has reported the effect of the GL of different meals on the long-term cognitive performance. Cross-sectional studies showed that high-GL diet is related to poorer cognitive performance. Specifically, three epidemiological studies found that high-GL diet is associated with lower global cognition [41,42,43], and two with poorer episodic memory [42,44]. One longitudinal study showed that a high-GL diet is associated with reduced verbal ability [17]. The 1946 British birth cohort study also found that higher GI diet at the age of 53 years was associated with lower episodic memory and processing speed at the age of 69 years, although these associations did not remain significant after adjustment for education and cognitive abilities at the age of 15 years [45]. In the Chinese Longitudinal Health Longevity Survey, consumption of sugar “almost every day” was associated with a 17% increase in the risk of cognitive impairment during the 15-year follow-up [46].
Regarding the effect of APOE4 status on the diet GL with cognitive performance interaction, Gardener and collaborators reported that high-GL diet is associated with lower episodic memory in APOE4 non-carriers and with lower attention capacity in APOE4 carriers [47]. Hanson and collaborators also found a differential effect of a meal with high GI on cognition according to APOE4 carrier and cognitive status (normal cognition vs. cognitive impairment) [48]. Specifically, when switching from the high-GI meal to the low-GI meal, the delayed memory composite score was better in APOE4 carriers with normal cognition than in APOE4 non-carriers. In addition, APOE4 carriers with cognitive impairment had a better executive function composite score than APOE4 non-carriers with normal cognition, when switching from the high-GI meal to the low-GI meal.
Here, we found that the interaction between afternoon snack GL and APOE4 was associated with cognitive decline, suggesting an underlying dementia-specific mechanism between APOE4 and carbohydrate metabolism. Our findings are consistent with our previous work showing that the afternoon snack GL and APOE4 interaction is associated with dementia risk [16]. They also highlight that high afternoon snack GL might contribute to dementia development by affecting specific cognitive domains (visual memory and episodic memory) in APOE4 carriers.
The relationship between afternoon snack GL and cognitive decline among APOE4 carriers could be explained by a biological mechanism. First, the afternoon snack is the meal with the highest GL foods and the breakfast is the second one [16]. The more a meal has a high GL the more will be the spike of glycemia and insulinemia. Thus, a chronic exposure to high-GL diet, like snacking, could promote the development of insulin resistance and impaired glucoregulation [49,50], trough oxidation stress and inflammation [51,52]. In addition, it has been demonstrated that APOE4 carriers have poor brain glucose metabolism [11,12], and tend to be insulin resistant [8,9]. Indeed, in animal models, ApoE4 impairs insulin signaling [13]. This hypothesis is supported by several epidemiological studies [14,49,53,54]. For examples, in older adults with poor glucoregulation, GL was inversely associated with global cognitive function and figural memory [53]. In the Framingham Heart Study, elevated glycemia in midlife was associated with more severe Alzheimer’s disease pathology in APOE4 carriers [54].
Conversely, we found that the daily GL middle tertile was associated with better attention and visual motor processing speed (TMTA) over time, and that the middle and high lunch GL tertiles were associated with better executive function (TMT) over time. One interventional study showed that dietary carbohydrates could increase cognitive performance in healthy elderly subjects with poor memory or poor β cell function, independently of glucoregulation [55]. Lunch is the main meal of the day and the lunch GL was strongly correlated with the overall daily GL (r = 0.64; p < 0.0001). In France, the most frequent components of lunch are vegetable and legumes (i.e., fibers) and, meat that have a null GL value, dairy products that have a relatively low GL value, and bread and cereals [10]. Although bread and cereals have a quite high GL, they are rarely ingested alone in the context of a meal. The ingestion of cereals with fat and fiber decreases the glycemic response [19,20]. Thus, a healthy meal composed of vegetables, fruits and some cereals could be beneficial for the cognitive performance. Indeed, it has been largely demonstrated that the Mediterranean diet is a protective factor against cognitive decline [2]. Moreover, lunch, dinner, and the daily GL are highly correlated with EI. Thus, the beneficial effects of high GL on cognitive performance could be explained by the maintenance of an adequate EI needed for good health in the elderly.
Our current study presents some limitations. First, we cannot exclude the possibility that the absence of significant associations between the APOE4 × afternoon snack GL interaction and cognitive decline in the sensitivity analysis without participants with incident dementia is due to lack of statistical power. Indeed, by excluding participants who developed dementia (13%), 18% of APOE4 carriers were removed from the sample (Table S3). Second, our GL estimations relied on a FFQ that is less detailed than other dietary assessments. However, GL estimations from the FFQ were previously validated by 24-h dietary recalls [16]. Third, as the dietary assessment was carried out only at baseline, we cannot exclude that participants may have changed their diet during the follow-up. The major strength of our study is the large sample size and the longitudinal design with repeated cognitive assessments over time that allowed monitoring the cognitive decline kinetics. In addition, the cognitive assessments covered large cognitive domains: verbal fluency, visual memory, attention, visual motor processing speed, episodic memory, and global cognition.
In this prospective study, high afternoon snack GL was associated with cognitive decline in APOE4 carriers. These results must be now replicated. Nevertheless, they might help to develop intervention strategies with the aim of delaying or preventing cognitive decline. Our study also invites to better consider in future studies the role of the interaction between APOE4 and refined carbohydrate-rich diet on cognition.

Supplementary Materials

The following are available online at https://www.mdpi.com/2072-6643/12/12/3619/s1, Table S1. Comparison of the characteristics of participants according to afternoon snack glycemic load, Table S2. Associations of glycemic load with cognitive changes during the 12-year follow-up, Table S3. Comparison of the characteristics of participants with and without incident dementia during the 12-year follow-up, Table S4. Associations of glycemic load with cognitive changes (12-year follow-up) in APOE4 non-carriers without incident dementia, Table S5. Associations of glycemic load with cognitive changes (12-year follow-up) in APOE4 carriers without incident dementia.

Author Contributions

Conceptualization, S.A., C.B. and M.R.; methodology, M.G., V.C.; software, M.G.; validation, S.A. and C.B.; formal analysis, M.G.; investigation, M.G.; resources, S.A., C.B., C.S. and C.F.; data curation, S.A.; writing—original draft preparation, M.G.; writing—review and editing, M.G., S.A., C.B., M.R., C.S. and C.F.; visualization, M.G.; supervision, S.A. and C.B.; project administration, S.A.; funding acquisition, S.A. All authors have read and agreed to the published version of the manuscript.

Funding

The 3C Study is carried out under a partnership agreement between Inserm, the Victor Segalen–Bordeaux II University, and Sanofi-Synthélabo. The Fondation pour la Recherche Médicale funded the preparation and first phase of the study. The 3C Study is also supported by the Caisse Nationale Maladie des Travailleurs Salariés, Direction Générale de la Santé, MGEN, the Institut de la Longévité, Agence Française de Sécurité Sanitaire des Produits de Santé, the Regional Governments of Aquitaine, Bourgogne and Languedoc-Roussillon, Fondation de France, and the Ministry of Research-Inserm Programme ‘Cohorts and collection of biological material’. This is contribution ISEM 2020—XXX of the Institute of Evolutionary Science of Montpellier. This research was supported by Union France Alzheimer.

Acknowledgments

We thank Elisabetta Andermarcher for editing English.

Conflicts of Interest

The authors declare no conflict of interest. The funders had no role in the design of the study; in the collection, analyses, or interpretation of data; in the writing of the manuscript, or in the decision to publish the results.

References

  1. Shah, H.; Albanese, E.; Duggan, C.; Rudan, I.; Langa, K.M.; Carrillo, M.C.; Chan, K.Y.; Joanette, Y.; Prince, M.; Rossor, M.; et al. Research priorities to reduce the global burden of dementia by 2025. Lancet Neurol. 2016, 15, 1285–1294. [Google Scholar] [CrossRef]
  2. Scarmeas, N.; Anastasiou, C.A.; Yannakoulia, M. Nutrition and prevention of cognitive impairment. Lancet Neurol. 2018, 17, 1006–1015. [Google Scholar] [CrossRef]
  3. Barberger-Gateau, P.; Samieri, C.; Féart, C.; Plourde, M. Dietary omega 3 polyunsaturated fatty acids and Alzheimer’s disease: Interaction with apolipoprotein E genotype. Curr. Alzheimer Res. 2011, 8, 479–491. [Google Scholar] [CrossRef] [PubMed] [Green Version]
  4. Kivipelto, M.; Rovio, S.; Ngandu, T.; Kåreholt, I.; Eskelinen, M.; Winblad, B.; Hachinski, V.; Cedazo-Minguez, A.; Soininen, H.; Tuomilehto, J.; et al. Apolipoprotein E epsilon4 magnifies lifestyle risks for dementia: A population-based study. J. Cell. Mol. Med. 2008, 12, 2762–2771. [Google Scholar] [CrossRef] [PubMed] [Green Version]
  5. Schipper, H.M. Apolipoprotein E: Implications for AD neurobiology, epidemiology and risk assessment. Neurobiol. Aging 2011, 32, 778–790. [Google Scholar] [CrossRef]
  6. Kern, S.; Mehlig, K.; Kern, J.; Zetterberg, H.; Thelle, D.; Skoog, I.; Lissner, L.; Blennow, K.; Börjesson-Hanson, A. The Distribution of Apolipoprotein E Genotype over the Adult Lifespan and in Relation to Country of Birth. Am. J. Epidemiol. 2015, 181, 214–217. [Google Scholar] [CrossRef] [Green Version]
  7. Hersi, M.; Irvine, B.; Gupta, P.; Gomes, J.; Birkett, N.; Krewski, D. Risk factors associated with the onset and progression of Alzheimer’s disease: A systematic review of the evidence. NeuroToxicology 2017, 61, 143–187. [Google Scholar] [CrossRef]
  8. Wu, L.; Zhang, X.; Zhao, L. Human ApoE Isoforms Differentially Modulate Brain Glucose and Ketone Body Metabolism: Implications for Alzheimer’s Disease Risk Reduction and Early Intervention. J. Neurosci. Off. J. Soc. Neurosci. 2018, 38, 6665–6681. [Google Scholar] [CrossRef]
  9. Safieh, M.; Korczyn, A.D.; Michaelson, D.M. ApoE4: An emerging therapeutic target for Alzheimer’s disease. BMC Med. 2019, 17, 64. [Google Scholar] [CrossRef] [Green Version]
  10. Farmer, B.C.; Johnson, L.A.; Hanson, A.J. Effects of apolipoprotein E on nutritional metabolism in dementia. Curr. Opin. Lipidol. 2019, 30, 10–15. [Google Scholar] [CrossRef]
  11. Reiman, E.M.; Chen, K.; Alexander, G.E.; Caselli, R.J.; Bandy, D.; Osborne, D.; Saunders, A.M.; Hardy, J. Functional brain abnormalities in young adults at genetic risk for late-onset Alzheimer’s dementia. Proc. Natl. Acad. Sci. USA 2004, 101, 284–289. [Google Scholar] [CrossRef] [PubMed] [Green Version]
  12. Brandon, J.A.; Farmer, B.C.; Williams, H.C.; Johnson, L.A. APOE and Alzheimer’s Disease: Neuroimaging of Metabolic and Cerebrovascular Dysfunction. Front. Aging Neurosci. 2018, 10, 180. [Google Scholar] [CrossRef] [Green Version]
  13. Zhao, N.; Liu, C.-C.; Van Ingelgom, A.J.; Martens, Y.A.; Linares, C.; Knight, J.A.; Painter, M.M.; Sullivan, P.M.; Bu, G. Apolipoprotein E4 Impairs Neuronal Insulin Signaling by Trapping Insulin Receptor in the Endosomes. Neuron 2017, 96, 115–129.e5. [Google Scholar] [CrossRef] [Green Version]
  14. Rönnemaa, E.; Zethelius, B.; Sundelöf, J.; Sundström, J.; Degerman-Gunnarsson, M.; Berne, C.; Lannfelt, L.; Kilander, L. Impaired insulin secretion increases the risk of Alzheimer disease. Neurology 2008, 71, 1065–1071. [Google Scholar] [CrossRef]
  15. Arnold, S.E.; Arvanitakis, Z.; Macauley-Rambach, S.L.; Koenig, A.M.; Wang, H.-Y.; Ahima, R.S.; Craft, S.; Gandy, S.; Buettner, C.; Stoeckel, L.E.; et al. Brain insulin resistance in type 2 diabetes and Alzheimer disease: Concepts and conundrums. Nat. Rev. Neurol. 2018, 14, 168–181. [Google Scholar] [CrossRef] [PubMed]
  16. Gentreau, M.; Chuy, V.; Féart, C.; Samieri, C.; Ritchie, K.; Raymond, M.; Berticat, C.; Artero, S. Refined carbohydrate-rich diet is associated with long-term risk of dementia and Alzheimer’s disease in apolipoprotein E ε4 allele carriers. Alzheimers Dement. J. Alzheimers Assoc. 2020, 16, 1043–1053. [Google Scholar] [CrossRef] [PubMed]
  17. Seetharaman, S.; Andel, R.; McEvoy, C.; Dahl Aslan, A.K.; Finkel, D.; Pedersen, N.L. Blood Glucose, Diet-Based Glycemic Load and Cognitive Aging Among Dementia-Free Older Adults. J. Gerontol. Ser. A 2015, 70, 471–479. [Google Scholar] [CrossRef] [PubMed] [Green Version]
  18. Sun, L.; Goh, H.J.; Govindharajulu, P.; Leow, M.K.-S.; Henry, C.J. Postprandial glucose, insulin and incretin responses differ by test meal macronutrient ingestion sequence (PATTERN study). Clin. Nutr. 2019, 39, 950–957. [Google Scholar] [CrossRef]
  19. Post, R.E.; Mainous, A.G.; King, D.E.; Simpson, K.N. Dietary fiber for the treatment of type 2 diabetes mellitus: A meta-analysis. J. Am. Board Fam. Med. JABFM 2012, 25, 16–23. [Google Scholar] [CrossRef] [Green Version]
  20. Hätönen, K.A.; Virtamo, J.; Eriksson, J.G.; Sinkko, H.K.; Sundvall, J.E.; Valsta, L.M. Protein and fat modify the glycaemic and insulinaemic responses to a mashed potato-based meal. Br. J. Nutr. 2011, 106, 248–253. [Google Scholar] [CrossRef] [Green Version]
  21. 3C Study Group. Vascular factors and risk of dementia: Design of the Three-City Study and baseline characteristics of the study population. Neuroepidemiology 2003, 22, 316–325. [Google Scholar] [CrossRef] [PubMed]
  22. Monro, J.A.; Shaw, M. Glycemic impact, glycemic glucose equivalents, glycemic index, and glycemic load: Definitions, distinctions, and implications. Am. J. Clin. Nutr. 2008, 87, 237S–243S. [Google Scholar] [CrossRef] [PubMed] [Green Version]
  23. Foster-Powell, K.; Holt, S.H.A.; Brand-Miller, J.C. International table of glycemic index and glycemic load values: 2002. Am. J. Clin. Nutr. 2002, 76, 5–56. [Google Scholar] [CrossRef] [PubMed] [Green Version]
  24. Glycemic Index. Available online: www.glycemicindex.com (accessed on 7 November 2018).
  25. Ciqual, Table de Composition Nutritionnelle des Aliments. Available online: www.anses.ciqual.fr (accessed on 7 November 2018).
  26. Isaacs, B.; Kennie, A.T. The Set test as an aid to the detection of dementia in old people. Br. J. Psychiatry J. Ment. Sci. 1973, 123, 467–470. [Google Scholar] [CrossRef] [PubMed]
  27. Benton, A.L. Manuel du Test de Rétention Visuelle. Applications Cliniques et Expérimentales; Centre de Psychologie Appliquée: Paris, France, 1965. [Google Scholar]
  28. Reitan, R.M. Validity of the Trail Making Test as an Indicator of Organic Brain Damage. Percept. Mot. Skills 1958, 8, 271–276. [Google Scholar] [CrossRef]
  29. Van der Linden, M.; Coyette, F.; Poitrenaud, J.; Kalafat, M.; Calicis, F.; Wyns, C.; Adam, S. L’épreuve de rappel libre/rappel indice à 16 items (RL/RI-16). In L’évaluation des Troubles de la Mémoire: Présentation de Quatre Tests de Mémoire Épisodique (avec leur Étalonnage); Van der Linden, M., Adam, S., Agniel, A., Baisset Mouly, C., les membres du GREMEM, Eds.; Solal Editeur: Marseille, France, 2004; pp. 25–47. [Google Scholar]
  30. Grober, E.; Buschke, H.; Crystal, H.; Bang, S.; Dresner, R. Screening for dementia by memory testing. Neurology 1988, 38, 900–903. [Google Scholar] [CrossRef]
  31. Mura, T.; Baramova, M.; Gabelle, A.; Artero, S.; Dartigues, J.-F.; Amieva, H.; Berr, C. Predicting dementia using socio-demographic characteristics and the Free and Cued Selective Reminding Test in the general population. Alzheimers Res. Ther. 2017, 9, 21. [Google Scholar] [CrossRef] [Green Version]
  32. Folstein, M.F.; Folstein, S.E.; McHugh, P.R. “Mini-mental state”. A practical method for grading the cognitive state of patients for the clinician. J. Psychiatr. Res. 1975, 12, 189–198. [Google Scholar] [CrossRef]
  33. American Psychiatric Association. Diagnostic and Statistical Manual of Mental Disorders, Text Revision (DSM-IV-TR), 4th ed.; American Psychiatric Association: Washington, DC, USA, 2000; ISBN 978-0-89042-062-1. [Google Scholar]
  34. Dufouil, C.; Richard, F.; Fiévet, N.; Dartigues, J.F.; Ritchie, K.; Tzourio, C.; Amouyel, P.; Alpérovitch, A. APOE genotype, cholesterol level, lipid-lowering treatment, and dementia: The Three-City Study. Neurology 2005, 64, 1531–1538. [Google Scholar] [CrossRef]
  35. Brindel, P.; Hanon, O.; Dartigues, J.-F.; Ritchie, K.; Lacombe, J.-M.; Ducimetière, P.; Alpérovitch, A.; Tzourio, C.; 3C Study Investigators. Prevalence, awareness, treatment, and control of hypertension in the elderly: The Three City study. J. Hypertens. 2006, 24, 51–58. [Google Scholar] [CrossRef]
  36. Radloff, L.S. The CES-D Scale: A Self-Report Depression Scale for Research in the General Population. Appl. Psychol. Meas. 1977, 1, 385–401. [Google Scholar] [CrossRef]
  37. Fuhrer, R.; Rouillon, F. La version française de l’échelle CES-D (Center for Epidemiologic Studies-Depression Scale). Description et traduction de l’échelle d’autoévaluation. Eur. Psychiatry 1989, 4, 163–166. [Google Scholar] [CrossRef]
  38. Letois, F.; Mura, T.; Scali, J.; Gutierrez, L.-A.; Féart, C.; Berr, C. Nutrition and mortality in the elderly over 10 years of follow-up: The Three-City study. Br. J. Nutr. 2016, 116, 882–889. [Google Scholar] [CrossRef] [PubMed] [Green Version]
  39. Van Buuren, S. Flexible Imputation of Missing Data, 2nd ed.; Chapman & Hall/CRC: New York, NY, USA, 2018. [Google Scholar]
  40. R: The R Project for Statistical Computing. Available online: www.r-project.org (accessed on 30 September 2018).
  41. Chong, C.P.; Shahar, S.; Haron, H.; Din, N.C. Habitual sugar intake and cognitive impairment among multi-ethnic Malaysian older adults. Clin. Interv. Aging 2019, 14, 1331–1342. [Google Scholar] [CrossRef] [PubMed] [Green Version]
  42. Taylor, M.K.; Sullivan, D.K.; Swerdlow, R.H.; Vidoni, E.D.; Morris, J.K.; Mahnken, J.D.; Burns, J.M. A high-glycemic diet is associated with cerebral amyloid burden in cognitively normal older adults. Am. J. Clin. Nutr. 2017, 106, 1463–1470. [Google Scholar] [CrossRef]
  43. Power, S.E.; O’Connor, E.M.; Ross, R.P.; Stanton, C.; O’Toole, P.W.; Fitzgerald, G.F.; Jeffery, I.B. Dietary glycaemic load associated with cognitive performance in elderly subjects. Eur. J. Nutr. 2015, 54, 557–568. [Google Scholar] [CrossRef]
  44. Pase, M.P.; Himali, J.J.; Jacques, P.F.; DeCarli, C.; Satizabal, C.L.; Aparicio, H.; Vasan, R.S.; Beiser, A.S.; Seshadri, S. Sugary beverage intake and preclinical Alzheimer’s disease in the community. Alzheimers Dement. 2017, 13, 955–964. [Google Scholar] [CrossRef]
  45. Philippou, E.; Pot, G.K.; Heraclides, A.; Richards, M.; Bendayan, R. Dietary glycaemic index and cognitive function: Prospective associations in adults of the 1946 British birth cohort. Public Health Nutr. 2019, 22, 1415–1424. [Google Scholar] [CrossRef] [Green Version]
  46. An, R.; Liu, G.; Khan, N.; Yan, H.; Wang, Y. Dietary Habits and Cognitive Impairment Risk Among Oldest-Old Chinese. J. Gerontol. B Psychol. Sci. Soc. Sci. 2019, 74, 474–483. [Google Scholar] [CrossRef] [Green Version]
  47. Gardener, S.L.; Rainey-Smith, S.R.; Sohrabi, H.R.; Weinborn, M.; Verdile, G.; Fernando, W.M.A.D.B.; Lim, Y.Y.; Harrington, K.; Burnham, S.; Taddei, K.; et al. Increased Carbohydrate Intake is Associated with Poorer Performance in Verbal Memory and Attention in an APOE Genotype-Dependent Manner. J. Alzheimers Dis. JAD 2017, 58, 193–201. [Google Scholar] [CrossRef]
  48. Hanson, A.J.; Bayer, J.L.; Baker, L.D.; Cholerton, B.; VanFossen, B.; Trittschuh, E.; Rissman, R.A.; Donohue, M.C.; Moghadam, S.H.; Plymate, S.R.; et al. Differential Effects of Meal Challenges on Cognition, Metabolism, and Biomarkers for Apolipoprotein E ε4 Carriers and Adults with Mild Cognitive Impairment. J. Alzheimers Dis. JAD 2015, 48, 205–218. [Google Scholar] [CrossRef] [PubMed]
  49. McKeown, N.M.; Meigs, J.B.; Liu, S.; Saltzman, E.; Wilson, P.W.F.; Jacques, P.F. Carbohydrate nutrition, insulin resistance, and the prevalence of the metabolic syndrome in the Framingham Offspring Cohort. Diabetes Care 2004, 27, 538–546. [Google Scholar] [CrossRef] [PubMed] [Green Version]
  50. Cao, D.; Lu, H.; Lewis, T.L.; Li, L. Intake of sucrose-sweetened water induces insulin resistance and exacerbates memory deficits and amyloidosis in a transgenic mouse model of Alzheimer disease. J. Biol. Chem. 2007, 282, 36275–36282. [Google Scholar] [CrossRef] [PubMed] [Green Version]
  51. Nolan, C.J.; Ruderman, N.B.; Kahn, S.E.; Pedersen, O.; Prentki, M. Insulin resistance as a physiological defense against metabolic stress: Implications for the management of subsets of type 2 diabetes. Diabetes 2015, 64, 673–686. [Google Scholar] [CrossRef] [PubMed] [Green Version]
  52. Butterfield, D.A.; Di Domenico, F.; Barone, E. Elevated Risk of Type 2 Diabetes for Development of Alzheimer Disease: A Key Role for Oxidative Stress in Brain. Biochim. Biophys. Acta 2014, 1842, 1693–1706. [Google Scholar] [CrossRef] [PubMed] [Green Version]
  53. Garber, A.; Csizmadi, I.; Friedenreich, C.M.; Sajobi, T.T.; Longman, R.S.; Tyndall, A.V.; Drogos, L.L.; Davenport, M.H.; Poulin, M.J. Association between glycemic load and cognitive function in community-dwelling older adults: Results from the Brain in Motion study. Clin. Nutr. Edinb. Scotl. 2018, 37, 1690–1699. [Google Scholar] [CrossRef] [Green Version]
  54. Bangen, K.J.; Himali, J.J.; Beiser, A.S.; Nation, D.A.; Libon, D.J.; Fox, C.S.; Seshadri, S.; Wolf, P.A.; McKee, A.C.; Au, R.; et al. Interaction Between Midlife Blood Glucose and APOE Genotype Predicts Later Alzheimer’s Disease Pathology. J. Alzheimers Dis. JAD 2016, 53, 1553–1562. [Google Scholar] [CrossRef] [Green Version]
  55. Kaplan, R.J.; Greenwood, C.E.; Winocur, G.; Wolever, T.M. Cognitive performance is associated with glucose regulation in healthy elderly persons and can be enhanced with glucose and dietary carbohydrates. Am. J. Clin. Nutr. 2000, 72, 825–836. [Google Scholar] [CrossRef]
Figure 1. Time frame of the three-city study. Neuropsychological evaluations and dementia diagnoses were made at each follow-up visit. Participants completed the FFQ at the 2-year follow-up visit (Bordeaux center) or at the 4-year follow-up visit (Montpellier center). BVRT, Benton Visual Retention Test; FCSRT, Free and Cued Selective Reminding Test; FFQ, Food Frequency Questionnaire; IST, Isaacs Set Test; MMSE, Mini Mental State Examination; TMT, Trail Making Test.
Nutrients 12 03619 g001
Figure 2. Three-City study flow chart.
Nutrients 12 03619 g002
Table 1. Description of the study population (n = 2539).
Characteristics
Mean (SD) or n (%)
Daily Glycemic Load Tertiles
Low
(<93)
n = 846
Middle
(93 to <119)
n = 845
High
(≥119)
n = 848
p Value 1
Montpellier center342 (40.4)390 (46.2)527 (62.1)<0.0001
Age (years)75.9 (4.8)75.5 (4.8)76.4 (4.9)0.038
Women572 (67.6)512 (60.6)515 (60.7)0.003
Education level 0.19
No school231 (27.3)216 (25.6)208 (24.5)
Primary school237 (28)265 (31.4)224 (26.4)
High school192 (22.7)183 (21.7)210 (24.8)
Graduated185 (21.9)178 (21.1)204 (24.1)
MMSE (IQR)28 (27-29)28 (27-29)28 (27–29)0.805
APOE4 carriers142 (16.8)156 (18.5)144 (17)0.539
BMI (kg/m2)26.1 (4.1)25.6 (3.9)24.8 (3.4)<0.0001
Hypertension521 (61.6)487 (57.6)465 (54.8)0.017
Cardiovascular history90 (10.6)82 (9.7)77 (9.1)0.555
Stroke history37 (4.4)25 (3)39 (4.6)0.173
Hypercholesterolemia464 (54.8)475 (56.2)452 (53.3)0.486
Depressive symptomatology 274 (8.7)56 (6.6)70 (8.3)0.238
Tobacco use (current or past)337 (39.8)310 (36.7)300 (35.4)0.15
Mediterranean-like diet4.3 (1.6)5 (1.6)5.5 (1.5)<0.0001
Physical activity251 (29.7)274 (32.4)317 (37.4)0.002
Energy intake (kJ/day)3553.2 (698.8)4694.5 (656.2)6379.4 (1476.5)<0.0001
1 Chi-square test for categorical variables, ANOVA or Kruskal–Wallis test for continuous variables. 2 evaluated with the Center for Epidemiological Studies-Depression scale. APOE4, Apolipoprotein E ε4 allele; BMI, Body Mass Index; IQR Interquartile range; MMSE, Mini Mental State Examination; SD, standard deviation.
Table 2. Associations of glycemic load with cognitive changes in APOE4 non-carriers (12-year follow-up).
Glycemic LoadIST
n = 1815
BVRT
n = 1794
log(TMTA)
n = 1612
log(TMTB)
n = 1593
FIRS
n = 1351
FDRS
n = 1348
MMSE
n = 1831
β (SE)β (SE)β (SE)β (SE)β (SE)β (SE)β (SE)
Daily
Middle−0.159 (0.654)−0.1 (0.12)0.003 (0.026)0.01 (0.029)0.649 (0.654)0.304 (0.285)−0.096 (0.119)
High−0.103 (0.82)−0.129 (0.146)0.023 (0.032)−0.004 (0.035)0.944 (0.757)0.411 (0.326)0.03 (0.147)
Middle × time0.102 (0.056)0.008 (0.012)0.006 * (0.003)−0.003 (0.003)0.015 (0.075)0.003 (0.034)0.022 (0.024)
High × time0.086 (0.055)0.01 (0.012)−0.004 (0.003)−0.001 (0.003)0.045 (0.073)0.007 (0.033)−0.015 (0.024)
Breakfast
Middle0.608 (0.579)0.073 (0.109)-0.033 (0.024)−0.031 (0.026)−0.965 (0.604)0.136 (0.267)0.058 (0.105)
High0.136 (0.67)0.033 (0.122)0.015 (0.027)−0.036 (0.029)−0.31 (0.644)0.026 (0.28)0.07 (0.121)
Middle × time0.031 (0.057)−0.005 (0.012)0 (0.003)0.002 (0.003)0.136 (0.076)−0.014 (0.035)0.023 (0.024)
High × time0.08 (0.054)0.015 (0.012)−0.003 (0.003)0 (0.003)0.09 (0.071)0.01 (0.032)0.023 (0.023)
Lunch
Middle1.312 * (0.6)−0.07 (0.114)0.027 (0.025)0.067 (0.027)0.292 (0.627)−0.279 (0.274)0.017 (0.11)
High1.904 ** (0.732)0.324 * (0.133)0.074 * (0.029)0.066 (0.032)0.124 (0.687)−0.1 (0.297)−0.054 (0.132)
Middle × time0.021 (0.057)−0.008 (0.012)−0.001 (0.003)−0.008 ** (0.003)−0.055 (0.077)0.026 (0.035)−0.021 (0.024)
High × time0.102 (0.054)0.011 (0.012)−0.006 * (0.003)−0.006 * (0.003)0.064 (0.072)0.025 (0.033)−0.012 (0.023)
Afternoon snack
Middle−2.125 (5.936)−0.552 (0.964)−0.003 (0.216)−0.07 (0.225)−2.922 (4.169)−0.029 (1.732)−0.328 (1.035)
High−2.924 (5.978)−0.61 (0.972)0.019 (0.217)−0.047 (0.227)−3.165 (4.205)0.16 (1.747)−0.44 (1.043)
Middle × time−0.054 (0.054)−0.006 (0.012)−0.002 (0.003)−0.002 (0.003)0.026 (0.072)−0.016 (0.033)−0.016 (0.023)
High × time0.038 (0.056)−0.006 (0.012)−0.002 (0.003)0.001 (0.003)0.106 (0.074)0.001 (0.034)−0.035 (0.024)
Dinner
Middle0.565 (0.601)−0.065 (0.113)0.033 (0.025)0.054 (0.027)−0.056 (0.616)−0.19 (0.269)−0.178 (0.109)
High0.194 (0.778)−0.204 (0.138)0.064 * (0.03)0.072 * (0.033)0.212 (0.71)−0.03 (0.305)−0.066 (0.139)
Middle × time0.027 (0.056)0.017 (0.012)0.002 (0.003)0.002 (0.003)0.046 (0.075)0.039 (0.034)0.045 (0.024)
High × time−0.015 (0.053)0.019 (0.012)−0.003 (0.003)−0.001 (0.003)−0.02 (0.071)0.015 (0.032)0.001 (0.023)
Linear random-effect models adjusted for time, center, age, sex, education level (and their interaction with time), energy intake, BMI, hypertension, cardiovascular history, stroke history, hypercholesterolemia, CES-D score, smoking status, Mediterranean-like diet score, and physical activity. Results showing a trend (p < 0.07) and significant results (* p < 0.05; ** p < 0.01) are in bold. APOE4, Apolipoprotein E ε4 allele; BVRT, Benton Visual Retention Test; FIRS, Free Immediate Recall Score; FDRS, Free Delayed Recall Score; IST, Isaacs Set Test; MMSE, Mini Mental State Examination; SE, standard error; TMT, Trail Making Test.
Table 3. Associations of glycemic load with cognitive change in APOE4 carriers (12-year follow-up).
Glycemic LoadIST
n = 401
BVRT
n = 401
log(TMTA)
n = 348
log(TMTB)
n = 348
FIRS
n = 278
FDRS
n = 275
MMSE
n = 409
β (SE)β (SE)β (SE)β (SE)β (SE)β (SE)β (SE)
Daily
Middle−0.719 (1.402)−0.049 (0.259)0.04 (0.059)−0.024 (0.065)−0.018 (1.58)−0.037 (0.706)0.183 (0.266)
High−1.476 (1.741)0.115 (0.316)0.034 (0.071)−0.034 (0.077)0.428 (1.811)0.747 (0.799)0.141 (0.332)
Middle × time0.086 (0.134)−0.009 (0.033)0.002 (0.006)−0.002 (0.007)−0.033 (0.2)0.03 (0.093)−0.013 (0.062)
High × time0.042 (0.131)−0.031 (0.032)0.007 (0.006)0.001 (0.006)−0.167 (0.196)−0.103 (0.09)−0.028 (0.062)
Breakfast
Middle−1.571 (1.237)−0.055 (0.234)0.037 (0.054)−0.022 (0.058)−0.771 (1.475)−0.649 (0.654)0.088 (0.238)
High−1.647 (1.444)−0.201 (0.267)0.065 (0.059)−0.06 (0.064)0.192 (1.534)−0.133 (0.677)0.165 (0.279)
Middle × time−0.11 (0.134)−0.041 (0.034)0.003 (0.007)0.002 (0.007)−0.095 (0.2)−0.007 (0.092)−0.143 * (0.061)
High × time0.018 (0.126)−0.053 (0.031)0.002 (0.006)0.004 (0.006)−0.269 (0.18)−0.076 (0.083)−0.051 (0.057)
Lunch
Middle−0.772 (1.27)0.006 (0.242)0.114 * (0.055)−0.005 (0.06)1.738 (1.521)0.325 (0.683)0.032 (0.246)
High−0.202 (1.58)0.219 (0.293)0.085 (0.065)−0.066 (0.07)0.545 (1.674)−0.452 (0.76)−0.162 (0.302)
Middle × time0.038 (0.132)0.021 (0.033)−0.01 (0.006)−0.001 (0.006)−0.09 (0.195)−0.007 (0.089)0.039 (0.06)
High × time0.011 (0.131)−0.024 (0.032)−0.006 (0.006)0.002 (0.006)−0.082 (0.188)−0.055 (0.087)−0.024 (0.06)
Afternoon snack
Middle15.27 (8.8)0.896 (1.499)−0.032 (0.322)0.082 (0.345)−0.888 (6.569)−1.579 (2.938)−2.218 (1.747)
High14.429 (8.908)0.421 (1.524)0.071 (0.326)0.277 (0.349)0.386 (6.723)−1.213 (3.01)−2.522 (1.77)
Middle × time−0.069 (0.133)−0.071 * (0.033)0.004 (0.006)0.005 (0.007)0.081 (0.198)−0.005 (0.091)−0.04 (0.06)
High × time−0.183 (0.129)−0.04 (0.032)0.011 (0.006)0.002 (0.006)−0.343 (0.188)−0.175 * (0.087)−0.158 ** (0.059)
Dinner
Middle0.962 (1.343)−0.012 (0.255)−0.026 (0.058)−0.051 (0.063)1.418 (1.589)0.351 (0.711)−0.002 (0.255)
High2.361 (1.765)0.281 (0.31)−0.011 (0.071)−0.058 (0.077)0.943 (1.81)−0.116 (0.805)−0.184 (0.32)
Middle × time−0.067 (0.139)−0.031 (0.035)0.006 (0.007)0.006 (0.007)−0.141 (0.204)−0.054 (0.094)−0.034 (0.063)
High × time0.029 (0.128)−0.02 (0.032)0.005 (0.006)−0.004 (0.006)−0.129 (0.193)−0.033 (0.087)0.012 (0.058)
Linear random-effect models adjusted for time, center, age, sex, education level (and their interaction with time), energy intake, BMI, hypertension, cardiovascular history, stroke history, hypercholesterolemia, CES-D score, smoking status, Mediterranean-like diet score, and physical activity. Results showing a trend (p < 0.07) and significant results (* p < 0.05; ** p < 0.01) are in bold. APOE4, Apolipoprotein E ε4 allele; BVRT, Benton Visual Retention Test; FIRS, Free Immediate Recall Score; FDRS, Free Delayed Recall Score; IST, Isaacs Set Test; MMSE, Mini Mental State Examination; SE, standard error; TMT, Trail Making Test.
Publisher’s Note: MDPI stays neutral with regard to jurisdictional claims in published maps and institutional affiliations.

