Lean Women on Metformin and Oral Contraceptives for Polycystic Ovary Syndrome Demonstrate a Dehydrated Osteosarcopenic Phenotype: A Pilot Study

 ,
,  ,
,  ,
,
Abstract
1. Introduction
2. Materials and Methods
2.1. Study Design—Setting—Participants
2.2. Variable Measurements
BIA Measurements
2.3. Bias
2.4. Statistical Analyses and Sample Size Calculation
3. Results
3.1. Participants
3.2. Descriptive Data
3.3. Outcome Data—Main Results
3.4. Other Analyses
4. Discussion
Author Contributions
Funding
Acknowledgments
Conflicts of Interest
References
- Fauser, B.C.; Tarlatzis, B.C.; Rebar, R.W.; Legro, R.S.; Balen, A.H.; Lobo, R.; Carmina, E.; Chang, J.; Yildiz, B.O.; Laven, J.S.; et al. Consensus on women’s health aspects of polycystic ovary syndrome (PCOS): The Amsterdam ESHRE/ASRM-Sponsored 3rd PCOS Consensus Workshop Group. Fertil. Steril. 2012, 97, 28–38. [Google Scholar] [CrossRef] [PubMed]
- Diamanti-Kandarakis, E.; Kouli, C.R.; Bergiele, A.T.; Filandra, F.A.; Tsianateli, T.C.; Spina, G.G.; Zapanti, E.D.; Bartzis, M.I. A survey of the polycystic ovary syndrome in the Greek island of Lesbos: Hormonal and metabolic profile. J. Clin. Endocrinol. Metab. 1999, 84, 4006–4011. [Google Scholar] [CrossRef] [PubMed]
- Jeanes, Y.M.; Reeves, S. Metabolic consequences of obesity and insulin resistance in polycystic ovary syndrome: Diagnostic and methodological challenges. Nutr. Res. Rev. 2017, 30, 97–105. [Google Scholar] [CrossRef] [PubMed]
- Komarowska, H.; Stangierski, A.; Warmuz-Stangierska, I.; Lodyga, M.; Ochmanska, K.; Wasko, R.; Wanic-Kossowska, M.; Ruchala, M. Differences in the psychological and hormonal presentation of lean and obese patients with polycystic ovary syndrome. Neuro Endocrinol. Lett. 2013, 34, 669–674. [Google Scholar] [PubMed]
- Legro, R.S.; Arslanian, S.A.; Ehrmann, D.A.; Hoeger, K.M.; Murad, M.H.; Pasquali, R.; Welt, C.K.; Endocrine, S. Diagnosis and treatment of polycystic ovary syndrome: An Endocrine Society clinical practice guideline. J. Clin. Endocrinol. Metab. 2013, 98, 4565–4592. [Google Scholar] [CrossRef] [PubMed]
- Toosy, S.; Sodi, R.; Pappachan, J.M. Lean polycystic ovary syndrome (PCOS): An evidence-based practical approach. J. Diabetes Metab. Disord. 2018, 17, 277–285. [Google Scholar] [CrossRef]
- Goyal, M.; Dawood, A.S. Debates Regarding Lean Patients with Polycystic Ovary Syndrome: A Narrative Review. J. Hum. Reprod. Sci. 2017, 10, 154–161. [Google Scholar] [CrossRef]
- Health, N.I.O. Bioelectrical Impedance Analysis in Body Composition Measurement. Available online: http://consensus.nih.gov/1994/1994BioelectricImpedanceBodyta015html.htm (accessed on 15 May 2015).
- Gupta, D.; Lammersfeld, C.A.; Burrows, J.L.; Dahlk, S.L.; Vashi, P.G.; Grutsch, J.F.; Hoffman, S.; Lis, C.G. Bioelectrical impedance phase angle in clinical practice: Implications for prognosis in advanced colorectal cancer. Am. J. Clin. Nutr. 2004, 80, 1634–1638. [Google Scholar] [CrossRef]
- Rubbieri, G.; Mossello, E.; Di Bari, M. Techniques for the diagnosis of sarcopenia. Clin. Cases Miner. Bone Metab. Off. J. Ital. Soc. Osteoporos. Miner. Metab. Skelet. Dis. 2014, 11, 181–184. [Google Scholar] [CrossRef]
- Jebb, S.A.; Siervo, M.; Murgatroyd, P.R.; Evans, S.; Fruhbeck, G.; Prentice, A.M. Validity of the leg-to-leg bioimpedance to estimate changes in body fat during weight loss and regain in overweight women: A comparison with multi-compartment models. Int. J. Obes. 2007, 31, 756–762. [Google Scholar] [CrossRef]
- Basu, B.R.; Chowdhury, O.; Saha, S.K. Possible Link Between Stress-related Factors and Altered Body Composition in Women with Polycystic Ovarian Syndrome. J. Hum. Reprod. Sci. 2018, 11, 10–18. [Google Scholar] [CrossRef] [PubMed]
- Stefanaki, C.; Pervanidou, P.; Boschiero, D.; Chrousos, G.P. Chronic stress and body composition disorders: Implications for health and disease. Hormones 2018, 17, 33–43. [Google Scholar] [CrossRef] [PubMed]
- Cameron, A.R.; Morrison, V.L.; Levin, D.; Mohan, M.; Forteath, C.; Beall, C.; McNeilly, A.D.; Balfour, D.J.; Savinko, T.; Wong, A.K.; et al. Anti-Inflammatory Effects of Metformin Irrespective of Diabetes Status. Circ. Res. 2016, 119, 652–665. [Google Scholar] [CrossRef] [PubMed]
- Du, K.; Ramachandran, A.; Weemhoff, J.L.; Chavan, H.; Xie, Y.; Krishnamurthy, P.; Jaeschke, H. Editor’s Highlight: Metformin Protects Against Acetaminophen Hepatotoxicity by Attenuation of Mitochondrial Oxidant Stress and Dysfunction. Toxicol. Sci. Off. J. Soc. Toxicol. 2016, 154, 214–226. [Google Scholar] [CrossRef] [PubMed]
- Kurutas, E.B. The importance of antioxidants which play the role in cellular response against oxidative/nitrosative stress: Current state. Nutr. J. 2016, 15, 71. [Google Scholar] [CrossRef]
- Balamash, K.S.; Alkreathy, H.M.; Al Gahdali, E.H.; Khoja, S.O.; Ahmad, A. Comparative Biochemical and Histopathological Studies on the Efficacy of Metformin and Virgin Olive Oil against Streptozotocin-Induced Diabetes in Sprague-Dawley Rats. J. Diabetes Res. 2018, 2018, 4692197. [Google Scholar] [CrossRef]
- Zhao, H.; Lai, Q.; Zhang, J.; Huang, C.; Jia, L. Antioxidant and Hypoglycemic Effects of Acidic-Extractable Polysaccharides from Cordyceps militaris on Type 2 Diabetes Mice. Oxidative Med. Cell. Longev. 2018, 2018, 9150807. [Google Scholar] [CrossRef]
- Stefanaki, C.; Bacopoulou, F.; Livadas, S.; Kandaraki, A.; Karachalios, A.; Chrousos, G.P.; Diamanti-Kandarakis, E. Impact of a mindfulness stress management program on stress, anxiety, depression and quality of life in women with polycystic ovary syndrome: A randomized controlled trial. Stress 2015, 18, 57–66. [Google Scholar] [CrossRef]
- Chatzigeorgiou, A.; Kandaraki, E.; Piperi, C.; Livadas, S.; Papavassiliou, A.G.; Koutsilieris, M.; Papalois, A.; Diamanti-Kandarakis, E. Dietary glycotoxins affect scavenger receptor expression and the hormonal profile of female rats. J. Endocrinol. 2013, 218, 331–337. [Google Scholar] [CrossRef]
- Milutinovic, D.V.; Macut, D.; Bozic, I.; Nestorov, J.; Damjanovic, S.; Matic, G. Hypothalamic-pituitary-adrenocortical axis hypersensitivity and glucocorticoid receptor expression and function in women with polycystic ovary syndrome. Exp. Clin. Endocrinol. Diabetes Off. J. Ger. Soc. Endocrinol. Ger. Diabetes Assoc. 2011, 119, 636–643. [Google Scholar] [CrossRef]
- Diamanti-Kandarakis, E.; Katsikis, I.; Piperi, C.; Kandaraki, E.; Piouka, A.; Papavassiliou, A.G.; Panidis, D. Increased serum advanced glycation end-products is a distinct finding in lean women with polycystic ovary syndrome (PCOS). Clin. Endocrinol. 2008, 69, 634–641. [Google Scholar] [CrossRef] [PubMed]
- Conway, G.; Dewailly, D.; Diamanti-Kandarakis, E.; Escobar-Morreale, H.F.; Franks, S.; Gambineri, A.; Kelestimur, F.; Macut, D.; Micic, D.; Pasquali, R.; et al. The polycystic ovary syndrome: A position statement from the European Society of Endocrinology. Eur. J. Endocrinol. 2014, 171, P1–P29. [Google Scholar] [CrossRef] [PubMed]
- Pasquali, R.; Gambineri, A.; Biscotti, D.; Vicennati, V.; Gagliardi, L.; Colitta, D.; Fiorini, S.; Cognigni, G.E.; Filicori, M.; Morselli-Labate, A.M. Effect of long-term treatment with metformin added to hypocaloric diet on body composition, fat distribution, and androgen and insulin levels in abdominally obese women with and without the polycystic ovary syndrome. J. Clin. Endocrinol. Metab. 2000, 85, 2767–2774. [Google Scholar] [CrossRef] [PubMed]
- Aghili, R.; Malek, M.; Valojerdi, A.E.; Banazadeh, Z.; Najafi, L.; Khamseh, M.E. Body composition in adults with newly diagnosed type 2 diabetes: Effects of metformin. J. Diabetes Metab. Disord. 2014, 13, 88. [Google Scholar] [CrossRef] [PubMed]
- Kujawska-Luczak, M.; Musialik, K.; Szulinska, M.; Swora-Cwynar, E.; Kargulewicz, A.; Grzymislawska, M.; Pupek-Musialik, D.; Bogdanski, P. The effect of orlistat versus metformin on body composition and insulin resistance in obese premenopausal women: 3-month randomized prospective open-label study. Arch. Med. Sci. 2017, 13, 725–731. [Google Scholar] [CrossRef] [PubMed]
- Aydin, K.; Cinar, N.; Aksoy, D.Y.; Bozdag, G.; Yildiz, B.O. Body composition in lean women with polycystic ovary syndrome: Effect of ethinyl estradiol and drospirenone combination. Contraception 2013, 87, 358–362. [Google Scholar] [CrossRef] [PubMed]
- Dolfing, J.G.; Stassen, C.M.; van Haard, P.M.; Wolffenbuttel, B.H.; Schweitzer, D.H. Comparison of MRI-assessed body fat content between lean women with polycystic ovary syndrome (PCOS) and matched controls: Less visceral fat with PCOS. Hum. Reprod. 2011, 26, 1495–1500. [Google Scholar] [CrossRef] [PubMed]
- Hestiantoro, A.; Kapnosa Hasani, R.D.; Shadrina, A.; Situmorang, H.; Ilma, N.; Muharam, R.; Sumapraja, K.; Wiweko, B. Body fat percentage is a better marker than body mass index for determining inflammation status in polycystic ovary syndrome. Int. J. Reprod. Biomed. 2018, 16, 623–628. [Google Scholar] [CrossRef]
- Kogure, G.S.; Silva, R.C.; Miranda-Furtado, C.L.; Ribeiro, V.B.; Pedroso, D.C.C.; Melo, A.S.; Ferriani, R.A.; Reis, R.M.D. Hyperandrogenism Enhances Muscle Strength After Progressive Resistance Training, Independent of Body Composition, in Women With Polycystic Ovary Syndrome. J. Strength Cond. Res. 2018, 32, 2642–2651. [Google Scholar] [CrossRef]
- Un, B.; Dolapcioglu, K.S.; Guler Okyay, A.; Sahin, H.; Beyazit, A. Evaluation of hs-CRP and visseral adiposity index in patients with policystic ovary syndrome by clinical and laboratory findings. Eur. J. Obstet. Gynecol. Reprod. Biol. 2016, 204, 16–20. [Google Scholar] [CrossRef]
- Tsigos, C.; Stefanaki, C.; Lambrou, G.I.; Boschiero, D.; Chrousos, G.P. Stress and inflammatory biomarkers and symptoms are associated with bioimpedance measures. Eur. J. Clin. Investig. 2015, 45, 126–134. [Google Scholar] [CrossRef] [PubMed]
- Peppa, M.; Stefanaki, C.; Papaefstathiou, A.; Boschiero, D.; Dimitriadis, G.; Chrousos, G.P. Bioimpedance analysis vs. DEXA as a screening tool for osteosarcopenia in lean, overweight and obese Caucasian postmenopausal females. Hormones 2017, 16, 181–193. [Google Scholar] [CrossRef] [PubMed]
- Holm, S. A simple sequential rejective method procedure. Scand. J. Stat. 1979, 6, 65–70. [Google Scholar]
- Gaetano, J. Dataset-Holm-Bonferroni Sequential Correction: An EXCEL Calculator—Ver. 1.2. Available online: https://www.researchgate.net/publication/242331583_Holm-Bonferroni_Sequential_Correction_An_EXCEL_Calculator_-_Ver._1.2 (accessed on 12 May 2015).
- Julious, S.A. Sample size of 12 per group rule of thumb for a pilot study. Pharmaceut. Stat. 2005, 4, 287–291. [Google Scholar] [CrossRef]
- Kim, K.H.; Jeong, Y.T.; Kim, S.H.; Jung, H.S.; Park, K.S.; Lee, H.Y.; Lee, M.S. Metformin-induced inhibition of the mitochondrial respiratory chain increases FGF21 expression via ATF4 activation. Biochem. Biophys. Res. Commun. 2013, 440, 76–81. [Google Scholar] [CrossRef] [PubMed]
- Douchi, T.; Yamamoto, S.; Oki, T.; Maruta, K.; Kuwahata, R.; Nagata, Y. Serum androgen levels and muscle mass in women with polycystic ovary syndrome. Obstet. Gynecol. 1999, 94, 337–340. [Google Scholar]
- Mario, F.M.; do Amarante, F.; Toscani, M.K.; Spritzer, P.M. Lean muscle mass in classic or ovulatory PCOS: Association with central obesity and insulin resistance. Exp. Clin. Endocrinol. Diabetes Off. J. Ger. Soc. Endocrinol. Ger. Diabetes Assoc. 2012, 120, 511–516. [Google Scholar] [CrossRef]
- Lundgren, J.A.; Kim, S.H.; Burt Solorzano, C.M.; McCartney, C.R.; Marshall, J.C. Progesterone Suppression of Luteinizing Hormone Pulse Frequency in Adolescent Girls With Hyperandrogenism: Effects of Metformin. J. Clin. Endocrinol. Metab. 2018, 103, 263–270. [Google Scholar] [CrossRef]
- Sorensen, M.B.; Rosenfalck, A.M.; Hojgaard, L.; Ottesen, B. Obesity and sarcopenia after menopause are reversed by sex hormone replacement therapy. Obes. Res. 2001, 9, 622–626. [Google Scholar] [CrossRef]
- Vgontzas, A.N.; Trakada, G.; Bixler, E.O.; Lin, H.M.; Pejovic, S.; Zoumakis, E.; Chrousos, G.P.; Legro, R.S. Plasma interleukin 6 levels are elevated in polycystic ovary syndrome independently of obesity or sleep apnea. Metab. Clin. Exp. 2006, 55, 1076–1082. [Google Scholar] [CrossRef]
- Ciaraldi, T.P.; Aroda, V.; Mudaliar, S.R.; Henry, R.R. Inflammatory cytokines and chemokines, skeletal muscle and polycystic ovary syndrome: Effects of pioglitazone and metformin treatment. Metab. Clin. Exp. 2013, 62, 1587–1596. [Google Scholar] [CrossRef] [PubMed]
- Degens, H.; Korhonen, M.T. Factors contributing to the variability in muscle ageing. Maturitas 2012, 73, 197–201. [Google Scholar] [CrossRef] [PubMed]
- Bienso, R.S.; Olesen, J.; van Hauen, L.; Meinertz, S.; Halling, J.F.; Gliemann, L.; Plomgaard, P.; Pilegaard, H. Exercise-induced AMPK and pyruvate dehydrogenase regulation is maintained during short-term low-grade inflammation. Pflug. Arch. Eur. J. Physiol. 2015, 467, 341–350. [Google Scholar] [CrossRef] [PubMed]
- Ibfelt, T.; Fischer, C.P.; Plomgaard, P.; van Hall, G.; Pedersen, B.K. The acute effects of low-dose TNF-alpha on glucose metabolism and beta-cell function in humans. Mediat. Inflamm. 2014, 2014, 295478. [Google Scholar] [CrossRef] [PubMed]
- Stefanaki, C.; Peppa, M.; Boschiero, D.; Chrousos, G.P. Healthy overweight/obese youth: Early osteosarcopenic obesity features. Eur. J. Clin. Investig. 2016, 46, 767–778. [Google Scholar] [CrossRef] [PubMed]
- Romanello, V.; Sandri, M. Mitochondrial Quality Control and Muscle Mass Maintenance. Front. Physiol. 2015, 6, 422. [Google Scholar] [CrossRef] [PubMed]
- Carreau, A.M.; Pyle, L.; Garcia-Reyes, Y.; Rahat, H.; Vigers, T.; Jensen, T.; Scherzinger, A.; Nadeau, K.J.; Cree-Green, M. Clinical prediction score of non-alcoholic fatty liver disease in adolescent girls with polycystic ovary syndrome (PCOS-HS index). Clin. Endocrinol. 2019. [Google Scholar] [CrossRef]
- Lonardo, A.; Mantovani, A.; Lugari, S.; Targher, G. NAFLD in Some Common Endocrine Diseases: Prevalence, Pathophysiology, and Principles of Diagnosis and Management. Int. J. Mol. Sci. 2019, 20, 2841. [Google Scholar] [CrossRef]
- El-Mir, M.Y.; Nogueira, V.; Fontaine, E.; Averet, N.; Rigoulet, M.; Leverve, X. Dimethylbiguanide inhibits cell respiration via an indirect effect targeted on the respiratory chain complex I. J. Biol. Chem. 2000, 275, 223–228. [Google Scholar] [CrossRef]
- Miller, R.A.; Chu, Q.; Xie, J.; Foretz, M.; Viollet, B.; Birnbaum, M.J. Biguanides suppress hepatic glucagon signalling by decreasing production of cyclic AMP. Nature 2013, 494, 256–260. [Google Scholar] [CrossRef]
- Le Donne, M.; Alibrandi, A.; Giarrusso, R.; Lo Monaco, I.; Muraca, U. Diet, metformin and inositol in overweight and obese women with polycystic ovary syndrome: Effects on body composition. Minerva Ginecol. 2012, 64, 23–29. [Google Scholar] [PubMed]
- Nygaard, E.B.; Vienberg, S.G.; Orskov, C.; Hansen, H.S.; Andersen, B. Metformin stimulates FGF21 expression in primary hepatocytes. Exp. Diabetes Res. 2012, 2012, 465282. [Google Scholar] [CrossRef] [PubMed]
- Kim, K.H.; Lee, M.S. FGF21 as a mediator of adaptive responses to stress and metabolic benefits of anti-diabetic drugs. J. Endocrinol. 2015, 226, R1–R16. [Google Scholar] [CrossRef] [PubMed]
- Wessels, B.; Ciapaite, J.; van den Broek, N.M.; Nicolay, K.; Prompers, J.J. Metformin impairs mitochondrial function in skeletal muscle of both lean and diabetic rats in a dose-dependent manner. PLoS ONE 2014, 9, e100525. [Google Scholar] [CrossRef] [PubMed]
- Cetrone, M.; Mele, A.; Tricarico, D. Effects of the antidiabetic drugs on the age-related atrophy and sarcopenia associated with diabetes type II. Curr. Diabetes Rev. 2014, 10, 231–237. [Google Scholar] [CrossRef]
- Stener-Victorin, E.; Jedel, E.; Janson, P.O.; Sverrisdottir, Y.B. Low-frequency electroacupuncture and physical exercise decrease high muscle sympathetic nerve activity in polycystic ovary syndrome. Am. J. Physiol. Regul. Integr. Comp. Physiol. 2009, 297, R387–R395. [Google Scholar] [CrossRef]
- Sandri, M. Signaling in muscle atrophy and hypertrophy. Physiology 2008, 23, 160–170. [Google Scholar] [CrossRef]
- Banting, L.K.; Gibson-Helm, M.; Polman, R.; Teede, H.J.; Stepto, N.K. Physical activity and mental health in women with polycystic ovary syndrome. BMC Women Health 2014, 14, 51. [Google Scholar] [CrossRef]
- Vgontzas, A.N.; Legro, R.S.; Bixler, E.O.; Grayev, A.; Kales, A.; Chrousos, G.P. Polycystic ovary syndrome is associated with obstructive sleep apnea and daytime sleepiness: Role of insulin resistance. J. Clin. Endocrinol. Metab. 2001, 86, 517–520. [Google Scholar] [CrossRef]
- Durmus, U.; Duran, C.; Ecirli, S. Visceral adiposity index levels in overweight and/or obese, and non-obese patients with polycystic ovary syndrome and its relationship with metabolic and inflammatory parameters. J. Endocrinol. Investig. 2017, 40, 487–497. [Google Scholar] [CrossRef]
- Ahmadi, A.; Akbarzadeh, M.; Mohammadi, F.; Akbari, M.; Jafari, B.; Tolide-Ie, H.R. Anthropometric characteristics and dietary pattern of women with polycystic ovary syndrome. Indian J. Endocrinol. Metab. 2013, 17, 672–676. [Google Scholar] [CrossRef] [PubMed]
- Glintborg, D.; Altinok, M.L.; Mumm, H.; Hermann, A.P.; Ravn, P.; Andersen, M. Body composition is improved during 12 months’ treatment with metformin alone or combined with oral contraceptives compared with treatment with oral contraceptives in polycystic ovary syndrome. J. Clin. Endocrinol. Metab. 2014, 99, 2584–2591. [Google Scholar] [CrossRef] [PubMed]
- Naka, K.K.; Kalantaridou, S.N.; Kravariti, M.; Bechlioulis, A.; Kazakos, N.; Calis, K.A.; Makrigiannakis, A.; Katsouras, C.S.; Chrousos, G.P.; Tsatsoulis, A.; et al. Effect of the insulin sensitizers metformin and pioglitazone on endothelial function in young women with polycystic ovary syndrome: A prospective randomized study. Fertil. Steril. 2011, 95, 203–209. [Google Scholar] [CrossRef] [PubMed]
- Lingaiah, S.; Morin-Papunen, L.; Piltonen, T.; Puurunen, J.; Sundstrom-Poromaa, I.; Stener-Victorin, E.; Bloigu, R.; Risteli, J.; Tapanainen, J.S. Bone markers in polycystic ovary syndrome: A multicentre study. Clin. Endocrinol. 2017, 87, 673–679. [Google Scholar] [CrossRef] [PubMed]
- Chandran, M. Diabetes Drug Effects on the Skeleton. Calcif. Tissue Int. 2017, 100, 133–149. [Google Scholar] [CrossRef] [PubMed]
- Adil, M.; Khan, R.A.; Kalam, A.; Venkata, S.K.; Kandhare, A.D.; Ghosh, P.; Sharma, M. Effect of anti-diabetic drugs on bone metabolism: Evidence from preclinical and clinical studies. Pharmacol. Rep. 2017, 69, 1328–1340. [Google Scholar] [CrossRef] [PubMed]
- Diamanti-Kandarakis, E.; Livadas, S.; Katsikis, I.; Piperi, C.; Mantziou, A.; Papavassiliou, A.G.; Panidis, D. Serum concentrations of carboxylated osteocalcin are increased and associated with several components of the polycystic ovarian syndrome. J. Bone Miner. Metab. 2011, 29, 201–206. [Google Scholar] [CrossRef]
- To, W.W.; Wong, M.W. A comparison of bone mineral density in normal weight and obese adolescents with polycystic ovary syndrome. J. Pediatr. Adolesc. Gynecol. 2012, 25, 248–253. [Google Scholar] [CrossRef]
- Lingaiah, S.; Morin-Papunen, L.; Risteli, J.; Tapanainen, J.S. Metformin decreases bone turnover markers in polycystic ovary syndrome: A post hoc study. Fertil. Steril. 2019. [Google Scholar] [CrossRef]
- Hefler-Frischmuth, K.; Walch, K.; Huebl, W.; Baumuehlner, K.; Tempfer, C.; Hefler, L. Serologic markers of autoimmunity in women with polycystic ovary syndrome. Fertil. Steril. 2010, 93, 2291–2294. [Google Scholar] [CrossRef]
- Nisar, S.; Shah, P.A.; Kuchay, M.S.; Bhat, M.A.; Rashid, A.; Ahmed, S.; Ganie, M.A. Association of polycystic ovary syndrome and Graves’ disease: Is autoimmunity the link between the two diseases. Indian J. Endocrinol. Metab. 2012, 16, 982–986. [Google Scholar] [CrossRef] [PubMed]
- Singh, R.P.; Massachi, I.; Manickavel, S.; Singh, S.; Rao, N.P.; Hasan, S.; Mc Curdy, D.K.; Sharma, S.; Wong, D.; Hahn, B.H.; et al. The role of miRNA in inflammation and autoimmunity. Autoimmun. Rev. 2013, 12, 1160–1165. [Google Scholar] [CrossRef] [PubMed]
- Xu, X.; Du, C.; Zheng, Q.; Peng, L.; Sun, Y. Effect of metformin on serum interleukin-6 levels in polycystic ovary syndrome: A systematic review. BMC Women Health 2014, 14, 93. [Google Scholar] [CrossRef] [PubMed]
- Ojeda-Ojeda, M.; Murri, M.; Insenser, M.; Escobar-Morreale, H.F. Mediators of low-grade chronic inflammation in polycystic ovary syndrome (PCOS). Curr. Pharm. Des. 2013, 19, 5775–5791. [Google Scholar] [CrossRef] [PubMed]
- Payne, G.W. Effect of inflammation on the aging microcirculation: Impact on skeletal muscle blood flow control. Microcirculation 2006, 13, 343–352. [Google Scholar] [CrossRef]
- Stachenfeld, N.S.; Taylor, H.S. Effects of estrogen and progesterone administration on extracellular fluid. J. Appl. Physiol. 2004, 96, 1011–1018. [Google Scholar] [CrossRef]
- Machado, R.B.; Tachotti, F.; Cavenague, G.; Maia, E. Effects of two different oral contraceptives on total body water: A randomized study. Contraception 2006, 73, 344–347. [Google Scholar] [CrossRef] [PubMed]
- Franchini, M.; Caruso, C.; Nigrelli, S.; Poggiali, C. Evaluation of body composition during low-dose estrogen oral contraceptives treatment. Acta Eur. Fertil. 1995, 26, 69–73. [Google Scholar]
- Piccoli, A.; Crosignani, P.; Nappi, C.; Ronsini, S.; Bruni, V.; Marelli, S.; Italian, E.C.S.G. Effect of the ethinylestradiol/norelgestromin contraceptive patch on body composition. Results of bioelectrical impedance analysis in a population of Italian women. Nutr. J. 2008, 7, 21. [Google Scholar] [CrossRef]
- Beberashvili, I.; Azar, A.; Sinuani, I.; Kadoshi, H.; Shapiro, G.; Feldman, L.; Sandbank, J.; Averbukh, Z. Longitudinal changes in bioimpedance phase angle reflect inverse changes in serum IL-6 levels in maintenance hemodialysis patients. Nutrition 2014, 30, 297–304. [Google Scholar] [CrossRef]
- Dworschak, M.; Campbell, M.J. About the benefits and limitations of pilot studies. Minerva Anestesiol. 2015, 81, 711–712. [Google Scholar] [PubMed]
- Pin, F.; Bonetto, A.; Bonewald, L.F.; Klein, G.L. Molecular Mechanisms Responsible for the Rescue Effects of Pamidronate on Muscle Atrophy in Pediatric Burn Patients. Front. Endocrinol. 2019, 10. [Google Scholar] [CrossRef] [PubMed]
- Han, Y.; Li, Y.; He, B. GLP-1 receptor agonists versus metformin in PCOS: A systematic review and meta-analysis. Reprod. Biomed. Online 2019. [Google Scholar] [CrossRef] [PubMed]


| Characteristics | Patients (n = 17) | Controls (n = 17) | Statistical Tests, p Value | Holm’s-Adjusted Alpha Levels | Rank | Outcome of Holm’s Adjusted Alpha Levels |
|---|---|---|---|---|---|---|
| (25th–75th Percentiles) | (25th–75th Percentiles) | |||||
| Age (years) | 27 (22–29) | 26 (22–28) | M-W U test = 134, p = 0.73 | 0.199 | 12 | Non-significant |
| Clinical and Biochemical Hyperandrogenism | 15 (88.23%) | - | - | |||
| Polycystic ovaries on Ultrasound | 12 (70.58%) | - | - | |||
| Menstrual Problems | 14 (82.35%) | - | - | |||
| Metformin + OCPs | 17 (100%) | - | - | |||
| BMI | 22 (19.7–24.5) | 22 (20.43–24.51) | M–W U test = 136, p = 0.76 | 0.199 | 13 | Non-significant |
| TBW (L) | 27.8 (27.3–29.3) | 31.2(28.2–34.9) | M–W U test = 80.5, p = 0.026 | 0.110 | 4 | Significant |
| ECW (%TBW) | 47 (46–49) | 42.5 (40.16–43.22) | M–W U test = 10, p < 0.001 | 0.082 | 1 | Significant |
| ICW (%TBW) | 53 (51–54) | 57.5 (56.78–59.84) | M–W U test = 10, p < 0.001 | 0.082 | 1 | Significant |
| ICW (L) | 14.9 (13.9–15.8) | 18 (15.8–21.1) | M–W U test = 57, p = 0.0025 | 0.099 | 3 | Significant |
| FFM (Kg) | 44.5 (43.1–46.8) | 47.3 (44.3–52.6) | M–W U test = 87, p = 0.05 | 0.165 | 8 | Significant |
| FM (%Weight) | 27 (19–31) | 26.27 (21.83–27.47) | M–W U test = 133, p = 0.69 | 0.199 | 9 | Non-significant |
| FM (Kg) | 13 (9.7–20.9) | 17.9 (12.5–19.2) | M–W U test = 133, p = 0.70 | 0.199 | 10 | Non-significant |
| Phase Angle (degrees °) | 3.4 (2.6–4.2) | 6.9 (5.8–8.4) | M–W U test = 24, p < 0.001 | 0.082 | 1 | Significant |
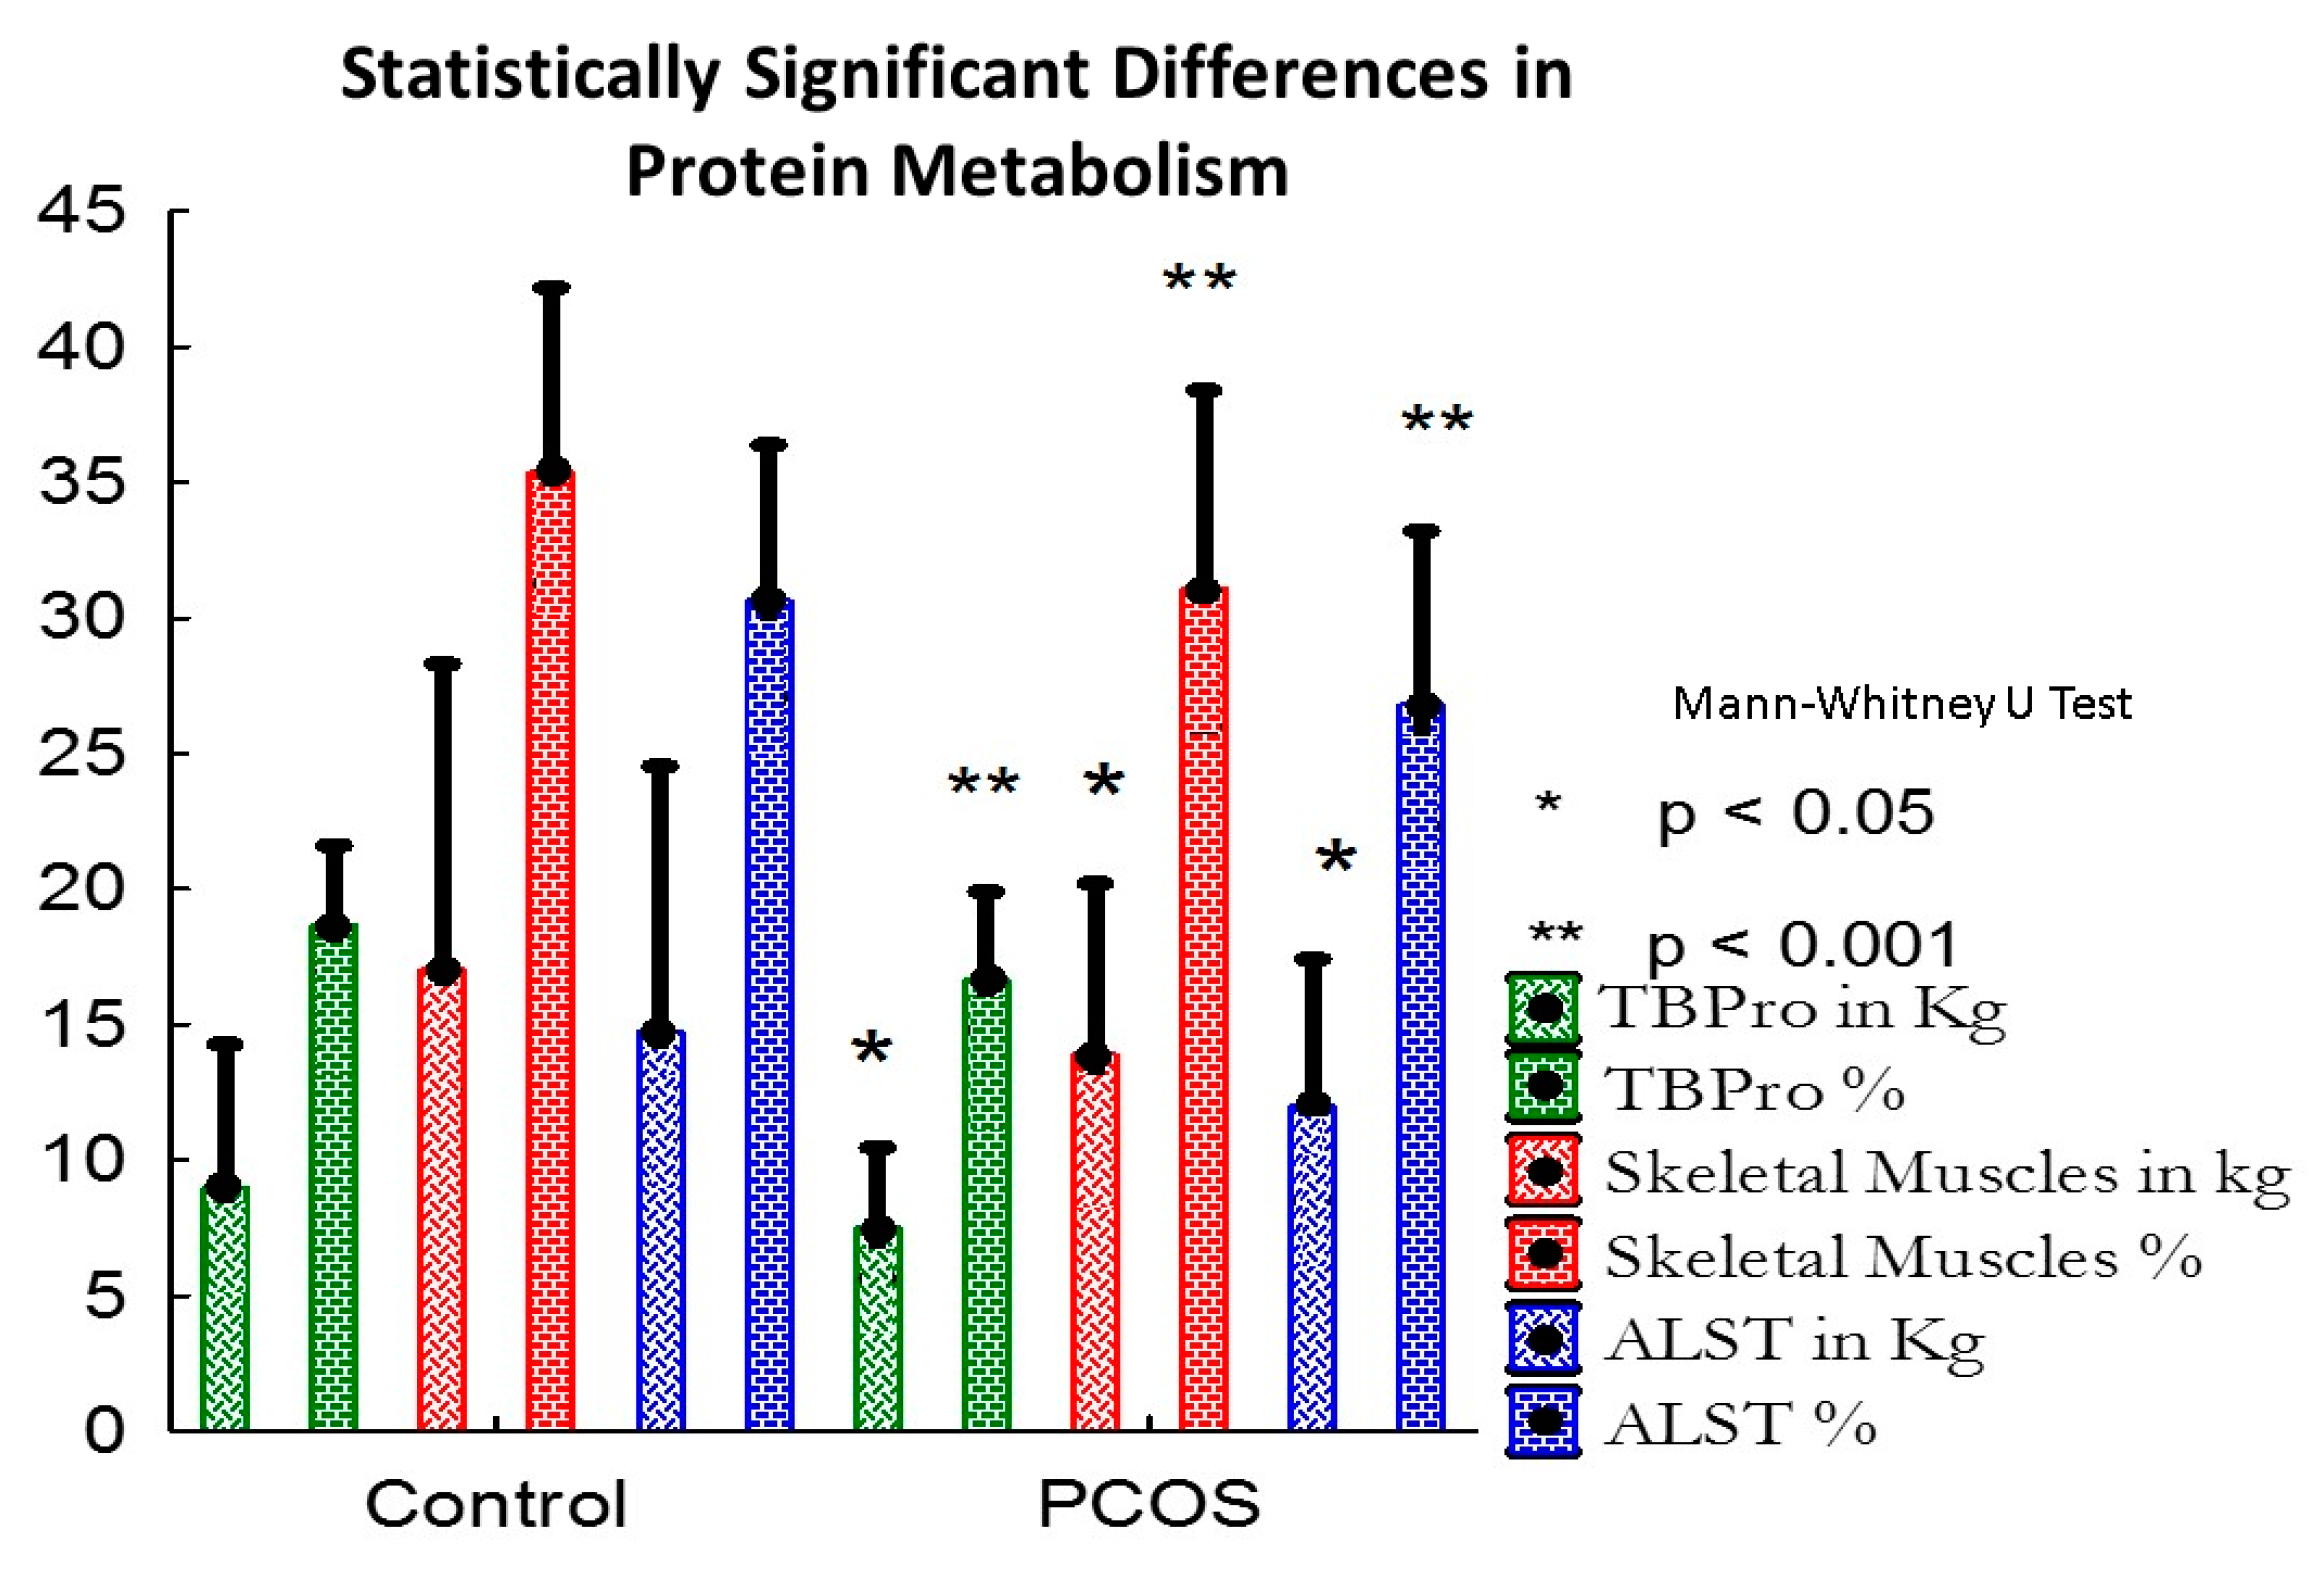
| TBPro (Kg) | 7.51 (7.05–7.95) | 8.991 (7.94–10.47) | M–W U test = 59, p = 0.003 | 0.124 | 5 | Significant |
| TBPro (%FFM) | 16.67 (16.4–17.47) | 18.692 (17.8–19.91) | M–W U test = 19, p < 0.001 | 0.082 | 1 | Significant |
| Gly (Kg) | 0.331 (0.31–0.35) | 0.4 (0.35–0.46) | M–W U test = 60, p = 0.004 | 0.142 | 6 | Significant |
| Gly (%FFM) | 0.73 (0.72–0.77) | 0.82 (0.78–0.88) | M–W U test = 20, p < 0.001 | 0.082 | 1 | Significant |
| Bm (Kg) | 1.64 (1.61–1.74) | 1.91 (1.69–2.09) | M–W U test = 78, p = 0.021 | 0.090 | 2 | Significant |
| Skeletal Muscles (Kg) | 13.9 (12.9–14.8) | 17.04 (14.79–20.2) | M–W U test = 60, p = 0.004 | 0.142 | 6 | Significant |
| Skeletal Muscles (%FFM) | 31.1 (29.3–32.4) | 35.37 (33.16–38.4) | M–W U test = 28, p < 0.001 | 0.082 | 1 | Significant |
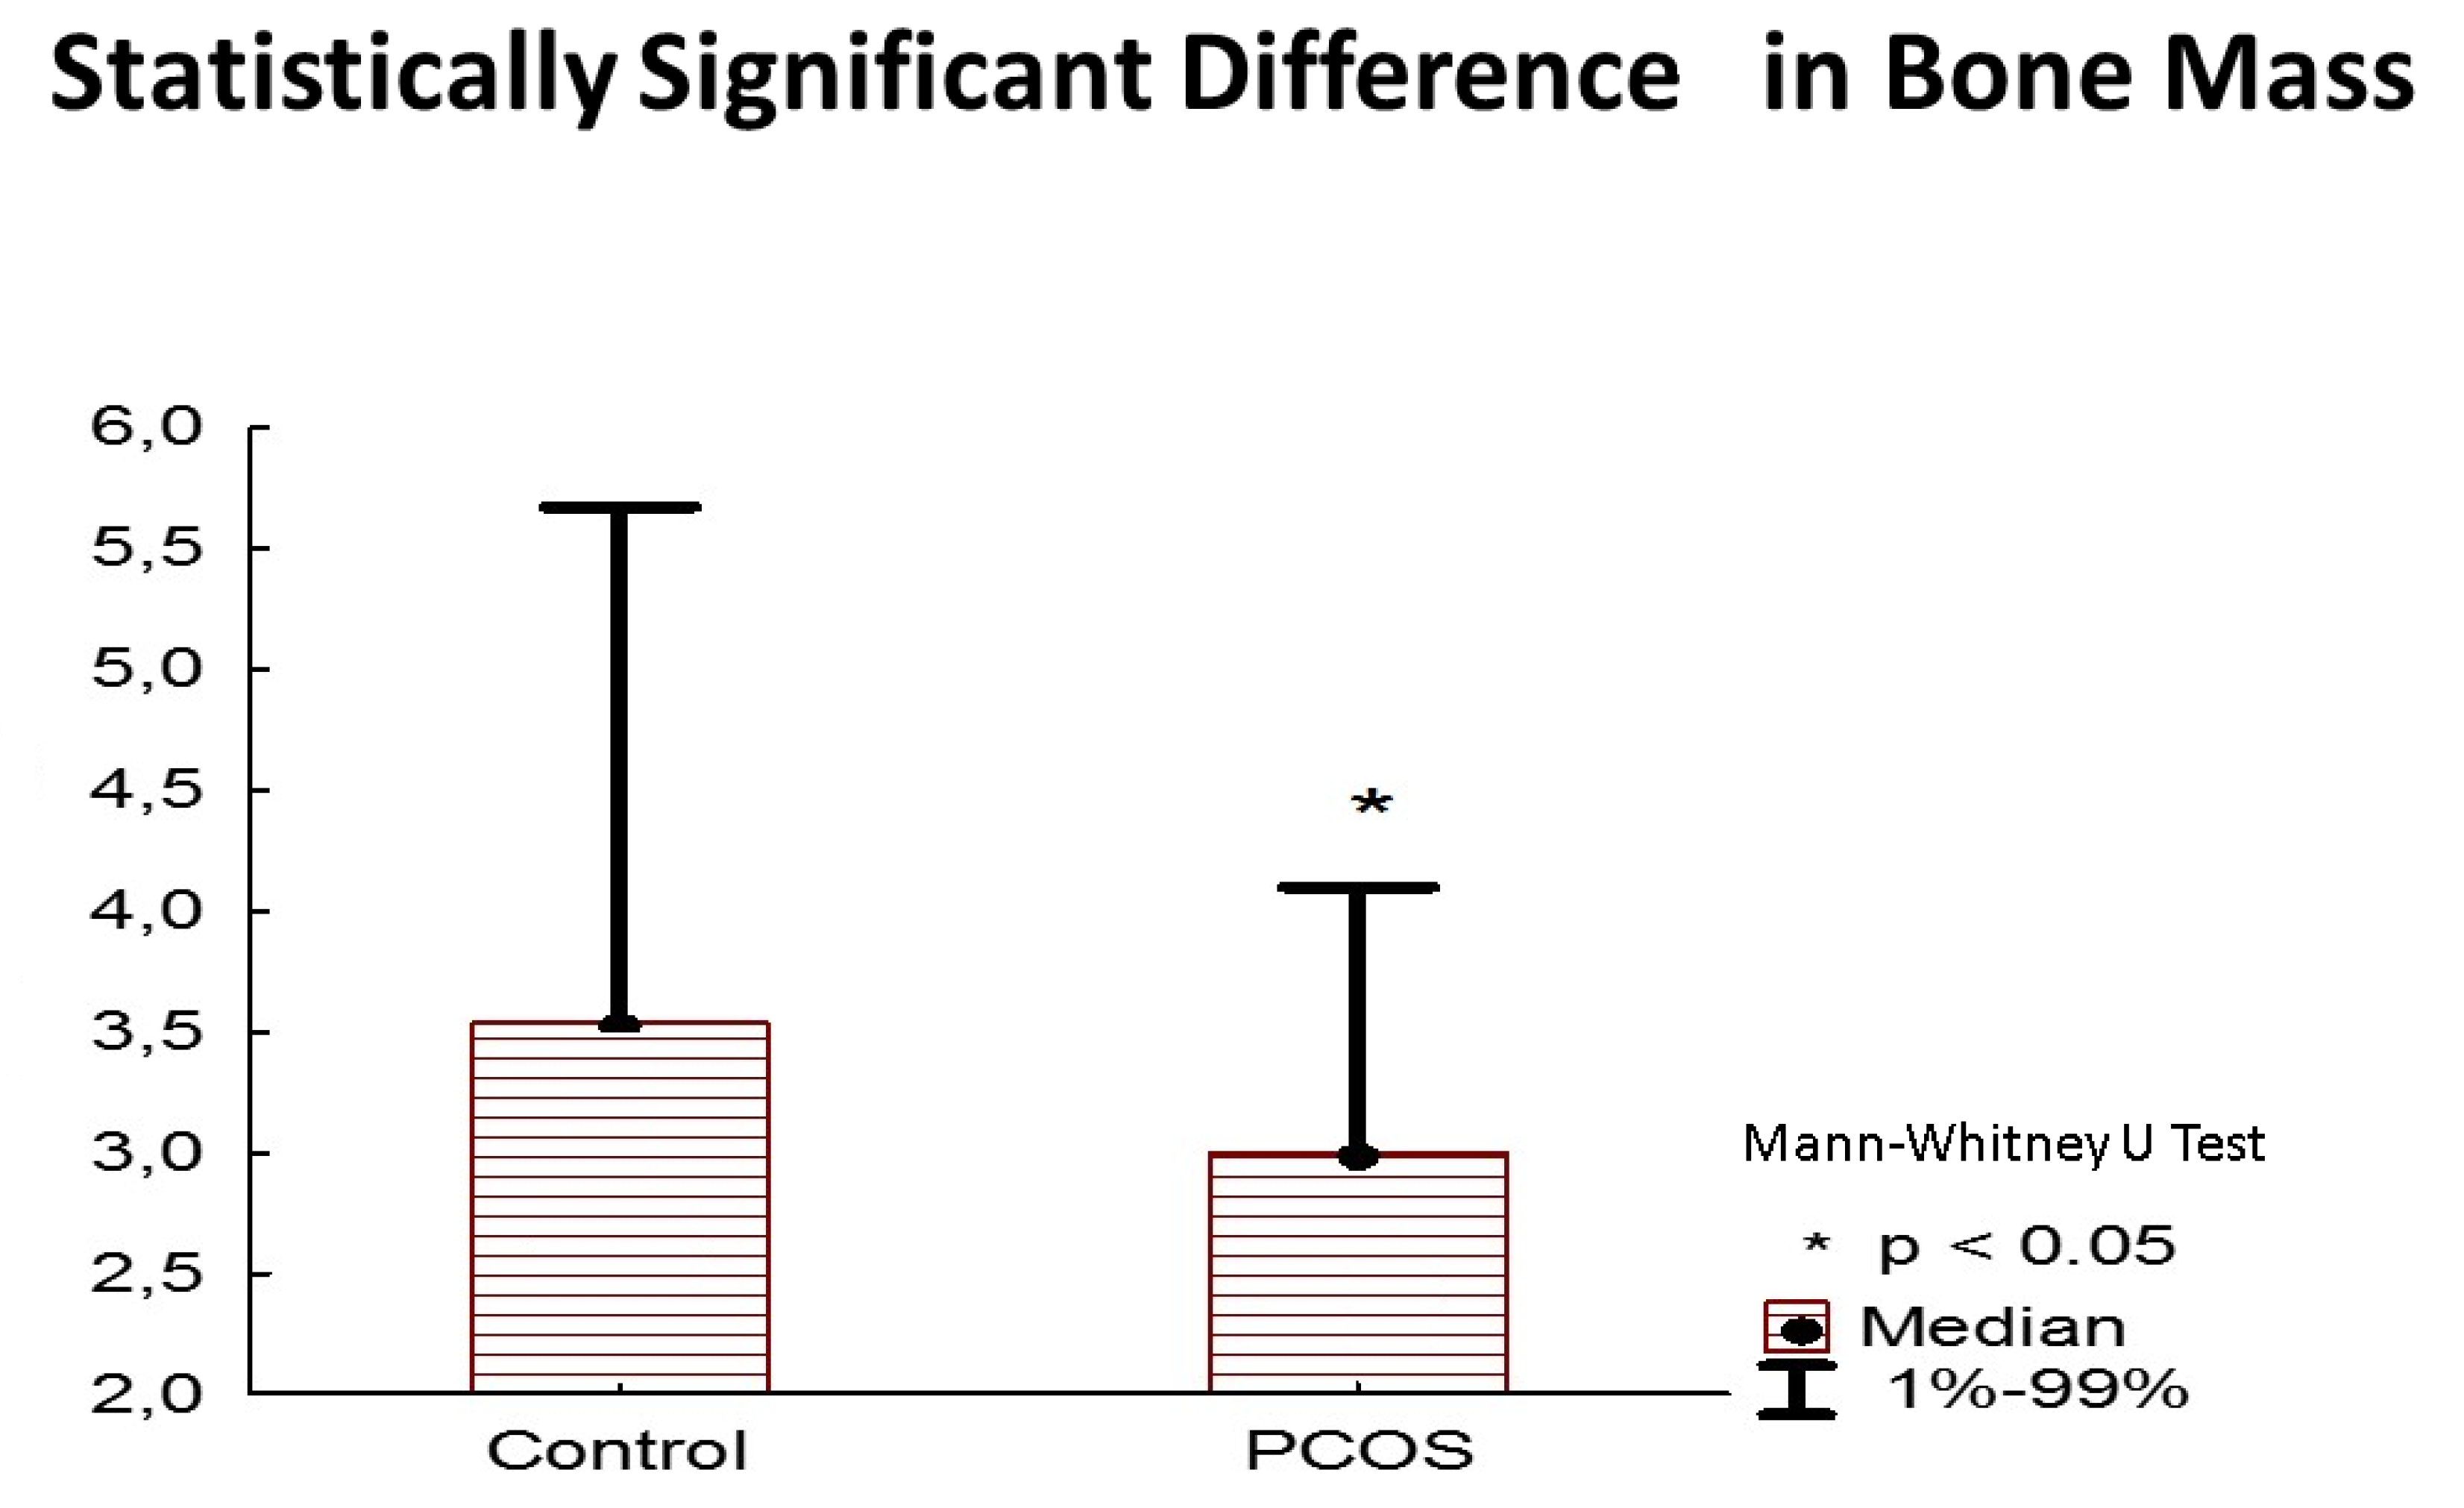
| Bones (Kg) | 3 (3–3.2) | 3.53 (3.13–3.88) | M–W U test = 74, p = 0.014 | 0.165 | 7 | Significant |
| ALST (Kg) | 12 (11.1–12.7) | 14.74 (12.72–17.44) | M–W U test = 58, p = 0.003 | 0.110 | 5 | Significant |
| ALST (%FFM) | 26.8 (25.1–28.1) | 30.64 (28.52–33.16) | M–W U test = 27, p < 0.001 | 0.082 | 1 | Significant |
| AAT (cm2) | 191.2 (135.6–324.5) | 273.88 (182.82–295.8) | M–W U test = 134, p = 0.71 | 0.199 | 11 | Non-significant |
| AT (Kg) | 16.3 (12.1–26.1) | 22.38 (15.63–24) | M–W U test = 133, p = 0.70 | 0.199 | 10 | Non-significant |
| AT (%Weight) | 33.2 (23.9–39) | 32.84 (27.29–34.34) | M–W U test = 134, p = 0.71 | 0.199 | 11 | Non-significant |
| Sarcopenia | 13/17 (76.47%) | 1/17 (5.88%) | x2 = 3414.167, df = 33, p < 0.001, RR = 4.643, 95% CI: 1.985–6.526 | Significant | ||
© 2019 by the authors. Licensee MDPI, Basel, Switzerland. This article is an open access article distributed under the terms and conditions of the Creative Commons Attribution (CC BY) license (http://creativecommons.org/licenses/by/4.0/).
Share and Cite
Stefanaki, C.; Bacopoulou, F.; Kandaraki, E.; Boschiero, D.; Diamandi-Kandarakis, E. Lean Women on Metformin and Oral Contraceptives for Polycystic Ovary Syndrome Demonstrate a Dehydrated Osteosarcopenic Phenotype: A Pilot Study. Nutrients 2019, 11, 2055. https://doi.org/10.3390/nu11092055
Stefanaki C, Bacopoulou F, Kandaraki E, Boschiero D, Diamandi-Kandarakis E. Lean Women on Metformin and Oral Contraceptives for Polycystic Ovary Syndrome Demonstrate a Dehydrated Osteosarcopenic Phenotype: A Pilot Study. Nutrients. 2019; 11(9):2055. https://doi.org/10.3390/nu11092055
Chicago/Turabian StyleStefanaki, Charikleia, Flora Bacopoulou, Eleni Kandaraki, Dario Boschiero, and Evanthia Diamandi-Kandarakis. 2019. "Lean Women on Metformin and Oral Contraceptives for Polycystic Ovary Syndrome Demonstrate a Dehydrated Osteosarcopenic Phenotype: A Pilot Study" Nutrients 11, no. 9: 2055. https://doi.org/10.3390/nu11092055
APA StyleStefanaki, C., Bacopoulou, F., Kandaraki, E., Boschiero, D., & Diamandi-Kandarakis, E. (2019). Lean Women on Metformin and Oral Contraceptives for Polycystic Ovary Syndrome Demonstrate a Dehydrated Osteosarcopenic Phenotype: A Pilot Study. Nutrients, 11(9), 2055. https://doi.org/10.3390/nu11092055