Multiple Dimensions of Sweet Taste Perception Altered after Sleep Curtailment


Abstract
1. Introduction
2. Materials and Methods
2.1. Participants
2.2. Study Timeline
2.3. Consent Visit
2.4. Laboratory Visits
2.5. Development of Iso-Sweet Stimuli
2.6. Sensory Evaluation
2.7. Preference Testing
2.8. Evaluation of Sweetness Liking
2.9. Statistical Analysis
3. Results
3.1. Participants
3.2. Summary of Curtailment
3.3. Summary of Affect, Cravings, and Hunger
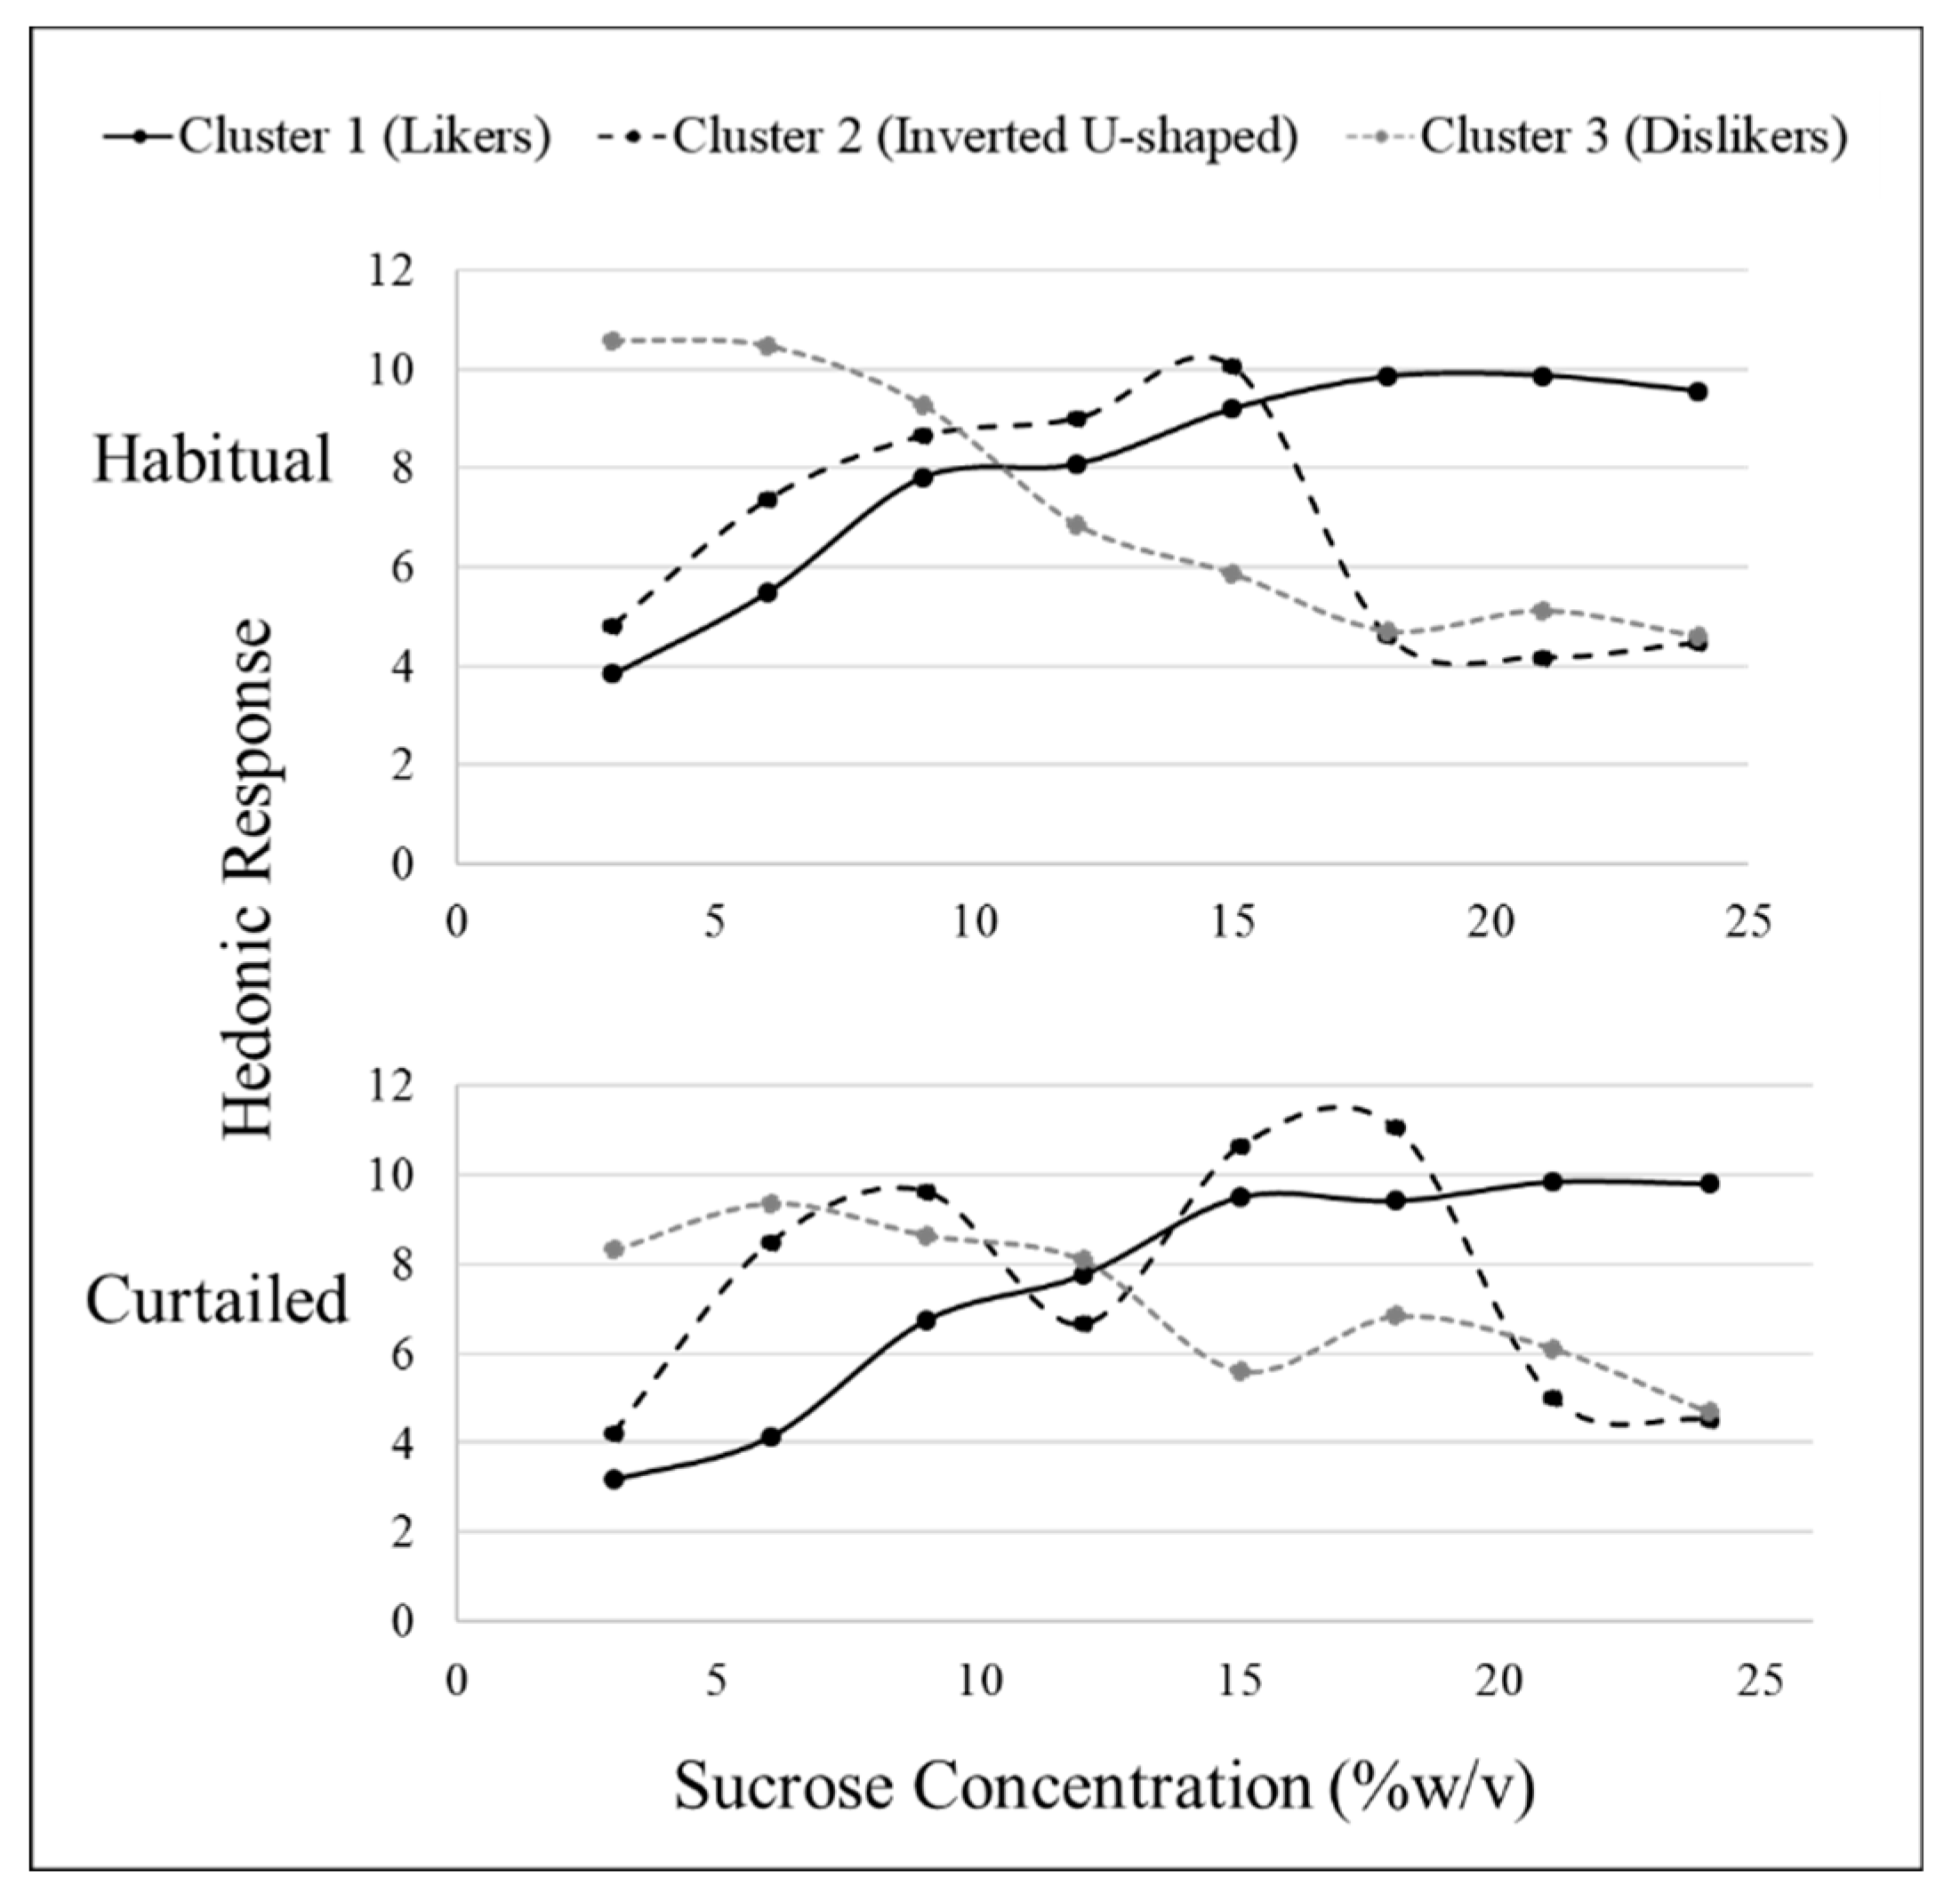
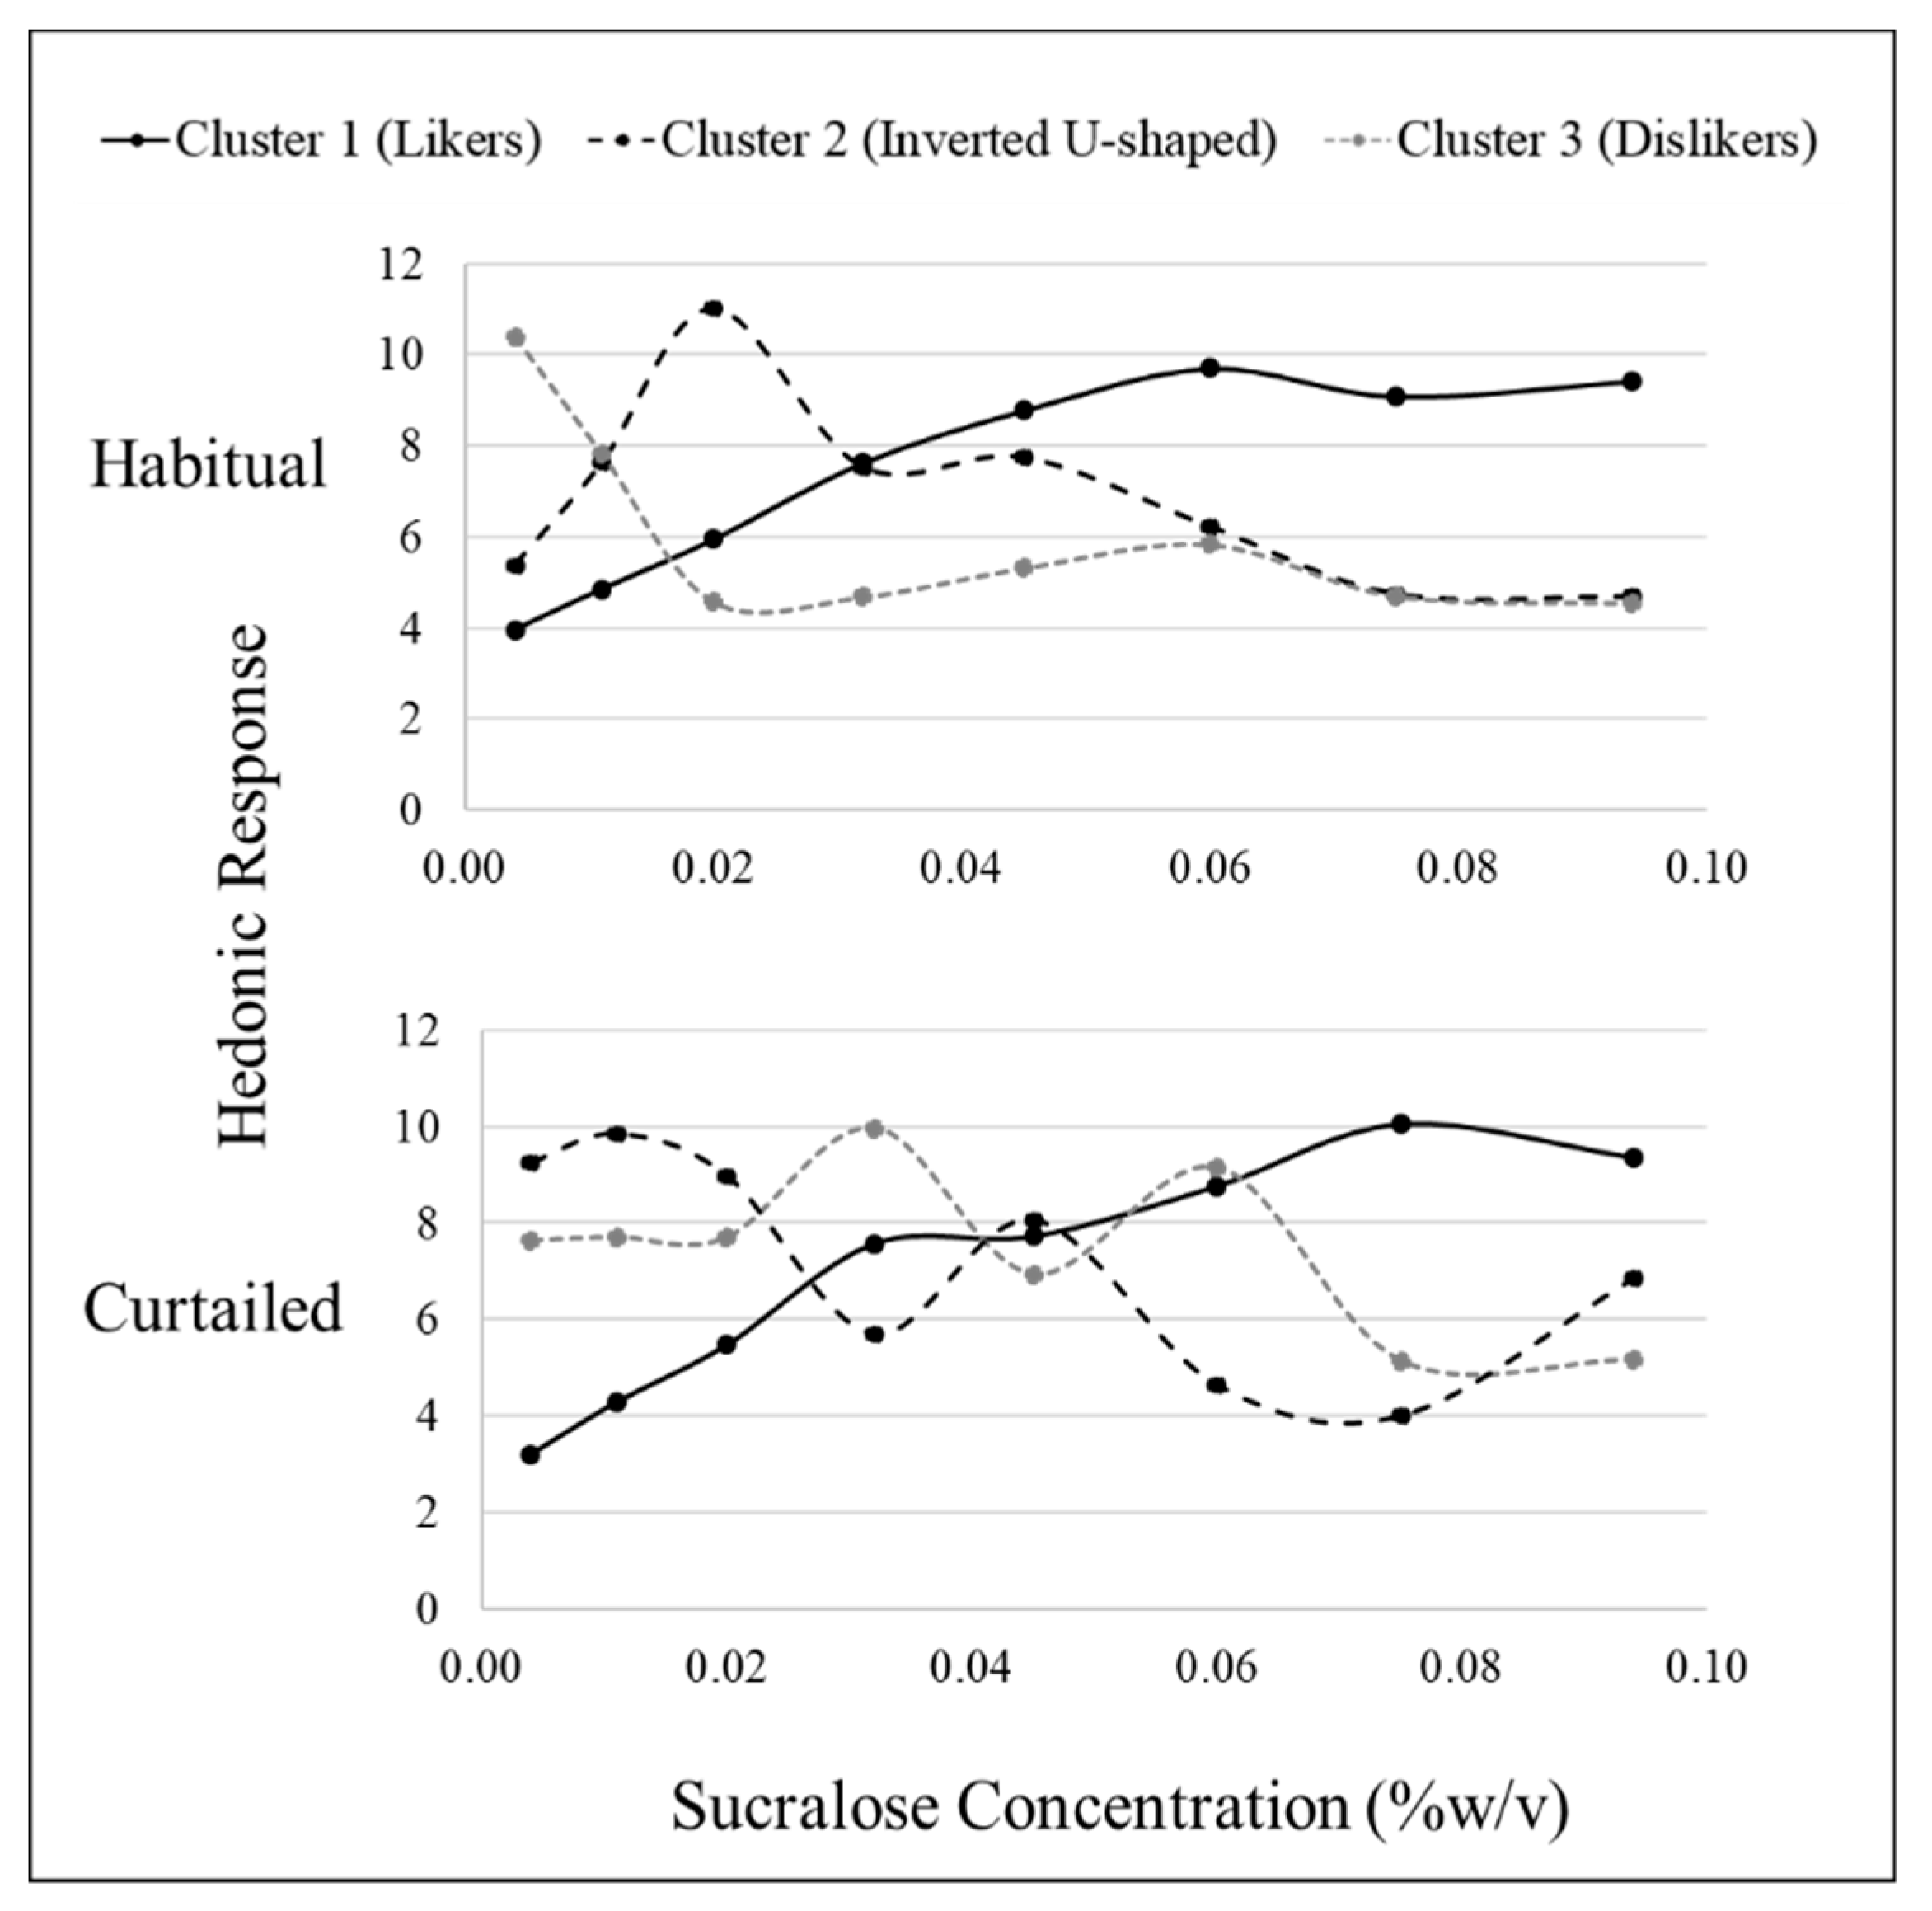
3.4. Sweet Liking Phenotypes
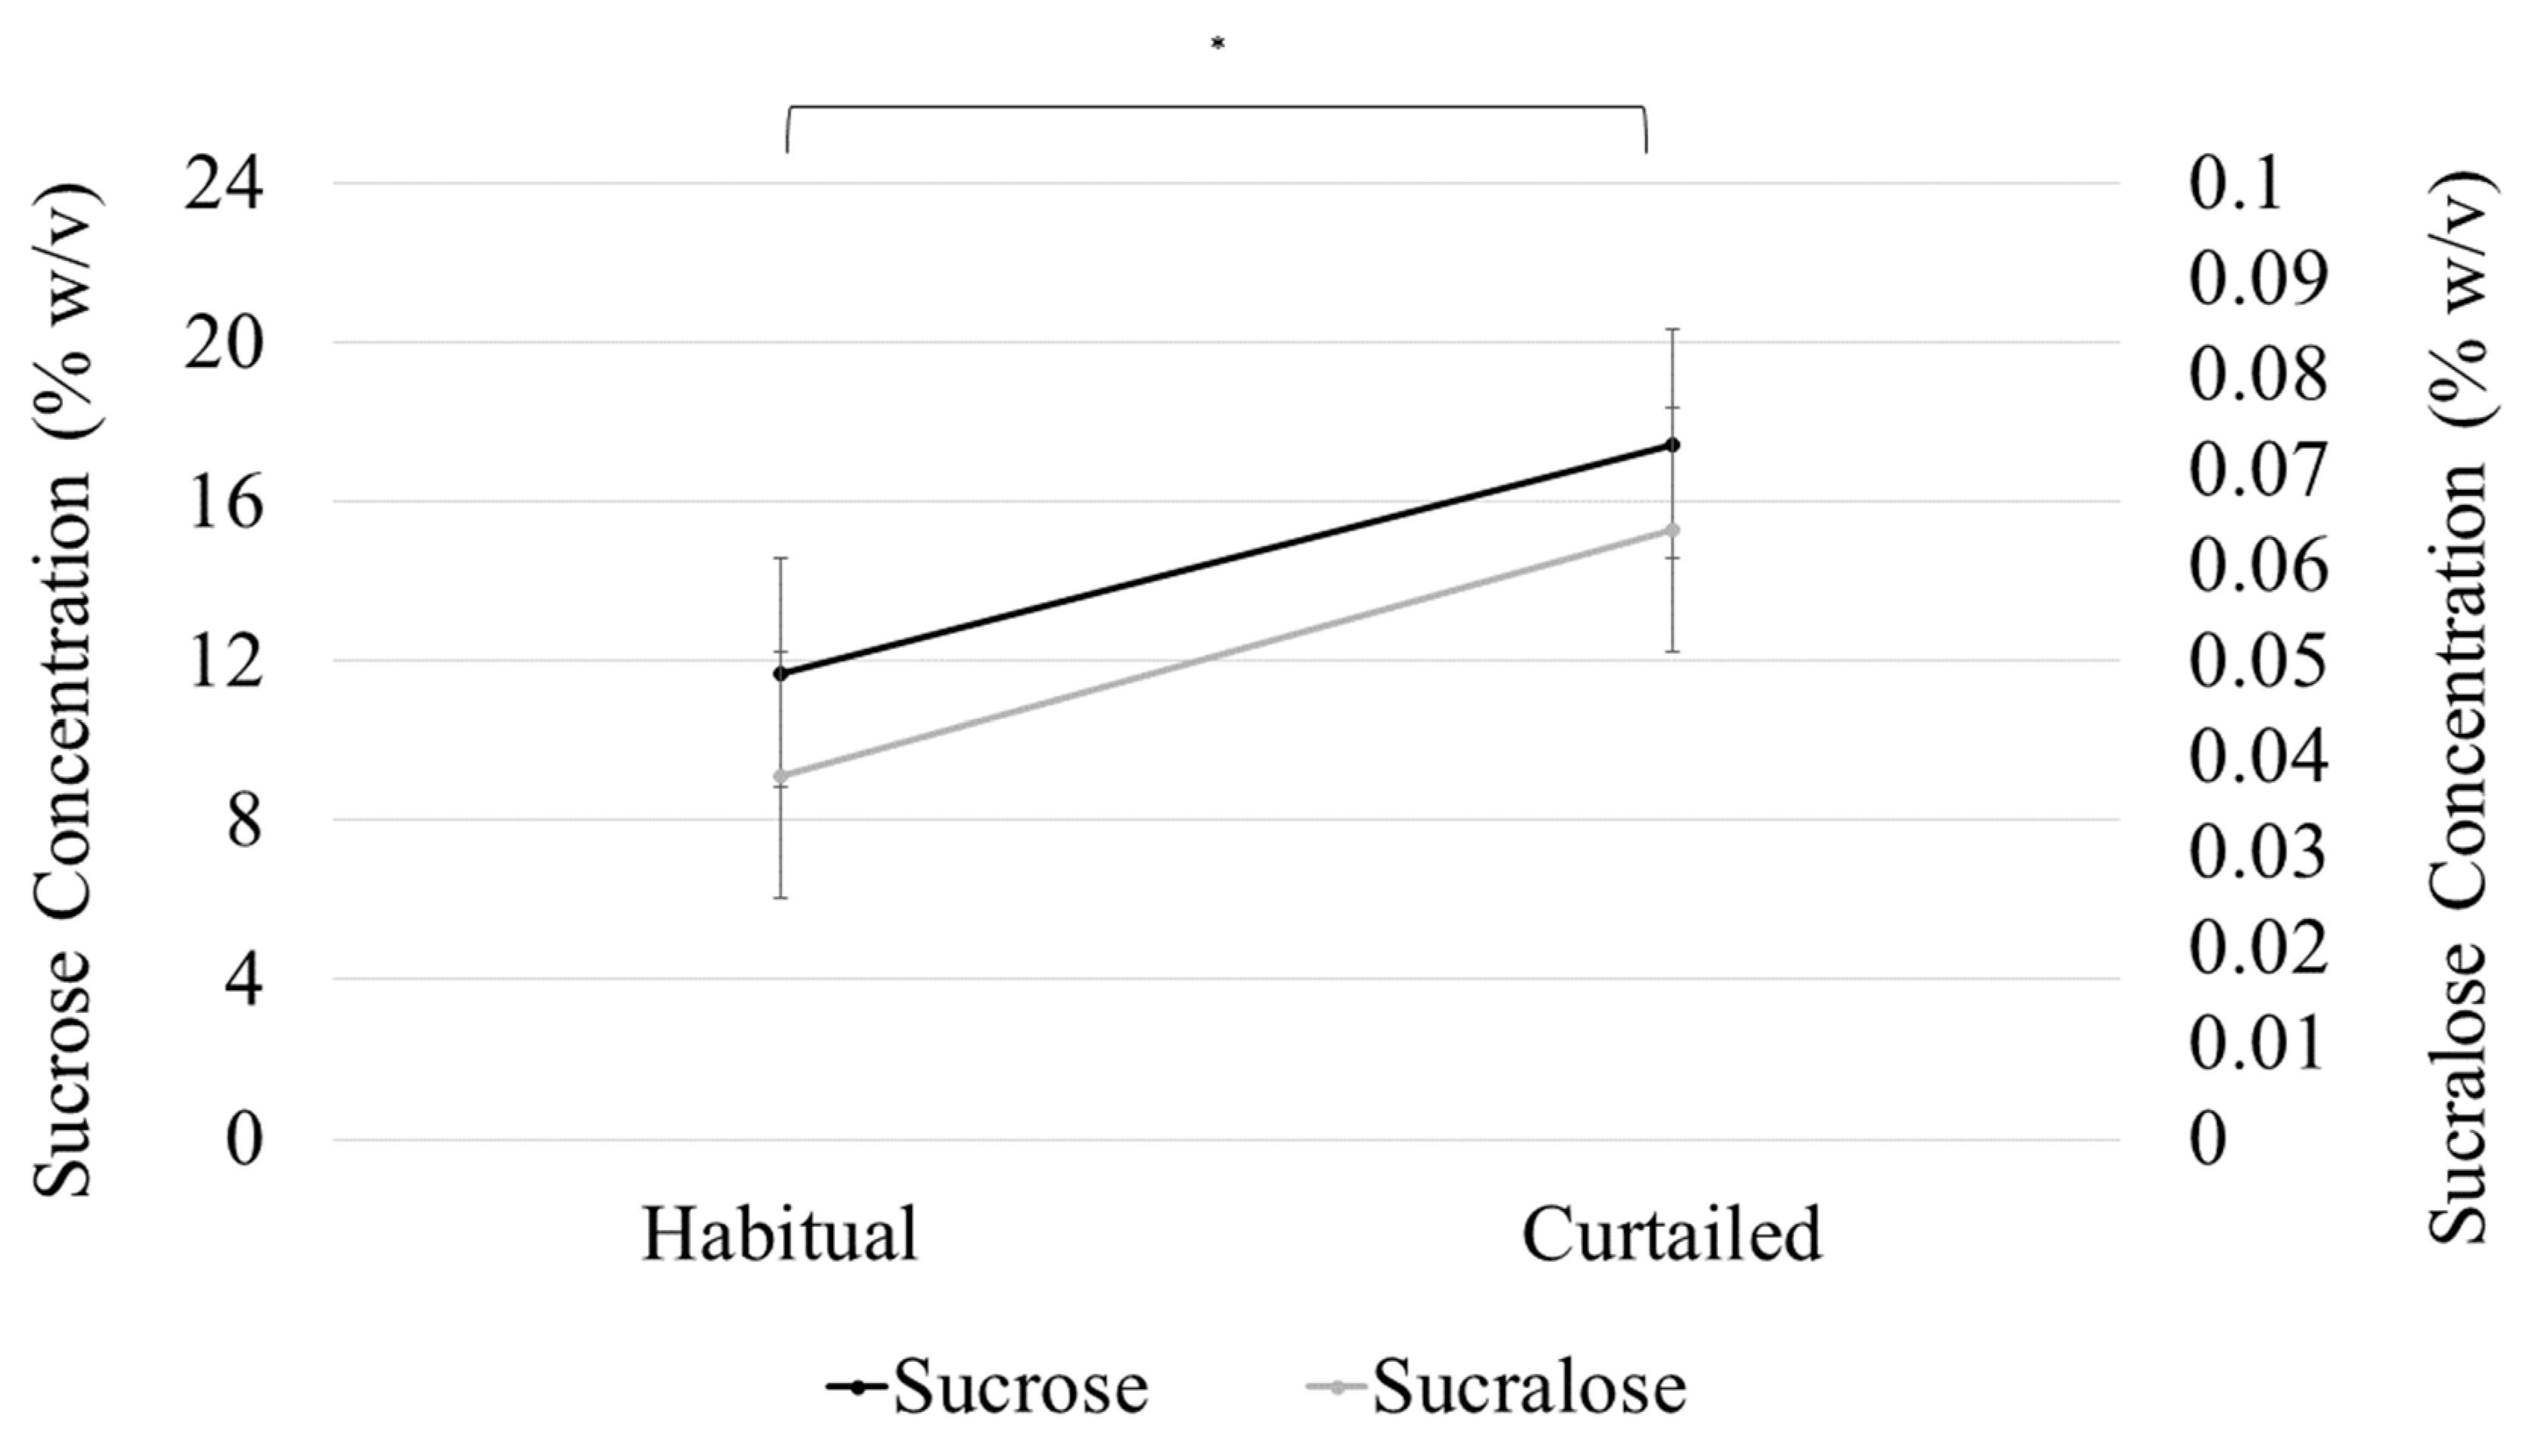
3.5. Sweet Preference
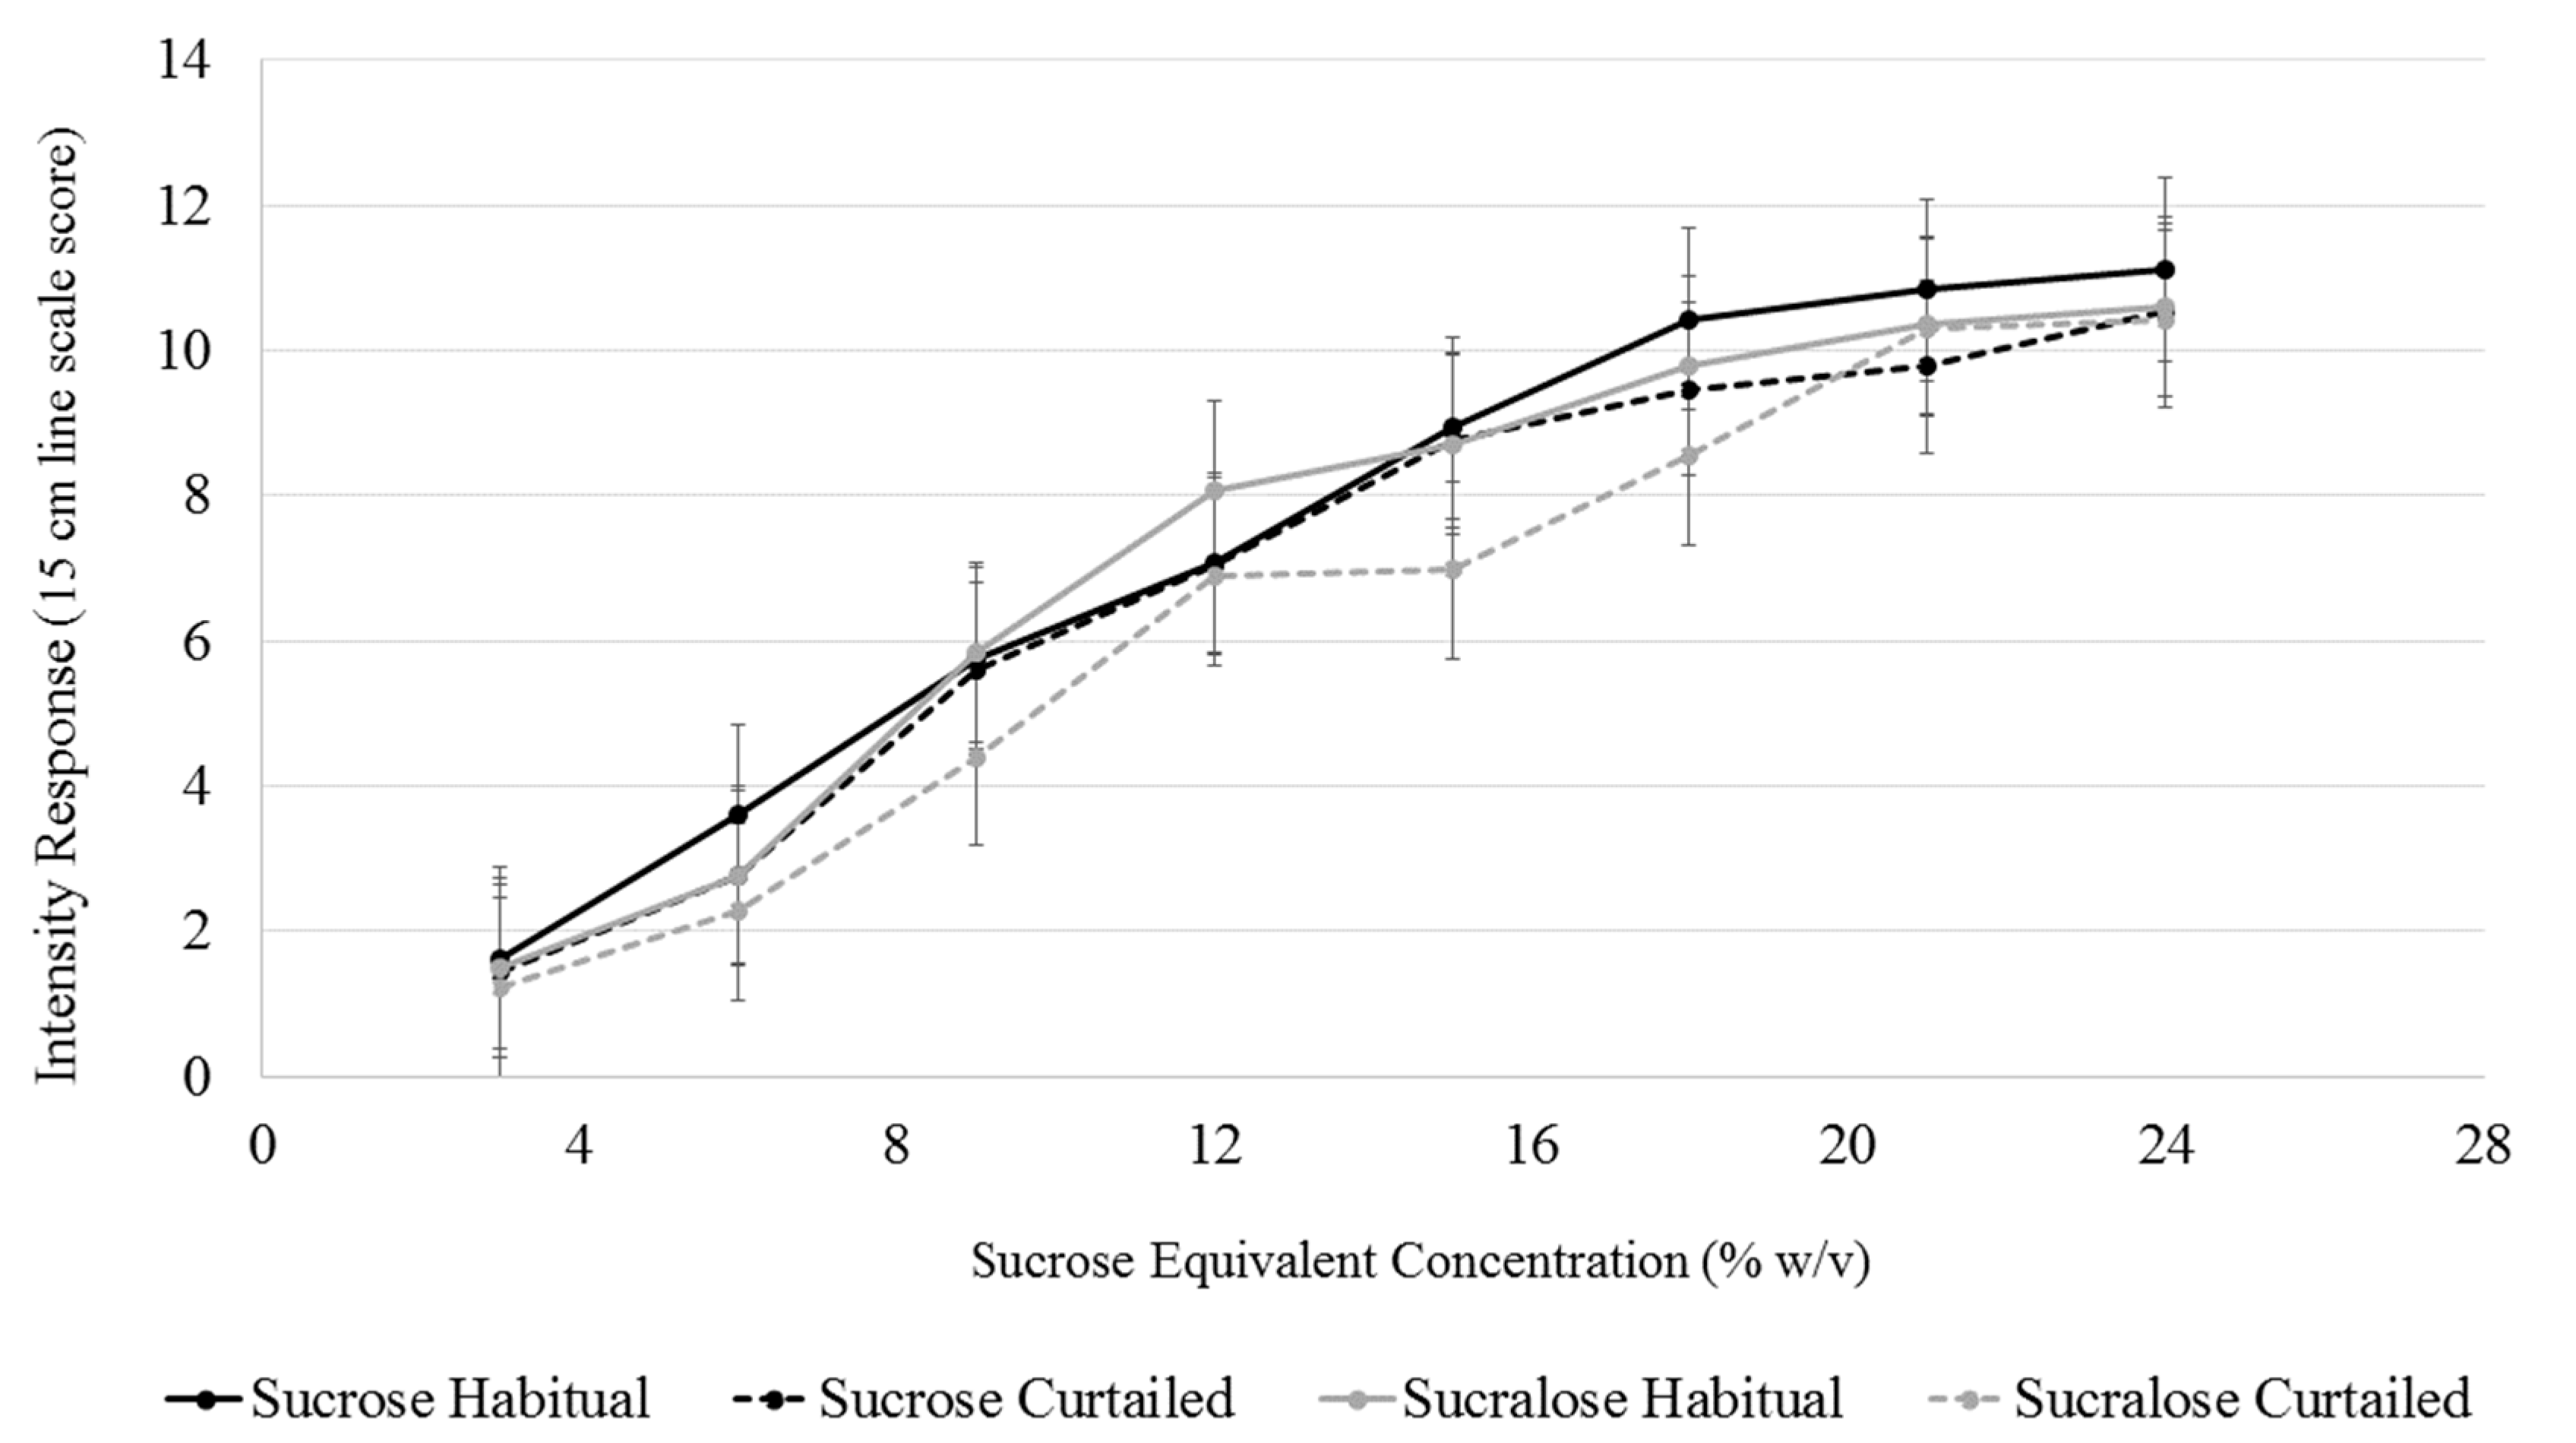
3.6. Sweet Intensity
3.7. Sweet Liking
4. Discussion
Strengths and Limitations
5. Conclusions
Author Contributions
Funding
Acknowledgments
Conflicts of Interest
References
- Chen, X.; Gelaye, B.; Williams, M.A. Sleep characteristics and health-related quality of life among a national sample of American young adults: Assessment of possible health disparities. Qual. Life Res. 2014, 23, 613–625. [Google Scholar] [CrossRef] [PubMed]
- Ford, E.S.; Cunningham, T.J.; Croft, J.B. Trends in Self-Reported Sleep Duration among US Adults from 1985 to 2012. Sleep 2015, 38, 829–832. [Google Scholar] [CrossRef] [PubMed]
- Patel, S.R.; Hu, F.B. Short sleep duration and weight gain: A systematic review. Obesity 2012, 16, 643–653. [Google Scholar] [CrossRef] [PubMed]
- Spiegel, K.; Leproult, R.; Van Cauter, E. Impact of sleep debt on metabolic and endocrine function. Lancet 1999, 354, 1435–1439. [Google Scholar] [CrossRef]
- Scheen, A.J.; Byrne, M.M.; Plat, L.; Leproult, R.; Van Cauter, E. Relationships between sleep quality and glucose regulation in normal humans. Am. J. Physiol. Metab. 1996, 271, E261–E270. [Google Scholar] [CrossRef] [PubMed]
- Robertson, M.D.; Russell-Jones, D.; Umpleby, A.M.; Dijk, D.-J. Effects of three weeks of mild sleep restriction implemented in the home environment on multiple metabolic and endocrine markers in healthy young men. Metabolism 2013, 62, 204–211. [Google Scholar] [CrossRef] [PubMed]
- Van Cauter, E.; Leproult, R.; Plat, L. Age-Related Changes in Slow Wave Sleep and REM Sleep and Relationship with Growth Hormone and Cortisol Levels in Healthy Men. JAMA 2000, 284, 861–868. [Google Scholar] [CrossRef]
- Van Der Lely, A.J.; Tschoep, M.; Heiman, M.L.; Ghigo, E. Biological, Physiological, Pathophysiological, and Pharmacological Aspects of Ghrelin. Endocr. Rev. 2004, 25, 426–457. [Google Scholar] [CrossRef]
- McNeil, J.; Forest, G.; Hintze, L.J.; Brunet, J.-F.; Finlayson, G.; Blundell, J.E. Doucet, Éric the effects of partial sleep restriction and altered sleep timing on appetite and food reward. Appetite 2017, 109, 48–56. [Google Scholar] [CrossRef]
- Hanlon, E.C.; Andrzejewski, M.E.; Harder, B.K.; Kelley, A.E.; Benca, R.M. The effect of REM sleep deprivation on motivation for food reward. Behav. Brain Res. 2005, 163, 58–69. [Google Scholar] [CrossRef]
- Greer, S.M.; Goldstein, A.N.; Walker, M.P. The impact of sleep deprivation on food desire in the human brain. Nat. Commun. 2013, 4, 2259. [Google Scholar] [CrossRef]
- Thomas, M.; Sing, H.; Belenky, G.; Holcomb, H.; Mayberg, H.; Dannals, R.; Wagner, H., Jr.; Thorne, D.; Popp, K.; Rowland, L.; et al. Neural basis of alertness and cognitive performance impairments during sleepiness. I. Effects of 24 h of sleep deprivation on waking human regional brain activity. J. Sleep Res. 2000, 9, 335–352. [Google Scholar] [CrossRef]
- Nedeltcheva, A.V.; Kilkus, J.M.; Imperial, J.; Kasza, K.; Schoeller, D.A.; Penev, P.D. Sleep curtailment is accompanied by increased intake of calories from snacks. Am. J. Clin. Nutr. 2009, 89, 126–133. [Google Scholar] [CrossRef]
- Markwald, R.R.; Melanson, E.L.; Smith, M.R.; Higgins, J.; Perreault, L.; Eckel, R.H.; Wright, K.P. Impact of insufficient sleep on total daily energy expenditure, food intake, and weight gain. Proc. Natl. Acad. Sci. USA 2013, 110, 5695–5700. [Google Scholar] [CrossRef]
- Chaput, J.-P.; St-Onge, M.-P. Increased food intake by insufficient sleep in humans: Are we jumping the gun on the hormonal explanation? Front. Endocrinol. 2014, 5, 116. [Google Scholar] [CrossRef]
- Bosy-Westphal, A.; Hinrichs, S.; Jauch-Chara, K.; Hitze, B.; Later, W.; Wilms, B.; Settler, U.; Peters, A.; Kiosz, D.; Müller, M.J. Influence of Partial Sleep Deprivation on Energy Balance and Insulin Sensitivity in Healthy Women. Obes. Facts 2008, 1, 266–273. [Google Scholar] [CrossRef]
- Calvin, A.D.; Carter, R.E.; Adachi, T.; Macedo, P.G.; Albuquerque, F.N.; Van Der Walt, C.; Bukartyk, J.; Davison, D.E.; Levine, J.A.; Somers, V.K. Effects of Experimental Sleep Restriction on Caloric Intake and Activity Energy Expenditure. Chest 2013, 144, 79–86. [Google Scholar] [CrossRef]
- St-Onge, M.-P. The Role of Sleep Duration in the Regulation of Energy Balance: Effects on Energy Intakes and Expenditure. J. Clin. Sleep Med. 2013, 9, 73–80. [Google Scholar] [CrossRef]
- Chaput, J.-P. Sleep patterns, diet quality and energy balance. Physiol. Behav. 2014, 134, 86–91. [Google Scholar] [CrossRef]
- Hogenkamp, P.S.; Nilsson, E.; Nilsson, V.C.; Chapman, C.D.; Vogel, H.; Lundberg, L.S.; Zarei, S.; Cedernaes, J.; Rangtell, F.H.; Broman, J.E.; et al. Acute sleep deprivation increases portion size and affects food choice in young men. Psychoneruoendocrinology 2013, 38, 1668–1674. [Google Scholar] [CrossRef]
- Meilgaard, M.C.; Carr, B.T.; Civille, G.V.; Carr, B.T.; Civille, G.V. Sensory Evaluation Techniques; CRC Press: Boca Raton, FL, USA, 1999; ISBN 978-1-4398-3227-1. [Google Scholar]
- Szczygiel, E.J.; Cho, S.; Tucker, R.M. Characterization of the relationships between sleep duration, quality, architecture and chemosensory function in non-obese females. Chem. Senses 2018, 43, 223–228. [Google Scholar] [CrossRef]
- Szczygiel, E.J.; Cho, S.; Snyder, M.K.; Tucker, R.M. Associations between chemosensory function, sweet taste preference, and the previous night’s sleep in non-obese males. Food Qual. Prefer. 2019, 75, 105–112. [Google Scholar] [CrossRef]
- Lean, M.E.J.; Astrup, A.; Roberts, S.B. Making progress on the global crisis of obesity and weight management. BMJ 2018, 361, k2538. [Google Scholar] [CrossRef]
- Leigh, S.-J.; Morris, M.J. The role of reward circuitry and food addiction in the obesity epidemic: An update. Biol. Psychol. 2018, 131, 31–42. [Google Scholar] [CrossRef]
- Gujar, N.; Yoo, S.-S.; Hu, P.; Walker, M.P. Sleep deprivation amplifies reactivity of brain reward networks, biasing the appraisal of positive emotional experiences. J. Neurosci. 2011, 31, 4466–4474. [Google Scholar] [CrossRef]
- Benedict, C.; Brooks, S.J.; O’Daly, O.G.; Almèn, M.S.; Morell, A.; Åberg, K.; Gingnell, M.; Schultes, B.; Hallschmid, M.; Broman, J.-E.; et al. Acute sleep deprivation enhances the brain’s response to hedonic food simuli: An fMRI Study. J. Clin. Endocrinol. Metab. 2012, 97, E443–E447. [Google Scholar] [CrossRef]
- Demos, K.E.; Sweet, L.H.; Hart, C.N.; McCaffery, J.M.; Williams, S.E.; Mailloux, K.A.; Trautvetter, J.; Owens, M.M.; Wing, R.R. The Effects of Experimental Manipulation of Sleep Duration on Neural Response to Food Cues. Sleep 2017, 40. [Google Scholar] [CrossRef]
- St-Onge, M.-P.; Wolfe, S.; Sy, M.; Shechter, A.; Hirsch, J. Sleep restriction increases the neuronal response to unhealthy food in normal-weight individuals. Int. J. Obes. 2014, 38, 411–416. [Google Scholar] [CrossRef]
- Drewnowski, A. Intense sweeteners and energy density of foods: Implications for weight control. Eur. J. Clin. Nutr. 1999, 53, 757–763. [Google Scholar] [CrossRef]
- Lv, W.; Finlayson, G.; Dando, R. Sleep, food cravings and taste. Appetite 2018, 125, 210–216. [Google Scholar] [CrossRef]
- Smith, S.L.; Ludy, M.-J.; Tucker, R.M. Changes in taste preference and steps taken after sleep curtailment. Physiol. Behav. 2016, 163, 228–233. [Google Scholar] [CrossRef]
- Furchtgott, E.; Willingham, W.W. The Effect of Sleep-Deprivation upon the Thresholds of Taste. Am. J. Psychol. 1956, 69, 111–112. [Google Scholar] [CrossRef]
- Tanaka, T.; Hong, G.; Tominami, K.; Kudo, T.-A. Oral Fat Sensitivity Is Associated with Social Support for Stress Coping in Young Adult Men. Tohoku J. Exp. Med. 2018, 244, 249–261. [Google Scholar] [CrossRef]
- Yeomans, M.R.; Tepper, B.J.; Rietzschel, J.; Prescott, J. Human hedonic responses to sweetness: Role of taste genetics and anatomy. Physiol. Behav. 2007, 91, 264–273. [Google Scholar] [CrossRef]
- Iatridi, V.; Hayes, J.E.; Yeomans, M.R. Reconsidering the classification of sweet taste liker phenotypes: A methodological review. Food Qual. Prefer. 2018, 72, 56–76. [Google Scholar] [CrossRef]
- Iatridi, V.; Hayes, J.E.; Yeomans, M.R. Quantifying Sweet Taste Liker Phenotypes: Time for Some Consistency in the Classification Criteria. Nutrients 2019, 11, 129. [Google Scholar] [CrossRef]
- Kim, J.-Y.; Prescott, J.; Kim, K.-O. Patterns of sweet liking in sucrose solutions and beverages. Food Qual. Prefer. 2014, 36, 96–103. [Google Scholar] [CrossRef]
- Asao, K.; Miller, J.; Arcori, L.; Lumeng, J.C.; Han-Markey, T.; Herman, W.H. Patterns of Sweet Taste Liking: A Pilot Study. Nutrients 2015, 7, 7298–7311. [Google Scholar] [CrossRef]
- Kim, J.-Y.; Prescott, J.; Kim, K.-O. Emotional responses to sweet foods according to sweet liker status. Food Qual. Prefer. 2017, 59, 1–7. [Google Scholar] [CrossRef]
- Mennella, J.A.; Pepino, M.Y.; Reed, D.R. Genetic and Environmental Determinants of Bitter Perception and Sweet Preferences. Pediatrics 2005, 115, e216–e222. [Google Scholar] [CrossRef]
- Bachmanov, A.A.; Bosak, N.P.; Floriano, W.B.; Inoue, M.; Li, X.; Lin, C.; Murovets, V.O.; Reed, D.R.; Zolotarev, V.A.; Beauchamp, G.K. Genetics of sweet taste preferences. Flavour Fragr. J. 2011, 26, 286–294. [Google Scholar] [CrossRef]
- Keskitalo, K.; Tuorila, H.; Spector, T.D.; Cherkas, L.F.; Knaapila, A.; Silventoinen, K.; Perola, M. Same genetic components underlie different measures of sweet taste preference. Am. J. Clin. Nutr. 2007, 86, 1663–1669. [Google Scholar] [CrossRef]
- Yeomans, M.R.; Prescott, J.; Gould, N.J. Acquired hedonic and sensory characteristics of odours: Influence of sweet liker and propylthiouracil taster status. Q. J. Exp. Psychol. 2009, 62, 1648–1664. [Google Scholar] [CrossRef]
- Lange, L.A.; Kampov-Polevoy, A.B.; Garbutt, J.C. Sweet Liking and High Novelty Seeking: Independent Phenotypes Associated with Alcohol-related Problems. Alcohol Alcohol. 2010, 45, 431–436. [Google Scholar] [CrossRef]
- Lange, L.; Bobashev, G.; Eggleston, B.; Root, T.; Garbutt, J.C.; Kampov-Polevoy, A. Sweet-Liking Is Associated with Transformation of Heavy Drinking into Alcohol-Related Problems in Young Adults with High Novelty Seeking. Alcohol. Clin. Exp. Res. 2014, 38, 2119–2126. [Google Scholar]
- Kampov-Polevoy, A.B.; Alterman, A.; Khalitov, E.; Garbutt, J.C. Sweet preference predicts mood altering effect of and impaired control over eating sweet foods. Eat. Behav. 2006, 7, 181–187. [Google Scholar] [CrossRef]
- Frank, G.K.W.; Oberndorfer, T.A.; Simmons, A.N.; Paulus, M.P.; Fudge, J.L.; Yang, T.T.; Kaye, W.H. Sucrose activates human taste pathways differently from artificial sweetener. NeuroImage 2008, 39, 1559–1569. [Google Scholar] [CrossRef]
- Asao, K.; Luo, W.; Herman, W.H. Reproducibility of the measurement of sweet taste preferences. Appetite 2012, 59, 927–932. [Google Scholar] [CrossRef]
- Oleson, S.; Murphy, C. Prediction of Stevia Liking by Sucrose Liking: Effects of Beverage Background. Chemosens. Percept. 2017, 10, 49–59. [Google Scholar] [CrossRef]
- Bobowski, N.; Mennella, J.A. Personal Variation in Preference for Sweetness: Effects of Age and Obesity. Child. Obes. 2017, 13, 369–376. [Google Scholar] [CrossRef]
- Green, E.; Murphy, C. Altered processing of sweet taste in the brain of diet soda drinkers. Physiol. Behav. 2012, 107, 560–567. [Google Scholar] [CrossRef]
- Wiet, S.G.; Beyts, P.K. Sensory Characteristics of Sucralose and other High Intensity Sweeteners. J. Food Sci. 1992, 57, 1014–1019. [Google Scholar] [CrossRef]
- Binns, N.M. Sucralose—All sweetness and light. Nutr. Bull. 2003, 28, 53–58. [Google Scholar] [CrossRef]
- Dinges, D.F.; Pack, F.; Williams, K.; Gillen, K.A.; Powell, J.W.; Ott, G.E.; Aptowicz, C.; Pack, A.I. Cumulative sleepiness, mood disturbance, and psychomotor vigilance performance decrements during a week of sleep restricted to 4–5 h per night. Sleep 1997, 20, 267–277. [Google Scholar]
- Buysse, D.J.; Reynolds, C.F.; Monk, T.H.; Berman, S.R.; Kupfer, D.J. The Pittsburgh sleep quality index: A new instrument for psychiatric practice and research. Psychiatry Res. 1989, 28, 193–213. [Google Scholar] [CrossRef]
- Mermelstein, R.; Cohen, S.; Mermelstein, T.K. A Global Measure of Perceived Stress. J. Health Soc. Behav. 1983, 24, 385–396. [Google Scholar]
- Cepeda-Benito, A.; Gleaves, D.H.; Williams, T.L.; Erath, S.A. The development and validation of the state and trait food-cravings questionnaires. Behav. Ther. 2000, 31, 151–173. [Google Scholar] [CrossRef]
- Cheeta, S.; Ruigt, G.; Van Proosdij, J.; Willner, P. Changes in sleep architecture following chronic mild stress. Biol. Psychiatry 1997, 41, 419–427. [Google Scholar] [CrossRef]
- Nijs, I.M.; Franken, I.H.; Muris, P. The modified Trait and State Food-Cravings Questionnaires: Development and validation of a general index of food craving. Appetite 2007, 49, 38–46. [Google Scholar] [CrossRef]
- Meule, A.; Kübler, A. Double trouble. Trait food craving and impulsivity interactively predict food-cue affected behavioral inhibition. Appetite 2014, 79, 174–182. [Google Scholar] [CrossRef]
- Kaplan, R.F.; Wang, Y.; Loparo, K.A.; Kelly, M.R.; Bootzin, R.R. Performance evaluation of an automated single-channel sleep–wake detection algorithm. Nat. Sci. Sleep 2014, 6, 113–122. [Google Scholar] [CrossRef]
- Kaida, K.; Takahashi, M.; Akerstedt, T.; Nakata, A.; Otsuka, Y.; Haratani, T.; Fukasawa, K. Validation of the Karolinska sleepiness scale against performance and EEG variables. Clin. Neurophysiol. 2006, 117, 1574–1581. [Google Scholar] [CrossRef]
- Watson, D.; Clark, L.A.; Tellegen, A. Development and validation of brief measures of positive and negative affect: The PANAS scales. J. Pers. Soc. Psychol. 1988, 54, 1063–1070. [Google Scholar] [CrossRef]
- Shahid, A.; Wilkinson, K.; Marcu, S.; Shapiro, C.M. Karolinska Sleepiness Scale (KSS). In STOP, THAT and One Hundred Other Sleep Scales; Shahid, A., Wilkinson, K., Marcu, S., Shapiro, C.M., Eds.; Springer: New York, NY, USA, 2012; pp. 209–210. ISBN 978-1-4419-9893-4. [Google Scholar]
- Franzen, P.L.; Siegle, G.J.; Buysse, D.J. Relationships between affect, vigilance, and sleepiness following sleep deprivation. J. Sleep Res. 2008, 17, 34–41. [Google Scholar] [CrossRef]
- Merrill, E.P.; Kramer, F.M.; Cardello, A.; Schutz, H. A comparison of satiety measures. Appetite 2002, 39, 181–183. [Google Scholar] [CrossRef]
- Reis, F.; De Andrade, J.; Deliza, R.; Ares, G. Comparison of Two Methodologies for Estimating Equivalent Sweet Concentration of High-Intensity Sweeteners with Untrained Assessors: Case Study with Orange/Pomegranate Juice. J. Sens. Stud. 2016, 31, 341–347. [Google Scholar] [CrossRef]
- Moskowitz, H.R. Sweetness and intensity of artificial sweeteners. Percept. Psychophys. 1970, 8, 40–42. [Google Scholar] [CrossRef]
- Mennella, J.A.; Lukasewycz, L.D.; Griffith, J.W.; Beauchamp, G.K. Evaluation of the Monell Forced-Choice, Paired-Comparison Tracking Procedure for Determining Sweet Taste Preferences across the Lifespan. Chem. Senses 2011, 36, 345–355. [Google Scholar] [CrossRef]
- Hogenkamp, P.S.; Nilsson, E.; Chapman, C.D.; Cedernaes, J.; Bird, H.; Dickson, S.L.; Broman, J.E.; Schioth, H.B.; Benefict, C. Sweet taste perception not altered after acute sleep deprivation in healthy young men. Somnology 2013, 17, 111–114. [Google Scholar] [CrossRef][Green Version]
- Glickman, M.E.; Rao, S.R.; Schultz, M.R. False discovery rate control is a recommended alternative to Bonferroni-type adjustments in health studies. J. Clin. Epidemiol. 2014, 67, 850–857. [Google Scholar] [CrossRef]
- Tan, S.-Y.; Tucker, R.M. Sweet Taste as a Predictor of Dietary Intake: A Systematic Review. Nutrients 2019, 11, 94. [Google Scholar] [CrossRef]
- Van Dongen, H.P.; Maislin, G.; Mullington, J.M.; Dinges, D.F. The cumulative cost of additional wakefulness: Dose-response effects on neurobehavioral functions and sleep physiology from chronic sleep restriction and total sleep deprivation. Sleep 2003, 16, 117–126. [Google Scholar] [CrossRef]
- Ong, A.D.; Kim, S.; Young, S.; Steptoe, A. Positive affect and sleep: A systematic review. Sleep Med. Rev. 2017, 35, 21–32. [Google Scholar] [CrossRef]
- Stringer, D.M. Negative affect. In Encyclopedia of Behavioral Medicine; Gellman, M.D., Turner, J.R., Eds.; Springer: New York, NY, USA, 2013; pp. 1303–1304. ISBN 978-1-4419-1005-9. [Google Scholar]
- Rossa, K.R.; Smith, S.S.; Allan, A.C.; Sullivan, K.A. The Effects of Sleep Restriction on Executive Inhibitory Control and Affect in Young Adults. J. Adolesc. Health 2014, 55, 287–292. [Google Scholar] [CrossRef]
- Steptoe, A.; O’Donnell, K.; Marmot, M.; Wardle, J. Positive affect, psychological well-being, and good sleep. J. Psychosom. Res. 2008, 64, 409–415. [Google Scholar] [CrossRef]
- Lo, J.C.; Ong, J.L.; Leong, R.L.; Gooley, J.J.; Chee, M.W. Cognitive Performance, Sleepiness, and Mood in Partially Sleep Deprived Adolescents: The Need for Sleep Study. Sleep 2016, 39, 687–698. [Google Scholar] [CrossRef]
- Minkel, J.D.; Banks, S.; Htaik, O.; Moreta, M.C.; Jones, C.W.; McGlinchey, E.L.; Simpson, N.S.; Dinges, D.F. Sleep Deprivation and Stressors: Evidence for Elevated Negative Affect in Response to Mild Stressors When Sleep Deprived. Emotion 2012, 12, 1015–1020. [Google Scholar] [CrossRef]
- Noel, C.; Dando, R. The effect of emotional state on taste perception. Appetite 2015, 95, 89–95. [Google Scholar] [CrossRef]


| Sex | N | % |
|---|---|---|
| Male | 13 | 32% |
| Female | 27 | 67% |
| Race | n | % |
| White | 26 | 65% |
| Asian | 12 | 30% |
| Other/More than 1 | 2 | 5% |
| Anthropometrics | Mean ± SD | Range |
| Body mass index (kg/m2) | 22.9 ± 3.0 | 18.5–29.7 |
| Body fat (%) | 22.3 ± 7.9 | 9.9–35.5 |
| Age (y) | 23.8 ± 4.6 | 18–37 |
| Traits/Habits (score) | Mean ± SD | Range |
| General food craving questionnaire-trait version | 51.3 ± 17.2 | 22–89 |
| Perceived stress scale | 11.3 ± 4.4 | 3–21 |
| Pittsburgh Sleep Quality Index | 3.3 ± 1.4 | 0–5 |
| Habitual | Curtailed | % Reduction | p-Value | q-Value | ||
|---|---|---|---|---|---|---|
| Objective Sleep Measures (h) | Time in bed | 8.2 ± 0.7 | 5.3 ± 0.7 | 35.30% | <0.001 | <0.001 |
| Total sleep time | 7.0 ± 0.8 | 4.5 ± 0.8 | 36.00% | <0.001 | <0.001 | |
| Light sleep | 3.6 ± 0.7 | 2.0 ± 0.6 | 44.20% | <0.001 | <0.001 | |
| REM sleep | 1.9 ± 0.5 | 1.1 ± 0.3 | 40.40% | <0.001 | <0.001 | |
| Slow wave sleep | 1.6 ± 0.3 | 1.3 ± 0.4 | 16.70% | <0.001 | <0.001 | |
| Sleepiness (10 pt) | Karolinska Sleepiness scale | 3.9 ± 1.6 | 5.5 ± 1.8 | <0.001 | <0.001 | |
| Subjective Previous Night’s Sleep Measures (5pt) | Subjective Sleep Composite | 12.8 ± 2.1 | 10.9 ± 2.6 | <0.001 | <0.001 | |
| How much sleep did you obtain last night? | 2.9 ± 0.6 | 1.5 ± 0.6 | <0.001 | <0.001 | ||
| How deeply did you sleep? | 3.7 ± 0.9 | 2.6 ± 0.9 | 0.491 | 0.534 | ||
| How would you rate the quality of your sleep | 3.4 ± 0.7 | 3.1 ± 1.3 | 0.209 | 0.256 | ||
| Compared to an average night, how comfortable were you when sleeping last night? | 2.8 ± 0.6 | 2.7 ± 0.7 | 0.711 | 0.711 | ||
| Measure | Factor | Habitual | Curtailed | p-Value | q-Value |
|---|---|---|---|---|---|
| Hunger | Hunger (100 mm VAS) | 66.0 ± 15.6 | 69.6 ± 15.1 | 0.193 | 0.248 |
| G-FCQ-S (0–15 per factor) | Total | 42.9 ± 10.8 | 46.3 ± 10.8 | 0.071 | 0.159 |
| F1-Desire to Eat | 8.3 ± 3.0 | 9.0 ± 3.1 | 0.189 | 0.248 | |
| F2-Anticipation to positive reinforcement | 8.8 ± 3.2 | 10.0 ± 3.1 | 0.022 | 0.099 a | |
| F3-Anticipation to negative reinforcement | 9.8 ± 2.9 | 10.5 ± 2.3 | 0.104 | 0.188 | |
| F4-Obsessive preoccupation | 6.4 ± 2.2 | 6.8 ± 2.5 | 0.347 | 0.390 | |
| F5-Craving as a physiological state | 9.7 ± 2.5 | 10.0 ± 2.9 | 0.534 | 0.534 | |
| PANAS | Positive Affect | 23.8 ± 8.7 | 20.5 ± 7.1 | 0.005 | 0.040 |
| Negative Affect | 13.8 ± 5.3 | 15.0 ± 6.0 | 0.050 | 0.150 |
| Sweetener | Sleep Status | Sweet Likers (n) | Sweet Non-likers (n) | |
|---|---|---|---|---|
| Inverted U-Shape | Sweet Dislikers | |||
| Sucrose | Habitual | 25 | 6 | 9 |
| Curtailed | 28 | 4 | 8 | |
| Sucralose | Habitual | 24 | 10 | 6 |
| Curtailed | 29 | 3 | 8 | |
| Habitual Cluster | Preferred Concentration (% w/v) | ||||
|---|---|---|---|---|---|
| Sucrose | Sucralose | ||||
| Habitual | Curtailed | Habitual | Curtailed | ||
| “Sweet Likers” | 1 (Likers) | 14.9 ± 4.4 * | 17.5 ± 4.4 * | 0.05 ± 0.02 * | 0.08 ± 0.02 * |
| “Sweet Non-Likers” | 2 (Inverted U-shape) | 8.4 ± 5.3 | 12.4 ± 3.8 | 0.03 ± 0.03 | 0.04 ± 0.02 |
| 3 (Dislikers) | 5.1 ± 2.8 | 10.0 ± 1.9 | 0.01 ± 0.01 | 0.03 ± 0.02 | |
| Non-likers Total | 6.8 ± 4.1 | 11.4 ± 2.9 | 0.02 ± 0.02 | 0.03 ± 0.02 | |
© 2019 by the authors. Licensee MDPI, Basel, Switzerland. This article is an open access article distributed under the terms and conditions of the Creative Commons Attribution (CC BY) license (http://creativecommons.org/licenses/by/4.0/).
Share and Cite
Szczygiel, E.J.; Cho, S.; Tucker, R.M. Multiple Dimensions of Sweet Taste Perception Altered after Sleep Curtailment. Nutrients 2019, 11, 2015. https://doi.org/10.3390/nu11092015
Szczygiel EJ, Cho S, Tucker RM. Multiple Dimensions of Sweet Taste Perception Altered after Sleep Curtailment. Nutrients. 2019; 11(9):2015. https://doi.org/10.3390/nu11092015
Chicago/Turabian StyleSzczygiel, Edward J., Sungeun Cho, and Robin M. Tucker. 2019. "Multiple Dimensions of Sweet Taste Perception Altered after Sleep Curtailment" Nutrients 11, no. 9: 2015. https://doi.org/10.3390/nu11092015
APA StyleSzczygiel, E. J., Cho, S., & Tucker, R. M. (2019). Multiple Dimensions of Sweet Taste Perception Altered after Sleep Curtailment. Nutrients, 11(9), 2015. https://doi.org/10.3390/nu11092015