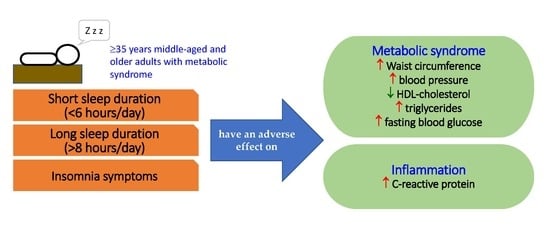
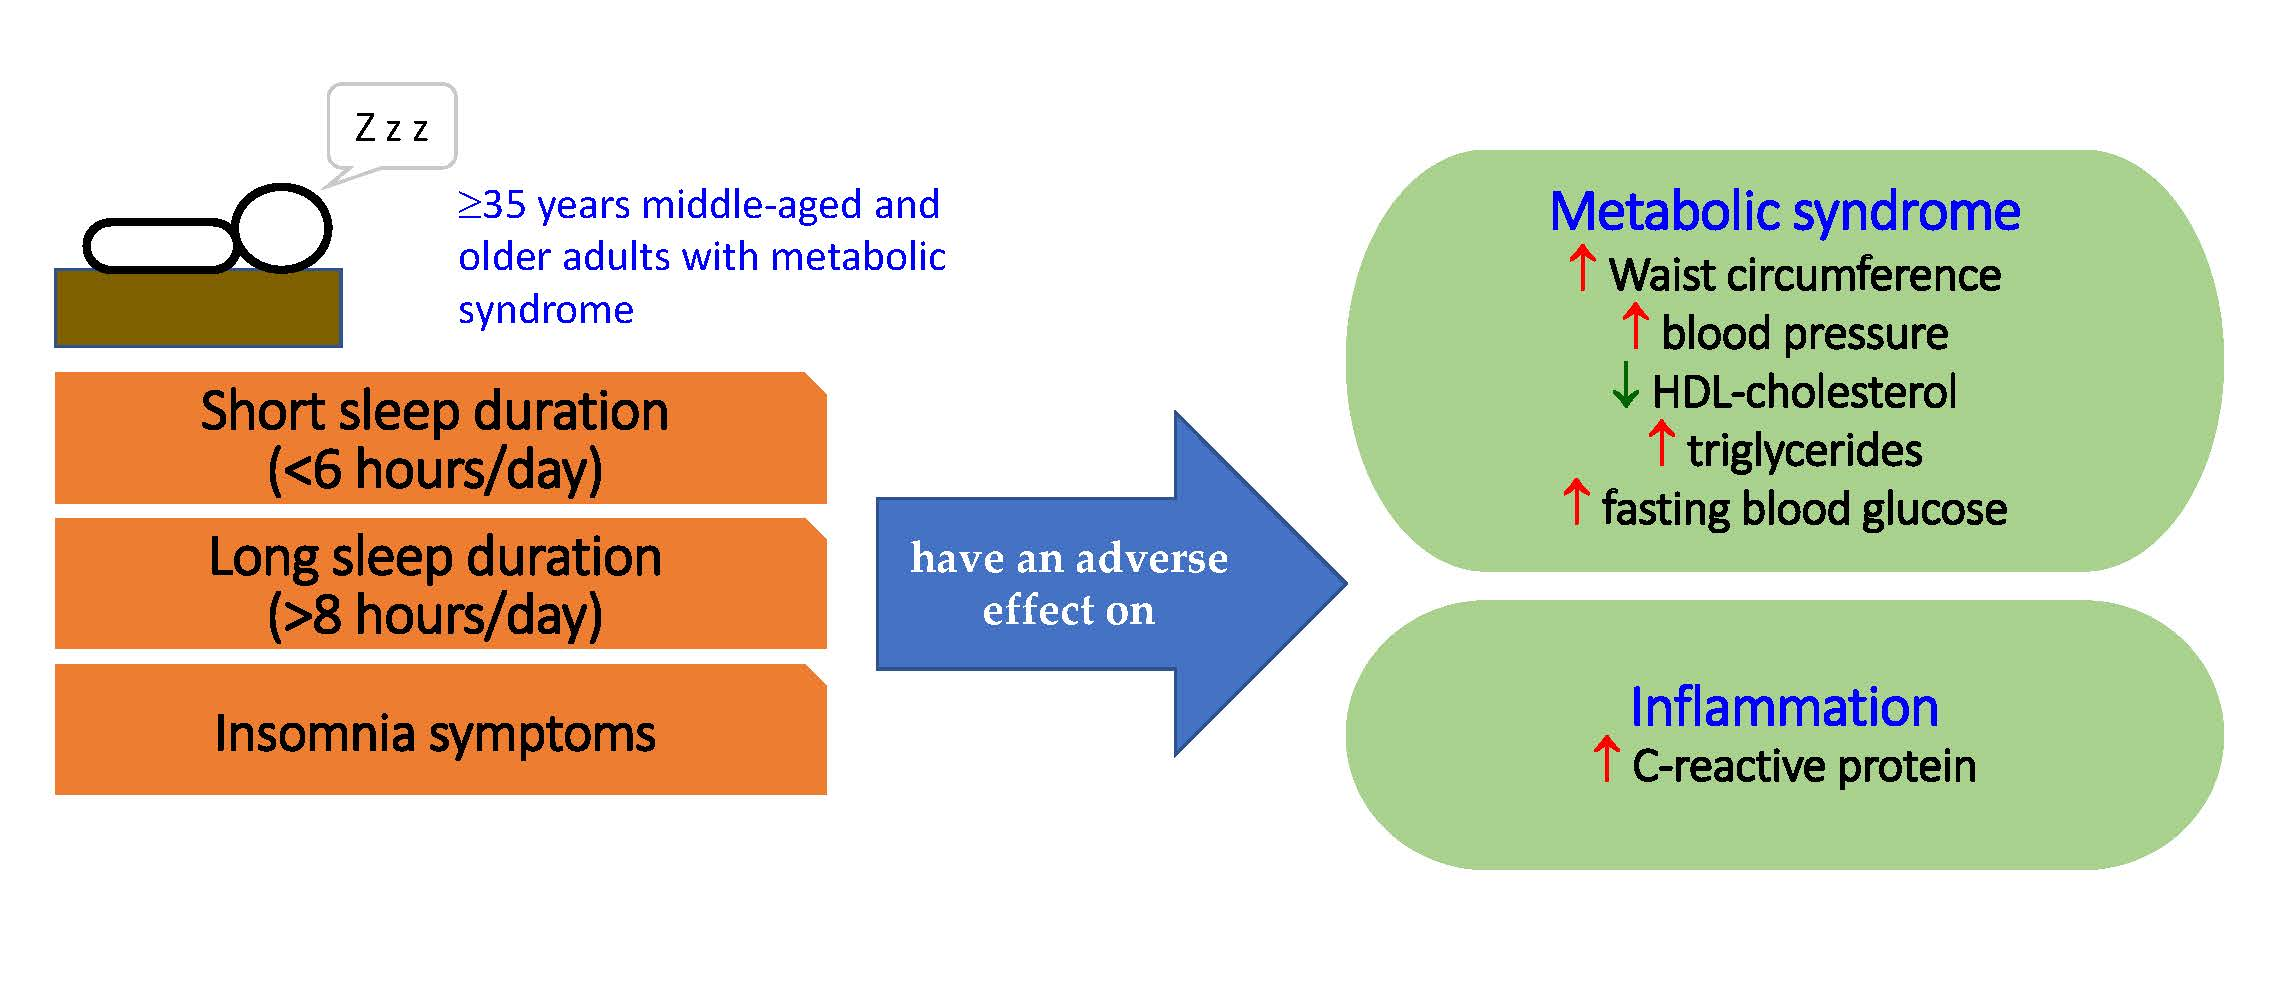
Association of Sleep Duration and Insomnia Symptoms with Components of Metabolic Syndrome and Inflammation in Middle-Aged and Older Adults with Metabolic Syndrome in Taiwan

 ,
, 


Abstract
1. Introduction
2. Materials and Methods
2.1. Data Source and Volunteers
2.2. Definitions of Metabolic Syndrome and Inflammation
2.3. Data Collection
2.4. Covariates
2.5. Statistical Analysis
3. Results
4. Discussion
5. Conclusions
Supplementary Materials
Author Contributions
Funding
Conflicts of Interest
References
- Alberti, K.G.M.; Zimmet, P.; Shaw, J. The metabolic syndrome-a new worldwide definition. Lancet 2005, 366, 1059–1062. [Google Scholar] [CrossRef]
- Wilson, P.W.; D’Agostino, R.B.; Parise, H.; Sullivan, L.; Meigs, J.B. Metabolic syndrome as a precursor of cardiovascular disease and type 2 diabetes mellitus. Circulation 2005, 112, 3066–3072. [Google Scholar] [CrossRef] [PubMed]
- Gami, A.S.; Witt, B.J.; Howard, D.E.; Erwin, P.J.; Gami, L.A.; Somers, V.K.; Montori, V.M. Metabolic syndrome and risk of incident cardiovascular events and death: A systematic review and meta-analysis of longitudinal studies. J. Am. Coll. Cardiol. 2007, 49, 403–414. [Google Scholar] [CrossRef] [PubMed]
- Ridker, P.M.; Buring, J.E.; Cook, N.R.; Rifai, N. C-reactive protein, the metabolic syndrome, and risk of incident cardiovascular events: An 8-year follow-up of 14719 initially healthy American women. Circulation 2003, 107, 391–397. [Google Scholar] [CrossRef] [PubMed]
- Gundogan, K.; Bayram, F.; Capak, M.; Tanriverdi, F.; Karaman, A.; Ozturk, A.; Altunbas, H.; Gokce, C.; Kalkan, A.; Yazici, C. Prevalence of metabolic syndrome in the Mediterranean region of Turkey: Evaluation of hypertension, diabetes mellitus, obesity and dyslipidemia. Metab. Syndr. Relat. Disord. 2009, 7, 427–434. [Google Scholar] [CrossRef] [PubMed]
- Puenpatom, R.A.; Victor, T.W. Increased prevalence of metabolic syndrome in individuals with osteoarthritis: An analysis of NHANES III data. Postgrad. Med. 2009, 121, 9–20. [Google Scholar] [CrossRef] [PubMed]
- Beltran-Sanchez, H.; Harhay, M.O.; Harhay, M.M.; McElligott, S. Prevalence and trends of metabolic syndrome in the adult U.S. population, 1999-2010. J. Am. Coll. Cardiol. 2013, 62, 697–703. [Google Scholar] [CrossRef] [PubMed]
- Scuteri, A.; Laurent, S.; Cucca, F.; Cockcroft, J.; Cunha, P.G.; Manas, L.R.; Mattace Raso, F.U.; Muiesan, M.L.; Ryliskyte, L.; Rietzschel, E.; et al. Metabolic syndrome across Europe: Different clusters of risk factors. Eur. J. Prev. Cardiol. 2015, 22, 486–491. [Google Scholar] [CrossRef] [PubMed]
- Lim, K.G.; Cheah, W.K. A review of metabolic syndrome research in Malaysia. Med. J. Malaysia 2016, 71, 20–28. [Google Scholar]
- Yeh, C.J.; Chang, H.Y.; Pan, W.H. Time trend of obesity, the metabolic syndrome and related dietary pattern in Taiwan: From NAHSIT 1993-1996 to NAHSIT 2005-2008. Asia Pac. J. Clin. Nutr. 2011, 20, 292–300. [Google Scholar]
- Hwang, L.C.; Bai, C.H.; Chen, C.J. Prevalence of obesity and metabolic syndrome in Taiwan. J. Formos. Med. Assoc. 2006, 105, 626–635. [Google Scholar] [CrossRef]
- Covassin, N.; Singh, P. Sleep duration and cardiovascular disease risk: Epidemiologic and experimental evidence. Sleep Med. Clin. 2016, 11, 81–89. [Google Scholar] [CrossRef] [PubMed]
- Taheri, S.; Lin, L.; Austin, D.; Young, T.; Mignot, E. Short sleep duration is associated with reduced leptin, elevated ghrelin, and increased body mass index. PLoS Med. 2004, 1, e62. [Google Scholar] [CrossRef] [PubMed]
- Gottlieb, D.J.; Redline, S.; Nieto, F.J.; Baldwin, C.M.; Newman, A.B.; Resnick, H.E.; Punjabi, N.M. Association of usual sleep duration with hypertension: The Sleep Heart Health Study. Sleep 2006, 29, 1009–1014. [Google Scholar] [CrossRef] [PubMed]
- Gottlieb, D.J.; Punjabi, N.M.; Newman, A.B.; Resnick, H.E.; Redline, S.; Baldwin, C.M.; Nieto, F.J. Association of sleep time with diabetes mellitus and impaired glucose tolerance. Arch. Intern. Med. 2005, 165, 863–867. [Google Scholar] [CrossRef]
- Patel, S.R.; Ayas, N.T.; Malhotra, M.R.; White, D.P.; Schernhammer, E.S.; Speizer, F.E.; Stampfer, M.J.; Hu, F.B. A prospective study of sleep duration and mortality risk in women. Sleep 2004, 27, 440–444. [Google Scholar] [CrossRef] [PubMed]
- Choi, K.M.; Lee, J.S.; Park, H.S.; Baik, S.H.; Choi, D.S.; Kim, S.M. Relationship between sleep duration and the metabolic syndrome: Korean National Health and Nutrition Survey 2001. Int. J. Obes. (Lond.) 2008, 32, 1091–1097. [Google Scholar] [CrossRef] [PubMed]
- Hall, M.H.; Muldoon, M.F.; Jennings, J.R.; Buysse, D.J.; Flory, J.D.; Manuck, S.B. Self-reported sleep duration is associated with the metabolic syndrome in midlife adults. Sleep 2008, 31, 635–643. [Google Scholar] [CrossRef]
- Katano, S.; Nakamura, Y.; Nakamura, A.; Murakami, Y.; Tanaka, T.; Takebayashi, T.; Okayama, A.; Miura, K.; Okamura, T.; Ueshima, H. Relationship between sleep duration and clustering of metabolic syndrome diagnostic components. Diabetes Metab. Syndr. Obes. 2011, 4, 119–125. [Google Scholar] [CrossRef]
- Kobayashi, D.; Takahashi, O.; Deshpande, G.A.; Shimbo, T.; Fukui, T. Relation between metabolic syndrome and sleep duration in Japan: A large scale cross-sectional study. Intern. Med. 2011, 50, 103–107. [Google Scholar] [CrossRef]
- Arora, T.; Jiang, C.Q.; Thomas, G.N.; Lam, K.B.; Zhang, W.S.; Cheng, K.K.; Lam, T.H.; Taheri, S. Self-reported long total sleep duration is associated with metabolic syndrome: The Guangzhou Biobank Cohort Study. Diabetes Care 2011, 34, 2317–2319. [Google Scholar] [CrossRef] [PubMed]
- Santos, A.C.; Ebrahim, S.; Barros, H. Alcohol intake, smoking, sleeping hours, physical activity and the metabolic syndrome. Prev. Med. 2007, 44, 328–334. [Google Scholar] [CrossRef] [PubMed]
- Fukuoka, R.; Kohno, T.; Kohsaka, S.; Yanagisawa, R.; Kawakami, T.; Hayashida, K.; Kanazawa, H.; Yuasa, S.; Maekawa, Y.; Sano, M.; et al. Nocturnal intermittent hypoxia and short sleep duration are independently associated with elevated C-reactive protein levels in patients with coronary artery disease. Sleep Med. 2017, 29, 29–34. [Google Scholar] [CrossRef] [PubMed]
- Williams, C.J.; Hu, F.B.; Patel, S.R.; Mantzoros, C.S. Sleep duration and snoring in relation to biomarkers of cardiovascular disease risk among women with type 2 diabetes. Diabetes Care 2007, 30, 1233–1240. [Google Scholar] [CrossRef] [PubMed]
- Vgontzas, A.N.; Fernandez-Mendoza, J. Insomnia with short sleep duration: Nosological, diagnostic and treatment implications. Sleep Med. Clin. 2013, 8, 309–322. [Google Scholar] [CrossRef] [PubMed]
- Chen, L.J.; Lai, Y.J.; Sun, W.J.; Fox, K.R.; Chu, D.; Ku, P.W. Associations of exercise, sedentary time and insomnia with metabolic syndrome in Taiwanese older adults: A 1-year follow-up study. Endocr. Res. 2015, 40, 220–226. [Google Scholar] [CrossRef]
- Lin, S.C.; Sun, C.A.; You, S.L.; Hwang, L.C.; Liang, C.Y.; Yang, T.; Bai, C.H.; Chen, C.H.; Wei, C.Y.; Chou, Y.C. The link of self-reported insomnia symptoms and sleep duration with metabolic syndrome: A Chinese population-based study. Sleep 2016, 39, 1261–1266. [Google Scholar] [CrossRef]
- Troxel, W.M.; Buysse, D.J.; Matthews, K.A.; Kip, K.E.; Strollo, P.J.; Hall, M.; Drumheller, O.; Reis, S.E. Sleep symptoms predict the development of the metabolic syndrome. Sleep 2010, 33, 1633–1640. [Google Scholar] [CrossRef]
- Chedraui, P.; San Miguel, G.; Villacreses, D.; Dominguez, A.; Jaramillo, W.; Escobar, G.S.; Pérez-López, F.R.; Genazzani, A.R.; Simoncini, T. Assessment of insomnia and related risk factors in postmenopausal women screened for the metabolic syndrome. Maturitas 2013, 74, 154–159. [Google Scholar] [CrossRef]
- Wen, C.P.; Wai, J.P.; Tsai, M.K.; Yang, Y.C.; Cheng, T.Y.; Lee, M.C.; Chan, H.T.; Tsao, C.K.; Tsai, S.P.; Wu, X. Minimum amount of physical activity for reduced mortality and extended life expectancy: A prospective cohort study. Lancet 2011, 378, 1244–1253. [Google Scholar] [CrossRef]
- Lao, X.Q.; Deng, H.B.; Liu, X.; Chan, T.C.; Zhang, Z.; Chang, L.Y.; Yeoh, E.K.; Tam, T.; Wong, M.C.S.; Thomas, G.N. Increased leisure-time physical activity associated with lower onset of diabetes in 44828 adults with impaired fasting glucose: A population-based prospective cohort study. Br. J. Sports Med. 2019, 53, 895–900. [Google Scholar] [CrossRef] [PubMed]
- Wen, C.P.; Cheng, T.Y.D.; Tsai, M.K.; Chang, Y.C.; Chan, H.T.; Tsai, S.P.; Chiang, P.H.; Hsu, C.C.; Sung, P.K.; Hsu, Y.H.; et al. All-cause mortality attributable to chronic kidney disease: A prospective cohort study based on 462293 adults in Taiwan. Lancet 2008, 371, 2173–2182. [Google Scholar] [CrossRef]
- Pearson, T.A.; Mensah, G.A.; Alexander, R.W.; Anderson, J.L.; Cannon, R.O., 3rd; Criqui, M.; Fadl, Y.Y.; Fortmann, S.P.; Hong, Y.; Myers, G.L.; et al. Markers of inflammation and cardiovascular disease: Application to clinical and public health practice: A statement for healthcare professionals from the centers for disease control and prevention and the American Heart Association. Circulation 2003, 107, 499–511. [Google Scholar] [CrossRef] [PubMed]
- Deng, H.B.; Tam, T.; Zee, B.C.; Chung, R.Y.; Su, X.; Jin, L.; Chan, T.C.; Chang, L.Y.; Yeoh, E.K.; Lao, X.Q. Short sleep duration increases metabolic impact in healthy adults: A population-based cohort study. Sleep 2017, 40. [Google Scholar] [CrossRef] [PubMed]
- American Psychiatric Association; DSM-5 Task Force. Diagnostic and Statistical Manual of Mental Disorders (DSM-5), 5th ed.; American Psychiatric Publishing, Inc.: Arlington, VA, USA, 2013. [Google Scholar]
- Syauqy, A.; Hsu, C.Y.; Rau, H.H.; Chao, J.C.J. Association of dietary patterns with components of metabolic syndrome and inflammation among middle-aged and older adults with metabolic syndrome in Taiwan. Nutrients 2018, 10, 143. [Google Scholar] [CrossRef] [PubMed]
- Syauqy, A.; Hsu, C.Y.; Rau, H.H.; Chao, J.C.J. Association of dietary patterns, anthropometric measurements and metabolic parameters with C-reactive protein and neutrophil-to-lymphocyte ratio in middle-aged and older adults with metabolic syndrome in Taiwan: A cross-sectional study. Nutr. J. 2018, 17, 106. [Google Scholar] [CrossRef] [PubMed]
- Lin, C.L.; Lin, C.P.; Chen, S.W.; Wu, H.C.; Tsai, Y.H. The association between sleep duration and overweight or obesity in Taiwanese adults: A cross-sectional study. Obes. Res. Clin. Pract. 2018, 12, 384–388. [Google Scholar] [CrossRef]
- Lin, P.M.D.; Chang, K.T.; Lin, Y.A.; Tzeng, I.S.; Chuang, H.H.; Chen, J.Y. Association between self-reported sleep duration and serum lipid profile in a middle-aged and elderly population in Taiwan: A community-based, cross-sectional study. BMJ Open 2017, 7, e015964. [Google Scholar] [CrossRef]
- Yaggi, H.K.; Araujo, A.B.; McKinlay, J.B. Sleep duration as a risk factor for the development of type 2 diabetes. Diabetes Care 2006, 29, 657–661. [Google Scholar] [CrossRef]
- Ju, S.Y.; Choi, W.S. Sleep duration and metabolic syndrome in adult populations: A meta-analysis of observational studies. Nutr. Diabetes 2013, 3, e65. [Google Scholar] [CrossRef]
- Spiegel, K.; Tasali, E.; Penev, P.; Van Cauter, E. Brief communication: Sleep curtailment in healthy young men is associated with decreased leptin levels, elevated ghrelin levels and increased hunger and appetite. Ann. Intern. Med. 2004, 141, 846–850. [Google Scholar] [CrossRef]
- Vgontzas, A.N.; Zoumakis, E.; Bixler, E.O.; Lin, H.M.; Follett, H.; Kales, A.; Chrousos, G.P. Adverse effects of modest sleep restriction on sleepiness, performance, and inflammatory cytokines. J. Clin. Endocrinol. Metab. 2004, 89, 2119–2126. [Google Scholar] [CrossRef]
- Spiegel, K.; Leproult, R.; Van Cauter, E. Impact of sleep debt on metabolic and endocrine function. Lancet 1999, 354, 1435–1439. [Google Scholar] [CrossRef]
- Buckley, T.M.; Schatzberg, A.F. On the interactions of the hypothalamic-pituitary-adrenal (HPA) axis and sleep: Normal HPA axis activity and circadian rhythm, exemplary sleep disorders. J. Clin. Endocrinol. Metab. 2005, 90, 3106–3114. [Google Scholar] [CrossRef] [PubMed]
- de Rooij, S.R.; Nijpels, G.; Nilsson, P.M.; Nolan, J.J.; Gabriel, R.; Bobbioni-Harsch, E.; Mingrone, G.; Dekker, J.M. Low-grade chronic inflammation in the relationship between insulin sensitivity and cardiovascular disease (RISC) population: Associations with insulin resistance and cardiometabolic risk profile. Diabetes Care 2009, 32, 1295–1301. [Google Scholar] [CrossRef] [PubMed]
- Meier-Ewert, H.K.; Ridker, P.M.; Rifai, N.; Regan, M.M.; Price, N.J.; Dinges, D.F.; Mullington, J.M. Effect of sleep loss on C-reactive protein, an inflammatory marker of cardiovascular risk. J. Am. Coll. Cardiol. 2004, 43, 678–683. [Google Scholar] [CrossRef]
- Stranges, S.; Dorn, J.M.; Shipley, M.J.; Kandala, N.B.; Trevisan, M.; Miller, M.A.; Donahue, R.P.; Hovey, K.M.; Ferrie, J.E.; Marmot, M.G.; et al. Correlates of short and long sleep duration: A cross-cultural comparison between the United Kingdom and the United States: The Whitehall II Study and the Western New York Health Study. Am. J. Epidemiol. 2008, 168, 1353–1364. [Google Scholar] [CrossRef]
- Pan, A.; Keum, N.; Okereke, O.I.; Sun, Q.; Kivimaki, M.; Rubin, R.R.; Hu, F.B. Bidirectional association between depression and metabolic syndrome: A systematic review and meta-analysis of epidemiological studies. Diabetes Care 2012, 35, 1171–1180. [Google Scholar] [CrossRef]
- Ikeda, M.; Kaneita, Y.; Uchiyama, M.; Mishima, K.; Uchimura, N.; Nakaji, S.; Akashiba, T.; Itani, O.; Aono, H.; Ohida, T. Epidemiological study of the associations between sleep complaints and metabolic syndrome in Japan. Sleep Biol. Rhythms. 2014, 12, 269–278. [Google Scholar] [CrossRef]
- Vgontzas, A.N.; Chrousos, G.P. Sleep, the hypothalamic-pituitary-adrenal axis, and cytokines: Multiple interactions and disturbances in sleep disorders. Endocrinol. Metab. Clin. N. Am. 2002, 31, 15–36. [Google Scholar] [CrossRef]
- Irwin, M.R.; Wang, M.; Ribeiro, D.; Cho, H.J.; Olmstead, R.; Breen, E.C.; Martinez-Maza, O.; Cole, S. Sleep loss activates cellular inflammatory signaling. Biol. Psychiatry 2008, 64, 538–540. [Google Scholar] [CrossRef] [PubMed]
- Cagampang, F.R.; Poore, K.R.; Hanson, M.A. Developmental origins of the metabolic syndrome: Body clocks and stress responses. Brain Behav. Immun. 2011, 25, 214–220. [Google Scholar] [CrossRef] [PubMed]
- Buxton, O.M.; Pavlova, M.; Reid, E.W.; Wang, W.; Simonson, D.C.; Adler, G.K. Sleep restriction for 1 week reduces insulin sensitivity in healthy men. Diabetes 2010, 59, 2126–2133. [Google Scholar] [CrossRef] [PubMed]
- Stamatakis, K.A.; Punjabi, N.M. Effects of sleep fragmentation on glucose metabolism in normal subjects. Chest 2010, 137, 95–101. [Google Scholar] [CrossRef] [PubMed]
- Cornier, M.A.; Dabelea, D.; Hernandez, T.L.; Lindstrom, R.C.; Steig, A.J.; Stob, N.R.; Van Pelt, R.E.; Wang, H.; Eckel, R.H. The metabolic syndrome. Endocr. Rev. 2008, 29, 777–822. [Google Scholar] [CrossRef] [PubMed]
- Wang, Y.; Jiang, T.; Wang, X.; Zhao, J.; Kang, J.; Chen, M.; Wang, H.; Niu, L.; Wang, Y.; Zhou, Y.; et al. Association between insomnia and metabolic syndrome in a Chinese Han population: A cross-sectional study. Sci. Rep. 2017, 7, 10893. [Google Scholar] [CrossRef] [PubMed]
- Lauderdale, D.S.; Knutson, K.L.; Yan, L.L.; Liu, K.; Rathouz, P.J. Self-reported and measured sleep duration: How similar are they? Epidemiology 2008, 19, 838–845. [Google Scholar] [CrossRef] [PubMed]
- Silva, G.E.; Goodwin, J.L.; Sherrill, D.L.; Arnold, J.L.; Bootzin, R.R.; Smith, T.; Walsleben, J.A.; Baldwin, C.M.; Quan, S.F. Relationship between reported and measured sleep times: The Sleep Heart Health Study (SHHS). J. Clin. Sleep Med. 2007, 3, 622–630. [Google Scholar] [PubMed]
- Beneto, A.; Gomez-Siurana, E.; Rubio-Sanchez, P. Comorbidity between sleep apnea and insomnia. Sleep Med. Rev. 2009, 13, 287–293. [Google Scholar] [CrossRef]

| Variables | Sleep Duration (Hours/Day) | |||
|---|---|---|---|---|
| <6 (n = 6262) | 6–8 (n = 17,356) | >8 (n = 2398) | p-Value | |
| Sex | 0.045 | |||
| Men (%) | 64.6 | 64.8 | 66.8 | |
| Women (%) | 35.4 | 35.4 | 33.2 | |
| Age (years) | 53.7 ± 11.9 | 53.5 ± 11.8 | 53.4 ± 11.3 | 0.464 |
| Marital status | 0.000 | |||
| Not married | 3.7 | 3.1 | 2.6 | |
| Married | 83.2 | 84.5 | 87.4 | |
| Divorced | 13.1 | 12.4 | 9.9 | |
| Level of education | 0.005 | |||
| Low | 54.4 | 52.1 | 52.3 | |
| High | 45.6 | 47.9 | 47.7 | |
| Current drinking status | 0.000 | |||
| No | 95.4 | 96.0 | 91.5 | |
| Yes | 4.6 | 4.0 | 8.5 | |
| Current smoking status | 0.000 | |||
| No | 96.0 | 96.7 | 93.0 | |
| Yes | 4.0 | 3.3 | 7.0 | |
| Physical activity | 0.000 | |||
| Low | 48.4 | 46.2 | 41.8 | |
| Moderate | 45.5 | 47.8 | 52.2 | |
| High | 6.1 | 6.0 | 6.0 | |
| Insomnia symptoms | 0.000 | |||
| No | 50.6 | 38.6 | 78.7 | |
| Yes | 49.4 | 61.4 | 21.3 | |
| Body mass index (kg/m2) | 27.3 ± 2.6 | 26.6 ± 2.6 | 27.2 ±2.6 | 0.000 |
| Waist circumference (cm) | 89.9 ± 8.1 | 88.8 ± 8.7 | 89.3 ± 7.8 | 0.000 |
| Systolic BP (mmHg) | 124 ± 41 | 119 ± 36 | 121 ± 36 | 0.000 |
| Diastolic BP (mmHg) | 73 ± 21 | 71 ± 21 | 72 ± 23 | 0.001 |
| HDL-C (mmol/L) | 1.2 ± 0.4 | 1.3 ± 0.4 | 1.3 ± 0.3 | 0.001 |
| Triglycerides (mmol/L) | 2.0 ± 1.4 | 1.9 ± 1.3 | 2.0 ± 1.2 | 0.003 |
| FBG (mmol/L) | 6.9 ± 2.6 | 6.2 ± 1.7 | 6.3 ± 1.8 | 0.000 |
| CRP (nmol/L) | 31.9 ± 39.1 | 27.7 ± 33.0 | 29.7 ± 36.9 | 0.001 |
| Variables | Sleep Duration (Hours/Day) | |||
|---|---|---|---|---|
| <6 | 6–8 | >8 | p-Trend | |
| High waist circumference (men) | ||||
| Model 1 1 | 1.303 (1.061–1.600) | 1 | 1.040 (0.991–1.091) | 0.014 |
| Model 2 2 | 1.236 (1.005–1.520) | 1 | 1.019 (0.971–1.070) | 0.027 |
| Model 3 3 | 1.246 (0.979–1.513) | 1 | 1.030 (0.981–1.081) | 0.044 |
| High waist circumference (women) | ||||
| Model 1 1 | 1.434 (1.130–1.819) | 1 | 1.013 (0.961–1.068) | 0.012 |
| Model 2 2 | 1.444 (1.139–1.833) | 1 | 1.010 (0.958–1.065) | 0.009 |
| Model 3 3 | 1.410 (1.112–1.788) | 1 | 1.009 (0.957–1.065) | 0.015 |
| High systolic BP | ||||
| Model 1 1 | 1.228 (1.123–1.342) | 1 | 1.048 (0.986–1.114) | 0.000 |
| Model 2 2 | 1.233 (1.131–1.345) | 1 | 1.058 (0.997–1.123) | 0.000 |
| Model 3 3 | 1.242 (1.134–1.350) | 1 | 1.077 (1.017–1.077) | 0.000 |
| High diastolic BP | ||||
| Model 1 1 | 1.326 (1.076–1.578) | 1 | 1.011 (0.896–1.141) | 0.031 |
| Model 2 2 | 1.309 (1.019–1.599) | 1 | 1.008 (0.892–1.139) | 0.034 |
| Model 3 3 | 1.296 (0.993–1.596) | 1 | 1.001 (0.885–1.132) | 0.044 |
| Low HDL-C (men) | ||||
| Model 1 1 | 1.120 (0.949–1.321) | 1 | 1.089 (1.046–1.134) | 0.000 |
| Model 2 2 | 1.233 (1.042–1.458) | 1 | 1.073 (1.029–1.118) | 0.001 |
| Model 3 3 | 1.239 (1.047–1.465) | 1 | 1.076 (1.033–1.122) | 0.000 |
| Low HDL-C (women) | ||||
| Model 1 1 | 1.106 (1.057–1.156) | 1 | 1.005 (0.839–1.203) | 0.000 |
| Model 2 2 | 1.055 (1.005–1.104) | 1 | 1.026 (0.855–1.231) | 0.044 |
| Model 3 3 | 1.061 (1.013–1.111) | 1 | 1.035 (0.862–1.242) | 0.042 |
| High triglycerides | ||||
| Model 1 1 | 1.180 (1.047–1.129) | 1 | 1.096 (1.064–1.129) | 0.000 |
| Model 2 2 | 1.188 (1.052–1.341) | 1 | 1.044 (1.013–1.076) | 0.002 |
| Model 3 3 | 1.202 (1.065–1.358) | 1 | 1.048 (1.016–1.081) | 0.001 |
| High FBG | ||||
| Model 1 1 | 1.270 (1.105–1.459) | 1 | 1.044 (1.010–1.078) | 0.000 |
| Model 2 2 | 1.316 (1.146–1.511) | 1 | 1.041 (1.008–1.075) | 0.000 |
| Model 3 3 | 1.304 (1.136–1.498) | 1 | 1.038 (1.005–1.072) | 0.000 |
| High CRP | ||||
| Model 1 1 | 1.167 (1.027–1.325) | 1 | 1.027 (0.994–1.061) | 0.029 |
| Model 2 2 | 1.173 (1.033–1.331) | 1 | 1.029 (0.996–1.063) | 0.020 |
| Model 3 3 | 1.180 (1.039–1.339) | 1 | 1.029 (0.996–1.063) | 0.017 |
| Variables | Volunteers with Insomnia Symptoms | |
|---|---|---|
| OR (95% CI) | p-Trend | |
| High waist circumference (men) | ||
| Model 1 1 | 1.109 (1.051–1.169) | 0.000 |
| Model 2 2 | 1.081 (1.024–1.141) | 0.005 |
| Model 3 3 | 1.083 (1.025–1.144) | 0.005 |
| High waist circumference (women) | ||
| Model 1 1 | 1.130 (1.040–1.227) | 0.004 |
| Model 2 2 | 1.059 (1.005–1.115) | 0.031 |
| Model 3 3 | 1.077 (1.004–1.155) | 0.038 |
| High systolic BP | ||
| Model 1 1 | 1.066 (1.056–1.075) | 0.000 |
| Model 2 2 | 1.055 (1.003–1.109) | 0.036 |
| Model 3 3 | 1.050 (0.997–1.105) | 0.045 |
| High diastolic BP | ||
| Model 1 1 | 1.055 (1.029–1.081) | 0.000 |
| Model 2 2 | 1.038 (1.012–1.064) | 0.003 |
| Model 3 3 | 1.043 (1.022–1.065) | 0.000 |
| Low HDL-C (men) | ||
| Model 1 1 | 1.092 (1.052–1.132) | 0.000 |
| Model 2 2 | 1.045 (1.006–1.086) | 0.023 |
| Model 3 3 | 1.045 (1.005–1.085) | 0.025 |
| Low HDL-C (women) | ||
| Model 1 1 | 1.106 (1.066–1.147) | 0.000 |
| Model 2 2 | 1.050 (1.012–1.091) | 0.011 |
| Model 3 3 | 1.050 (1.011–1.090) | 0.012 |
| High triglycerides | ||
| Model 1 1 | 1.053 (1.006–1.102) | 0.039 |
| Model 2 2 | 1.057 (1.010–1.106) | 0.019 |
| Model 3 3 | 1.066 (1.048–1.084) | 0.000 |
| High FBG | ||
| Model 1 1 | 1.031 (1.003–1.060) | 0.029 |
| Model 2 2 | 1.035 (1.006–1.065) | 0.017 |
| Model 3 3 | 1.032 (1.003–1.062) | 0.030 |
| High CRP | ||
| Model 1 1 | 1.078 (1.048–1.108) | 0.000 |
| Model 2 2 | 1.007 (0.979–1.037) | 0.618 |
| Model 3 3 | 1.010 (0.981–1.040) | 0.497 |
| Variables | Volunteers without Insomnia Symptoms | Volunteers with Insomnia Symptoms | ||||||
|---|---|---|---|---|---|---|---|---|
| Sleep Duration (Hours/Day) | Sleep Duration (Hours/Day) | |||||||
| <6 | 6–8 | >8 | p-Trend | <6 | 6–8 | >8 | p-Trend | |
| High waist circumference (men) | ||||||||
| Model 1 1 | 1.212 (0.858–1.568) | 1 | 1.050 (0.973–1.127) | 0.043 | 1.375 (1.041–1.817) | 1 | 1.055 (0.982–1.134) | 0.032 |
| Model 2 2 | 1.182 (0.869–1.608) | 1 | 1.031 (0.966–1.101) | 0.397 | 1.322 (0.999–1.751) | 1 | 1.035 (0.962–1.113) | 0.106 |
| High waist circumference (women) | ||||||||
| Model 1 1 | 1.753 (1.234–2.490) | 1 | 1.042 (0.949–1.144) | 0.006 | 1.440 (1.056–1.964) | 1 | 1.133 (1.063–1.208) | 0.000 |
| Model 2 2 | 1.512 (1.057–2.161) | 1 | 1.004 (0.912–1.105) | 0.077 | 1.350 (0.987–1.847) | 1 | 1.007 (0.943–1.076) | 0.171 |
| High systolic BP | ||||||||
| Model 1 1 | 1.423 (1.157–1.742) | 1 | 1.111 (1.029–1.199) | 0.000 | 1.634 (1.367–1.954) | 1 | 1.096 (1.014–1.184) | 0.000 |
| Model 2 2 | 1.439 (1.167–1.770) | 1 | 1.085 (1.003–1.173) | 0.000 | 1.650 (1.375–1.981) | 1 | 1.070 (0.988–1.158) | 0.000 |
| High diastolic BP | ||||||||
| Model 1 1 | 1.203 (1.071–1.352) | 1 | 1.065 (0.956–1.187) | 0.007 | 1.160 (1.082–1.244) | 1 | 1.102 (1.034–1.174) | 0.000 |
| Model 2 2 | 1.197 (1.065–1.346) | 1 | 1.063 (0.953–1.185) | 0.009 | 1.153 (1.075–1.236) | 1 | 1.102 (1.034–1.175) | 0.000 |
| Low HDL-C (men) | ||||||||
| Model 1 1 | 1.242 (0.858–1.627) | 1 | 1.066 (0.989–1.143) | 0.035 | 1.387 (1.075–1.790) | 1 | 1.006 (0.963–1.052) | 0.042 |
| Model 2 2 | 1.243 (0.931–1.658) | 1 | 1.006 (0.968–1.046) | 0.218 | 1.360 (1.054–1.756) | 1 | 1.005 (0.962–1.051) | 0.061 |
| Low HDL-C (women) | ||||||||
| Model 1 1 | 1.078 (1.021–1.139) | 1 | 1.033 (0.808–1.320) | 0.025 | 1.183 (1.090–1.284) | 1 | 1.013 (0.775–1.325) | 0.000 |
| Model 2 2 | 1.020 (0.965–1.079) | 1 | 1.011 (0.789–1.295) | 0.779 | 1.142 (1.085–1.199) | 1 | 1.067 (0.842–1.292) | 0.807 |
| High triglycerides | ||||||||
| Model 1 1 | 1.256 (1.064–1.483) | 1 | 1.139 (1.086–1.195) | 0.000 | 1.105 (0.929–1.314) | 1 | 1.058 (1.019–1.100) | 0.012 |
| Model 2 2 | 1.364 (1.151–1.617) | 1 | 1.129 (1.075–1.186) | 0.000 | 1.110 (0.931–1.324) | 1 | 1.002 (0.963–1.043) | 0.008 |
| High FBG | ||||||||
| Model 1 1 | 1.322 (1.087–1.607) | 1 | 1.004 (0.966–1.043) | 0.000 | 1.509 (1.247–1.826) | 1 | 1.058 (1.005–1.112) | 0.000 |
| Model 2 2 | 1.321 (1.083–1.611) | 1 | 1.016 (0.975–1.060) | 0.021 | 1.296 (1.067–1.574) | 1 | 1.064 (1.011–1.121) | 0.006 |
| High CRP | ||||||||
| Model 1 1 | 1.371 (1.152–1.632) | 1 | 1.044 (0.991–1.100) | 0.001 | 1.290 (1.082–1.538) | 1 | 1.063 (1.009–1.121) | 0.005 |
| Model 2 2 | 1.267 (1.062–1.512) | 1 | 1.074 (1.019–1.133) | 0.004 | 1.217 (1.012–1.462) | 1 | 1.056 (1.001–1.115) | 0.006 |
© 2019 by the authors. Licensee MDPI, Basel, Switzerland. This article is an open access article distributed under the terms and conditions of the Creative Commons Attribution (CC BY) license (http://creativecommons.org/licenses/by/4.0/).
Share and Cite
Syauqy, A.; Hsu, C.-Y.; Rau, H.-H.; Kurniawan, A.L.; Chao, J.C.-J. Association of Sleep Duration and Insomnia Symptoms with Components of Metabolic Syndrome and Inflammation in Middle-Aged and Older Adults with Metabolic Syndrome in Taiwan. Nutrients 2019, 11, 1848. https://doi.org/10.3390/nu11081848
Syauqy A, Hsu C-Y, Rau H-H, Kurniawan AL, Chao JC-J. Association of Sleep Duration and Insomnia Symptoms with Components of Metabolic Syndrome and Inflammation in Middle-Aged and Older Adults with Metabolic Syndrome in Taiwan. Nutrients. 2019; 11(8):1848. https://doi.org/10.3390/nu11081848
Chicago/Turabian StyleSyauqy, Ahmad, Chien-Yeh Hsu, Hsiao-Hsien Rau, Adi Lukas Kurniawan, and Jane C-J Chao. 2019. "Association of Sleep Duration and Insomnia Symptoms with Components of Metabolic Syndrome and Inflammation in Middle-Aged and Older Adults with Metabolic Syndrome in Taiwan" Nutrients 11, no. 8: 1848. https://doi.org/10.3390/nu11081848
APA StyleSyauqy, A., Hsu, C.-Y., Rau, H.-H., Kurniawan, A. L., & Chao, J. C.-J. (2019). Association of Sleep Duration and Insomnia Symptoms with Components of Metabolic Syndrome and Inflammation in Middle-Aged and Older Adults with Metabolic Syndrome in Taiwan. Nutrients, 11(8), 1848. https://doi.org/10.3390/nu11081848