Dietary Fructose and the Metabolic Syndrome


Abstract
1. Introduction
2. Metabolic Effects of Fructose Consumption
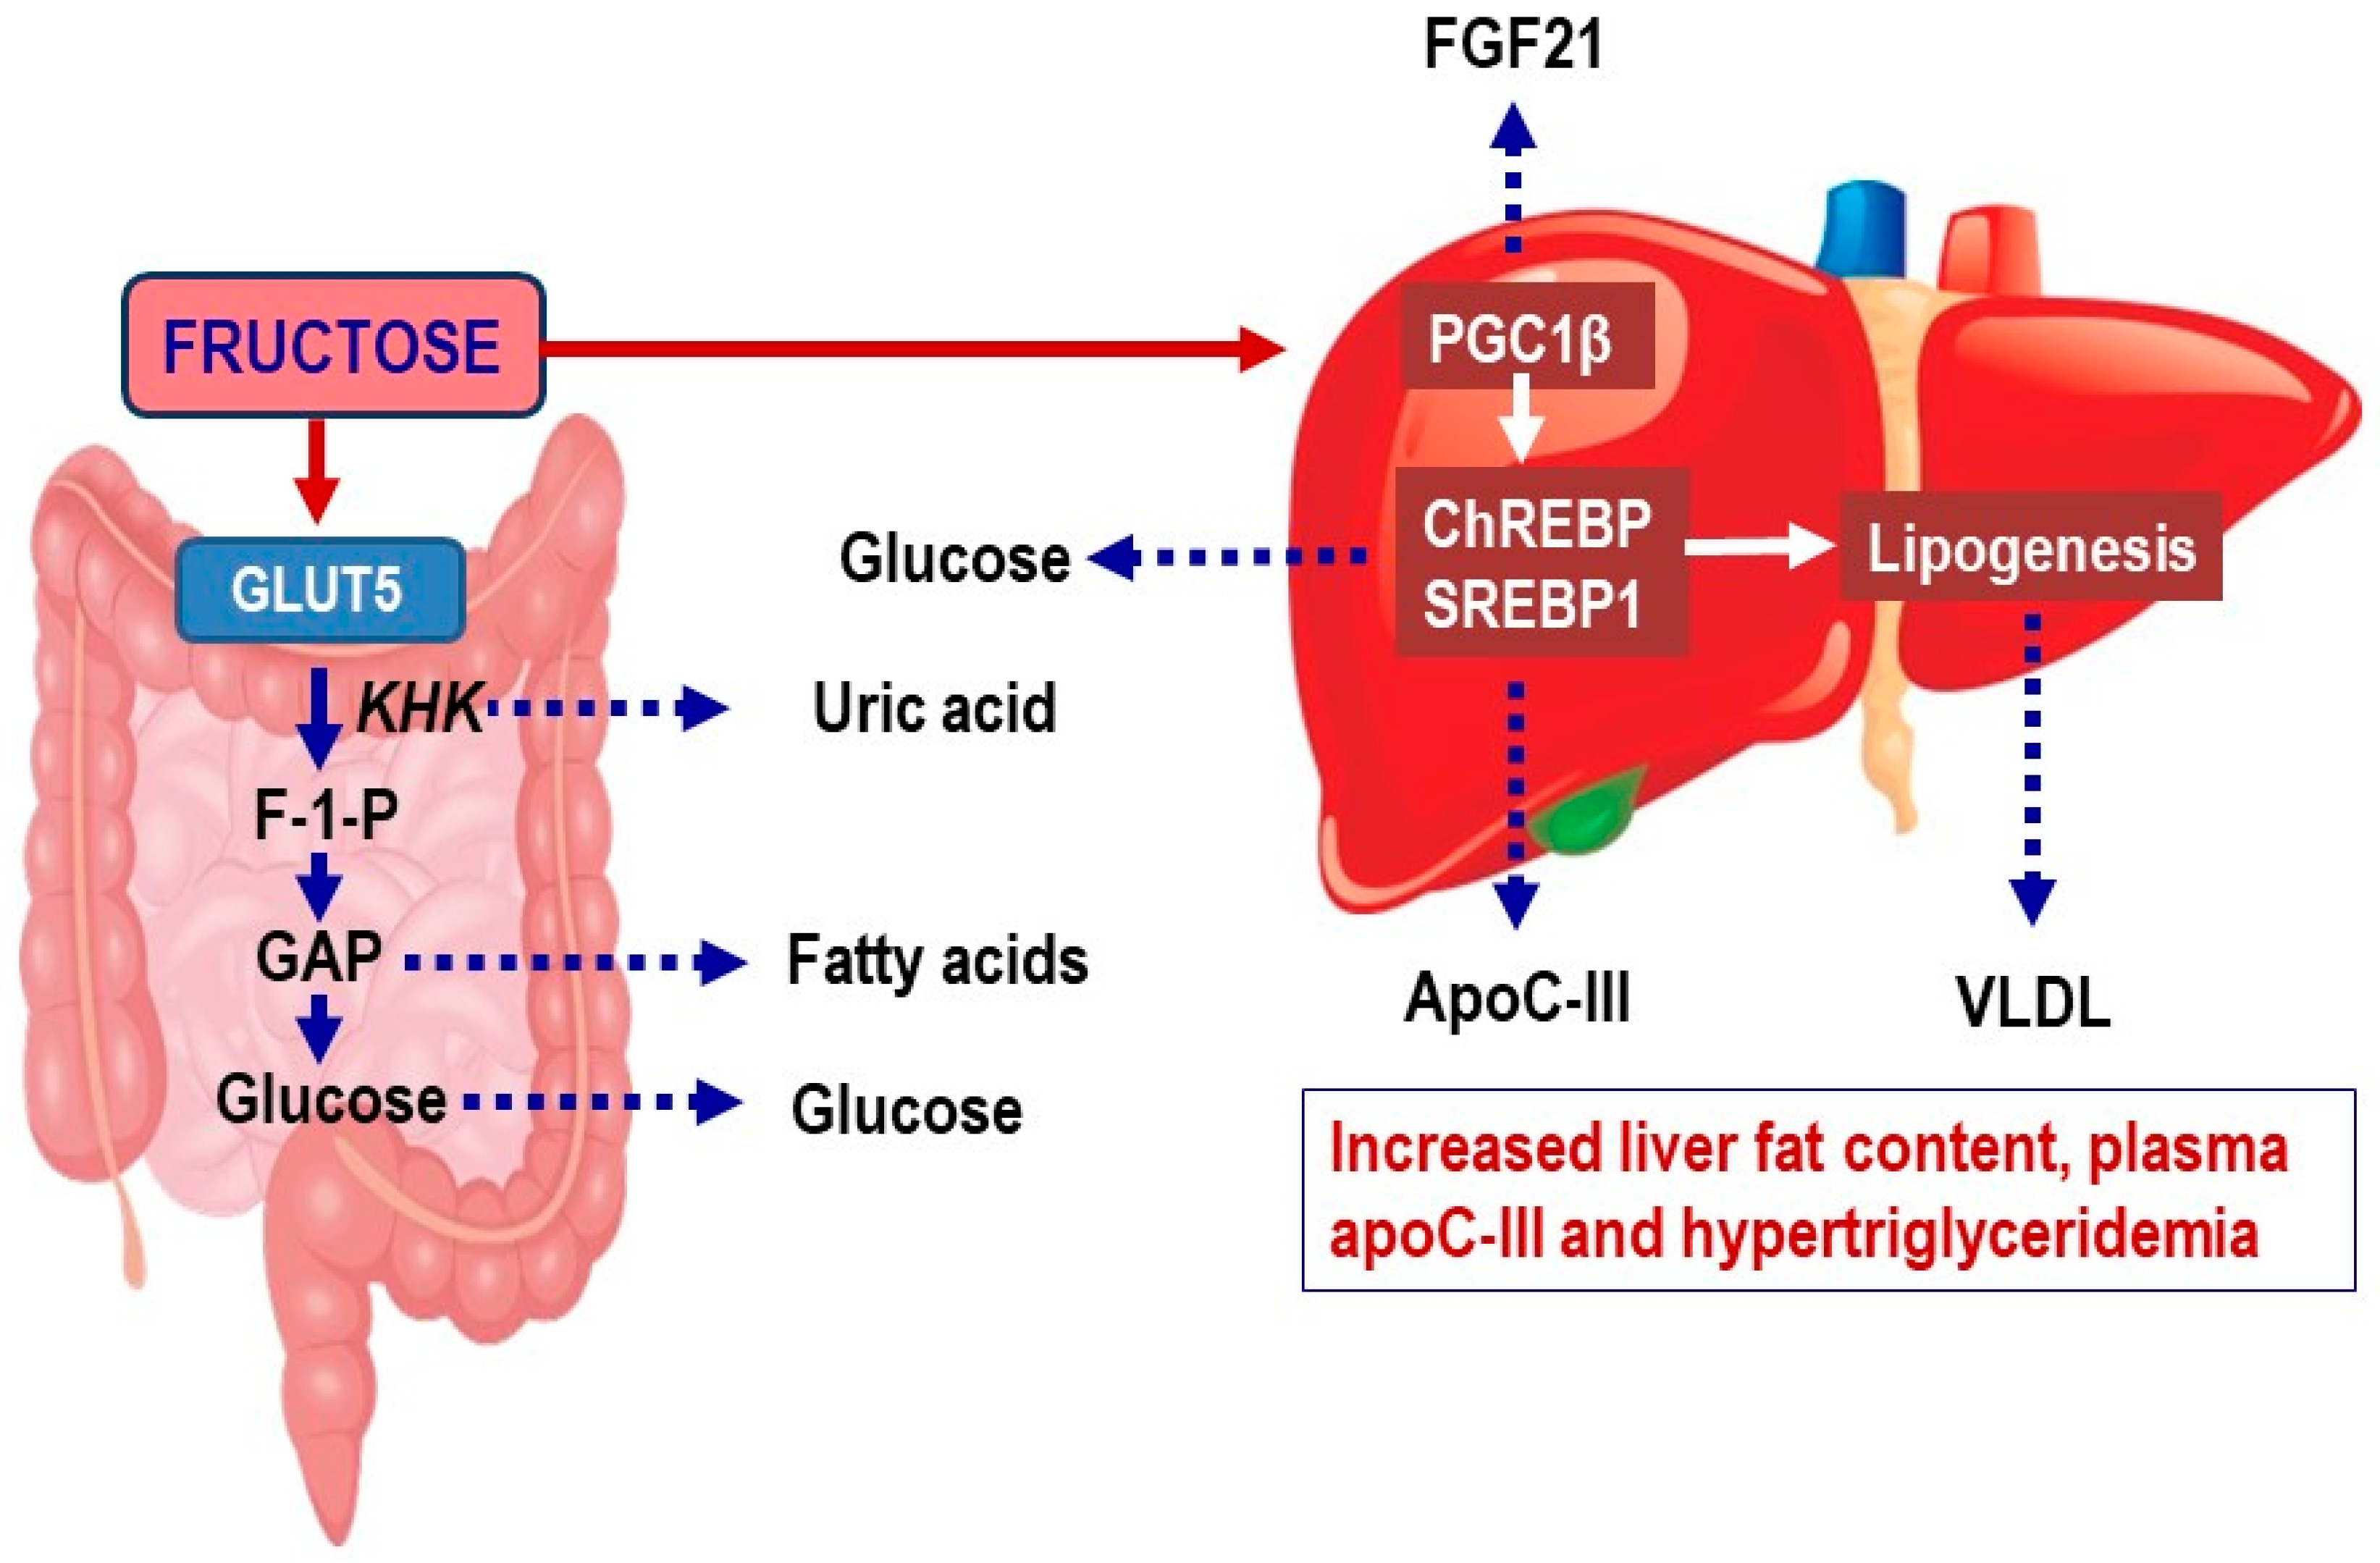
2.1. Fructose Metabolism in Enterocytes
2.2. Fructose Metabolism in the Liver
2.3. Evidence Linking Fructose Intake to Non-Alcoholic Fatty Liver Disease (NAFLD) and to Increased Cardiometabolic Risk
2.4. Effects of Fructose on Hepatic De Novo Lipogenesis
2.5. Clinical Evidence That Fructose Consumption Is Leading to Non-Alcoholic Fatty Liver Disease (NAFLD)
2.6. Effects of Fructose on Uric Acid Metabolism and MG (Methyl Glyoxal) Pathways
2.7. Consequences of Increased Lipid Synthesis to Very Low-Density Lipoproteins (VLDL) Metabolism and Release—Effects on Plasma Lipids, Lipoproteins, and Apolipoproteins
2.8. Interactions between Fructose Consumption and Changes in Gut Microbiota
3. Conclusions
Funding
Conflicts of Interest
References
- GBD 2015 Obesity Collaborators; Afshin, A.; Forouzanfar, M.H.; Reitsma, M.B.; Sur, P.; Estep, K.; Lee, A.; Marczak, L.; Mokdad, A.H.; Moradi-Lakeh, M.; et al. Health Effects of Overweight and Obesity in 195 Countries over 25 Years. N. Engl. J. Med. 2017, 377, 13–27. [Google Scholar] [CrossRef] [PubMed]
- Bluher, M. Obesity: Global epidemiology and pathogenesis. Nat. Rev. Endocrinol. 2019, 15, 288–298. [Google Scholar] [CrossRef] [PubMed]
- Malik, V.S.; Li, Y.; Pan, A.; De Koning, L.; Schernhammer, E.; Willett, W.C.; Hu, F.B. Long-Term Consumption of Sugar-Sweetened and Artificially Sweetened Beverages and Risk of Mortality in US Adults. Circulation 2019. [Google Scholar] [CrossRef] [PubMed]
- Younossi, Z.M. Non-alcoholic fatty liver disease—A global public health perspective. J. Hepatol. 2019, 70, 531–544. [Google Scholar] [CrossRef] [PubMed]
- Vos, M.B.; Abrams, S.H.; Barlow, S.E.; Caprio, S.; Daniels, S.R.; Kohli, R.; Mouzaki, M.; Sathya, P.; Schwimmer, J.B.; Sundaram, S.S.; et al. NASPGHAN Clinical Practice Guideline for the Diagnosis and Treatment of Nonalcoholic Fatty Liver Disease in Children: Recommendations from the Expert Committee on NAFLD (ECON) and the North American Society of Pediatric Gastroenterology, Hepatology and Nutrition (NASPGHAN). J. Pediatr. Gastroenterol. Nutr. 2017, 64, 319–334. [Google Scholar] [CrossRef] [PubMed]
- Younossi, Z.; Tacke, F.; Arrese, M.; Chander Sharma, B.; Mostafa, I.; Bugianesi, E.; Wai-Sun Wong, V.; Yilmaz, Y.; George, J.; Fan, J.; et al. Global Perspectives on Nonalcoholic Fatty Liver Disease and Nonalcoholic Steatohepatitis. Hepatology 2019, 69, 2672–2682. [Google Scholar] [CrossRef] [PubMed]
- Powell, E.S.; Smith-Taillie, L.P.; Popkin, B.M. Added Sugars Intake Across the Distribution of US Children and Adult Consumers: 1977–2012. J. Acad. Nutr. Diet. 2016, 116, 1543–1550. [Google Scholar] [CrossRef] [PubMed]
- Johnson, R.K.; Lichtenstein, A.H.; Anderson, C.A.M.; Carson, J.A.; Despres, J.P.; Hu, F.B.; Kris-Etherton, P.M.; Otten, J.J.; Towfighi, A.; Wylie-Rosett, J.; et al. Low-Calorie Sweetened Beverages and Cardiometabolic Health: A Science Advisory From the American Heart Association. Circulation 2018, 138, e126–e140. [Google Scholar] [CrossRef] [PubMed]
- Lim, S.; Taskinen, M.R.; Boren, J. Crosstalk between nonalcoholic fatty liver disease and cardiometabolic syndrome. Obes. Rev. 2019, 20, 599–611. [Google Scholar] [CrossRef]
- Santos, R.D.; Valenti, L.; Romeo, S. Does nonalcoholic fatty liver disease cause cardiovascular disease? Current knowledge and gaps. Atherosclerosis 2019, 282, 110–120. [Google Scholar] [CrossRef]
- Mirtschink, P.; Jang, C.; Arany, Z.; Krek, W. Fructose metabolism, cardiometabolic risk, and the epidemic of coronary artery disease. Eur. Heart J. 2018, 39, 2497–2505. [Google Scholar] [CrossRef] [PubMed]
- Stanhope, K.L.; Goran, M.I.; Bosy-Westphal, A.; King, J.C.; Schmidt, L.A.; Schwarz, J.M.; Stice, E.; Sylvetsky, A.C.; Turnbaugh, P.J.; Bray, G.A.; et al. Pathways and mechanisms linking dietary components to cardiometabolic disease: Thinking beyond calories. Obes. Rev. 2018, 19, 1205–1235. [Google Scholar] [CrossRef] [PubMed]
- Stahl, E.P.; Dhindsa, D.S.; Lee, S.K.; Sandesara, P.B.; Chalasani, N.P.; Sperling, L.S. Nonalcoholic Fatty Liver Disease and the Heart: JACC State-of-the-Art Review. J. Am. Coll. Cardiol. 2019, 73, 948–963. [Google Scholar] [CrossRef] [PubMed]
- Ferraris, R.P.; Choe, J.Y.; Patel, C.R. Intestinal Absorption of Fructose. Annu. Rev. Nutr. 2018, 38, 41–67. [Google Scholar] [CrossRef] [PubMed]
- Mortera, R.R.; Bains, Y.; Gugliucci, A. Fructose at the crossroads of the metabolic syndrome and obesity epidemics. Front. Biosci. (Landmark Ed.) 2019, 24, 186–211. [Google Scholar]
- Hannou, S.A.; Haslam, D.E.; McKeown, N.M.; Herman, M.A. Fructose metabolism and metabolic disease. J. Clin. Investig. 2018, 128, 545–555. [Google Scholar] [CrossRef]
- Hoffman, S.; Alvares, D.; Adeli, K. Intestinal lipogenesis: How carbs turn on triglyceride production in the gut. Curr. Opin. Clin. Nutr. Metab. Care 2019, 22, 284–288. [Google Scholar] [CrossRef]
- Patel, C.; Douard, V.; Yu, S.; Gao, N.; Ferraris, R.P. Transport, metabolism, and endosomal trafficking-dependent regulation of intestinal fructose absorption. FASEB J. 2015, 29, 4046–4058. [Google Scholar] [CrossRef]
- Lee, H.J.; Cha, J.Y. Recent insights into the role of ChREBP in intestinal fructose absorption and metabolism. BMB Rep. 2018, 51, 429–436. [Google Scholar] [CrossRef]
- Taskinen, M.R.; Packard, C.J.; Boren, J. Emerging Evidence that ApoC-III Inhibitors Provide Novel Options to Reduce the Residual CVD. Curr. Atheroscler. Rep. 2019, 21, 27. [Google Scholar] [CrossRef]
- Abdul-Wahed, A.; Guilmeau, S.; Postic, C. Sweet Sixteenth for ChREBP: Established Roles and Future Goals. Cell Metab. 2017, 26, 324–341. [Google Scholar] [CrossRef] [PubMed]
- Kim, M.S.; Krawczyk, S.A.; Doridot, L.; Fowler, A.J.; Wang, J.X.; Trauger, S.A.; Noh, H.L.; Kang, H.J.; Meissen, J.K.; Blatnik, M.; et al. ChREBP regulates fructose-induced glucose production independently of insulin signaling. J. Clin. Investig. 2016, 126, 4372–4386. [Google Scholar] [CrossRef] [PubMed]
- Kim, M.; Astapova, I.I.; Flier, S.N.; Hannou, S.A.; Doridot, L.; Sargsyan, A.; Kou, H.H.; Fowler, A.J.; Liang, G.; Herman, M.A. Intestinal, but not hepatic, ChREBP is required for fructose tolerance. JCI Insight 2017, 2. [Google Scholar] [CrossRef] [PubMed]
- Haidari, M.; Leung, N.; Mahbub, F.; Uffelman, K.D.; Kohen-Avramoglu, R.; Lewis, G.F.; Adeli, K. Fasting and postprandial overproduction of intestinally derived lipoproteins in an animal model of insulin resistance. Evidence that chronic fructose feeding in the hamster is accompanied by enhanced intestinal de novo lipogenesis and ApoB48-containing lipoprotein overproduction. J. Biol. Chem. 2002, 277, 31646–31655. [Google Scholar] [CrossRef] [PubMed]
- Stanhope, K.L. Sugar consumption, metabolic disease and obesity: The state of the controversy. Crit. Rev. Clin. Lab. Sci. 2016, 53, 52–67. [Google Scholar] [CrossRef] [PubMed]
- Sun, S.Z.; Empie, M.W. Fructose metabolism in humans—What isotopic tracer studies tell us. Nutr. Metab. (Lond.) 2012, 9, 89. [Google Scholar] [CrossRef] [PubMed]
- Softic, S.; Cohen, D.E.; Kahn, C.R. Role of Dietary Fructose and Hepatic De Novo Lipogenesis in Fatty Liver Disease. Dig. Dis. Sci. 2016, 61, 1282–1293. [Google Scholar] [CrossRef] [PubMed]
- Jang, C.; Hui, S.; Lu, W.; Cowan, A.J.; Morscher, R.J.; Lee, G.; Liu, W.; Tesz, G.J.; Birnbaum, M.J.; Rabinowitz, J.D. The Small Intestine Converts Dietary Fructose into Glucose and Organic Acids. Cell Metab. 2018, 27, 351–361. [Google Scholar] [CrossRef] [PubMed]
- Gonzalez, J.T.; Betts, J.A. Dietary Fructose Metabolism By Splanchnic Organs: Size Matters. Cell Metab. 2018, 27, 483–485. [Google Scholar] [CrossRef]
- Francey, C.; Cros, J.; Rosset, R.; Creze, C.; Rey, V.; Stefanoni, N.; Schneiter, P.; Tappy, L.; Seyssel, K. The extra-splanchnic fructose escape after ingestion of a fructose-glucose drink: An exploratory study in healthy humans using a dual fructose isotope method. Clin. Nutr. ESPEN 2019, 29, 125–132. [Google Scholar] [CrossRef]
- Xiao, C.; Dash, S.; Morgantini, C.; Lewis, G.F. Novel role of enteral monosaccharides in intestinal lipoprotein production in healthy humans. Arterioscler. Thromb. Vasc. Biol. 2013, 33, 1056–1062. [Google Scholar] [CrossRef] [PubMed]
- Taskinen, M.R.; Soderlund, S.; Bogl, L.H.; Hakkarainen, A.; Matikainen, N.; Pietilainen, K.H.; Rasanen, S.; Lundbom, N.; Bjornson, E.; Eliasson, B.; et al. Adverse effects of fructose on cardiometabolic risk factors and hepatic lipid metabolism in subjects with abdominal obesity. J. Intern. Med. 2017, 282, 187–201. [Google Scholar] [CrossRef] [PubMed]
- Herman, M.A.; Samuel, V.T. The Sweet Path to Metabolic Demise: Fructose and Lipid Synthesis. Trends Endocrinol. Metab. 2016, 27, 719–730. [Google Scholar] [CrossRef] [PubMed]
- Tappy, L. Fructose-containing caloric sweeteners as a cause of obesity and metabolic disorders. J. Exp. Biol. 2018, 221. [Google Scholar] [CrossRef] [PubMed]
- Spalding, K.L.; Bernard, S.; Naslund, E.; Salehpour, M.; Possnert, G.; Appelsved, L.; Fu, K.Y.; Alkass, K.; Druid, H.; Thorell, A.; et al. Impact of fat mass and distribution on lipid turnover in human adipose tissue. Nat. Commun. 2017, 8, 15253. [Google Scholar] [CrossRef] [PubMed]
- Kim, S.H.; Despres, J.P.; Koh, K.K. Obesity and cardiovascular disease: Friend or foe? Eur. Heart J. 2016, 37, 3560–3568. [Google Scholar] [CrossRef] [PubMed]
- Karpe, F.; Pinnick, K.E. Biology of upper-body and lower-body adipose tissue—Link to whole-body phenotypes. Nat. Rev. Endocrinol. 2015, 11, 90–100. [Google Scholar] [CrossRef] [PubMed]
- Schulze, M.B. Metabolic health in normal-weight and obese individuals. Diabetologia 2019, 62, 558–566. [Google Scholar] [CrossRef] [PubMed]
- Neeland, I.J.; Poirier, P.; Despres, J.P. Cardiovascular and Metabolic Heterogeneity of Obesity: Clinical Challenges and Implications for Management. Circulation 2018, 137, 1391–1406. [Google Scholar] [CrossRef]
- Piche, M.E.; Vasan, S.K.; Hodson, L.; Karpe, F. Relevance of human fat distribution on lipid and lipoprotein metabolism and cardiovascular disease risk. Curr. Opin. Lipidol. 2018, 29, 285–292. [Google Scholar] [CrossRef]
- Stefan, N.; Haring, H.U.; Cusi, K. Non-alcoholic fatty liver disease: Causes, diagnosis, cardiometabolic consequences, and treatment strategies. Lancet Diabetes Endocrinol. 2019, 7, 313–324. [Google Scholar] [CrossRef]
- Stefan, N.; Kantartzis, K.; Haring, H.U. Causes and metabolic consequences of Fatty liver. Endocr. Rev. 2008, 29, 939–960. [Google Scholar] [CrossRef] [PubMed]
- Vernon, G.; Baranova, A.; Younossi, Z.M. Systematic review: The epidemiology and natural history of non-alcoholic fatty liver disease and non-alcoholic steatohepatitis in adults. Aliment. Pharmacol. Ther. 2011, 34, 274–285. [Google Scholar] [CrossRef] [PubMed]
- Bellentani, S.; Scaglioni, F.; Marino, M.; Bedogni, G. Epidemiology of non-alcoholic fatty liver disease. Dig. Dis. 2010, 28, 155–161. [Google Scholar] [CrossRef] [PubMed]
- Estes, C.; Anstee, Q.M.; Arias-Loste, M.T.; Bantel, H.; Bellentani, S.; Caballeria, J.; Colombo, M.; Craxi, A.; Crespo, J.; Day, C.P.; et al. Modeling NAFLD disease burden in China, France, Germany, Italy, Japan, Spain, United Kingdom, and United States for the period 2016–2030. J. Hepatol. 2018, 69, 896–904. [Google Scholar] [CrossRef]
- Chiu, S.; Mulligan, K.; Schwarz, J.M. Dietary carbohydrates and fatty liver disease: De novo lipogenesis. Curr. Opin. Clin. Nutr. Metab. Care 2018, 21, 277–282. [Google Scholar] [CrossRef]
- Sanguesa, G.; Shaligram, S.; Akther, F.; Roglans, N.; Laguna, J.C.; Rahimian, R.; Alegret, M. Type of supplemented simple sugar, not merely calorie intake, determines adverse effects on metabolism and aortic function in female rats. Am. J. Physiol. Heart Circ. Physiol. 2017, 312, H289–H304. [Google Scholar] [CrossRef]
- Dorn, C.; Riener, M.O.; Kirovski, G.; Saugspier, M.; Steib, K.; Weiss, T.S.; Gabele, E.; Kristiansen, G.; Hartmann, A.; Hellerbrand, C. Expression of fatty acid synthase in nonalcoholic fatty liver disease. Int. J. Clin. Exp. Pathol. 2010, 3, 505–514. [Google Scholar]
- Mitsuyoshi, H.; Yasui, K.; Harano, Y.; Endo, M.; Tsuji, K.; Minami, M.; Itoh, Y.; Okanoue, T.; Yoshikawa, T. Analysis of hepatic genes involved in the metabolism of fatty acids and iron in nonalcoholic fatty liver disease. Hepatol. Res. 2009, 39, 366–373. [Google Scholar] [CrossRef]
- Paglialunga, S.; Dehn, C.A. Clinical assessment of hepatic de novo lipogenesis in non-alcoholic fatty liver disease. Lipids Health Dis. 2016, 15, 159. [Google Scholar] [CrossRef]
- Tappy, L.; Le, K.A. Metabolic effects of fructose and the worldwide increase in obesity. Physiol. Rev. 2010, 90, 23–46. [Google Scholar] [CrossRef]
- Rutledge, A.C.; Adeli, K. Fructose and the metabolic syndrome: Pathophysiology and molecular mechanisms. Nutr. Rev. 2007, 65, S13–S23. [Google Scholar] [CrossRef]
- Stanhope, K.L.; Havel, P.J. Fructose consumption: recent results and their potential implications. Ann. N. Y. Acad. Sci. 2010, 1190, 15–24. [Google Scholar] [CrossRef]
- Malik, V.S.; Hu, F.B. Fructose and Cardiometabolic Health: What the Evidence From Sugar-Sweetened Beverages Tells Us. J. Am. Coll. Cardiol. 2015, 66, 1615–1624. [Google Scholar] [CrossRef]
- Fisher, F.M.; Kim, M.; Doridot, L.; Cunniff, J.C.; Parker, T.S.; Levine, D.M.; Hellerstein, M.K.; Hudgins, L.C.; Maratos-Flier, E.; Herman, M.A. A critical role for ChREBP-mediated FGF21 secretion in hepatic fructose metabolism. Mol. Metab. 2017, 6, 14–21. [Google Scholar] [CrossRef]
- Solinas, G.; Boren, J.; Dulloo, A.G. De novo lipogenesis in metabolic homeostasis: More friend than foe? Mol. Metab. 2015, 4, 367–377. [Google Scholar] [CrossRef]
- Stanhope, K.L. Role of fructose-containing sugars in the epidemics of obesity and metabolic syndrome. Annu. Rev. Med. 2012, 63, 329–343. [Google Scholar] [CrossRef]
- Stanhope, K.L.; Schwarz, J.M.; Keim, N.L.; Griffen, S.C.; Bremer, A.A.; Graham, J.L.; Hatcher, B.; Cox, C.L.; Dyachenko, A.; Zhang, W.; et al. Consuming fructose-sweetened, not glucose-sweetened, beverages increases visceral adiposity and lipids and decreases insulin sensitivity in overweight/obese humans. J. Clin. Investig. 2009, 119, 1322–1334. [Google Scholar] [CrossRef]
- Faeh, D.; Minehira, K.; Schwarz, J.M.; Periasamy, R.; Park, S.; Tappy, L. Effect of fructose overfeeding and fish oil administration on hepatic de novo lipogenesis and insulin sensitivity in healthy men. Diabetes 2005, 54, 1907–1913. [Google Scholar] [CrossRef]
- Stanhope, K.L. More pieces of the fructose puzzle. J. Intern. Med. 2017, 282, 202–204. [Google Scholar] [CrossRef]
- Schwarz, J.M.; Noworolski, S.M.; Erkin-Cakmak, A.; Korn, N.J.; Wen, M.J.; Tai, V.W.; Jones, G.M.; Palii, S.P.; Velasco-Alin, M.; Pan, K.; et al. Effects of Dietary Fructose Restriction on Liver Fat, De Novo Lipogenesis, and Insulin Kinetics in Children With Obesity. Gastroenterology 2017, 153, 743–752. [Google Scholar] [CrossRef]
- Vos, M.B.; Lavine, J.E. Dietary fructose in nonalcoholic fatty liver disease. Hepatology 2013, 57, 2525–2531. [Google Scholar] [CrossRef]
- Jegatheesan, P.; De Bandt, J.P. Fructose and NAFLD: The Multifaceted Aspects of Fructose Metabolism. Nutrients 2017, 9, 230. [Google Scholar] [CrossRef]
- Jensen, T.; Abdelmalek, M.F.; Sullivan, S.; Nadeau, K.J.; Green, M.; Roncal, C.; Nakagawa, T.; Kuwabara, M.; Sato, Y.; Kang, D.H.; et al. Fructose and sugar: A major mediator of non-alcoholic fatty liver disease. J. Hepatol. 2018, 68, 1063–1075. [Google Scholar] [CrossRef]
- Moore, J.B. From sugar to liver fat and public health: Systems biology driven studies in understanding non-alcoholic fatty liver disease pathogenesis. Proc. Nutr. Soc. 2019. [Google Scholar] [CrossRef]
- Alexander, M.; Loomis, A.K.; Fairburn-Beech, J.; van der Lei, J.; Duarte-Salles, T.; Prieto-Alhambra, D.; Ansell, D.; Pasqua, A.; Lapi, F.; Rijnbeek, P.; et al. Real-world data reveal a diagnostic gap in non-alcoholic fatty liver disease. BMC Med. 2018, 16, 130. [Google Scholar] [CrossRef]
- Lee, S.S.; Park, S.H.; Kim, H.J.; Kim, S.Y.; Kim, M.Y.; Kim, D.Y.; Suh, D.J.; Kim, K.M.; Bae, M.H.; Lee, J.Y.; et al. Non-invasive assessment of hepatic steatosis: Prospective comparison of the accuracy of imaging examinations. J. Hepatol. 2010, 52, 579–585. [Google Scholar] [CrossRef]
- Reeder, S.B.; Cruite, I.; Hamilton, G.; Sirlin, C.B. Quantitative assessment of liver fat with magnetic resonance imaging and spectroscopy. J. Magn. Reson. Imaging 2011, 34, 729–749. [Google Scholar] [CrossRef]
- Szczepaniak, L.S.; Nurenberg, P.; Leonard, D.; Browning, J.D.; Reingold, J.S.; Grundy, S.; Hobbs, H.H.; Dobbins, R.L. Magnetic resonance spectroscopy to measure hepatic triglyceride content: Prevalence of hepatic steatosis in the general population. Am. J. Physiol. Endocrinol. Metab. 2005, 288, E462–E468. [Google Scholar] [CrossRef]
- van de Weijer, T.; Schrauwen-Hinderling, V.B. Application of Magnetic Resonance Spectroscopy in metabolic research. Biochim. Biophys. Acta Mol. Basis Dis. 2019, 1865, 741–748. [Google Scholar] [CrossRef]
- European Association for the Study of the Liver; European Association for the Study of Diabetes; European Association for the Study of Obesity. EASL-EASD-EASO Clinical Practice Guidelines for the management of non-alcoholic fatty liver disease. Diabetologia 2016, 59, 1121–1140. [Google Scholar] [CrossRef]
- Le, K.A.; Ith, M.; Kreis, R.; Faeh, D.; Bortolotti, M.; Tran, C.; Boesch, C.; Tappy, L. Fructose overconsumption causes dyslipidemia and ectopic lipid deposition in healthy subjects with and without a family history of type 2 diabetes. Am. J. Clin. Nutr. 2009, 89, 1760–1765. [Google Scholar] [CrossRef]
- Sobrecases, H.; Le, K.A.; Bortolotti, M.; Schneiter, P.; Ith, M.; Kreis, R.; Boesch, C.; Tappy, L. Effects of short-term overfeeding with fructose, fat and fructose plus fat on plasma and hepatic lipids in healthy men. Diabetes Metab. 2010, 36, 244–246. [Google Scholar] [CrossRef]
- Lecoultre, V.; Egli, L.; Carrel, G.; Theytaz, F.; Kreis, R.; Schneiter, P.; Boss, A.; Zwygart, K.; Le, K.A.; Bortolotti, M.; et al. Effects of fructose and glucose overfeeding on hepatic insulin sensitivity and intrahepatic lipids in healthy humans. Obesity (Silver Spring) 2013, 21, 782–785. [Google Scholar] [CrossRef]
- Theytaz, F.; Noguchi, Y.; Egli, L.; Campos, V.; Buehler, T.; Hodson, L.; Patterson, B.W.; Nishikata, N.; Kreis, R.; Mittendorfer, B.; et al. Effects of supplementation with essential amino acids on intrahepatic lipid concentrations during fructose overfeeding in humans. Am. J. Clin. Nutr. 2012, 96, 1008–1016. [Google Scholar] [CrossRef]
- Johnston, R.D.; Stephenson, M.C.; Crossland, H.; Cordon, S.M.; Palcidi, E.; Cox, E.F.; Taylor, M.A.; Aithal, G.P.; Macdonald, I.A. No difference between high-fructose and high-glucose diets on liver triacylglycerol or biochemistry in healthy overweight men. Gastroenterology 2013, 145, 1016–1025. [Google Scholar] [CrossRef]
- Surowska, A.; Jegatheesan, P.; Campos, V.; Marques, A.S.; Egli, L.; Cros, J.; Rosset, R.; Lecoultre, V.; Kreis, R.; Boesch, C.; et al. Effects of Dietary Protein and Fat Content on Intrahepatocellular and Intramyocellular Lipids during a 6-Day Hypercaloric, High Sucrose Diet: A Randomized Controlled Trial in Normal Weight Healthy Subjects. Nutrients 2019, 11, 209. [Google Scholar] [CrossRef]
- Schwarz, J.M.; Noworolski, S.M.; Wen, M.J.; Dyachenko, A.; Prior, J.L.; Weinberg, M.E.; Herraiz, L.A.; Tai, V.W.; Bergeron, N.; Bersot, T.P.; et al. Effect of a High-Fructose Weight-Maintaining Diet on Lipogenesis and Liver Fat. J. Clin. Endocrinol. Metab. 2015, 100, 2434–2442. [Google Scholar] [CrossRef]
- Cox, C.L.; Stanhope, K.L.; Schwarz, J.M.; Graham, J.L.; Hatcher, B.; Griffen, S.C.; Bremer, A.A.; Berglund, L.; McGahan, J.P.; Havel, P.J.; et al. Consumption of fructose-sweetened beverages for 10 weeks reduces net fat oxidation and energy expenditure in overweight/obese men and women. Eur. J. Clin. Nutr. 2012, 66, 201–208. [Google Scholar] [CrossRef]
- Maersk, M.; Belza, A.; Stodkilde-Jorgensen, H.; Ringgaard, S.; Chabanova, E.; Thomsen, H.; Pedersen, S.B.; Astrup, A.; Richelsen, B. Sucrose-sweetened beverages increase fat storage in the liver, muscle, and visceral fat depot: A 6-mo randomized intervention study. Am. J. Clin. Nutr. 2012, 95, 283–289. [Google Scholar] [CrossRef]
- Silbernagel, G.; Machann, J.; Unmuth, S.; Schick, F.; Stefan, N.; Haring, H.U.; Fritsche, A. Effects of 4-week very-high-fructose/glucose diets on insulin sensitivity, visceral fat and intrahepatic lipids: An exploratory trial. Br. J. Nutr. 2011, 106, 79–86. [Google Scholar] [CrossRef]
- Chung, M.; Ma, J.; Patel, K.; Berger, S.; Lau, J.; Lichtenstein, A.H. Fructose, high-fructose corn syrup, sucrose, and nonalcoholic fatty liver disease or indexes of liver health: A systematic review and meta-analysis. Am. J. Clin. Nutr. 2014, 100, 833–849. [Google Scholar] [CrossRef]
- Chiu, S.; Sievenpiper, J.L.; de Souza, R.J.; Cozma, A.I.; Mirrahimi, A.; Carleton, A.J.; Ha, V.; Di Buono, M.; Jenkins, A.L.; Leiter, L.A.; et al. Effect of fructose on markers of non-alcoholic fatty liver disease (NAFLD): a systematic review and meta-analysis of controlled feeding trials. Eur. J. Clin. Nutr. 2014, 68, 416–423. [Google Scholar] [CrossRef]
- Ma, J.; Fox, C.S.; Jacques, P.F.; Speliotes, E.K.; Hoffmann, U.; Smith, C.E.; Saltzman, E.; McKeown, N.M. Sugar-sweetened beverage, diet soda, and fatty liver disease in the Framingham Heart Study cohorts. J. Hepatol. 2015, 63, 462–469. [Google Scholar] [CrossRef]
- Sevastianova, K.; Santos, A.; Kotronen, A.; Hakkarainen, A.; Makkonen, J.; Silander, K.; Peltonen, M.; Romeo, S.; Lundbom, J.; Lundbom, N.; et al. Effect of short-term carbohydrate overfeeding and long-term weight loss on liver fat in overweight humans. Am. J. Clin. Nutr. 2012, 96, 727–734. [Google Scholar] [CrossRef]
- Luukkonen, P.K.; Sadevirta, S.; Zhou, Y.; Kayser, B.; Ali, A.; Ahonen, L.; Lallukka, S.; Pelloux, V.; Gaggini, M.; Jian, C.; et al. Saturated Fat Is More Metabolically Harmful for the Human Liver Than Unsaturated Fat or Simple Sugars. Diabetes Care 2018, 41, 1732–1739. [Google Scholar] [CrossRef]
- Gugliucci, A.; Lustig, R.H.; Caccavello, R.; Erkin-Cakmak, A.; Noworolski, S.M.; Tai, V.W.; Wen, M.J.; Mulligan, K.; Schwarz, J.M. Short-term isocaloric fructose restriction lowers apoC-III levels and yields less atherogenic lipoprotein profiles in children with obesity and metabolic syndrome. Atherosclerosis 2016, 253, 171–177. [Google Scholar] [CrossRef]
- Erkin-Cakmak, A.; Bains, Y.; Caccavello, R.; Noworolski, S.M.; Schwarz, J.M.; Mulligan, K.; Lustig, R.H.; Gugliucci, A. Isocaloric Fructose Restriction Reduces Serum d-Lactate Concentration in Children With Obesity and Metabolic Syndrome. J. Clin. Endocrinol. Metab. 2019, 104, 3003–3011. [Google Scholar] [CrossRef]
- Lee, O.; Bruce, W.R.; Dong, Q.; Bruce, J.; Mehta, R.; O’Brien, P.J. Fructose and carbonyl metabolites as endogenous toxins. Chem. Biol. Interact. 2009, 178, 332–339. [Google Scholar] [CrossRef]
- Pickens, M.K.; Yan, J.S.; Ng, R.K.; Ogata, H.; Grenert, J.P.; Beysen, C.; Turner, S.M.; Maher, J.J. Dietary sucrose is essential to the development of liver injury in the methionine-choline-deficient model of steatohepatitis. J. Lipid Res. 2009, 50, 2072–2082. [Google Scholar] [CrossRef]
- Masania, J.; Malczewska-Malec, M.; Razny, U.; Goralska, J.; Zdzienicka, A.; Kiec-Wilk, B.; Gruca, A.; Stancel-Mozwillo, J.; Dembinska-Kiec, A.; Rabbani, N.; et al. Dicarbonyl stress in clinical obesity. Glycoconj. J. 2016, 33, 581–589. [Google Scholar] [CrossRef] [PubMed]
- Asgari-Taee, F.; Zerafati-Shoae, N.; Dehghani, M.; Sadeghi, M.; Baradaran, H.R.; Jazayeri, S. Association of sugar sweetened beverages consumption with non-alcoholic fatty liver disease: A systematic review and meta-analysis. Eur. J. Nutr. 2018. [Google Scholar] [CrossRef] [PubMed]
- Ter Horst, K.W.; Serlie, M.J. Fructose Consumption, Lipogenesis, and Non-Alcoholic Fatty Liver Disease. Nutrients 2017, 9, 981. [Google Scholar] [CrossRef] [PubMed]
- Kirk, E.; Reeds, D.N.; Finck, B.N.; Mayurranjan, S.M.; Patterson, B.W.; Klein, S. Dietary fat and carbohydrates differentially alter insulin sensitivity during caloric restriction. Gastroenterology 2009, 136, 1552–1560. [Google Scholar] [CrossRef] [PubMed]
- Haufe, S.; Engeli, S.; Kast, P.; Bohnke, J.; Utz, W.; Haas, V.; Hermsdorf, M.; Mahler, A.; Wiesner, S.; Birkenfeld, A.L.; et al. Randomized comparison of reduced fat and reduced carbohydrate hypocaloric diets on intrahepatic fat in overweight and obese human subjects. Hepatology 2011, 53, 1504–1514. [Google Scholar] [CrossRef] [PubMed]
- Perheentupa, J.; Raivio, K. Fructose-induced hyperuricaemia. Lancet 1967, 2, 528–531. [Google Scholar] [CrossRef]
- Sozen, E.; Ozer, N.K. Impact of high cholesterol and endoplasmic reticulum stress on metabolic diseases: An updated mini-review. Redox Biol. 2017, 12, 456–461. [Google Scholar] [CrossRef] [PubMed]
- Lebeaupin, C.; Vallee, D.; Hazari, Y.; Hetz, C.; Chevet, E.; Bailly-Maitre, B. Endoplasmic reticulum stress signalling and the pathogenesis of non-alcoholic fatty liver disease. J. Hepatol. 2018, 69, 927–947. [Google Scholar] [CrossRef]
- Henkel, A.; Green, R.M. The unfolded protein response in fatty liver disease. Semin. Liver Dis. 2013, 33, 321–329. [Google Scholar] [CrossRef]
- Lee, A.H.; Scapa, E.F.; Cohen, D.E.; Glimcher, L.H. Regulation of hepatic lipogenesis by the transcription factor XBP1. Science 2008, 320, 1492–1496. [Google Scholar] [CrossRef]
- Lanaspa, M.A.; Sanchez-Lozada, L.G.; Choi, Y.J.; Cicerchi, C.; Kanbay, M.; Roncal-Jimenez, C.A.; Ishimoto, T.; Li, N.; Marek, G.; Duranay, M.; et al. Uric acid induces hepatic steatosis by generation of mitochondrial oxidative stress: Potential role in fructose-dependent and -independent fatty liver. J. Biol. Chem. 2012, 287, 40732–40744. [Google Scholar] [CrossRef] [PubMed]
- Abdelmalek, M.F.; Lazo, M.; Horska, A.; Bonekamp, S.; Lipkin, E.W.; Balasubramanyam, A.; Bantle, J.P.; Johnson, R.J.; Diehl, A.M.; Clark, J.M.; et al. Higher dietary fructose is associated with impaired hepatic adenosine triphosphate homeostasis in obese individuals with type 2 diabetes. Hepatology 2012, 56, 952–960. [Google Scholar] [CrossRef] [PubMed]
- Satapati, S.; Kucejova, B.; Duarte, J.A.; Fletcher, J.A.; Reynolds, L.; Sunny, N.E.; He, T.; Nair, L.A.; Livingston, K.A.; Fu, X.; et al. Mitochondrial metabolism mediates oxidative stress and inflammation in fatty liver. J. Clin. Investig. 2015, 125, 4447–4462. [Google Scholar] [CrossRef] [PubMed]
- Softic, S.; Gupta, M.K.; Wang, G.X.; Fujisaka, S.; O’Neill, B.T.; Rao, T.N.; Willoughby, J.; Harbison, C.; Fitzgerald, K.; Ilkayeva, O.; et al. Divergent effects of glucose and fructose on hepatic lipogenesis and insulin signaling. J. Clin. Investig. 2017, 127, 4059–4074. [Google Scholar] [CrossRef] [PubMed]
- Facchini, F.; Chen, Y.D.; Hollenbeck, C.B.; Reaven, G.M. Relationship between resistance to insulin-mediated glucose uptake, urinary uric acid clearance, and plasma uric acid concentration. JAMA 1991, 266, 3008–3011. [Google Scholar] [CrossRef] [PubMed]
- Choi, H.K.; Ford, E.S. Prevalence of the metabolic syndrome in individuals with hyperuricemia. Am. J. Med. 2007, 120, 442–447. [Google Scholar] [CrossRef]
- Yu, T.Y.; Jee, J.H.; Bae, J.C.; Jin, S.M.; Baek, J.H.; Lee, M.K.; Kim, J.H. Serum uric acid: A strong and independent predictor of metabolic syndrome after adjusting for body composition. Metabolism 2016, 65, 432–440. [Google Scholar] [CrossRef]
- Lee, Y.J.; Cho, S.; Kim, S.R. A possible role of serum uric acid as a marker of metabolic syndrome. Intern. Med. J. 2014, 44, 1210–1216. [Google Scholar] [CrossRef]
- Sun, H.L.; Pei, D.; Lue, K.H.; Chen, Y.L. Uric Acid Levels Can Predict Metabolic Syndrome and Hypertension in Adolescents: A 10-Year Longitudinal Study. PLoS ONE 2015, 10, e0143786. [Google Scholar] [CrossRef]
- Johnson, R.J.; Nakagawa, T.; Sanchez-Lozada, L.G.; Shafiu, M.; Sundaram, S.; Le, M.; Ishimoto, T.; Sautin, Y.Y.; Lanaspa, M.A. Sugar, uric acid, and the etiology of diabetes and obesity. Diabetes 2013, 62, 3307–3315. [Google Scholar] [CrossRef]
- Zurlo, A.; Veronese, N.; Giantin, V.; Maselli, M.; Zambon, S.; Maggi, S.; Musacchio, E.; Toffanello, E.D.; Sartori, L.; Perissinotto, E.; et al. High serum uric acid levels increase the risk of metabolic syndrome in elderly women: The PRO.V.A study. Nutr. Metab. Cardiovasc. Dis. 2016, 26, 27–35. [Google Scholar] [CrossRef] [PubMed]
- Babio, N.; Martinez-Gonzalez, M.A.; Estruch, R.; Warnberg, J.; Recondo, J.; Ortega-Calvo, M.; Serra-Majem, L.; Corella, D.; Fito, M.; Ros, E.; et al. Associations between serum uric acid concentrations and metabolic syndrome and its components in the PREDIMED study. Nutr. Metab. Cardiovasc. Dis. 2015, 25, 173–180. [Google Scholar] [CrossRef] [PubMed]
- Yuan, H.; Yu, C.; Li, X.; Sun, L.; Zhu, X.; Zhao, C.; Zhang, Z.; Yang, Z. Serum Uric Acid Levels and Risk of Metabolic Syndrome: A Dose-Response Meta-Analysis of Prospective Studies. J. Clin. Endocrinol. Metab. 2015, 100, 4198–4207. [Google Scholar] [CrossRef] [PubMed]
- Ouyang, X.; Cirillo, P.; Sautin, Y.; McCall, S.; Bruchette, J.L.; Diehl, A.M.; Johnson, R.J.; Abdelmalek, M.F. Fructose consumption as a risk factor for non-alcoholic fatty liver disease. J. Hepatol. 2008, 48, 993–999. [Google Scholar] [CrossRef] [PubMed]
- Zhang, S.; Du, T.; Li, M.; Lu, H.; Lin, X.; Yu, X. Combined effect of obesity and uric acid on nonalcoholic fatty liver disease and hypertriglyceridemia. Medicine (Baltimore) 2017, 96, e6381. [Google Scholar] [CrossRef] [PubMed]
- Liu, Z.; Que, S.; Zhou, L.; Zheng, S. Dose-response Relationship of Serum Uric Acid with Metabolic Syndrome and Non-alcoholic Fatty Liver Disease Incidence: A Meta-analysis of Prospective Studies. Sci. Rep. 2015, 5, 14325. [Google Scholar] [CrossRef] [PubMed]
- Yang, C.; Yang, S.; Xu, W.; Zhang, J.; Fu, W.; Feng, C. Association between the hyperuricemia and nonalcoholic fatty liver disease risk in a Chinese population: A retrospective cohort study. PLoS ONE 2017, 12, e0177249. [Google Scholar] [CrossRef]
- Lee, J.W.; Cho, Y.K.; Ryan, M.; Kim, H.; Lee, S.W.; Chang, E.; Joo, K.J.; Kim, J.T.; Kim, B.S.; Sung, K.C. Serum uric Acid as a predictor for the development of nonalcoholic Fatty liver disease in apparently healthy subjects: A 5-year retrospective cohort study. Gut Liver 2010, 4, 378–383. [Google Scholar] [CrossRef]
- Lonardo, A.; Loria, P.; Leonardi, F.; Borsatti, A.; Neri, P.; Pulvirenti, M.; Verrone, A.M.; Bagni, A.; Bertolotti, M.; Ganazzi, D.; et al. Fasting insulin and uric acid levels but not indices of iron metabolism are independent predictors of non-alcoholic fatty liver disease. A case-control study. Dig. Liver Dis. 2002, 34, 204–211. [Google Scholar] [CrossRef]
- Sirota, J.C.; McFann, K.; Targher, G.; Johnson, R.J.; Chonchol, M.; Jalal, D.I. Elevated serum uric acid levels are associated with non-alcoholic fatty liver disease independently of metabolic syndrome features in the United States: Liver ultrasound data from the National Health and Nutrition Examination Survey. Metabolism 2013, 62, 392–399. [Google Scholar] [CrossRef]
- Li, Y.; Xu, C.; Yu, C.; Xu, L.; Miao, M. Association of serum uric acid level with non-alcoholic fatty liver disease: A cross-sectional study. J. Hepatol. 2009, 50, 1029–1034. [Google Scholar] [CrossRef] [PubMed]
- Xu, C.; Yu, C.; Xu, L.; Miao, M.; Li, Y. High serum uric acid increases the risk for nonalcoholic Fatty liver disease: A prospective observational study. PLoS ONE 2010, 5, e11578. [Google Scholar] [CrossRef] [PubMed]
- Choi, H.K.; Curhan, G. Soft drinks, fructose consumption, and the risk of gout in men: Prospective cohort study. BMJ 2008, 336, 309–312. [Google Scholar] [CrossRef] [PubMed]
- Choi, H.K.; Willett, W.; Curhan, G. Fructose-rich beverages and risk of gout in women. JAMA 2010, 304, 2270–2278. [Google Scholar] [CrossRef] [PubMed]
- Bae, J.; Chun, B.Y.; Park, P.S.; Choi, B.Y.; Kim, M.K.; Shin, M.H.; Lee, Y.H.; Shin, D.H.; Kim, S.K. Higher consumption of sugar-sweetened soft drinks increases the risk of hyperuricemia in Korean population: The Korean Multi-Rural Communities Cohort Study. Semin. Arthritis Rheum. 2014, 43, 654–661. [Google Scholar] [CrossRef] [PubMed]
- Meneses-Leon, J.; Denova-Gutierrez, E.; Castanon-Robles, S.; Granados-Garcia, V.; Talavera, J.O.; Rivera-Paredez, B.; Huitron-Bravo, G.G.; Cervantes-Rodriguez, M.; Quiterio-Trenado, M.; Rudolph, S.E.; et al. Sweetened beverage consumption and the risk of hyperuricemia in Mexican adults: A cross-sectional study. BMC Public Health 2014, 14, 445. [Google Scholar] [CrossRef] [PubMed]
- Siqueira, J.H.; Mill, J.G.; Velasquez-Melendez, G.; Moreira, A.D.; Barreto, S.M.; Bensenor, I.M.; Molina, M. Sugar-Sweetened Soft Drinks and Fructose Consumption Are Associated with Hyperuricemia: Cross-Sectional Analysis from the Brazilian Longitudinal Study of Adult Health (ELSA-Brasil). Nutrients 2018, 10, 981. [Google Scholar] [CrossRef]
- Nguyen, S.; Choi, H.K.; Lustig, R.H.; Hsu, C.Y. Sugar-sweetened beverages, serum uric acid, and blood pressure in adolescents. J. Pediatr. 2009, 154, 807–813. [Google Scholar] [CrossRef]
- Ngo Sock, E.T.; Le, K.A.; Ith, M.; Kreis, R.; Boesch, C.; Tappy, L. Effects of a short-term overfeeding with fructose or glucose in healthy young males. Br. J. Nutr. 2010, 103, 939–943. [Google Scholar] [CrossRef]
- Cox, C.L.; Stanhope, K.L.; Schwarz, J.M.; Graham, J.L.; Hatcher, B.; Griffen, S.C.; Bremer, A.A.; Berglund, L.; McGahan, J.P.; Keim, N.L.; et al. Consumption of fructose- but not glucose-sweetened beverages for 10 weeks increases circulating concentrations of uric acid, retinol binding protein-4, and gamma-glutamyl transferase activity in overweight/obese humans. Nutr. Metab. (Lond.) 2012, 9, 68. [Google Scholar] [CrossRef]
- Wang, D.D.; Sievenpiper, J.L.; de Souza, R.J.; Chiavaroli, L.; Ha, V.; Cozma, A.I.; Mirrahimi, A.; Yu, M.E.; Carleton, A.J.; Di Buono, M.; et al. The effects of fructose intake on serum uric acid vary among controlled dietary trials. J. Nutr. 2012, 142, 916–923. [Google Scholar] [CrossRef]
- Tappy, L.; Morio, B.; Azzout-Marniche, D.; Champ, M.; Gerber, M.; Houdart, S.; Mas, E.; Rizkalla, S.; Slama, G.; Mariotti, F.; et al. French Recommendations for Sugar Intake in Adults: A Novel Approach Chosen by ANSES. Nutrients 2018, 10, 989. [Google Scholar] [CrossRef] [PubMed]
- Caliceti, C.; Calabria, D.; Roda, A.; Cicero, A.F.G. Fructose Intake, Serum Uric Acid, and Cardiometabolic Disorders: A Critical Review. Nutrients 2017, 9, 395. [Google Scholar] [CrossRef] [PubMed]
- Kanbay, M.; Jensen, T.; Solak, Y.; Le, M.; Roncal-Jimenez, C.; Rivard, C.; Lanaspa, M.A.; Nakagawa, T.; Johnson, R.J. Uric acid in metabolic syndrome: From an innocent bystander to a central player. Eur. J. Intern. Med. 2016, 29, 3–8. [Google Scholar] [CrossRef] [PubMed]
- Welsh, J.A.; Sharma, A.; Abramson, J.L.; Vaccarino, V.; Gillespie, C.; Vos, M.B. Caloric sweetener consumption and dyslipidemia among US adults. JAMA 2010, 303, 1490–1497. [Google Scholar] [CrossRef] [PubMed]
- Dhingra, R.; Sullivan, L.; Jacques, P.F.; Wang, T.J.; Fox, C.S.; Meigs, J.B.; D’Agostino, R.B.; Gaziano, J.M.; Vasan, R.S. Soft drink consumption and risk of developing cardiometabolic risk factors and the metabolic syndrome in middle-aged adults in the community. Circulation 2007, 116, 480–488. [Google Scholar] [CrossRef] [PubMed]
- Livesey, G.; Taylor, R. Fructose consumption and consequences for glycation, plasma triacylglycerol, and body weight: Meta-analyses and meta-regression models of intervention studies. Am. J. Clin. Nutr. 2008, 88, 1419–1437. [Google Scholar] [CrossRef] [PubMed]
- Adiels, M.; Taskinen, M.R.; Bjornson, E.; Andersson, L.; Matikainen, N.; Soderlund, S.; Kahri, J.; Hakkarainen, A.; Lundbom, N.; Sihlbom, C.; et al. Role of apolipoprotein C-III overproduction in diabetic dyslipidaemia. Diabetes Obes. Metab. 2019. [Google Scholar] [CrossRef]
- Taskinen, M.R.; Boren, J. Why Is Apolipoprotein CIII Emerging as a Novel Therapeutic Target to Reduce the Burden of Cardiovascular Disease? Curr. Atheroscler. Rep. 2016, 18, 59. [Google Scholar] [CrossRef]
- Borén, J.; Watts, G.F.; Adiels, M.; Söderlund, S.; Chan, D.C.; Hakkarainen, A.; Lundbom, N.; Matikainen, N.; Kahri, J.; Vergès, B.; et al. Kinetic and Related Determinants of Plasma Triglyceride Concentration in Abdominal Obesity. Multicenter Tracer Kinetic Study. Arterioscler. Thromb. Vasc. Biol. 2015, 35, 2218–2224. [Google Scholar] [CrossRef] [PubMed]
- Stanhope, K.L.; Medici, V.; Bremer, A.A.; Lee, V.; Lam, H.D.; Nunez, M.V.; Chen, G.X.; Keim, N.L.; Havel, P.J. A dose-response study of consuming high-fructose corn syrup-sweetened beverages on lipid/lipoprotein risk factors for cardiovascular disease in young adults. Am. J. Clin. Nutr. 2015, 101, 1144–1154. [Google Scholar] [CrossRef]
- Lambertz, J.; Weiskirchen, S.; Landert, S.; Weiskirchen, R. Fructose: A Dietary Sugar in Crosstalk with Microbiota Contributing to the Development and Progression of Non-Alcoholic Liver Disease. Front. Immunol. 2017, 8, 1159. [Google Scholar] [CrossRef] [PubMed]
- den Besten, G.; Lange, K.; Havinga, R.; van Dijk, T.H.; Gerding, A.; van Eunen, K.; Muller, M.; Groen, A.K.; Hooiveld, G.J.; Bakker, B.M.; et al. Gut-derived short-chain fatty acids are vividly assimilated into host carbohydrates and lipids. Am. J. Physiol Gastrointest. Liver Physiol. 2013, 305, G900–G910. [Google Scholar] [CrossRef] [PubMed]
- Mouzaki, M.; Comelli, E.M.; Arendt, B.M.; Bonengel, J.; Fung, S.K.; Fischer, S.E.; McGilvray, I.D.; Allard, J.P. Intestinal microbiota in patients with nonalcoholic fatty liver disease. Hepatology 2013, 58, 120–127. [Google Scholar] [CrossRef] [PubMed]
- Jegatheesan, P.; Beutheu, S.; Ventura, G.; Sarfati, G.; Nubret, E.; Kapel, N.; Waligora-Dupriet, A.J.; Bergheim, I.; Cynober, L.; De-Bandt, J.P. Effect of specific amino acids on hepatic lipid metabolism in fructose-induced non-alcoholic fatty liver disease. Clin. Nutr. 2016, 35, 175–182. [Google Scholar] [CrossRef] [PubMed]
- Oh, J.H.; Alexander, L.M.; Pan, M.; Schueler, K.L.; Keller, M.P.; Attie, A.D.; Walter, J.; van Pijkeren, J.P. Dietary Fructose and Microbiota-Derived Short-Chain Fatty Acids Promote Bacteriophage Production in the Gut Symbiont Lactobacillus reuteri. Cell Host Microbe 2019, 25, 273–284. [Google Scholar] [CrossRef] [PubMed]
- Chatterjee, A.; Duerkop, B.A. Sugar and Fatty Acids Ack-celerate Prophage Induction. Cell Host Microbe 2019, 25, 175–176. [Google Scholar] [CrossRef]
- Mardinoglu, A.; Wu, H.; Bjornson, E.; Zhang, C.; Hakkarainen, A.; Rasanen, S.M.; Lee, S.; Mancina, R.M.; Bergentall, M.; Pietilainen, K.H.; et al. An Integrated Understanding of the Rapid Metabolic Benefits of a Carbohydrate-Restricted Diet on Hepatic Steatosis in Humans. Cell Metab. 2018, 27, 559–571. [Google Scholar] [CrossRef]

© 2019 by the authors. Licensee MDPI, Basel, Switzerland. This article is an open access article distributed under the terms and conditions of the Creative Commons Attribution (CC BY) license (http://creativecommons.org/licenses/by/4.0/).
Share and Cite
Taskinen, M.-R.; Packard, C.J.; Borén, J. Dietary Fructose and the Metabolic Syndrome. Nutrients 2019, 11, 1987. https://doi.org/10.3390/nu11091987
Taskinen M-R, Packard CJ, Borén J. Dietary Fructose and the Metabolic Syndrome. Nutrients. 2019; 11(9):1987. https://doi.org/10.3390/nu11091987
Chicago/Turabian StyleTaskinen, Marja-Riitta, Chris J Packard, and Jan Borén. 2019. "Dietary Fructose and the Metabolic Syndrome" Nutrients 11, no. 9: 1987. https://doi.org/10.3390/nu11091987
APA StyleTaskinen, M.-R., Packard, C. J., & Borén, J. (2019). Dietary Fructose and the Metabolic Syndrome. Nutrients, 11(9), 1987. https://doi.org/10.3390/nu11091987