Sugar-Sweetened Beverages and Cardiometabolic Health: An Update of the Evidence

Abstract
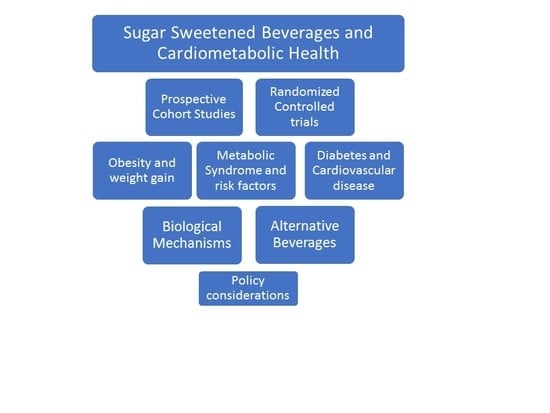
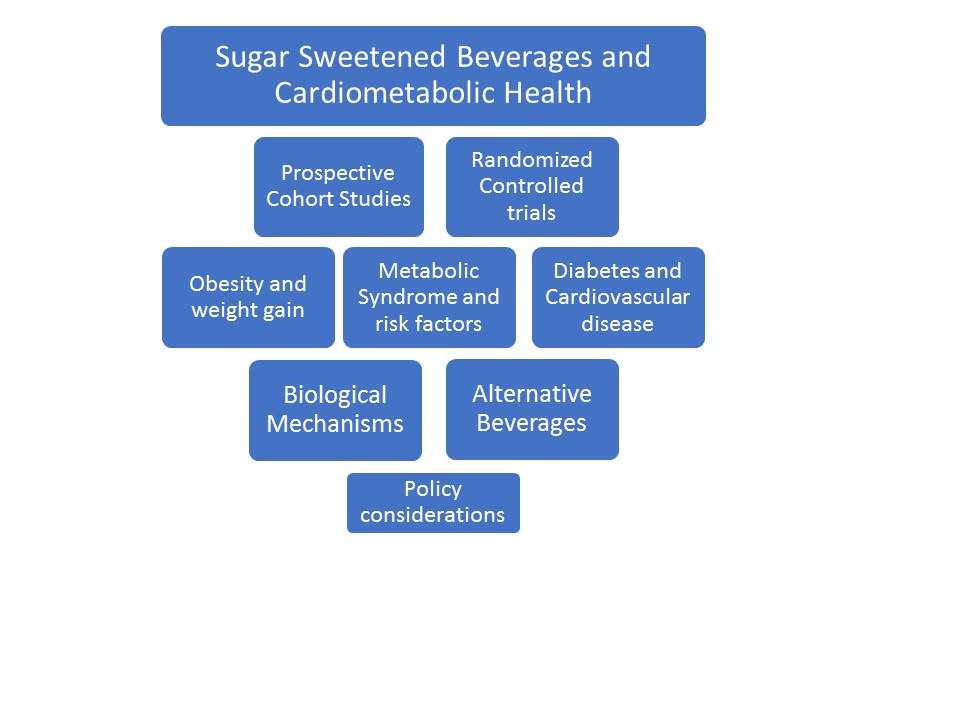
1. Introduction
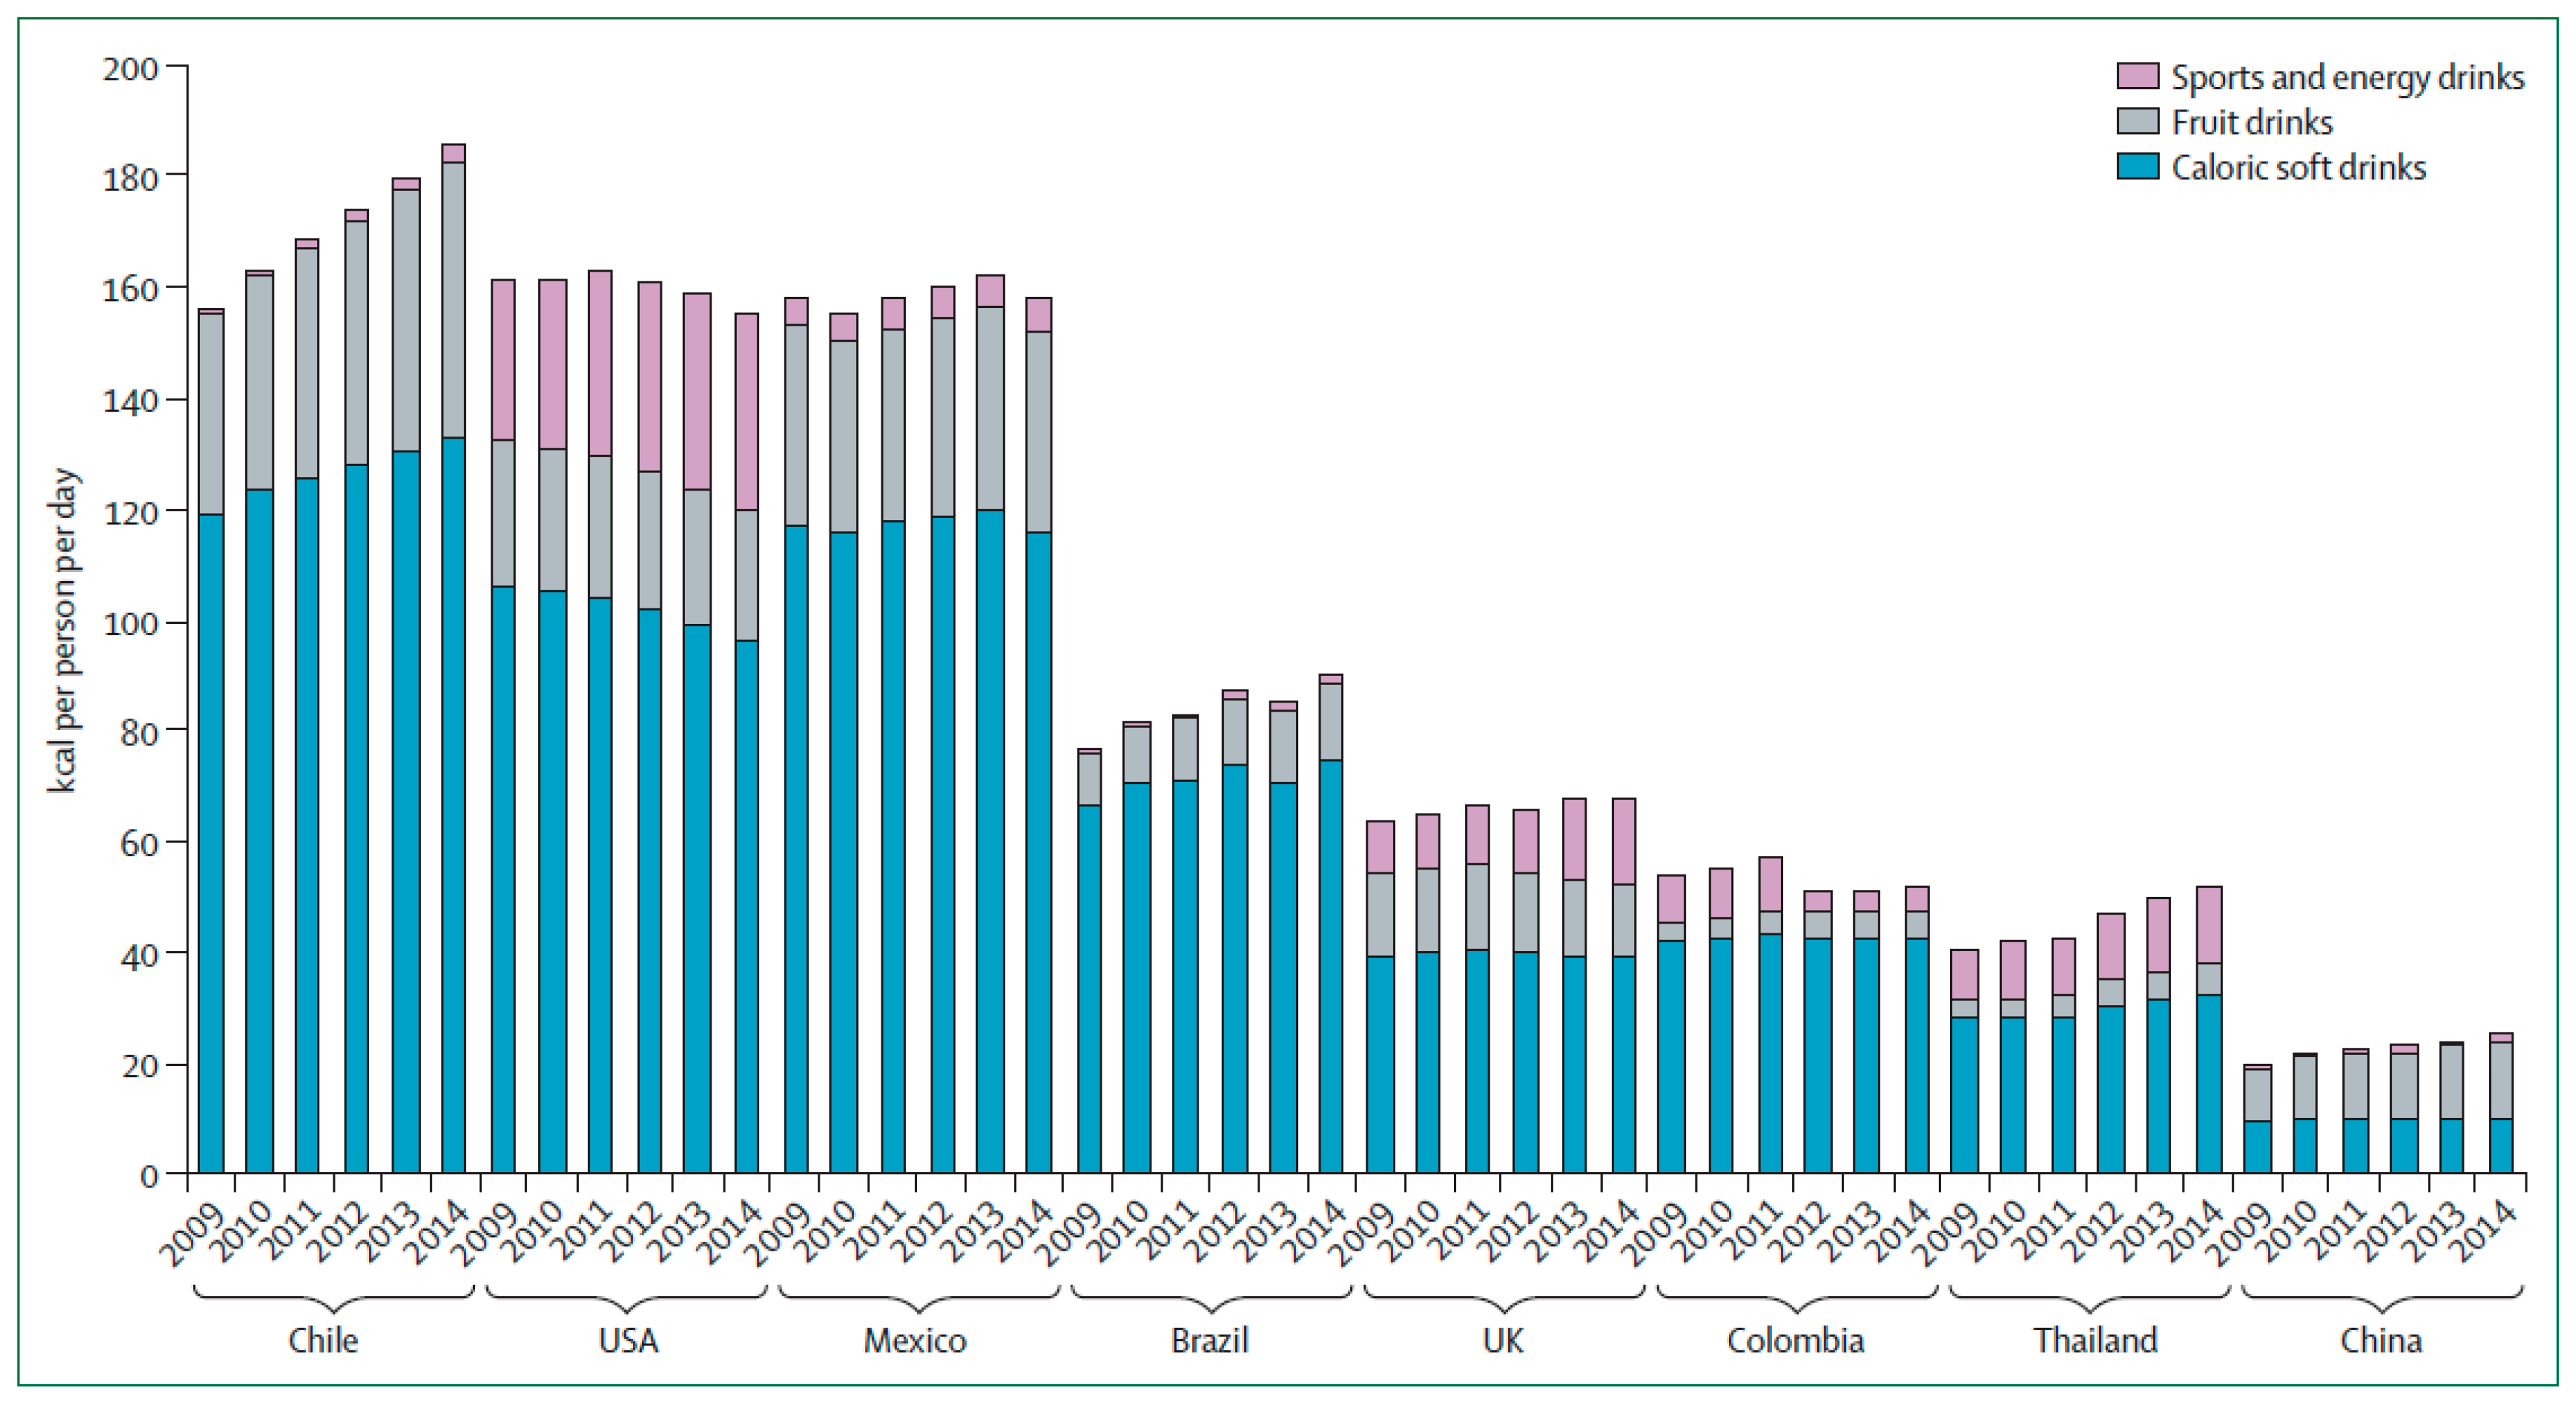
2. SSB Intake Trends
3. Weight Gain and Obesity
4. Metabolic Syndrome and Risk Factors
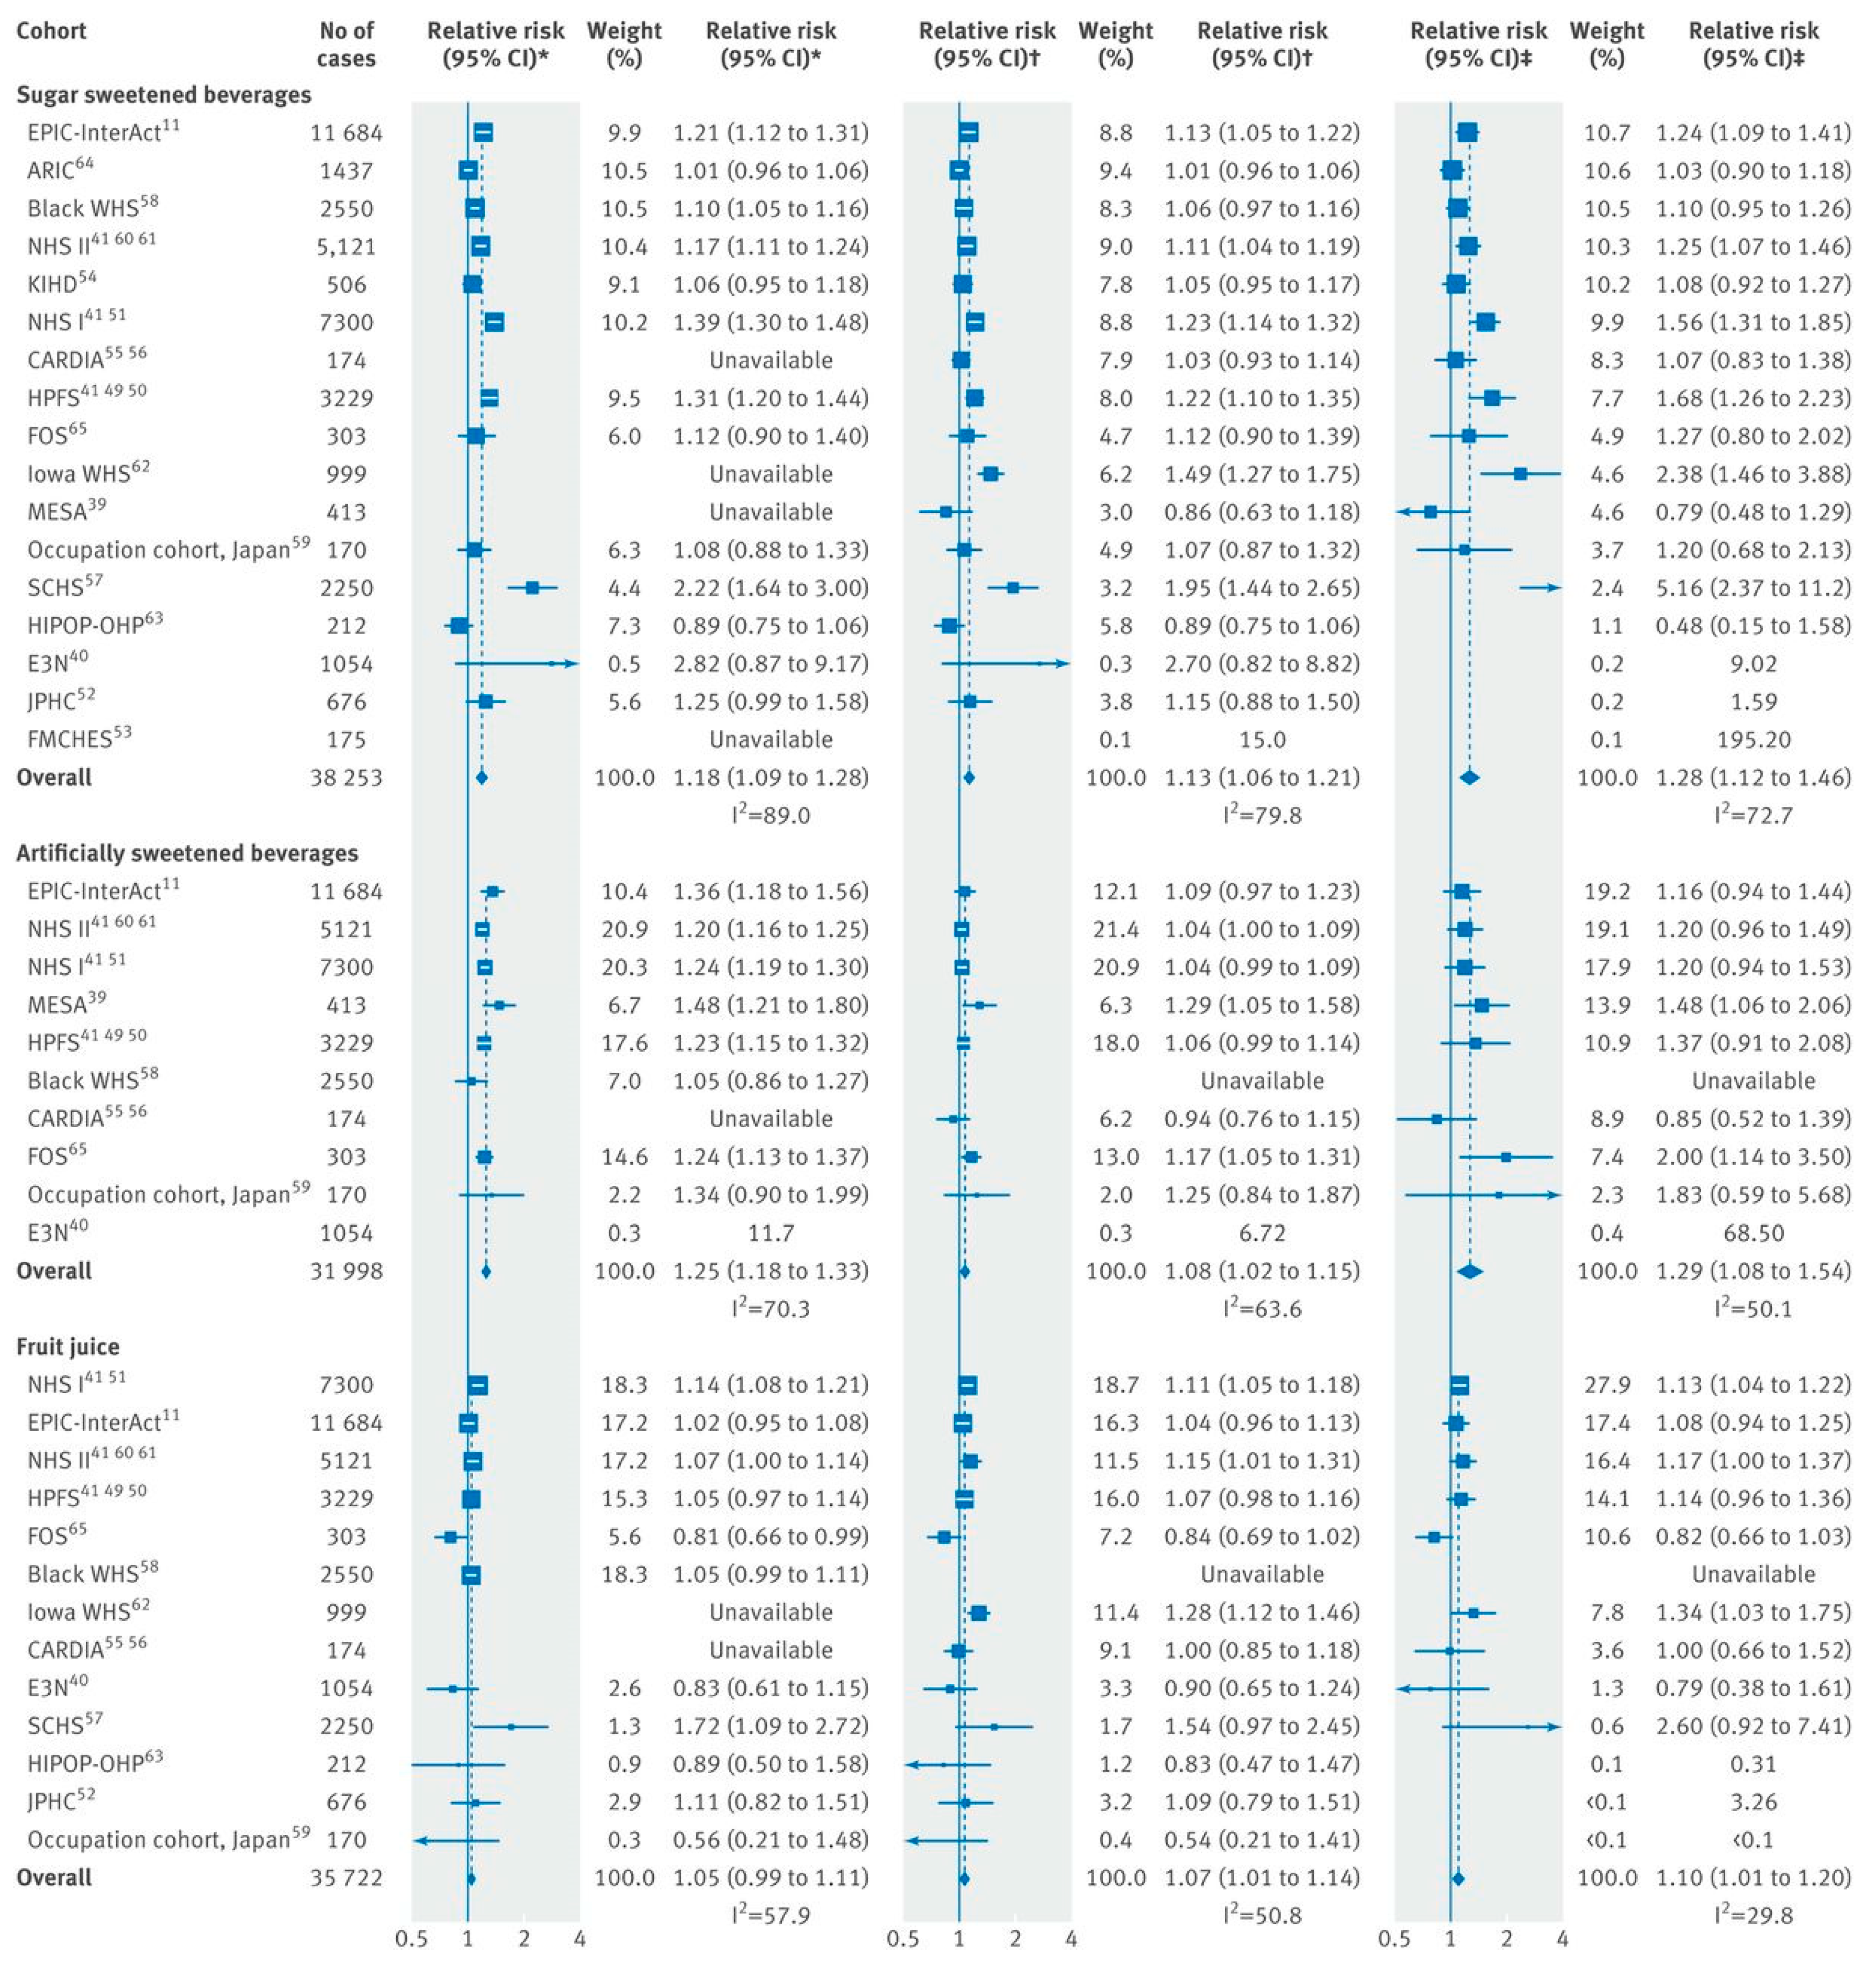
5. Diabetes and CVD
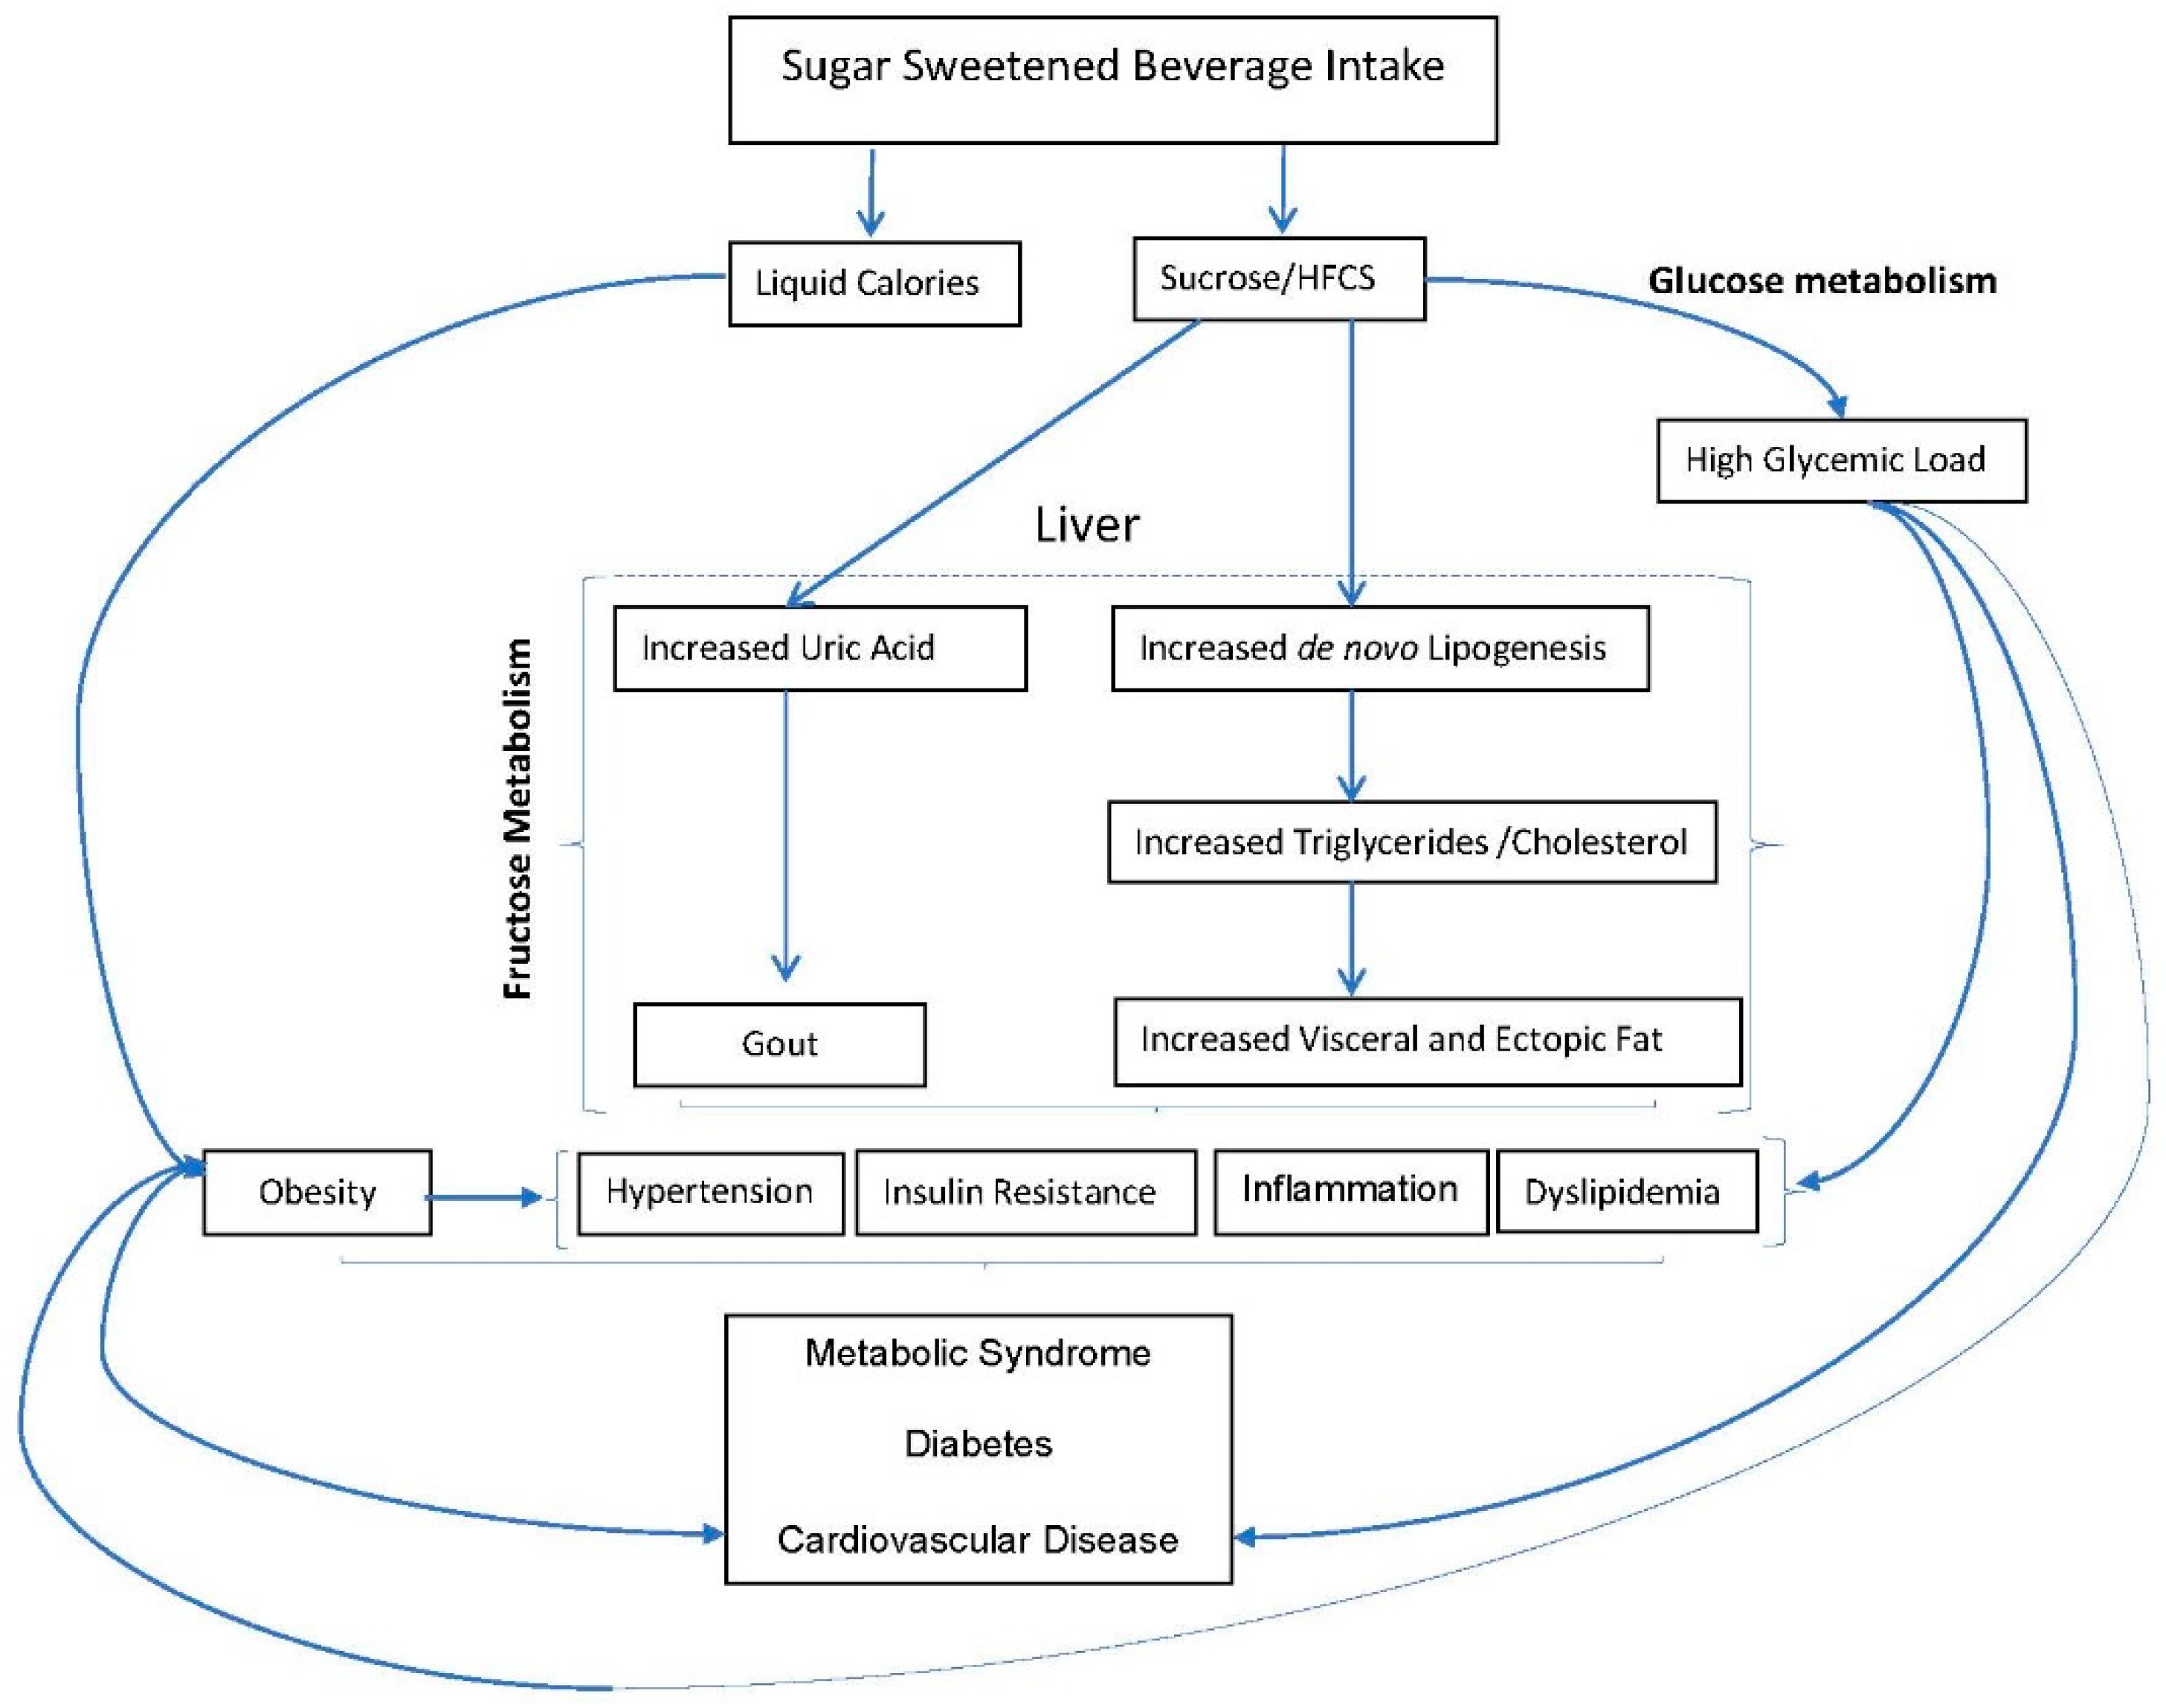
6. Biological Mechanisms
7. Alternative Beverages
8. Policy Considerations
- Governments should impose financial incentives such as taxation of SSBs of at 1east a 10% price increase, and implement limits for use of Supplemental Nutrition Assistance Program (SNAP) benefits for SSBs or subsidizing SNAP purchases of healthier foods, to encourage healthier beverages choices.
- Regulations are needed to reduce exposure to marketing of unhealthy foods and beverages in the media and at sports events or other activities, particularly in relation to children.
- Front-of-package labelling or other nutrition labeling strategies should be implemented to help guide consumers to make healthy food and beverage choices. These changes should be accompanied by concurrent public health awareness campaigns.
- Policies should be adopted to reduce the availability of SSBs in the workplace, healthcare facilities, government institutions, and other public spaces, and ensure access to safe water and healthy alternatives. Policies that make healthful beverages the default choice should also be adopted.
- Educational campaigns about the health risks associated with overconsumption of SSBs should be aimed at healthcare professionals and clinical populations.
- National and international campaigns targeting obesity and chronic disease prevention should include the health risks associated with overconsumption of SSBs.
- National and international dietary recommendations should include specific guidelines for healthy beverage consumption.
9. Conclusions
Author Contributions
Funding
Acknowledgments
Conflicts of Interest
References
- Alberti, K.G.; Eckel, R.H.; Grundy, S.M.; Zimmet, P.Z.; Cleeman, J.I.; Donato, K.A.; Fruchart, J.C.; James, W.P.; Loria, C.M.; Smith, S.C., Jr.; et al. Harmonizing the metabolic syndrome: A joint interim statement of the International Diabetes Federation Task Force on Epidemiology and Prevention; National Heart, Lung, and Blood Institute; American Heart Association; World Heart Federation; International Atherosclerosis Society; and International Association for the Study of Obesity. Circulation 2009, 120, 1640–1645. [Google Scholar] [PubMed]
- Beltran-Sanchez, H.; Harhay, M.O.; Harhay, M.M.; McElligott, S. Prevalence and trends of metabolic syndrome in the adult U.S. population, 1999–2010. J. Am. Coll. Cardiol. 2013, 62, 697–703. [Google Scholar] [CrossRef] [PubMed]
- Saklayen, M.G. The Global Epidemic of the Metabolic Syndrome. Curr. Hypertens. Rep. 2018, 20, 12. [Google Scholar] [CrossRef] [PubMed]
- Palmer, M.K.; Toth, P.P. Trends in Lipids, Obesity, Metabolic Syndrome, and Diabetes Mellitus in the United States: An NHANES Analysis (2003–2004 to 2013–2014). Obesity 2019, 27, 309–314. [Google Scholar] [CrossRef] [PubMed]
- Malik, V.S.; Pan, A.; Willett, W.C.; Hu, F.B. Sugar-sweetened beverages and weight gain in children and adults: A systematic review and meta-analysis. Am. J. Clin. Nutr. 2013, 98, 1084–1102. [Google Scholar] [CrossRef] [PubMed]
- Malik, V.S.; Popkin, B.M.; Bray, G.A.; Despres, J.P.; Willett, W.C.; Hu, F.B. Sugar-sweetened beverages and risk of metabolic syndrome and type 2 diabetes: A meta-analysis. Diabetes Care 2010, 33, 2477–2483. [Google Scholar] [CrossRef] [PubMed]
- Guideline: Sugar Intake for Adults and Children; World Health Organization: Geneva, Switzerland, 2015.
- Fung, T.T.; Malik, V.; Rexrode, K.M.; Manson, J.E.; Willett, W.C.; Hu, F.B. Sweetened beverage consumption and risk of coronary heart disease in women. Am. J. Clin. Nutr. 2009, 89, 1037–1042. [Google Scholar] [CrossRef]
- De Koning, L.; Malik, V.S.; Kellogg, M.D.; Rimm, E.B.; Willett, W.C.; Hu, F.B. Sweetened beverage consumption, incident coronary heart disease, and biomarkers of risk in men. Circulation 2012, 125, 1735–1741. [Google Scholar] [CrossRef]
- Narain, A.; Kwok, C.S.; Mamas, M.A. Soft drinks and sweetened beverages and the risk of cardiovascular disease and mortality: A systematic review and meta-analysis. Int. J. Clin. Pract. 2016, 70, 791–805. [Google Scholar] [CrossRef]
- Huang, C.; Huang, J.; Tian, Y.; Yang, X.; Gu, D. Sugar sweetened beverages consumption and risk of coronary heart disease: A meta-analysis of prospective studies. Atherosclerosis 2014, 234, 11–16. [Google Scholar] [CrossRef]
- Keller, A.; Heitmann, B.L.; Olsen, N. Sugar-sweetened beverages, vascular risk factors and events: A systematic literature review. Public Health Nutr. 2015, 18, 1145–1154. [Google Scholar] [CrossRef] [PubMed]
- Welsh, J.A.; Sharma, A.J.; Grellinger, L.; Vos, M.B. Consumption of added sugars is decreasing in the United States. Am. J. Clin. Nutr. 2011, 94, 726–734. [Google Scholar] [CrossRef] [PubMed]
- Dietary Guidelines for Americans 2015–2020. Available online: http://health.gov/dietaryguidelines/2015/guidelines/ (accessed on 7 August 2019).
- Rosinger, A.; Herrick, K.; Gahche, J.; Park, S. Sugar-sweetened Beverage Consumption Among U.S. Adults, 2011–2014. NCHS Data Brief 2017, 270, 1–8. [Google Scholar]
- Singh, G.M.; Micha, R.; Khatibzadeh, S.; Shi, P.; Lim, S.; Andrews, K.G.; Engell, R.E.; Ezzati, M.; Mozaffarian, D.; Global Burden of Diseases Nutrition and Chronic Diseases Expert Group (NutriCoDE). Global, Regional, and National Consumption of Sugar-Sweetened Beverages, Fruit Juices, and Milk: A Systematic Assessment of Beverage Intake in 187 Countries. PLoS ONE 2015, 10, e0124845. [Google Scholar] [CrossRef] [PubMed]
- Yang, L.; Bovet, P.; Liu, Y.; Zhao, M.; Ma, C.; Liang, Y.; Xi, B. Consumption of Carbonated Soft Drinks Among Young Adolescents Aged 12 to 15 Years in 53 Low- and Middle-Income Countries. Am. J. Public Health 2017, 107, 1095–1100. [Google Scholar] [CrossRef] [PubMed]
- Popkin, B.M.; Hawkes, C. Sweetening of the global diet, particularly beverages: Patterns, trends, and policy responses. Lancet Diabetes Endocrinol. 2016, 4, 174–186. [Google Scholar] [CrossRef]
- Hu, F.B.; Malik, V.S. Sugar-sweetened beverages and risk of obesity and type 2 diabetes: Epidemiologic evidence. Physiol. Behav. 2010, 100, 47–54. [Google Scholar] [CrossRef]
- Malik, V.S.; Popkin, B.M.; Bray, G.A.; Despres, J.P.; Hu, F.B. Sugar-sweetened beverages, obesity, type 2 diabetes mellitus, and cardiovascular disease risk. Circulation 2010, 121, 1356–1364. [Google Scholar] [CrossRef]
- Malik, V.S.; Schulze, M.B.; Hu, F.B. Intake of sugar-sweetened beverages and weight gain: A systematic review. Am. J. Clin. Nutr. 2006, 84, 274–288. [Google Scholar] [CrossRef]
- Vartanian, L.R.; Schwartz, M.B.; Brownell, K.D. Effects of soft drink consumption on nutrition and health: A systematic review and meta-analysis. Am. J. Public Health 2007, 97, 667–675. [Google Scholar] [CrossRef]
- Te Morenga, L.; Mallard, S.; Mann, J. Dietary sugars and body weight: Systematic review and meta-analyses of randomised controlled trials and cohort studies. BMJ 2013, 346, e7492. [Google Scholar] [CrossRef] [PubMed]
- Kaiser, K.A.; Shikany, J.M.; Keating, K.D.; Allison, D.B. Will reducing sugar-sweetened beverage consumption reduce obesity? Evidence supporting conjecture is strong, but evidence when testing effect is weak. Obes. Rev. 2013, 14, 620–633. [Google Scholar] [CrossRef] [PubMed]
- Mozaffarian, D.; Hao, T.; Rimm, E.B.; Willett, W.C.; Hu, F.B. Changes in diet and lifestyle and long-term weight gain in women and men. N. Engl. J. Med. 2011, 364, 2392–2404. [Google Scholar] [CrossRef] [PubMed]
- Qi, Q.; Chu, A.Y.; Kang, J.H.; Jensen, M.K.; Curhan, G.C.; Pasquale, L.R.; Ridker, P.M.; Hunter, D.J.; Willett, W.C.; Rimm, E.B.; et al. Sugar-sweetened beverages and genetic risk of obesity. N. Engl. J. Med. 2012, 367, 1387–1396. [Google Scholar] [CrossRef] [PubMed]
- Ebbeling, C.B.; Feldman, H.A.; Chomitz, V.R.; Antonelli, T.A.; Gortmaker, S.L.; Osganian, S.K.; Ludwig, D. A randomized trial of sugar-sweetened beverages and adolescent body weight. N. Engl. J. Med. 2012, 367, 1407–1416. [Google Scholar] [CrossRef] [PubMed]
- De Ruyter, J.C.; Olthof, M.R.; Seidell, J.C.; Katan, M.B. A trial of sugar-free or sugar-sweetened beverages and body weight in children. N. Engl. J. Med. 2012, 367, 1397–1406. [Google Scholar] [CrossRef] [PubMed]
- Hu, F.B. Resolved: There is sufficient scientific evidence that decreasing sugar-sweetened beverage consumption will reduce the prevalence of obesity and obesity-related diseases. Obes. Rev. 2013, 14, 606–619. [Google Scholar] [CrossRef]
- Narain, A.; Kwok, C.S.; Mamas, M.A. Soft drink intake and the risk of metabolic syndrome: A systematic review and meta-analysis. Int. J. Clin. Pract. 2017, 71, e12927. [Google Scholar] [CrossRef]
- Mirmiran, P.; Yuzbashian, E.; Asghari, G.; Hosseinpour-Niazi, S.; Azizi, F. Consumption of sugar sweetened beverage is associated with incidence of metabolic syndrome in Tehranian children and adolescents. Nutr. Metab. 2015, 12, 25. [Google Scholar] [CrossRef]
- Nettleton, J.A.; Lutsey, P.L.; Wang, Y.; Lima, J.A.; Michos, E.D.; Jacobs, D.R., Jr. Diet soda intake and risk of incident metabolic syndrome and type 2 diabetes in the Multi-Ethnic Study of Atherosclerosis (MESA). Diabetes Care 2009, 32, 688–694. [Google Scholar] [CrossRef]
- Dhingra, R.; Sullivan, L.; Jacques, P.F.; Wang, T.J.; Fox, C.S.; Meigs, J.B.; D’Agostino, R.B.; Gaziano, J.M.; Vasan, R.S. Soft drink consumption and risk of developing cardiometabolic risk factors and the metabolic syndrome in middle-aged adults in the community. Circulation 2007, 116, 480–488. [Google Scholar] [CrossRef] [PubMed]
- Ferreira-Pego, C.; Babio, N.; Bes-Rastrollo, M.; Corella, D.; Estruch, R.; Ros, E.; Fitó, M.; Serra-Majem, L.; Arós, F.; Fiol, M.; et al. Frequent Consumption of Sugar- and Artificially Sweetened Beverages and Natural and Bottled Fruit Juices Is Associated with an Increased Risk of Metabolic Syndrome in a Mediterranean Population at High Cardiovascular Disease Risk. J. Nutr. 2016, 146, 1528–1536. [Google Scholar] [PubMed]
- Kang, Y.; Kim, J. Soft drink consumption is associated with increased incidence of the metabolic syndrome only in women. Br. J. Nutr. 2017, 117, 315–324. [Google Scholar] [CrossRef] [PubMed]
- Lutsey, P.L.; Steffen, L.M.; Stevens, J. Dietary intake and the development of the metabolic syndrome: The Atherosclerosis Risk in Communities study. Circulation 2008, 117, 754–761. [Google Scholar] [CrossRef] [PubMed]
- Duffey, K.J.; Gordon-Larsen, P.; Steffen, L.M.; Jacobs, D.R., Jr.; Popkin, B.M. Drinking caloric beverages increases the risk of adverse cardiometabolic outcomes in the Coronary Artery Risk Development in Young Adults (CARDIA) Study. Am. J. Clin. Nutr. 2010, 92, 954–959. [Google Scholar] [CrossRef] [PubMed]
- Stern, D.; Middaugh, N.; Rice, M.S.; Laden, F.; Lopez-Ridaura, R.; Rosner, B.; Willett, W.; Lajous, M. Changes in Sugar-Sweetened Soda Consumption, Weight, and Waist Circumference: 2-Year Cohort of Mexican Women. Am. J. Public Health 2017, 107, 1801–1808. [Google Scholar] [CrossRef]
- Funtikova, A.N.; Subirana, I.; Gomez, S.F.; Fito, M.; Elosua, R.; Benitez-Arciniega, A.A.; Schröder, H. Soft drink consumption is positively associated with increased waist circumference and 10-year incidence of abdominal obesity in Spanish adults. J. Nutr. 2015, 145, 328–334. [Google Scholar] [CrossRef]
- Ma, J.; McKeown, N.M.; Hwang, S.J.; Hoffmann, U.; Jacques, P.F.; Fox, C.S. Sugar-Sweetened Beverage Consumption Is Associated With Change of Visceral Adipose Tissue Over 6 Years of Follow-Up. Circulation 2016, 133, 370–377. [Google Scholar] [CrossRef]
- Yu, Z.; Ley, S.H.; Sun, Q.; Hu, F.B.; Malik, V.S. Cross-sectional association between sugar-sweetened beverage intake and cardiometabolic biomarkers in US women. Br. J. Nutr. 2018, 119, 570–580. [Google Scholar] [CrossRef]
- Kim, Y.; Je, Y. Prospective association of sugar-sweetened and artificially sweetened beverage intake with risk of hypertension. Arch. Cardiovasc. Dis. 2016, 109, 242–253. [Google Scholar] [CrossRef]
- Jayalath, V.H.; de Souza, R.J.; Ha, V.; Mirrahimi, A.; Blanco-Mejia, S.; Di Buono, M.; Jenkins, A.L.; Leiter, L.A.; Wolever, T.; Beyene, J.; et al. Sugar-sweetened beverage consumption and incident hypertension: A systematic review and meta-analysis of prospective cohorts. Am. J. Clin. Nutr. 2015, 102, 914–921. [Google Scholar] [CrossRef] [PubMed]
- Xi, B.; Huang, Y.; Reilly, K.H.; Li, S.; Zheng, R.; Barrio-Lopez, M.T.; Martinez-Gonzalez, M.A.; Zhou, D. Sugar-sweetened beverages and risk of hypertension and CVD: A dose-response meta-analysis. Br. J. Nutr. 2015, 113, 709–717. [Google Scholar] [CrossRef] [PubMed]
- Choi, H.K.; Curhan, G. Soft drinks, fructose consumption, and the risk of gout in men: Prospective cohort study. BMJ 2008, 336, 309–312. [Google Scholar] [CrossRef] [PubMed]
- Choi, H.K.; Willett, W.; Curhan, G. Fructose-rich beverages and risk of gout in women. JAMA 2010, 304, 2270–2278. [Google Scholar] [CrossRef] [PubMed]
- Te Morenga, L.A.; Howatson, A.J.; Jones, R.M.; Mann, J. Dietary sugars and cardiometabolic risk: Systematic review and meta-analyses of randomized controlled trials of the effects on blood pressure and lipids. Am. J. Clin. Nutr. 2014, 100, 65–79. [Google Scholar] [CrossRef] [PubMed]
- Stanhope, K.L.; Medici, V.; Bremer, A.A.; Lee, V.; Lam, H.D.; Nunez, M.V.; Chen, G.X.; Keim, N.L.; Havel, P.J. A dose-response study of consuming high-fructose corn syrup-sweetened beverages on lipid/lipoprotein risk factors for cardiovascular disease in young adults. Am. J. Clin. Nutr. 2015, 101, 1144–1154. [Google Scholar] [CrossRef]
- Bruun, J.M.; Maersk, M.; Belza, A.; Astrup, A.; Richelsen, B. Consumption of sucrose-sweetened soft drinks increases plasma levels of uric acid in overweight and obese subjects: A 6-month randomised controlled trial. Eur. J. Clin. Nutr. 2015, 69, 949–953. [Google Scholar] [CrossRef]
- Raben, A.; Moller, B.K.; Flint, A.; Vasilaris, T.H.; Christina Moller, A.; Juul Holst, J.; Astrup, A. Increased postprandial glycaemia, insulinemia, and lipidemia after 10 weeks’ sucrose-rich diet compared to an artificially sweetened diet: A Randomised controlled trial. Food Nutr. Res. 2011, 55, 5961. [Google Scholar] [CrossRef]
- Aeberli, I.; Gerber, P.A.; Hochuli, M.; Kohler, S.; Haile, S.R.; Gouni-Berthold, I.; Berthold, H.K.; Spinas, G.A.; Berneis, K. Low to moderate sugar-sweetened beverage consumption impairs glucose and lipid metabolism and promotes inflammation in healthy young men: A randomized controlled trial. Am. J. Clin. Nutr. 2011, 94, 479–485. [Google Scholar] [CrossRef]
- Sorensen, L.B.; Raben, A.; Stender, S.; Astrup, A. Effect of sucrose on inflammatory markers in overweight humans. Am. J. Clin. Nutr. 2005, 82, 421–427. [Google Scholar] [CrossRef]
- Kuzma, J.N.; Cromer, G.; Hagman, D.K.; Breymeyer, K.L.; Roth, C.L.; Foster-Schubert, K.E.; Holte, S.E.; Weigle, D.S.; Kratz, M. No differential effect of beverages sweetened with fructose, high-fructose corn syrup, or glucose on systemic or adipose tissue inflammation in normal-weight to obese adults: A randomized controlled trial. Am. J. Clin. Nutr. 2016, 104, 306–314. [Google Scholar] [CrossRef] [PubMed]
- Imamura, F.; O’Connor, L.; Ye, Z.; Mursu, J.; Hayashino, Y.; Bhupathiraju, S.N.; Forouhi, N.G. Consumption of sugar sweetened beverages, artificially sweetened beverages, and fruit juice and incidence of type 2 diabetes: Systematic review, meta-analysis, and estimation of population attributable fraction. Br. J. Sports Med. 2016, 50, 496–504. [Google Scholar] [CrossRef] [PubMed]
- Fagherazzi, G.; Vilier, A.; Saes Sartorelli, D.; Lajous, M.; Balkau, B.; Clavel-Chapelon, F. Consumption of artificially and sugar-sweetened beverages and incident type 2 diabetes in the Etude Epidemiologique aupres des femmes de la Mutuelle Generale de l’Education Nationale-European Prospective Investigation into Cancer and Nutrition cohort. Am. J. Clin. Nutr. 2013, 97, 517–523. [Google Scholar] [PubMed]
- Consumption of sweet beverages and type 2 diabetes incidence in European adults: Results from EPIC-InterAct. Diabetologia 2013, 56, 1520–1530. [CrossRef] [PubMed]
- Stern, D.; Mazariegos, M.; Ortiz-Panozo, E.; Campos, H.; Malik, V.S.; Lajous, M.; López-Ridaura, R. Sugar-Sweetened Soda Consumption Increases Diabetes Risk Among Mexican Women. J. Nutr. 2019, 149, 795–803. [Google Scholar] [CrossRef] [PubMed]
- Gardener, H.; Moon, Y.P.; Rundek, T.; Elkind, M.S.V.; Sacco, R.L. Diet Soda and Sugar-Sweetened Soda Consumption in Relation to Incident Diabetes in the Northern Manhattan Study. Curr. Dev. Nutr. 2018, 2, nzy008. [Google Scholar] [CrossRef] [PubMed]
- Malik, V.S.; Li, Y.; Pan, A.; De Koning, L.; Schernhammer, E.; Willett, W.C.; Hu, F.B. Long-Term Consumption of Sugar-Sweetened and Artificially Sweetened Beverages and Risk of Mortality in US Adults. Circulation 2019, 139, 2113–2125. [Google Scholar] [CrossRef] [PubMed]
- Yang, Q.; Zhang, Z.; Gregg, E.W.; Flanders, W.D.; Merritt, R.; Hu, F.B. Added Sugar Intake and Cardiovascular Diseases Mortality Among US Adults. JAMA Intern Med. 2014, 174, 516–524. [Google Scholar] [CrossRef] [PubMed]
- Micha, R.; Penalvo, J.L.; Cudhea, F.; Imamura, F.; Rehm, C.D.; Mozaffarian, D. Association Between Dietary Factors and Mortality From Heart Disease, Stroke, and Type 2 Diabetes in the United States. JAMA 2017, 317, 912–924. [Google Scholar] [CrossRef] [PubMed]
- Collin, L.J.; Judd, S.; Safford, M.; Vaccarino, V.; Welsh, J.A. Association of Sugary Beverage Consumption With Mortality Risk in US Adults: A Secondary Analysis of Data from the REGARDS Study. JAMA Netw. Open 2019, 2, e193121. [Google Scholar] [CrossRef] [PubMed]
- Odegaard, A.O.; Koh, W.P.; Yuan, J.M.; Pereira, M.A. Beverage habits and mortality in Chinese adults. J. Nutr. 2015, 145, 595–604. [Google Scholar] [CrossRef] [PubMed]
- Paganini-Hill, A.; Kawas, C.H.; Corrada, M.M. Non-alcoholic beverage and caffeine consumption and mortality: The Leisure World Cohort Study. Prev. Med. 2007, 44, 305–310. [Google Scholar] [CrossRef] [PubMed]
- Malik, V.S.; Hu, F.B. Sweeteners and Risk of Obesity and Type 2 Diabetes: The Role of Sugar-Sweetened Beverages. Curr. Diab. Rep. 2012, 12, 195–203. [Google Scholar] [CrossRef] [PubMed]
- DellaValle, D.M.; Roe, L.S.; Rolls, B.J. Does the consumption of caloric and non-caloric beverages with a meal affect energy intake? Appetite 2005, 44, 187–193. [Google Scholar] [CrossRef] [PubMed]
- Raben, A.; Vasilaras, T.H.; Moller, A.C.; Astrup, A. Sucrose compared with artificial sweeteners: Different effects on ad libitum food intake and body weight after 10 wk of supplementation in overweight subjects. Am. J. Clin. Nutr. 2002, 76, 721–729. [Google Scholar] [CrossRef] [PubMed]
- Tordoff, M.G.; Alleva, A.M. Effect of drinking soda sweetened with aspartame or high-fructose corn syrup on food intake and body weight. Am. J. Clin. Nutr. 1990, 51, 963–969. [Google Scholar] [CrossRef] [PubMed]
- Reid, M.; Hammersley, R.; Hill, A.J.; Skidmore, P. Long-term dietary compensation for added sugar: Effects of supplementary sucrose drinks over a 4-week period. Br. J. Nutr. 2007, 97, 193–203. [Google Scholar] [CrossRef]
- DiMeglio, D.P.; Mattes, R.D. Liquid versus solid carbohydrate: Effects on food intake and body weight. Int. J. Obes. Relat. Metab. Disord. 2000, 24, 794–800. [Google Scholar] [CrossRef]
- Pan, A.; Hu, F.B. Effects of carbohydrates on satiety: Differences between liquid and solid food. Curr. Opin. Clin. Nutr. Metab. Care 2011, 14, 385–390. [Google Scholar] [CrossRef]
- Mourao, D.M.; Bressan, J.; Campbell, W.W.; Mattes, R.D. Effects of food form on appetite and energy intake in lean and obese young adults. Int. J. Obes. 2007, 31, 1688–1695. [Google Scholar] [CrossRef]
- Tey, S.L.; Salleh, N.B.; Henry, J.; Forde, C.G. Effects of aspartame-, monk fruit-, stevia- and sucrose-sweetened beverages on postprandial glucose, insulin and energy intake. Int. J. Obes. 2017, 41, 450–457. [Google Scholar] [CrossRef] [PubMed]
- Solomi, L.; Rees, G.A.; Redfern, K.M. The acute effects of the non-nutritive sweeteners aspartame and acesulfame-K in UK diet cola on glycaemic response. Int. J. Food Sci. Nutr. 2019, 1–7. [Google Scholar] [CrossRef] [PubMed]
- Atkinson, F.S.; Foster-Powell, K.; Brand-Miller, J.C. International tables of glycemic index and glycemic load values: 2008. Diabetes Care 2008, 31, 2281–2283. [Google Scholar] [CrossRef] [PubMed]
- Ludwig, D.S. The glycemic index: Physiological mechanisms relating to obesity, diabetes, and cardiovascular disease. JAMA 2002, 287, 2414–2423. [Google Scholar] [CrossRef] [PubMed]
- Liu, S.; Manson, J.E.; Buring, J.E.; Stampfer, M.J.; Willett, W.C.; Ridker, P.M. Relation between a diet with a high glycemic load and plasma concentrations of high-sensitivity C-reactive protein in middle-aged women. Am. J. Clin. Nutr. 2002, 75, 492–498. [Google Scholar] [CrossRef] [PubMed]
- Bhupathiraju, S.N.; Tobias, D.K.; Malik, V.S.; Pan, A.; Hruby, A.; Manson, J.E.; Willett, W.C.; Hu, F.B. Glycemic index, glycemic load, and risk of type 2 diabetes: Results from 3 large US cohorts and an updated meta-analysis. Am. J. Clin. Nutr. 2014, 100, 218–232. [Google Scholar] [CrossRef] [PubMed]
- Livesey, G.; Taylor, R.; Livesey, H.F.; Buyken, A.E.; Jenkins, D.J.A.; Augustin, L.S.A.; Sievenpiper, J.L.; Barclay, A.W.; Liu, S.; Wolever, T.M.S.; et al. Dietary Glycemic Index and Load and the Risk of Type 2 Diabetes: A Systematic Review and Updated Meta-Analyses of Prospective Cohort Studies. Nutrients 2019, 11, 1280. [Google Scholar] [CrossRef]
- Livesey, G.; Livesey, H. Coronary Heart Disease and Dietary Carbohydrate, Glycemic Index, and Glycemic Load: Dose-Response Meta-analyses of Prospective Cohort Studies. Mayo Clin. Proc. Innov. Qual. Outcomes 2019, 3, 52–69. [Google Scholar] [CrossRef]
- Sun, S.Z.; Empie, M.W. Fructose metabolism in humans—What isotopic tracer studies tell us. Nutr. Metab. (London) 2012, 9, 89. [Google Scholar] [CrossRef]
- Goran, M.I.; Tappy, L.; Lê, K.A. Dietary Sugars and Health; CRC Press, Taylor & Francis Group: Boca Raton, FL, USA, 2015. [Google Scholar]
- Teff, K.L.; Grudziak, J.; Townsend, R.R.; Dunn, T.N.; Grant, R.W.; Adams, S.H.; Keim, N.L.; Cummings, B.P.; Stanhope, K.L.; Havel, P.J. Endocrine and metabolic effects of consuming fructose- and glucose-sweetened beverages with meals in obese men and women: Influence of insulin resistance on plasma triglyceride responses. J. Clin. Endocrinol. Metab. 2009, 94, 1562–1569. [Google Scholar] [CrossRef]
- Stanhope, K.L.; Schwarz, J.M.; Keim, N.L.; Griffen, S.C.; Bremer, A.A.; Graham, J.L.; Hatcher, B.; Cox, C.L.; Dyachenko, A.; Zhang, W.; et al. Consuming fructose-sweetened, not glucose-sweetened, beverages increases visceral adiposity and lipids and decreases insulin sensitivity in overweight/obese humans. J. Clin. Investig. 2009, 119, 1322–1334. [Google Scholar] [CrossRef] [PubMed]
- Stanhope, K.L.; Griffen, S.C.; Bair, B.R.; Swarbrick, M.M.; Keim, N.L.; Havel, P.J. Twenty-four-hour endocrine and metabolic profiles following consumption of high-fructose corn syrup-, sucrose-, fructose-, and glucose-sweetened beverages with meals. Am. J. Clin. Nutr. 2008, 87, 1194–1203. [Google Scholar] [CrossRef] [PubMed]
- Stanhope, K.L.; Havel, P.J. Endocrine and metabolic effects of consuming beverages sweetened with fructose, glucose, sucrose, or high-fructose corn syrup. Am. J. Clin. Nutr. 2008, 88, 1733S–1737S. [Google Scholar] [CrossRef] [PubMed]
- Tappy, L.; Rosset, R. Health outcomes of a high fructose intake: The importance of physical activity. J. Physiol. 2019, 597, 3561–3571. [Google Scholar] [CrossRef] [PubMed]
- Richette, P.; Bardin, T. Gout. Lancet 2009. [Google Scholar] [CrossRef]
- Nakagawa, T.; Tuttle, K.R.; Short, R.A.; Johnson, R.J. Hypothesis: Fructose-induced hyperuricemia as a causal mechanism for the epidemic of the metabolic syndrome. Nat. Clin. Pract. Nephrol. 2005, 1, 80–86. [Google Scholar] [CrossRef] [PubMed]
- Pan, A.; Malik, V.S.; Hao, T.; Willett, W.C.; Mozaffarian, D.; Hu, F.B. Changes in water and beverage intake and long-term weight changes: Results from three prospective cohort studies. Int. J. Obes. 2013, 37, 1378. [Google Scholar] [CrossRef] [PubMed]
- Pan, A.; Malik, V.S.; Schulze, M.B.; Manson, J.E.; Willett, W.C.; Hu, F.B. Plain-water intake and risk of type 2 diabetes in young and middle-aged women. Am. J. Clin. Nutr. 2012, 95, 1454–1460. [Google Scholar] [CrossRef] [PubMed]
- Schulze, M.B.; Manson, J.E.; Ludwig, D.S.; Colditz, G.A.; Stampfer, M.J.; Willett, W.C.; Hu, F.B. Sugar-sweetened beverages, weight gain, and incidence of type 2 diabetes in young and middle-aged women. JAMA 2004, 292, 927–934. [Google Scholar] [CrossRef]
- Bazzano, L.A.; Li, T.Y.; Joshipura, K.J.; Hu, F.B. Intake of fruit, vegetables, and fruit juices and risk of diabetes in women. Diabetes Care 2008, 31, 1311–1317. [Google Scholar] [CrossRef]
- Muraki, I.; Imamura, F.; Manson, J.E.; Hu, F.B.; Willett, W.C.; van Dam, R.M.; Sun, Q. Fruit consumption and risk of type 2 diabetes: Results from three prospective longitudinal cohort studies. BMJ 2013, 347, f5001. [Google Scholar] [CrossRef] [PubMed]
- Ravn-Haren, G.; Dragsted, L.O.; Buch-Andersen, T.; Jensen, E.N.; Jensen, R.I.; Nemeth-Balogh, M.; Paulovicsová, B.; Bergström, A.; Wilcks, A.; Licht, T.R.; et al. Intake of whole apples or clear apple juice has contrasting effects on plasma lipids in healthy volunteers. Eur. J. Nutr. 2013, 52, 1875–1889. [Google Scholar] [CrossRef] [PubMed]
- Pepin, A.; Stanhope, K.L.; Imbeault, P. Are Fruit Juices Healthier Than Sugar-Sweetened Beverages? A Review. Nutrients 2019, 11, 1006. [Google Scholar] [CrossRef] [PubMed]
- Sundborn, G.; Thornley, S.; Merriman, T.R.; Lang, B.; King, C.; Lanaspa, M.A.; Johnson, R.J. Are Liquid Sugars Different from Solid Sugar in Their Ability to Cause Metabolic Syndrome? Obesity 2019, 27, 879–887. [Google Scholar] [CrossRef] [PubMed]
- Lanaspa, M.A.; Sanchez-Lozada, L.G.; Choi, Y.J.; Cicerchi, C.; Kanbay, M.; Roncal-Jimenez, C.A.; Schreiner, G. Uric acid induces hepatic steatosis by generation of mitochondrial oxidative stress: Potential role in fructose-dependent and -independent fatty liver. J. Biol. Chem. 2012, 287, 40732–40744. [Google Scholar] [CrossRef] [PubMed]
- Ghanim, H.; Mohanty, P.; Pathak, R.; Chaudhuri, A.; Sia, C.L.; Dandona, P. Orange juice or fructose intake does not induce oxidative and inflammatory response. Diabetes Care 2007, 30, 1406–1411. [Google Scholar] [CrossRef] [PubMed]
- Van Dam, R.M. Coffee consumption and risk of type 2 diabetes, cardiovascular diseases, and cancer. Appl. Physiol. Nutr. Metab. 2008, 33, 1269–1283. [Google Scholar] [CrossRef]
- Bhupathiraju, S.N.; Pan, A.; Malik, V.S.; Manson, J.E.; Willett, W.C.; van Dam, R.M.; Hu, F.B. Caffeinated and caffeine-free beverages and risk of type 2 diabetes. Am. J. Clin. Nutr. 2013, 97, 155–166. [Google Scholar] [CrossRef]
- De Koning, L.; Malik, V.S.; Rimm, E.B.; Willett, W.C.; Hu, F.B. Sugar-sweetened and artificially sweetened beverage consumption and risk of type 2 diabetes in men. Am. J. Clin. Nutr. 2011, 93, 1321–1327. [Google Scholar] [CrossRef]
- Malik, V.S. Non-sugar sweeteners and health. BMJ 2019, 364, k5005. [Google Scholar] [CrossRef]
- Swithers, S.E. Not so Sweet Revenge: Unanticipated Consequences of High-Intensity Sweeteners. Behav. Anal. 2015, 38, 1–17. [Google Scholar] [CrossRef] [PubMed]
- Yale Rudd Center for Food Policy and Obesity. SUgar-Sweetened Beverage Taxes and Sugar Intake: Policy Statements, Endorsements, and Recommendations. Available online: http://www.yaleruddcenter.org/resources/upload/docs/what/policy/SSBtaxes/SSBTaxStatements.pdf (accessed on 10 January 2013).
- Muth, N.D.; Dietz, W.H.; Magge, S.N.; Johnson, R.K.; American Academy Of Pediatrics; Section On Obesity; Committee On Nutrition; American Heart Association. Public Policies to Reduce Sugary Drink Consumption in Children and Adolescents. Pediatrics 2019, 143, e20190282. [Google Scholar] [CrossRef] [PubMed]
- Colchero, M.A.; Rivera-Dommarco, J.; Popkin, B.M.; Ng, S.W. In Mexico, Evidence Of Sustained Consumer Response Two Years After Implementing A Sugar-Sweetened Beverage Tax. Health Aff. 2017, 36, 564–571. [Google Scholar] [CrossRef] [PubMed]
- Sanchez-Romero, L.M.; Penko, J.; Coxson, P.G.; Fernandez, A.; Mason, A.; Moran, A.E.; Ávila-Burgos, L.; Odden, M.; Barquera, S.; Bibbins-Domingo, K. Projected Impact of Mexico’s Sugar-Sweetened Beverage Tax Policy on Diabetes and Cardiovascular Disease: A Modeling Study. PLoS Med. 2016, 13, e1002158. [Google Scholar] [CrossRef] [PubMed]
- Silver, L.D.; Ng, S.W.; Ryan-Ibarra, S.; Taillie, L.S.; Induni, M.; Miles, D.R.; Poti, J.M.; Popkin, B.M. Changes in prices, sales, consumer spending, and beverage consumption one year after a tax on sugar-sweetened beverages in Berkeley, California, US: A before-and-after study. PLoS Med. 2017, 14, e1002283. [Google Scholar] [CrossRef] [PubMed]


© 2019 by the authors. Licensee MDPI, Basel, Switzerland. This article is an open access article distributed under the terms and conditions of the Creative Commons Attribution (CC BY) license (http://creativecommons.org/licenses/by/4.0/).
Share and Cite
Malik, V.S.; Hu, F.B. Sugar-Sweetened Beverages and Cardiometabolic Health: An Update of the Evidence. Nutrients 2019, 11, 1840. https://doi.org/10.3390/nu11081840
Malik VS, Hu FB. Sugar-Sweetened Beverages and Cardiometabolic Health: An Update of the Evidence. Nutrients. 2019; 11(8):1840. https://doi.org/10.3390/nu11081840
Chicago/Turabian StyleMalik, Vasanti S., and Frank B. Hu. 2019. "Sugar-Sweetened Beverages and Cardiometabolic Health: An Update of the Evidence" Nutrients 11, no. 8: 1840. https://doi.org/10.3390/nu11081840
APA StyleMalik, V. S., & Hu, F. B. (2019). Sugar-Sweetened Beverages and Cardiometabolic Health: An Update of the Evidence. Nutrients, 11(8), 1840. https://doi.org/10.3390/nu11081840