Energy Expenditure, Carbohydrate Oxidation and Appetitive Responses to Sucrose or Sucralose in Humans: A Pilot Study


Abstract
1. Introduction
2. Materials and Methods
2.1. Study Design
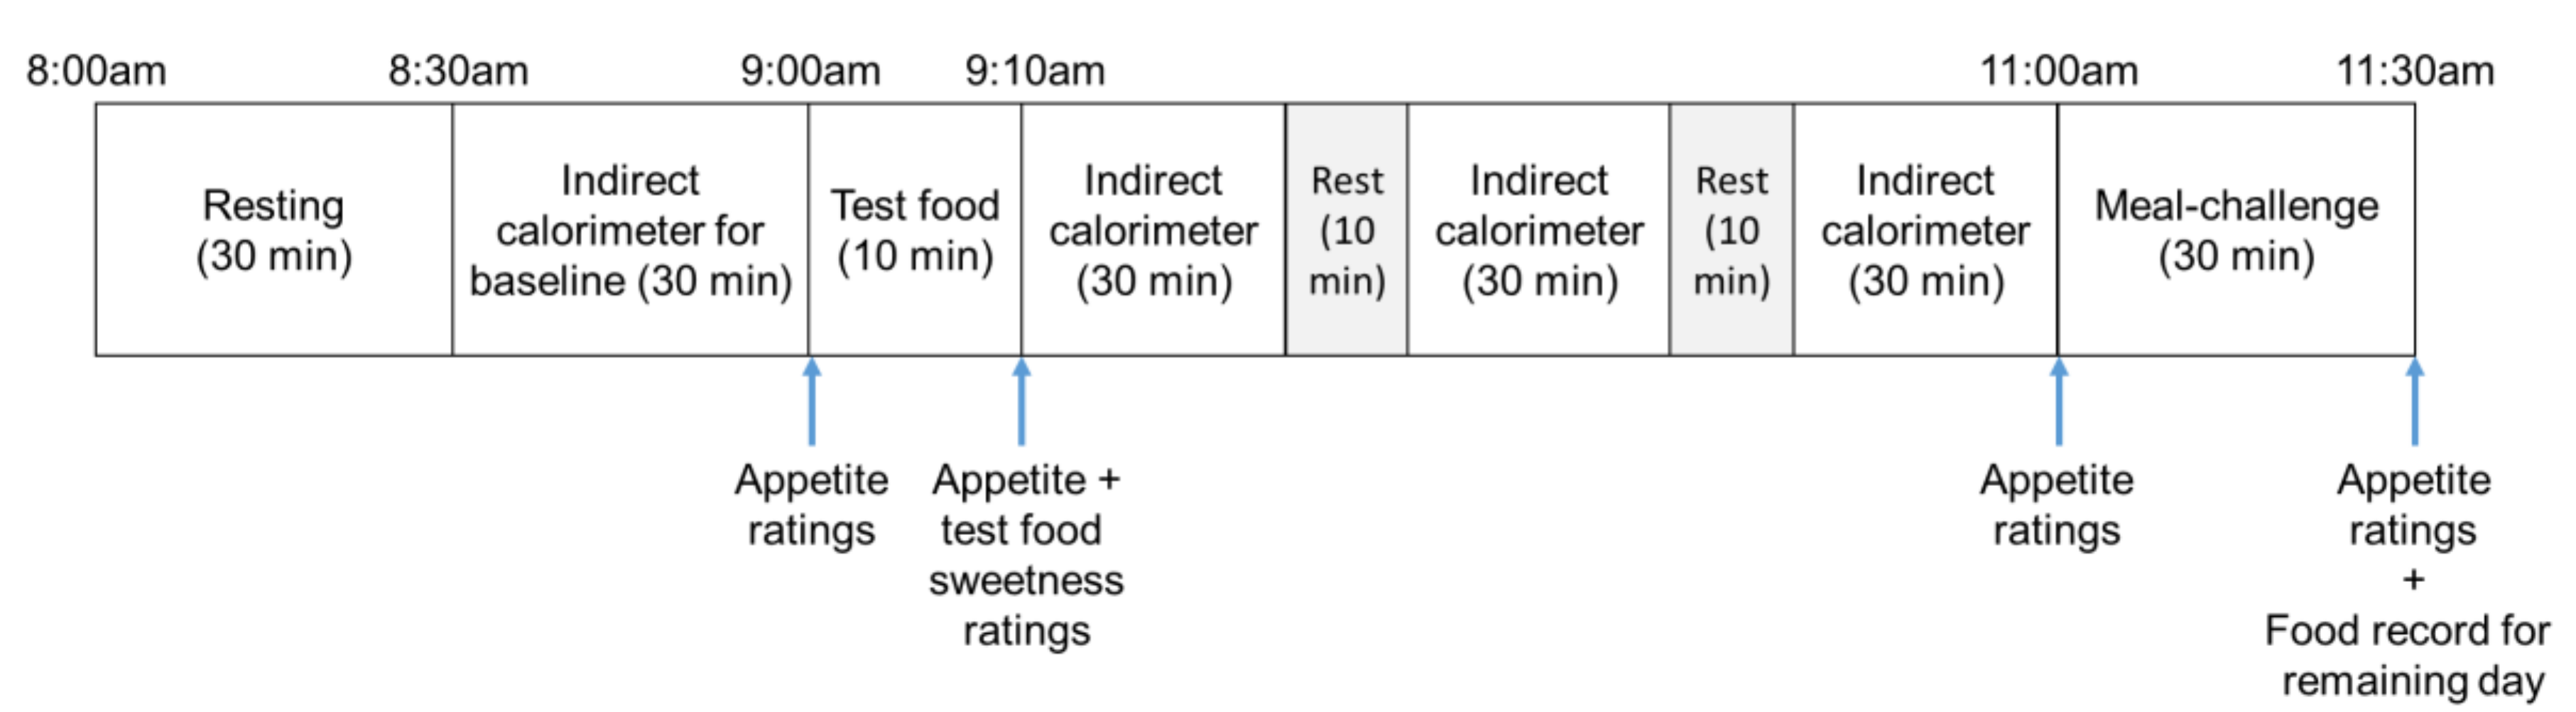
2.2. Experimental Protocol
2.3. Study Participants
2.4. Study Test Foods
2.5. Measures
2.6. Statistical Analysis
3. Results
4. Discussion
5. Conclusions
Author Contributions
Funding
Acknowledgments
Conflicts of Interest
References
- Flegal, K.M.; Caroll, M.D.; Ogden, C.L.; Curtin, L.R. Prevalence and trends in obesity among us adults, 1999–2008. JAMA 2010, 303, 235–241. [Google Scholar] [CrossRef] [PubMed]
- Mokdad, A.H.; Ford, E.S.; Bowman, B.A.; Dietz, W.H.; Vinicor, F.; Bales, V.S.; Marks, J.S. Prevalence of obesity, diabetes, and obesity-related health risk factors, 2001. JAMA 2003, 289, 76–79. [Google Scholar] [CrossRef] [PubMed]
- Vandevijvere, S.; Chow, C.C.; Hall, K.D.; Umali, E.; Swinburn, B.A. Increased food energy supply as a major driver of the obesity epidemic: A global analysis. Bull. WHO 2015, 93, 446–456. [Google Scholar] [CrossRef] [PubMed]
- Johnson, R.J.; Segal, M.S.; Sautin, Y.; Nakagawa, T.; Feig, D.I.; Kang, D.-H.; Gersch, M.S.; Benner, S.; Sánchez-Lozada, L.G. Potential role of sugar (fructose) in the epidemic of hypertension, obesity and the metabolic syndrome, diabetes, kidney disease, and cardiovascular disease. Am. J. Clin. Nutr. 2007, 86, 899–906. [Google Scholar] [PubMed]
- Gulati, S.; Misra, A. Sugar intake, obesity, and diabetes in India. Nutrients 2014, 6, 5955–5974. [Google Scholar] [CrossRef] [PubMed]
- Hu, F.B. Resolved: There is sufficient scientific evidence that decreasing sugar-sweetened beverage consumption will reduce the prevalence of obesity and obesity-related diseases. Obes. Rev. 2013, 14, 606–619. [Google Scholar] [CrossRef] [PubMed]
- World Health Organization. Guideline: Sugars Intake for Adults and Children; World Health Organization: Geneva, Switzerland, 2015. [Google Scholar]
- Escobar, M.A.C.; Veerman, J.L.; Tollman, S.M.; Bertram, M.Y.; Hofman, K.J. Evidence that a tax on sugar sweetened beverages reduces the obesity rate: A meta-analysis. BMC Public Health 2013, 13, 1072. [Google Scholar] [CrossRef]
- DuBois, G.E.; Walters, D.E.; Schiffman, S.S.; Warwick, Z.S.; Booth, B.J.; Pecore, S.D.; Gibes, K.; Carr, B.T.; Brands, L.M. Concentration—Response relationships of sweeteners: A systematic study. ACS Publ. 1991, 261–276. [Google Scholar] [CrossRef]
- Bornet, F.R. Undigestible sugars in food products. Am. J. Clin. Nutr. 1994, 59, 763S–769S. [Google Scholar] [CrossRef]
- Chattopadhyay, S.; Raychaudhuri, U.; Chakraborty, R. Artificial sweeteners—A review. J. Food Sci. Technol. 2014, 51, 611–621. [Google Scholar] [CrossRef]
- Barndt, R.; Jackson, G. Stability of sucralose in baked goods. Food Technol. (Chic.) 1990, 44, 62–66. [Google Scholar]
- Binns, N.M. Sucralose–all sweetness and light. Nutr. Bull. 2003, 28, 53–58. [Google Scholar] [CrossRef]
- Gardner, C.; Wylie-Rosett, J.; Gidding, S.S.; Steffen, L.M.; Johnson, R.K.; Reader, D.; Lichtenstein, A.H. Nonnutritive sweeteners: Current use and health perspectives: A scientific statement from the american heart association and the american diabetes association. Circulation 2012, 126, 509–519. [Google Scholar] [CrossRef] [PubMed]
- Tucker, R.M.; Tan, S.-Y. Do non-nutritive sweeteners influence acute glucose homeostasis in humans? A systematic review. Physiol. Behav. 2017, 182, 17–26. [Google Scholar] [CrossRef] [PubMed]
- Swithers, S.E.; Martin, A.A.; Davidson, T.L. High-intensity sweeteners and energy balance. Physiol. Behav. 2010, 100, 55–62. [Google Scholar] [CrossRef] [PubMed]
- Swithers, S.E.; Sample, C.H.; Davidson, T.L. Adverse effects of high-intensity sweeteners on energy intake and weight control in male and obesity-prone female rats. Behav. Neurosci. 2013, 127, 262–274. [Google Scholar] [CrossRef] [PubMed]
- Fowler, S.P.; Williams, K.; Resendez, R.G.; Hunt, K.J.; Hazuda, H.P.; Stern, M.P. Fueling the obesity epidemic? Artificially sweetened beverage use and long-term weight gain. Obesity 2008, 16, 1894–1900. [Google Scholar] [CrossRef]
- Hinkle, S.N.; Rawal, S.; Bjerregaard, A.A.; Halldorsson, T.I.; Li, M.; Ley, S.H.; Wu, J.; Zhu, Y.; Chen, L.; Liu, A. A prospective study of artificially sweetened beverage intake and cardiometabolic health among women at high risk. Am. J. Clin. Nutr. 2019, 110, 21–232. [Google Scholar] [CrossRef]
- Tan, S.-Y.; Siow, P.C.; Peh, E.; Henry, C.J. Influence of rice, pea and oat proteins in attenuating glycemic response of sugar-sweetened beverages. Eur. J. Nutr. 2018, 57, 2795–2803. [Google Scholar] [CrossRef]
- Nguyen, A.; Chern, C.; Tan, S.-Y. Estimated portion size versus actual intake of eight commonly consumed foods by healthy adults. Nutr. Diet. 2016, 73, 490–497. [Google Scholar] [CrossRef]
- Kinabo, J.L.; Durnin, J.V.G.A. Thermic effect of food in man: Effect of meal composition and meal size. Br. J. Nutr. 1990, 64, 37–44. [Google Scholar] [CrossRef] [PubMed]
- Stunkard, A.J.; Messick, S. The three-factor eating questionnaire to measure dietary restraint, disinhibition and hunger. J. Psychosom. Res. 1985, 29, 71–83. [Google Scholar] [CrossRef]
- Weir, J.B. New methods for calculating metabolic rate with special reference to protein metabolism. J. Physiol. 1949, 109, 1–9. [Google Scholar] [CrossRef] [PubMed]
- Péronnet, F.A.; Massicotte, D. Table of nonprotein respiratory quotient: An update. Can. J. Sport Sci. 1991, 16, 23–29. [Google Scholar] [PubMed]
- Flint, A.; Raben, A.; Blundell, J.E.; Astrup, A. Reproducibility, power and validity of visual analogue scales in assessment of appetite sensations in single test meal studies. Int. J. Obes. 2000, 24, 38–48. [Google Scholar] [CrossRef]
- Tan, S.-Y.; Batterham, M.J.; Tapsell, L.C. Energy expenditure does not differ, but protein oxidation rates appear lower in meals containing predominantly meat versus soy sources of protein. Obes. Facts 2010, 3, 101–104. [Google Scholar] [CrossRef] [PubMed]
- Tai, M.M.; Castillo, P.; Pi-Sunyer, F.X. Meal size and frequency: Effect on the thermic effect of food. Am. J. Clin. Nutr. 1991, 54, 783–787. [Google Scholar] [CrossRef]
- Cummings, J.; Roberfroid, M.; Andersson, H.; Barth, C.; Ferro-Luzzi, A.; Ghoos, Y.; Gibney, M.; Hermansen, K.; Hermonsen, K.; James, W. A new look at dietary carbohydrate: Chemistry, physiology and health. Paris carbohydrate group. Eur. J. Clin. Nutr. 1997, 51, 417–423. [Google Scholar] [CrossRef]
- Abdallah, L.; Chabert, M.; Louis-Sylvestre, J. Cephalic phase responses to sweet taste. Am. J. Clin. Nutr. 1997, 65, 737–743. [Google Scholar] [CrossRef]
- Giduck, S.A.; Threatte, R.M.; Kare, M.R. Cephalic reflexes: Their role in digestion and possible roles in absorption and metabolism. J. Nutr. 1987, 117, 1191–1196. [Google Scholar] [CrossRef]
- Glendinning, J.I.; Stano, S.; Holter, M.; Azenkot, T.; Goldman, O.; Margolskee, R.F.; Vasselli, J.R.; Sclafani, A. Sugar-induced cephalic-phase insulin release is mediated by a t1r2+ t1r3-independent taste transduction pathway in mice. Am. J. Physiol. Regul. Integr. Comp. Physiol. 2015, 309, R552–R560. [Google Scholar] [CrossRef]
- Melanson, K.J.; Westerterp-Plantenga, M.S.; Campfield, L.A.; Saris, W.H. Blood glucose and meal patterns in time-blinded males, after aspartame, carbohydrate, and fat consumption, in relation to sweetness perception. Br. J. Nutr. 1999, 82, 437–446. [Google Scholar] [CrossRef]
- Cooper, P.; Wahlqvist, M.; Simpson, R. Sucrose versus saccharin as an added sweetener in non-insulin-dependent diabetes: Short- and medium-term metabolic effects. Diabet. Med. 1988, 5, 676–680. [Google Scholar] [CrossRef]
- Gregersen, S.; Jeppesen, P.B.; Holst, J.J.; Hermansen, K. Antihyperglycemic effects of stevioside in type 2 diabetic subjects. Metabolism 2004, 53, 73–76. [Google Scholar] [CrossRef]
- Anton, S.D.; Martin, C.K.; Han, H.; Coulon, S.; Cefalu, W.T.; Geiselman, P.; Williamson, D.A. Effects of stevia, aspartame, and sucrose on food intake, satiety, and postprandial glucose and insulin levels. Appetite 2010, 55, 37–43. [Google Scholar] [CrossRef]
- Brown, A.W.; Brown, M.M.B.; Onken, K.L.; Beitz, D.C. Short-term consumption of sucralose, a nonnutritive sweetener, is similar to water with regard to select markers of hunger signaling and short-term glucose homeostasis in women. Nutr. Res. 2011, 31, 882–888. [Google Scholar] [CrossRef]
- Ford, H.E.; Peters, V.; Martin, N.M.; Sleeth, M.L.; Ghatei, M.A.; Frost, G.S.; Bloom, S.R. Effects of oral ingestion of sucralose on gut hormone response and appetite in healthy normal-weight subjects. Eur. J. Clin. Nutr. 2011, 65, 508–513. [Google Scholar] [CrossRef]
- Wu, T.; Bound, M.J.; Standfield, S.D.; Bellon, M.; Young, R.L.; Jones, K.L.; Horowitz, M.; Rayner, C.K. Artificial sweeteners have no effect on gastric emptying, glucagon-like peptide-1, or glycemia after oral glucose in healthy humans. Diabetes Care 2013, 36, e202–e203. [Google Scholar] [CrossRef]
- Wu, T.; Bound, M.J.; Zhao, B.R.; Standfield, S.D.; Bellon, M.; Jones, K.L.; Horowitz, M.; Rayner, C.K. Effects of a d-xylose preload with or without sitagliptin on gastric emptying, glucagon-like peptide-1, and postprandial glycemia in type 2 diabetes. Diabetes Care 2013, 36, 1913–1918. [Google Scholar] [CrossRef]
- Wu, T.; Zhao, B.R.; Bound, M.J.; Checklin, H.L.; Bellon, M.; Little, T.J.; Young, R.L.; Jones, K.L.; Horowitz, M.; Rayner, C.K. Effects of different sweet preloads on incretin hormone secretion, gastric emptying, and postprandial glycemia in healthy humans. Am. J. Clin. Nutr. 2012, 95, 78–83. [Google Scholar] [CrossRef]
- Bryant, C.E.; Wasse, L.K.; Astbury, N.; Nandra, G.; McLaughlin, J.T. Non-nutritive sweeteners: No class effect on the glycemic or appetite responses to ingested glucose. Eur. J. Clin. Nutr. 2014, 68, 629–631. [Google Scholar] [CrossRef]
- Mezitis, N.H.; Maggio, C.A.; Koch, P.; Quddoos, A.; Allison, D.B.; Pi-Sunyer, F.X. Glycemic effect of a single high oral dose of the novel sweetener sucralose in patients with diabetes. Diabetes Care 1996, 19, 1004–1005. [Google Scholar] [CrossRef]
- Little, T.J.; Gupta, N.; Case, R.M.; Thompson, D.G.; McLaughlin, J.T. Sweetness and bitterness taste of meals per se does not mediate gastric emptying in humans. Am. J. Physiol. Regul. Integr. Comp. Physiol. 2009, 297, R632–R639. [Google Scholar] [CrossRef]
- Ma, J.; Bellon, M.; Wishart, J.M.; Young, R.; Blackshaw, L.A.; Jones, K.L.; Horowitz, M.; Rayner, C.K. Effect of the artificial sweetener, sucralose, on gastric emptying and incretin hormone release in healthy subjects. Am. J. Physiol. 2009, 296, G735–G739. [Google Scholar] [CrossRef]
- Ma, J.; Stevens, J.E.; Cukier, K.; Maddox, A.F.; Wishart, J.M.; Jones, K.L.; Clifton, P.M.; Horowitz, M.; Rayner, C.K. Effects of a protein preload on gastric emptying, glycemia, and gut hormones after a carbohydrate meal in diet-controlled type 2 diabetes. Diabetes Care 2009, 32, 1600–1602. [Google Scholar] [CrossRef]
- Steinert, R.E.; Frey, F.; Topfer, A.; Drewe, J.; Beglinger, C. Effects of carbohydrate sugars and artificial sweeteners on appetite and the secretion of gastrointestinal satiety peptides. Br. J. Nutr. 2011, 105, 1320–1328. [Google Scholar] [CrossRef]
- Margolskee, R.F. Molecular mechanisms of bitter and sweet taste transduction. J. Biol. Chem. 2002, 277, 1–4. [Google Scholar] [CrossRef]
- Frank, G.K.; Oberndorfer, T.A.; Simmons, A.N.; Paulus, M.P.; Fudge, J.L.; Yang, T.T.; Kaye, W.H. Sucrose activates human taste pathways differently from artificial sweetener. Neuroimage 2008, 39, 1559–1569. [Google Scholar] [CrossRef]
- LeBlanc, J. Nutritional implications of cephalic phase thermogenic responses. Appetite 2000, 34, 214–216. [Google Scholar] [CrossRef]
- LeBlanc, J.; Cabanac, M. Cephalic postprandial thermogenesis in human subjects. Physiol. Behav. 1989, 46, 479–482. [Google Scholar] [CrossRef]
- Rogers, P.; Hogenkamp, P.; De Graaf, C.; Higgs, S.; Lluch, A.; Ness, A.; Penfold, C.; Perry, R.; Putz, P.; Yeomans, M. Does low-energy sweetener consumption affect energy intake and body weight? A systematic review, including meta-analyses, of the evidence from human and animal studies. Int. J. Obes. 2016, 40, 381–394. [Google Scholar] [CrossRef]
- Higgins, K.A.; Mattes, R.D. A randomized controlled trial contrasting the effects of 4 low-calorie sweeteners and sucrose on body weight in adults with overweight or obesity. Am. J. Clin. Nutr. 2019, 109, 1288–1301. [Google Scholar] [CrossRef]


| Unadjusted (n = 11) | Adjusted (n = 11) | |||||||
|---|---|---|---|---|---|---|---|---|
| SUCROSE | MALT | NNS | p5 | SUCROSE1 | MALT1 | NNS1 | p5 | |
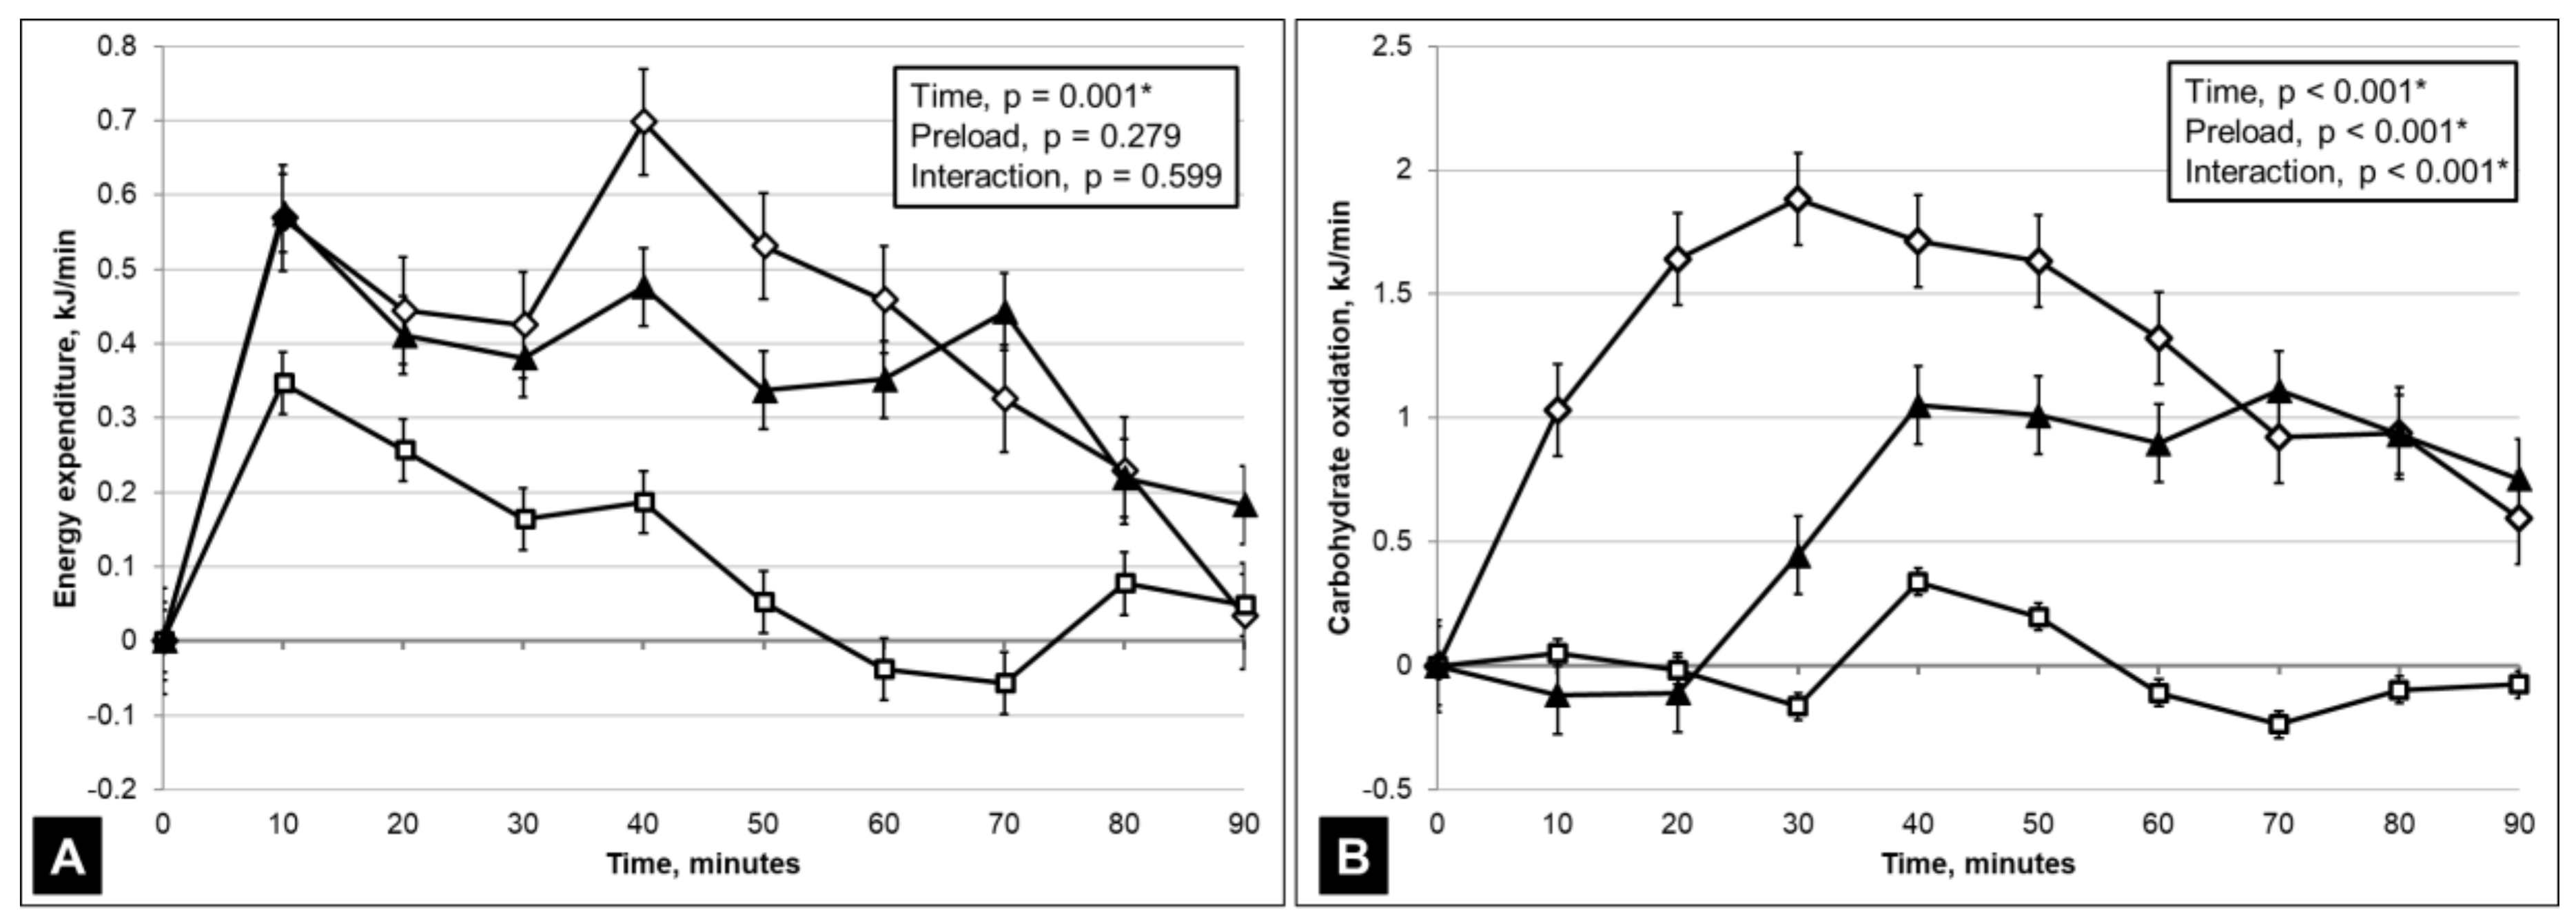
| Energy expenditure (kJ/90 min)2 | 413 ± 105 a | 412 ± 126 a | 374 ± 93 a | 0.046 * | 412 ± 56 | 410 ± 62 | 373 ± 55 | 0.050 |
| Carbohydrate oxidation (kJ/90 min)3 | 311 ± 86 a | 256 ± 76 b | 191 ± 68 c | 0.004 * | 311 ± 74 a | 255 ± 49 b | 191 ± 49 c | <0.001 * |
| Fat oxidation (kJ/90 min)4 | 104 ± 66 a | 157 ± 62 b | 159 ± 67 a,b | 0.016 * | 104 ± 50 a | 157 ± 41 b | 160 ± 72 a,b | 0.015 * |
| SUCROSE | MALT | NNS | Time p | Test Foods p | Time X Test Foods p | |
|---|---|---|---|---|---|---|
| Hunger (mm) 1 | <0.001 * | 0.397 | 0.838 | |||
| Before jelly 09:00 am | 63.3 ± 25.6 | 72.7 ± 17.7 | 62.3 ± 21.7 | |||
| After jelly 09:10 am | 37.7 ± 24.3 | 48.4 ± 27.8 | 33.3 ± 21.5 | |||
| Pre-meal challenge 11:00 am | 63.8 ± 20.6 | 64.6 ± 15.3 | 58.0 ± 17.7 | |||
| Post-meal challenge 11:30 am | 11.8 ± 17.8 | 15.7 ± 16.3 | 15.1 ± 19.6 | |||
| Fullness (mm) 1 | <0.001 * | 0.111 | 0.275 | |||
| Before jelly 09:00 am | 25.9 ± 27.9 | 16.2 ± 20.9 | 19.4 ± 19.7 | |||
| After jelly 09:10 am | 44.8 ± 24.8 | 23.3 ± 41.0 | 54.0 ± 19.3 | |||
| Pre-meal challenge 11:00 am | 27.1 ± 22.3 | 21.8 ± 15.3 | 28.0 ± 25.6 | |||
| Post-meal challenge 11:30 am | 85.5 ± 5.9 | 78.0 ± 15.2 | 78.6 ± 9.7 | |||
| Desire-to-eat (mm) 1 | <0.001 * | 0.806 | 0.656 | |||
| Before jelly 09:00 am | 59.0 ± 32.6 | 74.7 ± 11.9 | 64.5 ± 16.6 | |||
| After jelly 09:10 am | 41.3 ± 26.8 | 38.4 ± 47.2 | 40.3 ± 19.2 | |||
| Pre-meal challenge 11:00 am | 66.0 ± 22.2 | 69.1 ± 12.5 | 59.1 ± 22.6 | |||
| Post-meal challenge 11:30 am | 16.4 ± 21.2 | 17.5 ± 11.0 | 19.5 ± 18.4 |
© 2019 by the authors. Licensee MDPI, Basel, Switzerland. This article is an open access article distributed under the terms and conditions of the Creative Commons Attribution (CC BY) license (http://creativecommons.org/licenses/by/4.0/).
Share and Cite
Chern, C.; Tan, S.-Y. Energy Expenditure, Carbohydrate Oxidation and Appetitive Responses to Sucrose or Sucralose in Humans: A Pilot Study. Nutrients 2019, 11, 1782. https://doi.org/10.3390/nu11081782
Chern C, Tan S-Y. Energy Expenditure, Carbohydrate Oxidation and Appetitive Responses to Sucrose or Sucralose in Humans: A Pilot Study. Nutrients. 2019; 11(8):1782. https://doi.org/10.3390/nu11081782
Chicago/Turabian StyleChern, Christine, and Sze-Yen Tan. 2019. "Energy Expenditure, Carbohydrate Oxidation and Appetitive Responses to Sucrose or Sucralose in Humans: A Pilot Study" Nutrients 11, no. 8: 1782. https://doi.org/10.3390/nu11081782
APA StyleChern, C., & Tan, S.-Y. (2019). Energy Expenditure, Carbohydrate Oxidation and Appetitive Responses to Sucrose or Sucralose in Humans: A Pilot Study. Nutrients, 11(8), 1782. https://doi.org/10.3390/nu11081782