Postprandial Effects of a Proprietary Milk Protein Hydrolysate Containing Bioactive Peptides in Prediabetic Subjects

 ,
,
Abstract
1. Introduction
2. Materials and Methods
2.1. Study Subjects
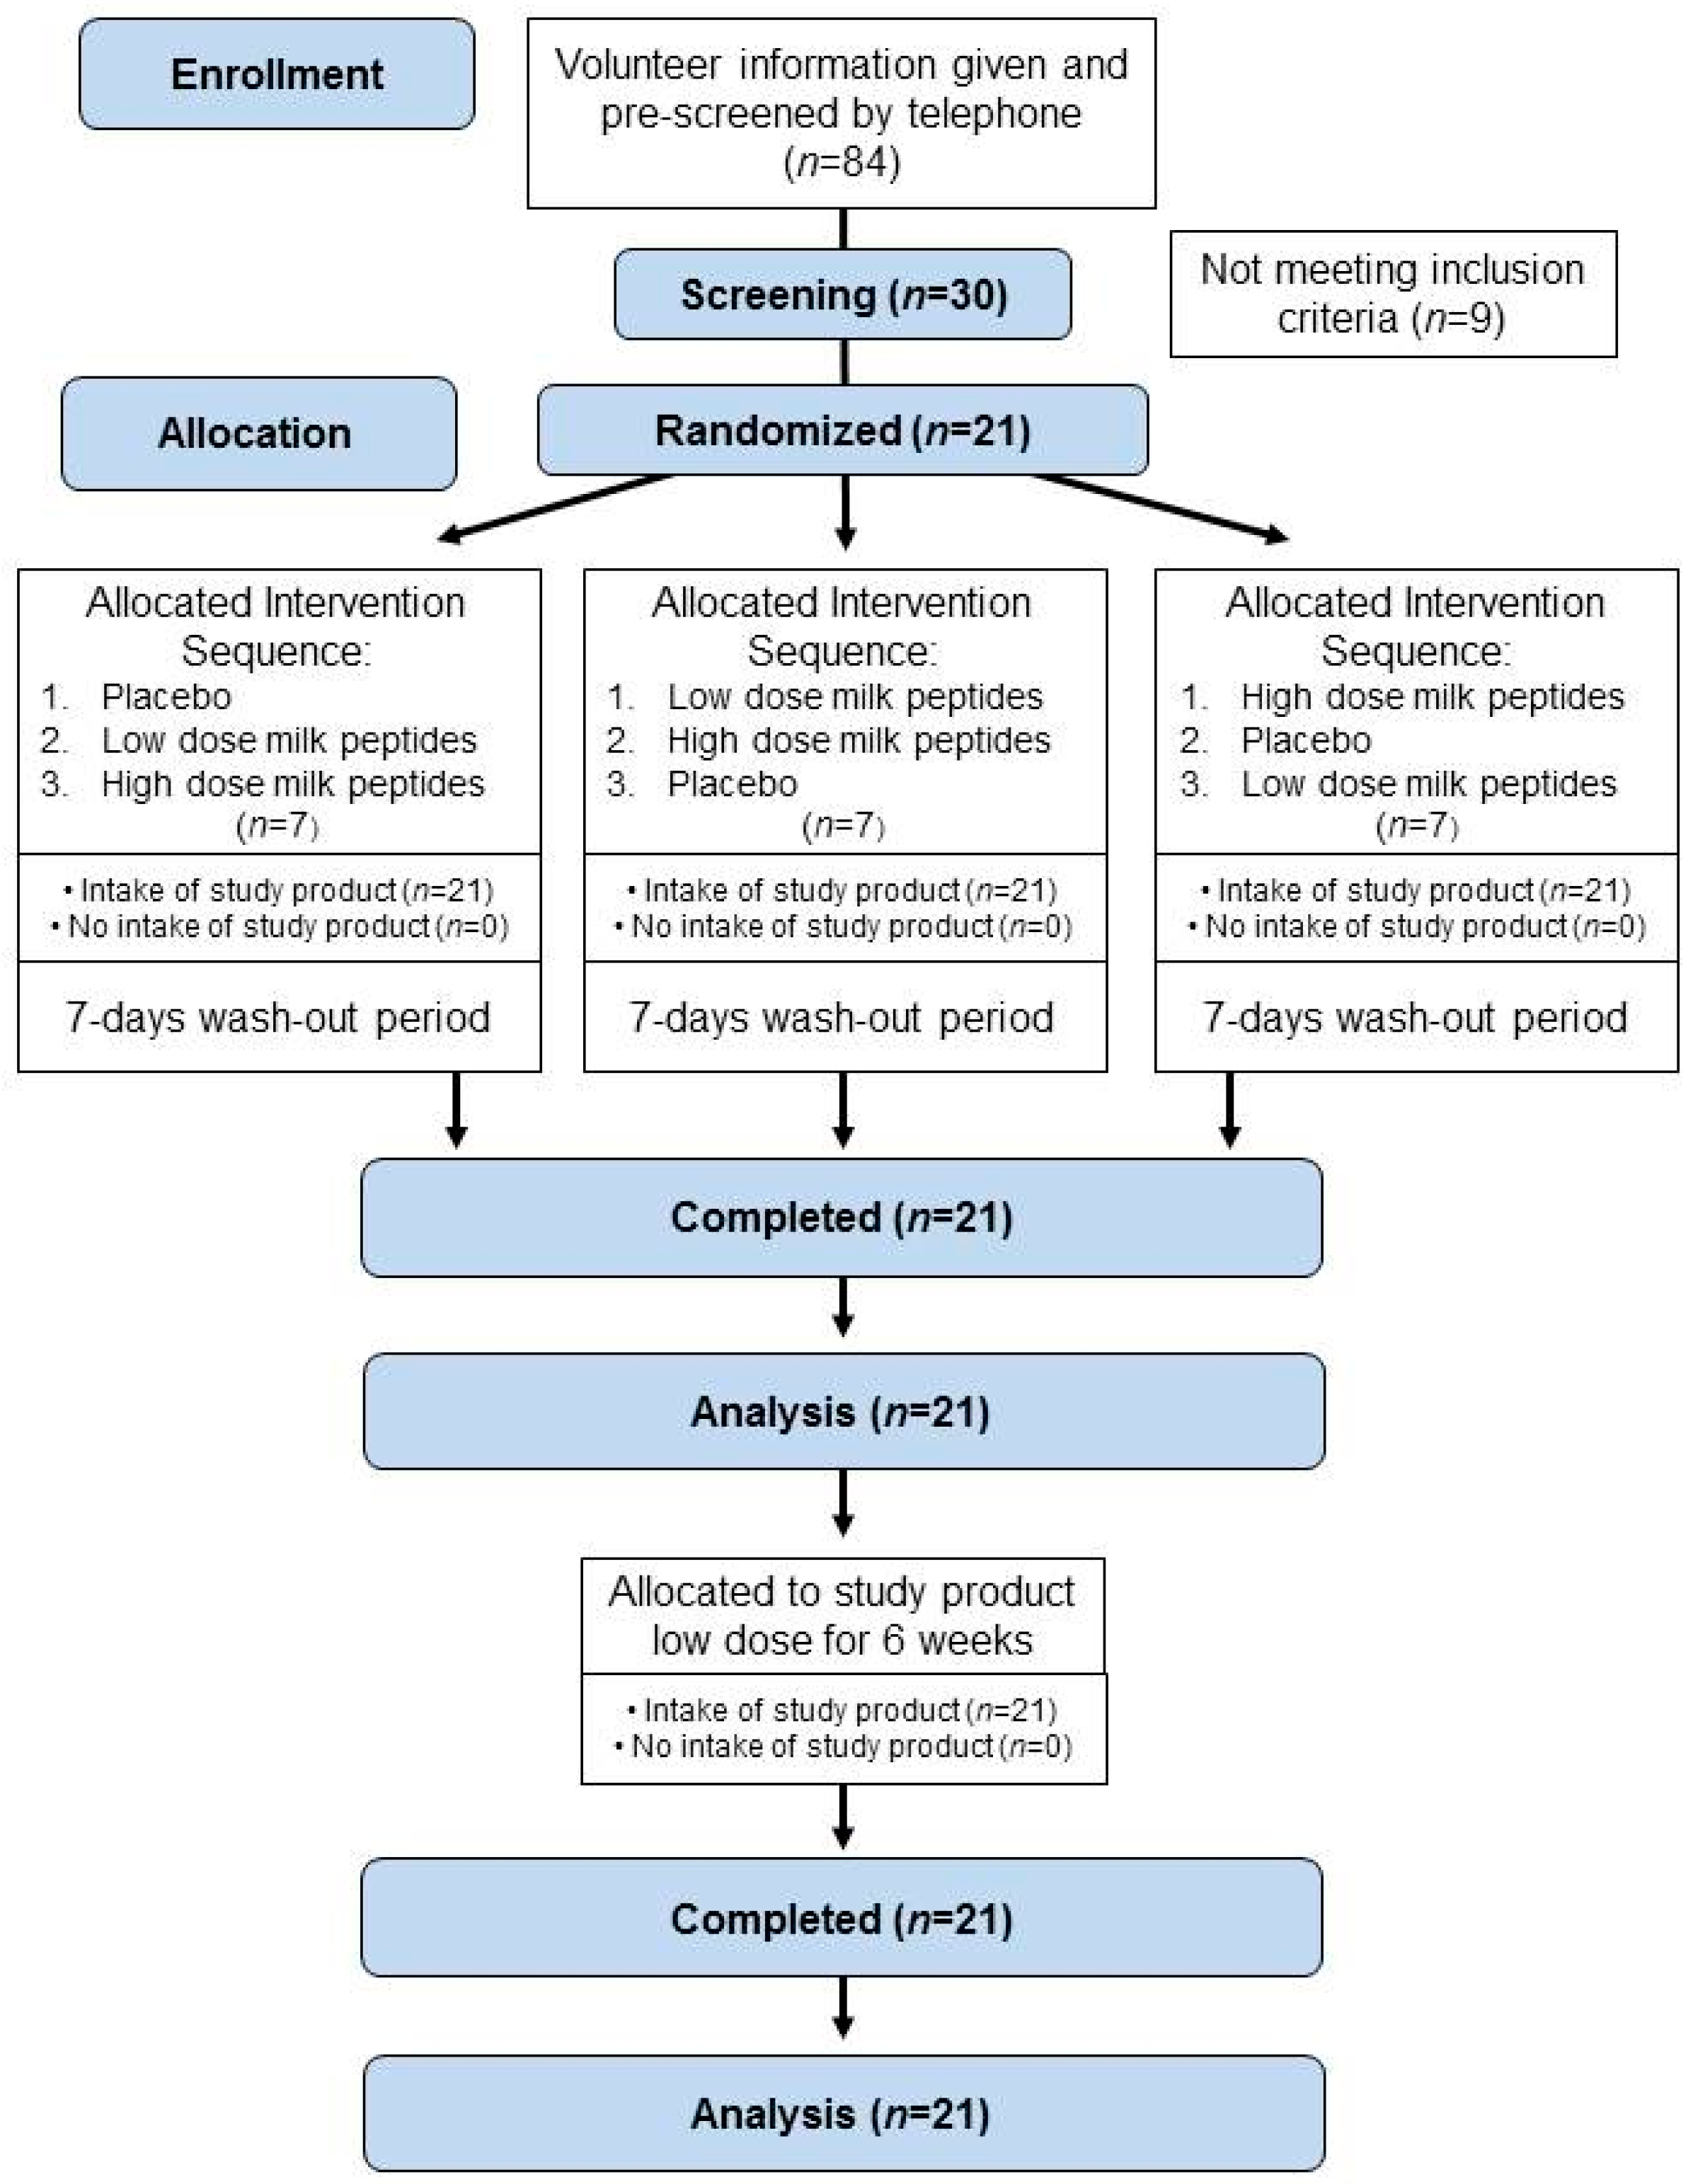
2.2. Study Design
2.3. Intervention
2.4. Sample Collection and Processing
2.5. Methods for Safety (Adverse Events, Concomitant Medication, and Tolerability)
2.6. Data Analysis and Statistics
3. Results
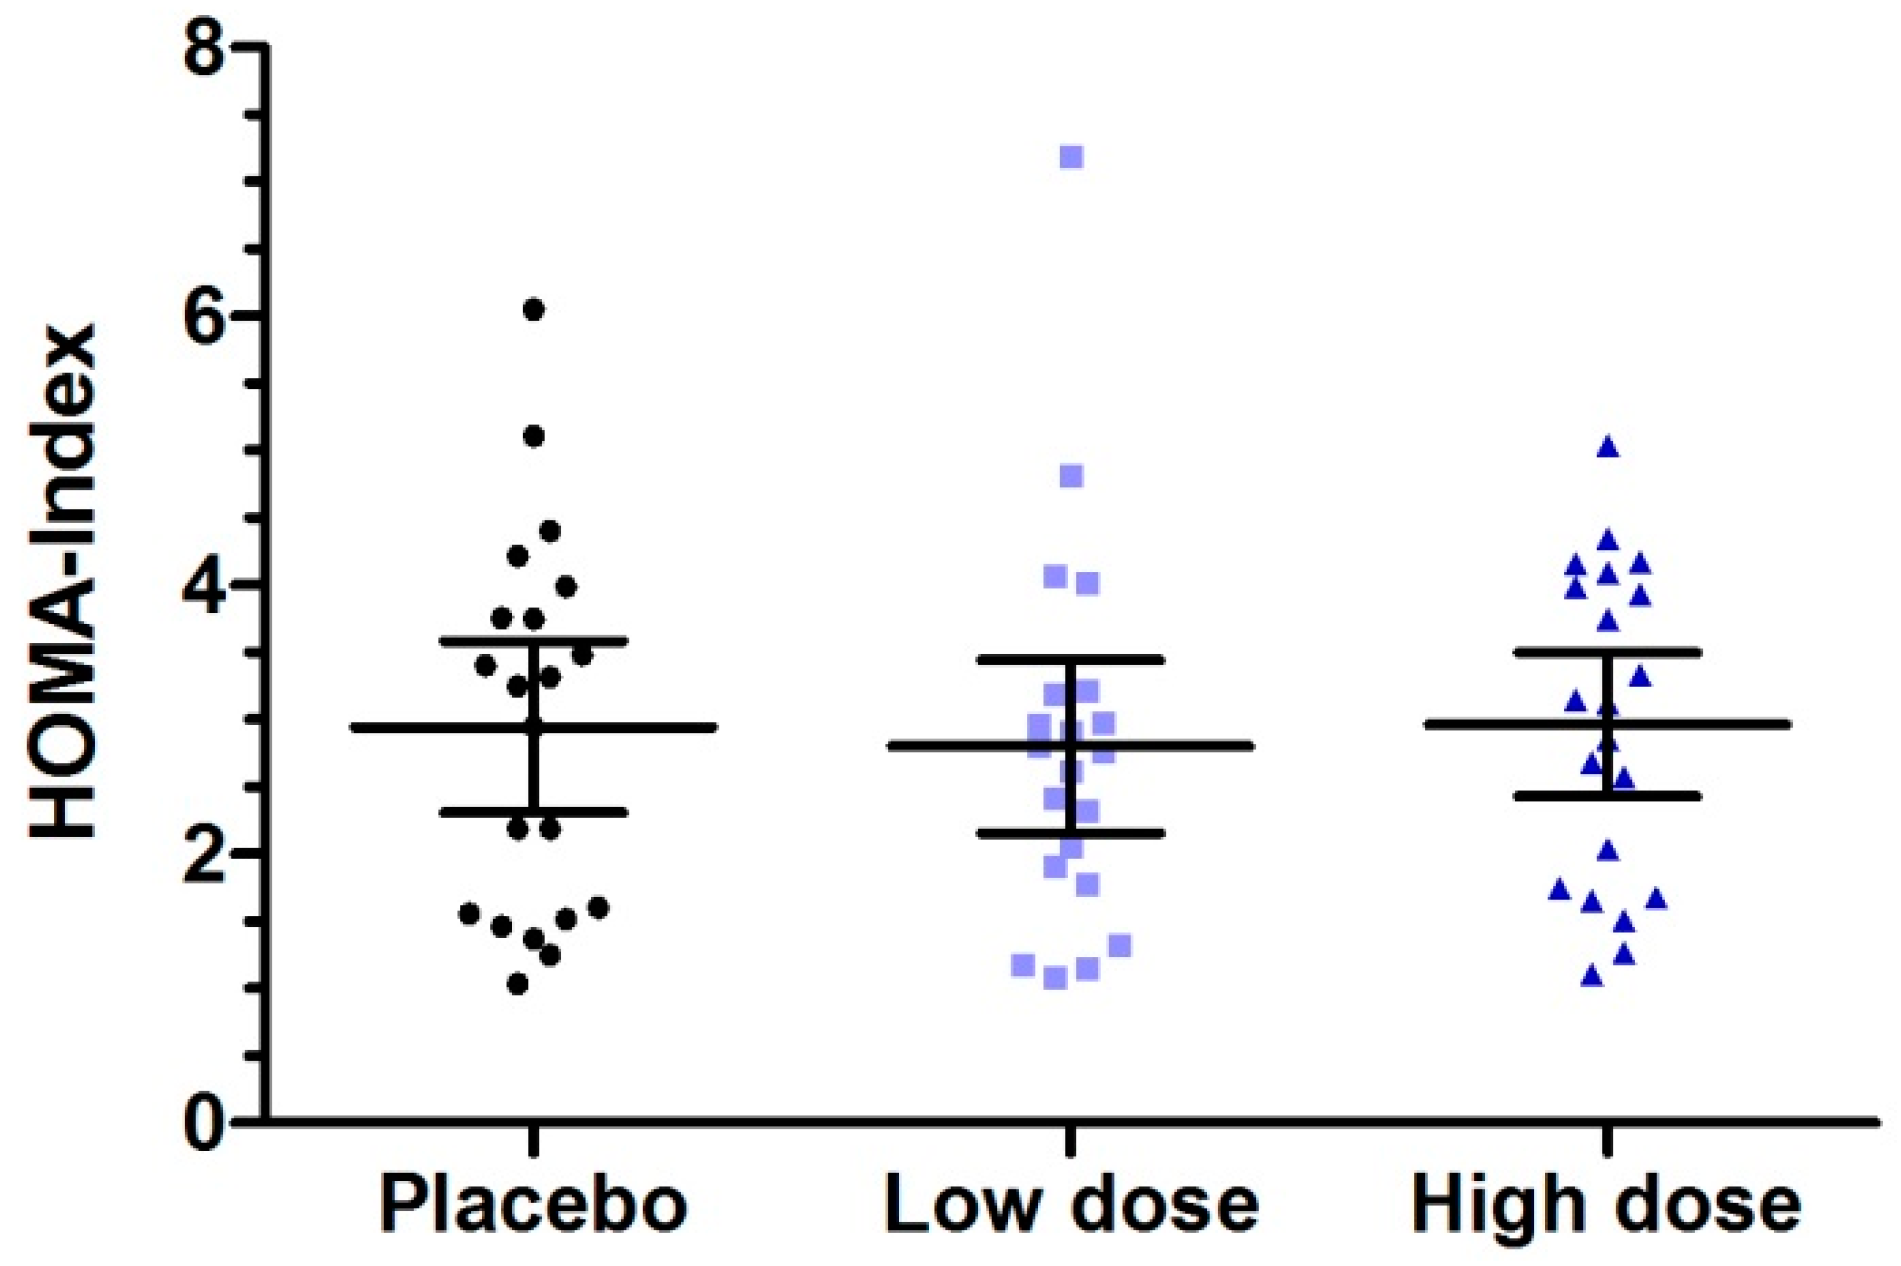
3.1. Subject Characteristics
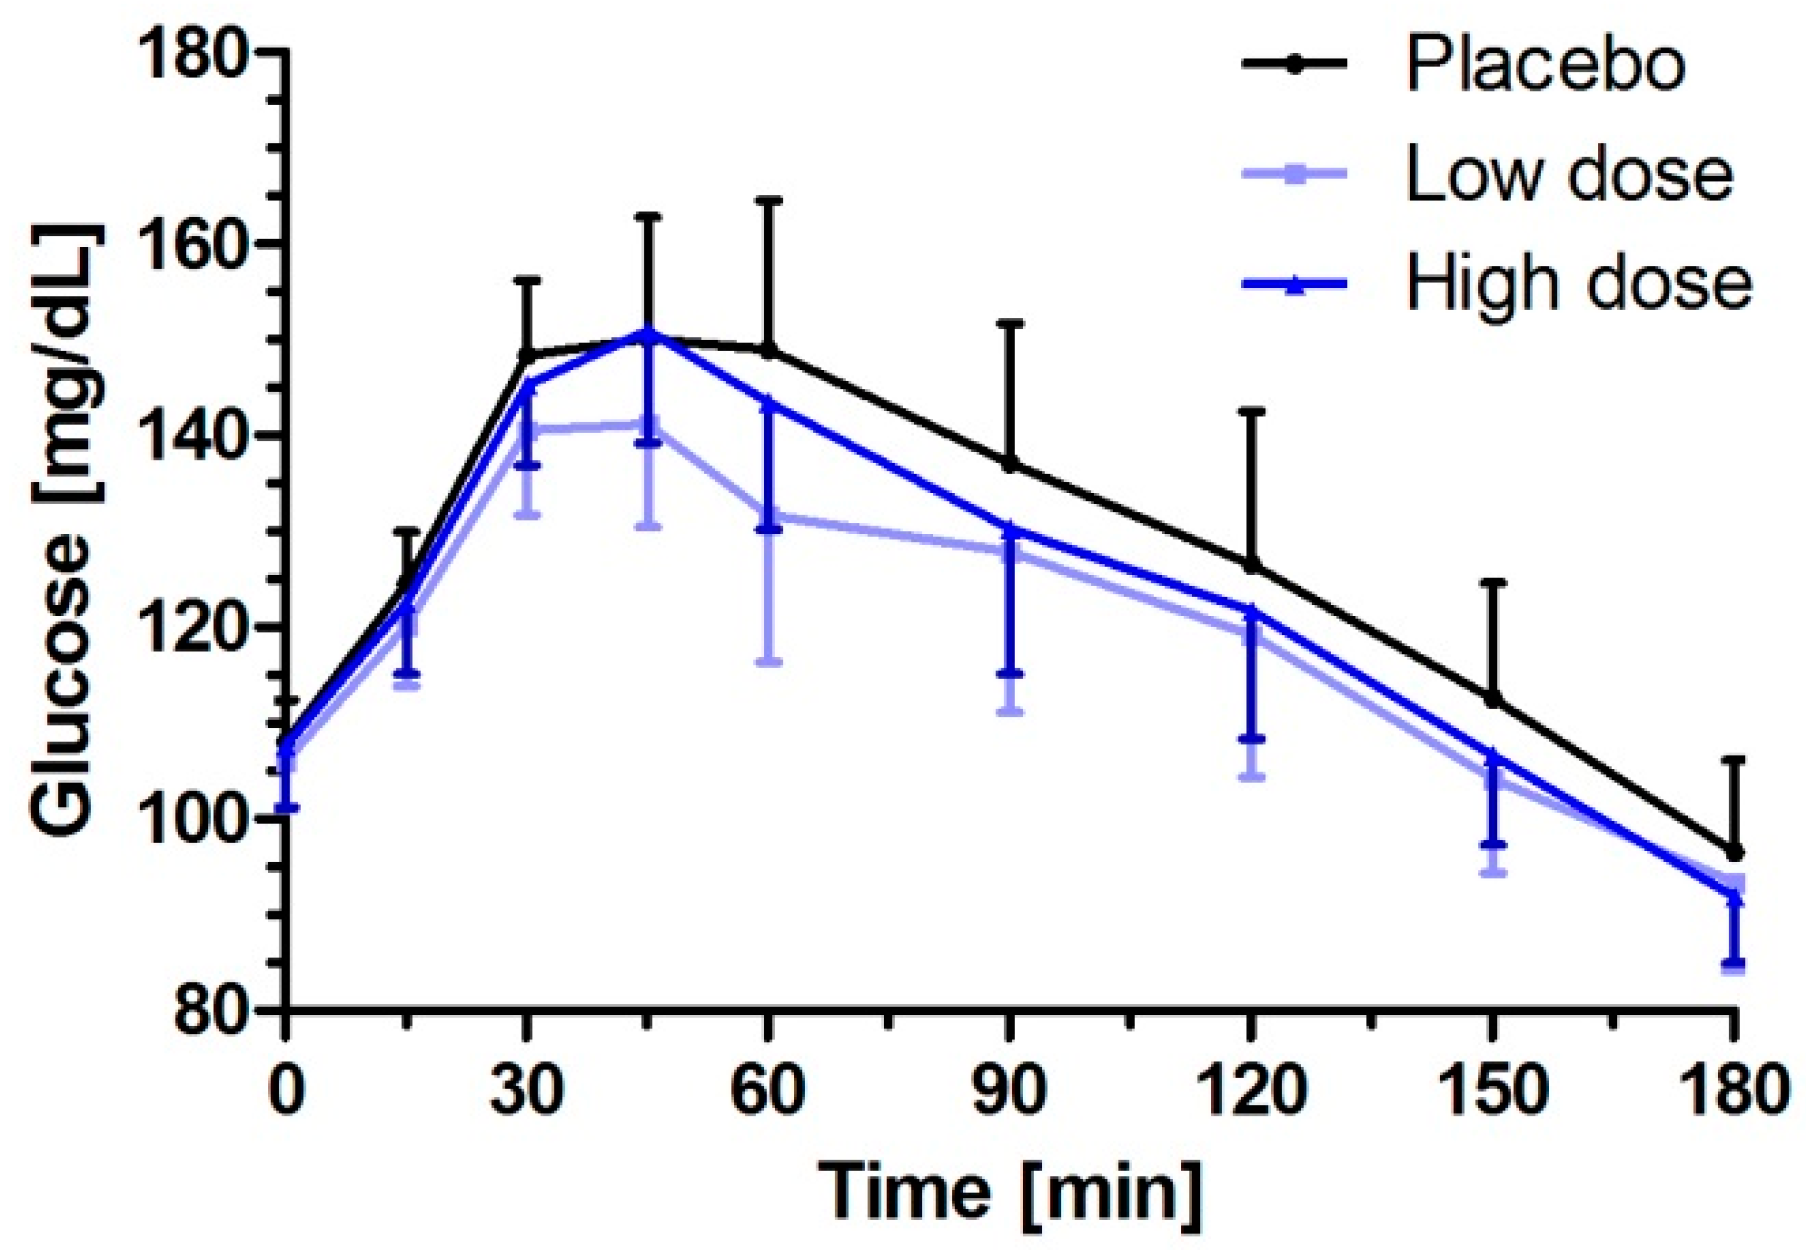
3.2. Milk Peptides and Their Postprandial Effect on Glucose Response after Single Dose Intake
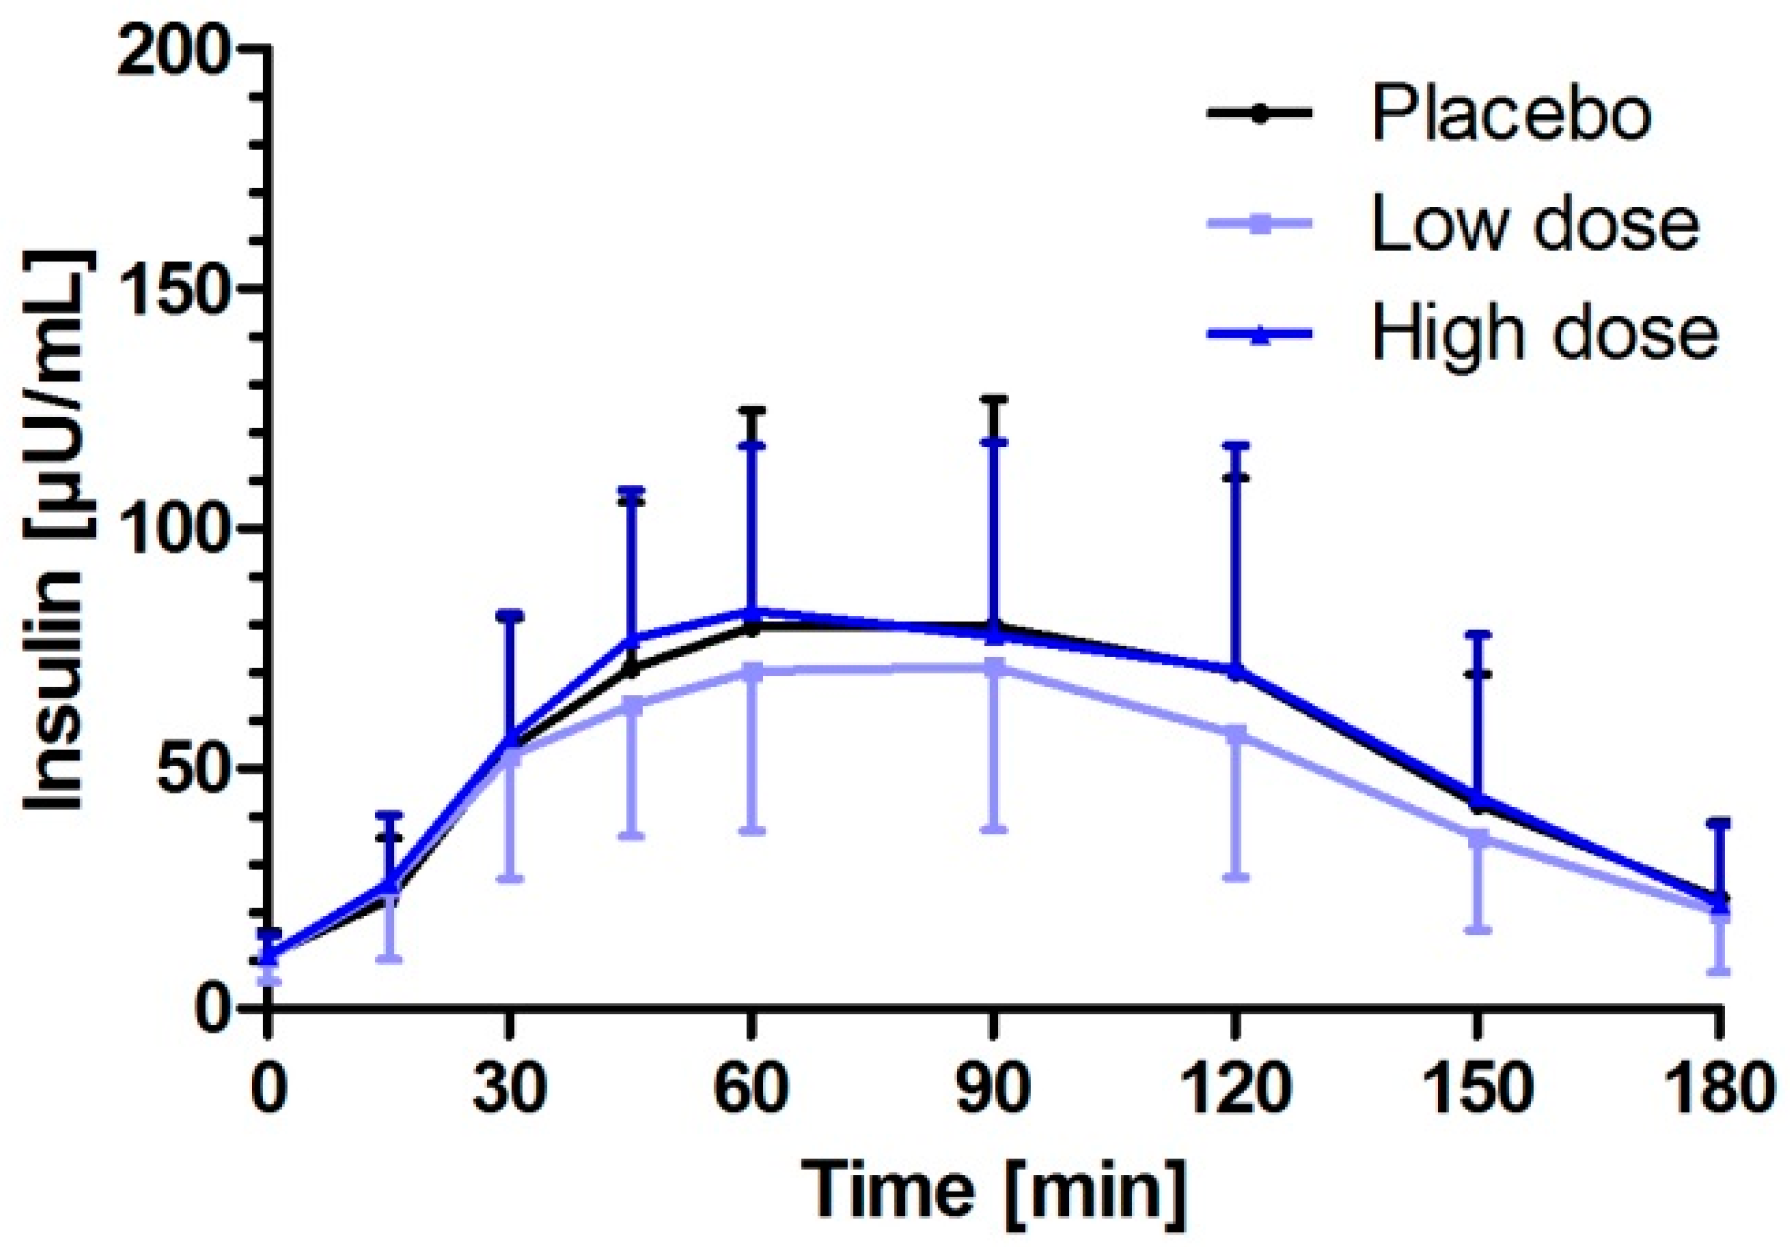
3.3. Milk Peptides and Their Postprandial Effect on Insulin Response after Single Dose Intake
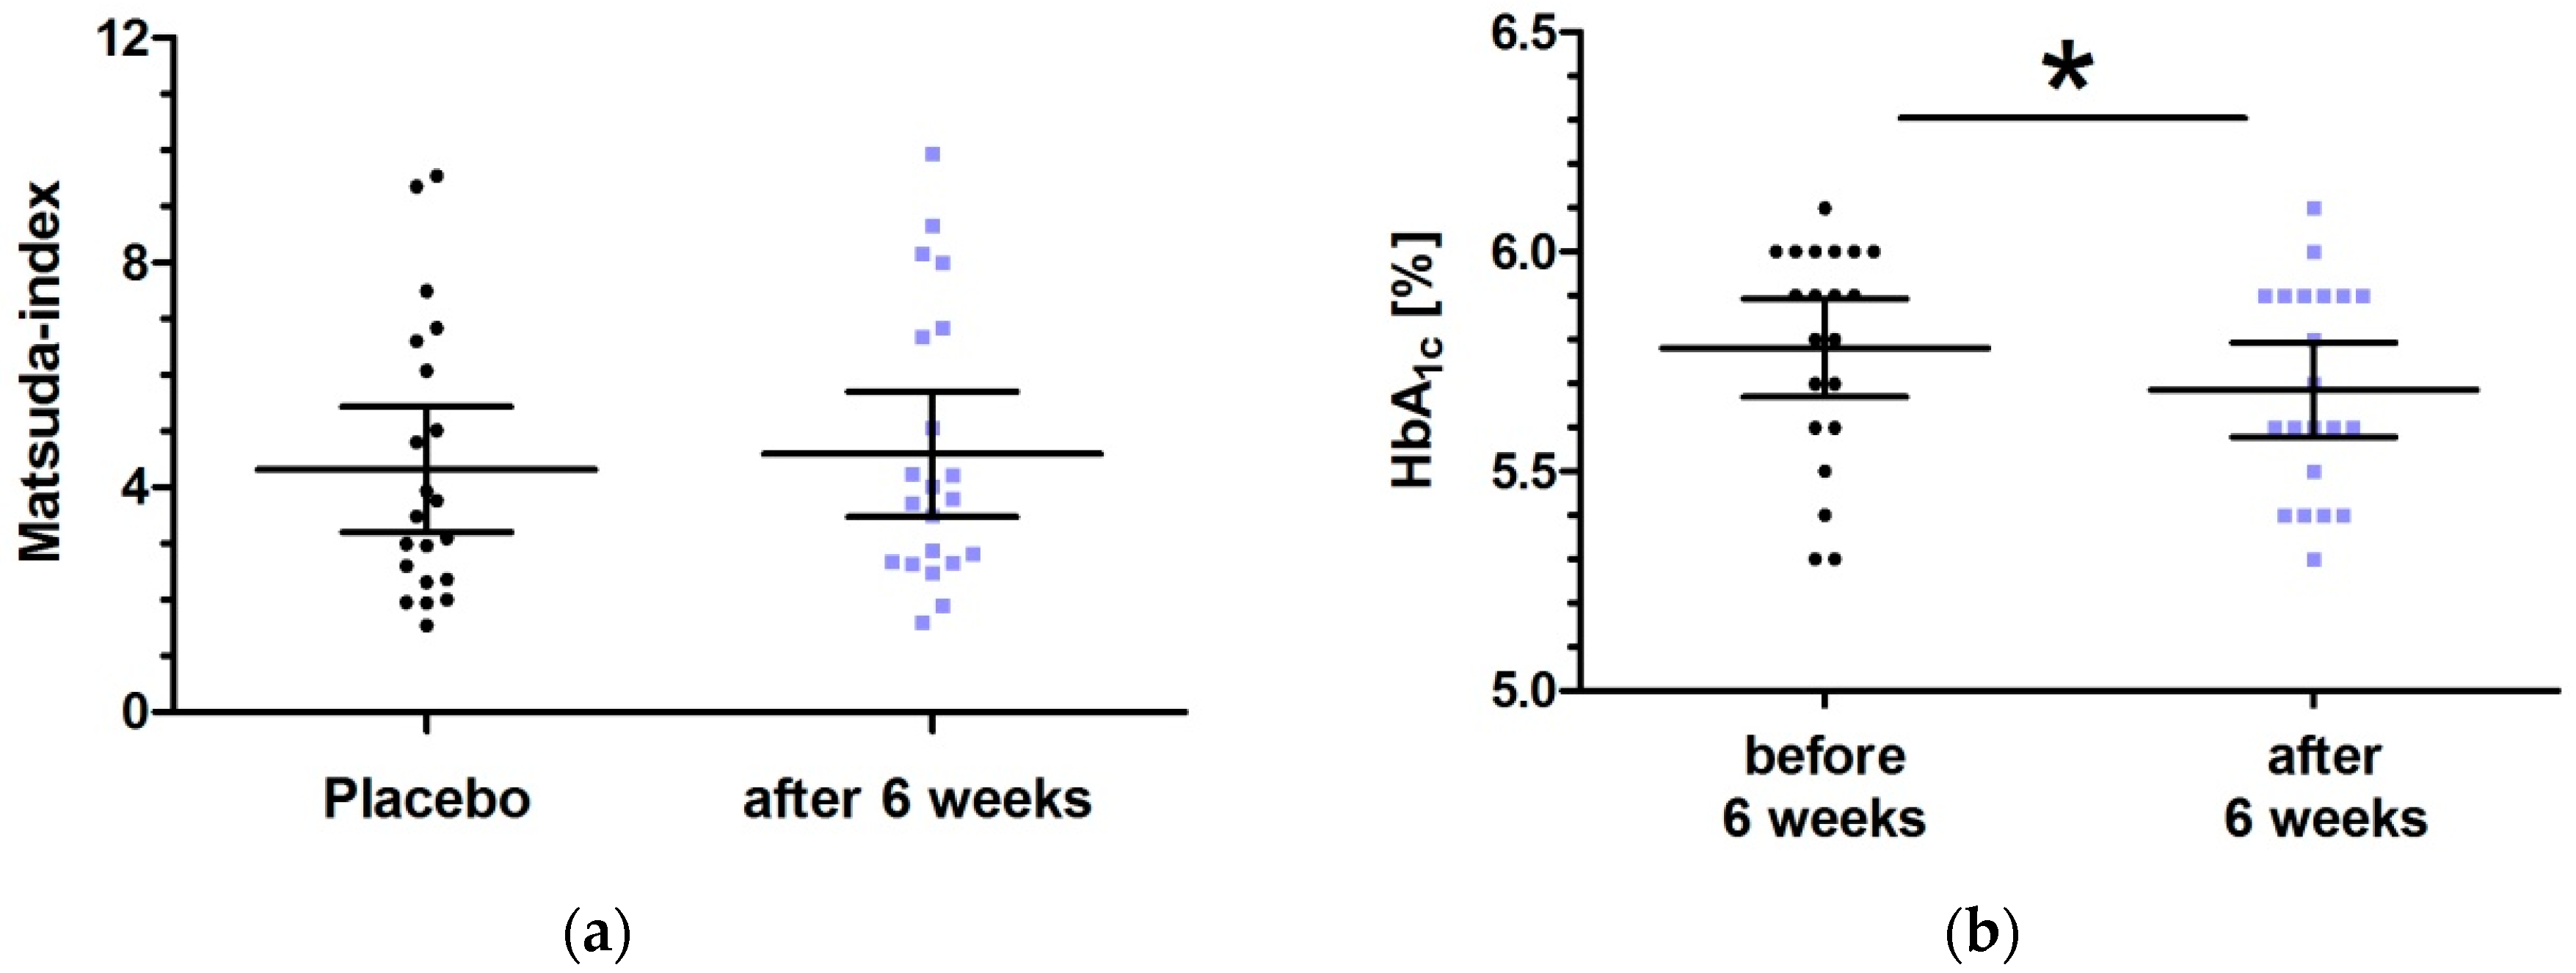
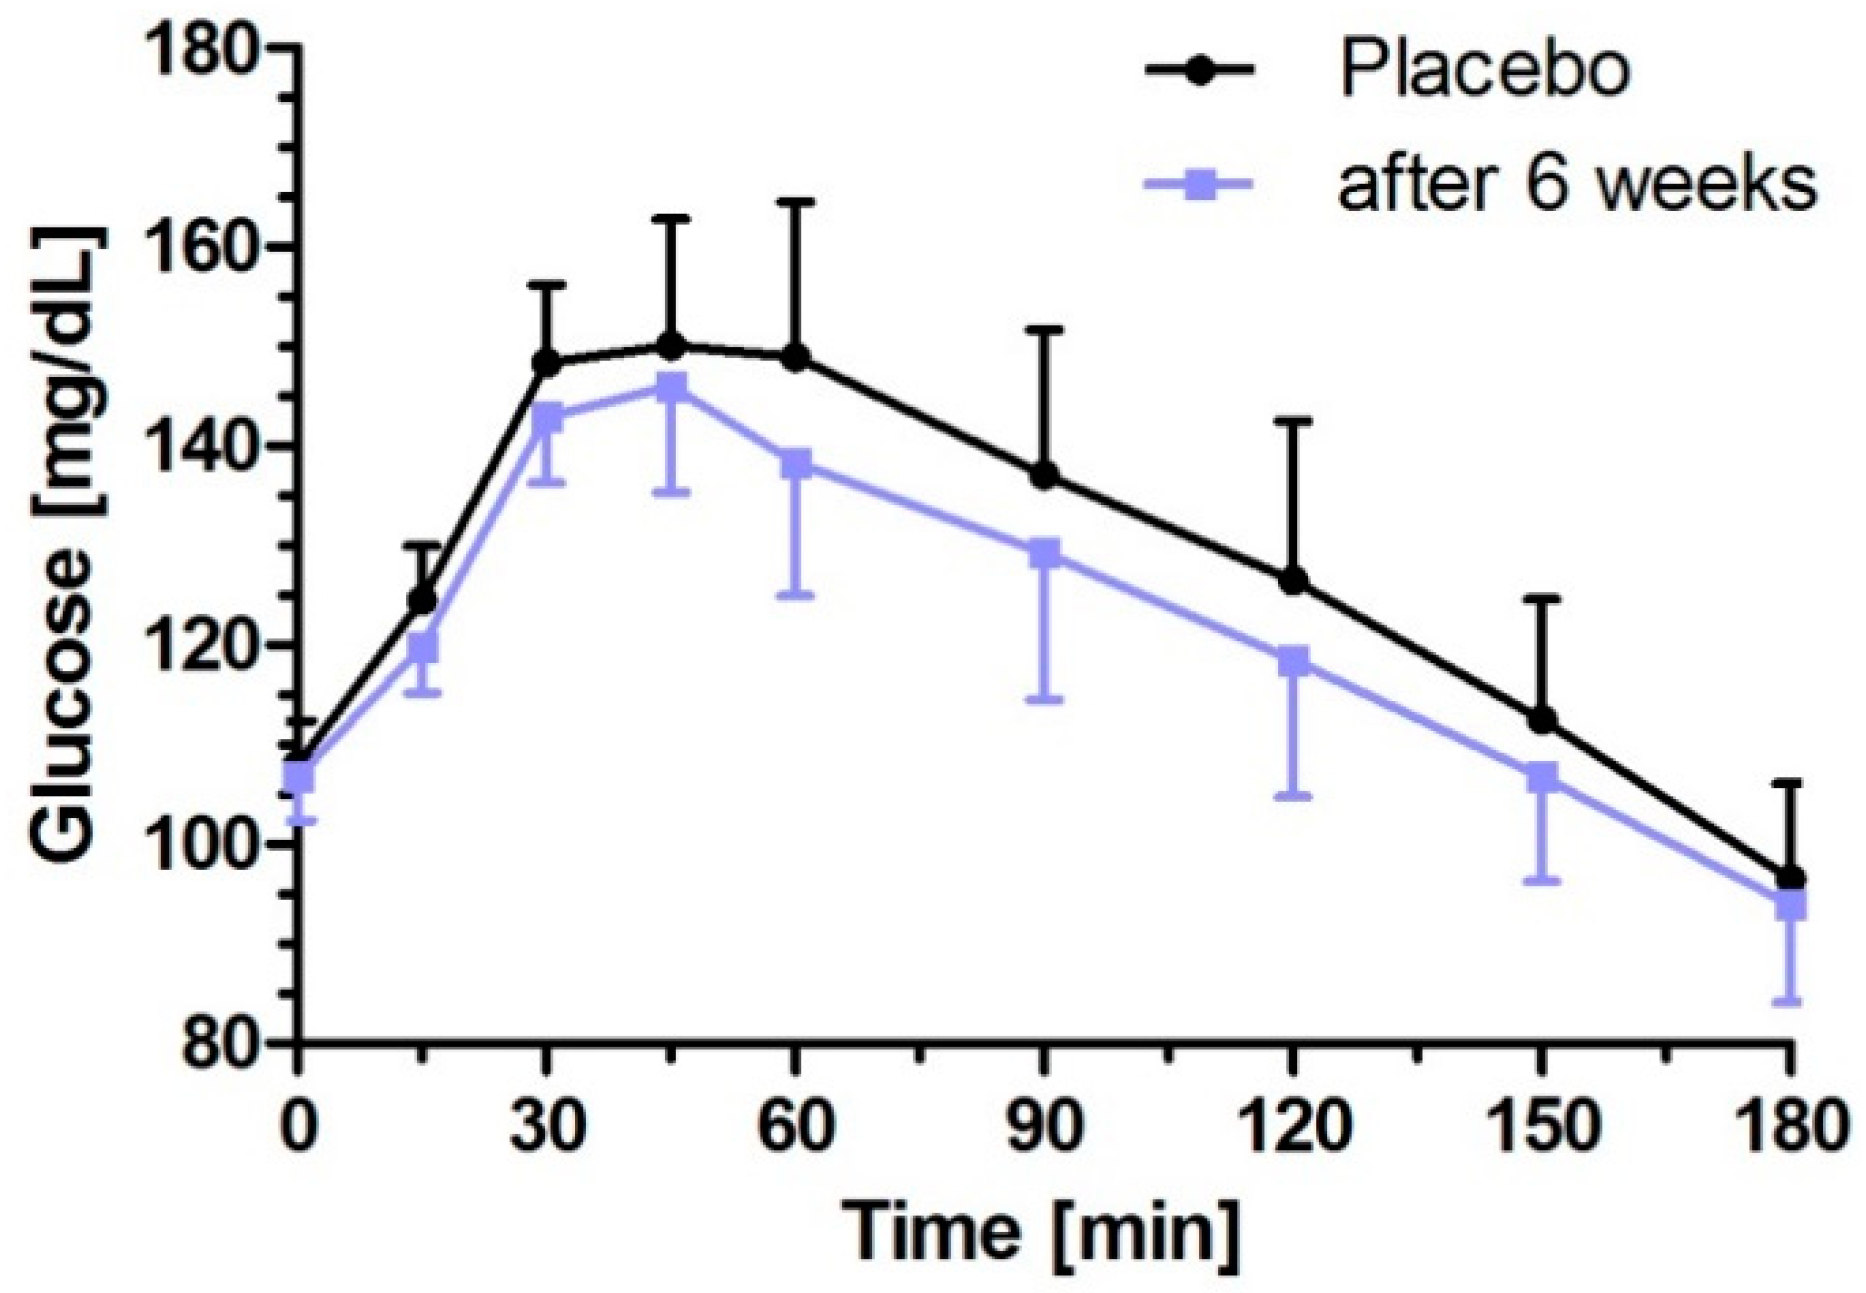
3.4. Six Week Intervention with Low Dose Milk Peptides
3.5. Safety Assessment
4. Discussion
5. Conclusions
Supplementary Materials
Author Contributions
Funding
Acknowledgments
Conflicts of Interest
References
- DeFronzo, R.A.; Bonadonna, R.C.; Ferrannini, E. Pathogenesis of NIDDM: A balanced overview. Diabetes Care 1992, 15, 318–368. [Google Scholar] [CrossRef]
- Fiorentino, T.V.; Marini, M.A.; Andreozzi, F.; Arturi, F.; Succurro, E.; Perticone, M.; Sciacqua, A.; Hribal, M.L.; Perticone, F.; Sesti, G. One-Hour Postload Hyperglycemia Is a Stronger Predictor of Type 2 Diabetes Than Impaired Fasting Glucose. J. Clin. Endocrinol. Metab. 2015, 100, 3744–3751. [Google Scholar] [CrossRef]
- Fiorentino, T.V.; Marini, M.A.; Succurro, E.; Andreozzi, F.; Perticone, M.; Hribal, M.L.; Sciacqua, A.; Perticone, F.; Sesti, G. One-Hour Postload Hyperglycemia: Implications for Prediction and Prevention of Type 2 Diabetes. J. Clin. Endocrinol. Metab. 2018, 103, 3131–3143. [Google Scholar] [CrossRef]
- Kanat, M.; DeFronzo, R.A.; Abdul-Ghani, M.A. Treatment of prediabetes. World J. Diabetes 2015, 6, 1207–1222. [Google Scholar] [CrossRef]
- Jakubowicz, D.; Froy, O. Biochemical and metabolic mechanisms by which dietary whey protein may combat obesity and Type 2 diabetes. J. Nutr. Biochem. 2013, 24, 1–5. [Google Scholar] [CrossRef]
- Li, J.; Janle, E.; Campbell, W.W. Postprandial Glycemic and Insulinemic Responses to Common Breakfast Beverages Consumed with a Standard Meal in Adults Who Are Overweight and Obese. Nutrients 2017, 9, 32. [Google Scholar] [CrossRef]
- Liljeberg, E.H.; Bjorck, I. Milk as a supplement to mixed meals may elevate postprandial insulinaemia. Eur. J. Clin. Nutr. 2001, 55, 994–999. [Google Scholar] [CrossRef]
- Fumeron, F. Produits laitiers et prévention du diabète de type 2. Cholé-Doc 2013, 136.
- Pfeuffer, M.; Schrezenmeir, J. Milk and the metabolic syndrome. Obes. Rev. 2007, 8, 109–118. [Google Scholar] [CrossRef]
- Jauhiainen, T.; Korpela, R. Milk peptides and blood pressure. J. Nutr. 2007, 137, 825S–829S. [Google Scholar] [CrossRef]
- Luhovyy, B.L.; Akhavan, T.; Anderson, G.H. Whey proteins in the regulation of food intake and satiety. J. Am. Coll. Nutr. 2007, 26, 704S–712S. [Google Scholar] [CrossRef]
- Darewicz, M.; Borawska, J.; Pliszka, M. Carp proteins as a source of bioactive peptides-an in silico approach. Czech J. Food Sci. 2016, 34, 111–117. [Google Scholar] [CrossRef]
- Li-Chan, E.C.Y. Bioactive peptides and protein hydrolysates: research trends and challenges for application as nutraceuticals and functional food ingredients. Curr. Opin. Food Sci. 2015, 1, 28–37. [Google Scholar] [CrossRef]
- Bjørnshave, A.; Holst, J.J.; Hermansen, K. Pre-Meal Effect of Whey Proteins on Metabolic Parameters in Subjects with and without Type 2 Diabetes: A Randomized, Crossover Trial. Nutrients 2018, 10, 122. [Google Scholar] [CrossRef]
- Boirie, Y.; Dangin, M.; Gachon, P.; Vasson, M.P.; Maubois, J.L.; Beaufrere, B. Slow and fast dietary proteins differently modulate postprandial protein accretion. Proc. Natl. Acad. Sci. USA 1997, 94, 14930–14935. [Google Scholar] [CrossRef]
- Hamarsland, H.; Laahne, J.A.L.; Paulsen, G.; Cotter, M.; Børsheim, E.; Raastad, T. Native whey induces higher and faster leucinemia than other whey protein supplements and milk: a randomized controlled trial. BMC Nutr. 2017, 3, 10. [Google Scholar] [CrossRef]
- Manninen, A.H. Protein hydrolysates in sports nutrition. Nutr. Metab. (Lond.) 2009, 6, 38. [Google Scholar] [CrossRef]
- Calbet, J.A.L.; Holst, J.J. Gastric emptying, gastric secretion and enterogastrone response after administration of milk proteins or their peptide hydrolysates in humans. Eur. J. Nutr. 2004, 43, 127–139. [Google Scholar] [CrossRef]
- Koopman, R.; Crombach, N.; Gijsen, A.P.; Walrand, S.; Fauquant, J.; Kies, A.K.; Lemosquet, S.; Saris, W.H.M.; Boirie, Y.; van Loon, L.J. Ingestion of a protein hydrolysate is accompanied by an accelerated in vivo digestion and absorption rate when compared with its intact protein. Am. J. Clin. Nutr. 2009, 90, 106–115. [Google Scholar] [CrossRef]
- Grimble, G.K.; Sarda, M.G.; Sessay, H.F.; Marrett, A.L.; Kapadia, S.A.; Bowling, T.E.; Silk, D.B.A. The influence of whey hydrolysate peptide chain length on nitrogen and carbohydrate absorption in the perfused human jejunum. Clin. Nutr. 1994, 13, 46. [Google Scholar] [CrossRef]
- Marcone, S.; Haughton, K.; Simpson, P.J.; Belton, O.; Fitzgerald, D.J. Milk-derived bioactive peptides inhibit human endothelial-monocyte interactions via PPAR-γ dependent regulation of NF-κB. J. Inflamm. (Lond.) 2015, 12. [Google Scholar] [CrossRef]
- Iwaniak, A.; Darewicz, M.; Minkiewicz, P. Peptides Derived from Foods as Supportive Diet Components in the Prevention of Metabolic Syndrome. Compr. Rev. Food Sci. Food Saf. 2018, 17, 63–81. [Google Scholar] [CrossRef]
- Kumar, S.; Narwal, S.; Kumar, V.; Prakash, O. alpha-glucosidase inhibitors from plants: A natural approach to treat diabetes. Pharmacogn. Rev. 2011, 5, 19–29. [Google Scholar] [CrossRef]
- Patil, P.; Mandal, S.; Tomar, S.K.; Anand, S. Food protein-derived bioactive peptides in management of type 2 diabetes. Eur. J. Nutr. 2015, 54, 863–880. [Google Scholar] [CrossRef]
- Hu, R.; Li, Y.; Lv, Q.; Wu, T.; Tong, N. Acarbose Monotherapy and Type 2 Diabetes Prevention in Eastern and Western Prediabetes: An Ethnicity-specific Meta-analysis. Clin. Ther. 2015, 37, 1798–1812. [Google Scholar] [CrossRef]
- Kang, W.; Song, Y.; Gu, X. α-glucosidase inhibitory in vitro and antidiabetic activity in vivo of Osmanthus fragrans. J. Med. Plants Res. 2012, 6, 2850–2856. [Google Scholar]
- Ben Henda, Y.; Labidi, A.; Arnaudin, I.; Bridiau, N.; Delatouche, R.; Maugard, T.; Piot, J.-M.; Sannier, F.; Thiery, V.; Bordenave-Juchereau, S. Measuring angiotensin-I converting enzyme inhibitory activity by micro plate assays: Comp. using marine cryptides and tentative threshold determinations with captopril and losartan. J. Agric. Food Chem. 2013, 61, 10685–10690. [Google Scholar] [CrossRef]
- Boutrou, R.; Gaudichon, C.; Dupont, D.; Jardin, J.; Airinei, G.; Marsset-Baglieri, A.; Benamouzig, R.; Tome, D.; Leonil, J. Sequential release of milk protein-derived bioactive peptides in the jejunum in healthy humans. Am. J. Clin. Nutr. 2013, 97, 1314–1323. [Google Scholar] [CrossRef]
- Höfle, A.S. Effects of Different Milk Proteins on the Metabolic Response in Healthy and Prediabetic Volunteers. Ph.D. Thesis, Technical University of Munich, Munich, Germany, 2015. [Google Scholar]
- De Andrade, M.I.S.; Oliveira, J.S.; Leal, V.S.; da Lima, N.M.S.; Costa, E.C.; de Aquino, N.B.; de Lira, P.I.C. Identification of cutoff points for Homeostatic Model Assessment for Insulin Resistance index in adolescents: systematic review. Revista Paulista Pediatria (Engl. Ed.) 2016, 34, 234–242. [Google Scholar] [CrossRef]
- Kita, M.; Obara, K.; Kondo, S.; Umeda, S.; Ano, Y. Effect of Supplementation of a Whey Peptide Rich in Tryptophan-Tyrosine-Related Peptides on Cognitive Performance in Healthy Adults: A Randomized, Double-Blind, Placebo-Controlled Study. Nutrients 2018, 10, 899. [Google Scholar] [CrossRef]
- Babij, K.; Dąbrowska, A.; Szołtysik, M.; Pokora, M.; Zambrowicz, A.; Chrzanowska, J. The Evaluation of Dipeptidyl Peptidase (DPP)-IV, α-Glucosidase and Angiotensin Converting Enzyme (ACE) Inhibitory Activities of Whey Proteins Hydrolyzed with Serine Protease Isolated from Asian Pumpkin (Cucurbita ficifolia). Int. J. Pept. Res. Ther. 2014, 20, 483–491. [Google Scholar] [CrossRef]
- Kung, B.; Anderson, G.H.; Paré, S.; Tucker, A.J.; Vien, S.; Wright, A.J.; Goff, H.D. Effect of milk protein intake and casein-to-whey ratio in breakfast meals on postprandial glucose, satiety ratings, and subsequent meal intake. J. Dairy Sci. 2018, 101, 8688–8701. [Google Scholar] [CrossRef]
- Chakrabarti, S.; Jahandideh, F.; Davidge, S.T.; Wu, J. Milk-Derived Tripeptides IPP (Ile-Pro-Pro) and VPP (Val-Pro-Pro) Enhance Insulin Sensitivity and Prevent Insulin Resistance in 3T3-F442A Preadipocytes. J. Agric. Food Chem. 2018, 66, 10179–10187. [Google Scholar] [CrossRef]
- Sawada, Y.; Sakamoto, Y.; Toh, M.; Ohara, N.; Hatanaka, Y.; Naka, A.; Kishimoto, Y.; Kondo, K.; Iida, K. Milk-derived peptide Val-Pro-Pro (VPP) inhibits obesity-induced adipose inflammation via an angiotensin-converting enzyme (ACE) dependent cascade. Mol. Nutr. Food Res. 2015, 59, 2502–2510. [Google Scholar] [CrossRef]
- Tessari, P.; Kiwanuka, E.; Cristini, M.; Zaramella, M.; Enslen, M.; Zurlo, C.; Garcia-Rodenas, C. Slow versus fast proteins in the stimulation of beta-cell response and the activation of the entero-insular axis in type 2 diabetes. Diabetes Metab. Res. Rev. 2007, 23, 378–385. [Google Scholar] [CrossRef]
- Nilsson, M.; Holst, J.J.; Bjorck, I.M. Metabolic effects of amino acid mixtures and whey protein in healthy subjects: studies using glucose-equivalent drinks. Am. J. Clin. Nutr. 2007, 85, 996–1004. [Google Scholar] [CrossRef]
- Gunnerud, U.J.; Heinzle, C.; Holst, J.J.; Ostman, E.M.; Bjorck, I.M.E. Effects of pre-meal drinks with protein and amino acids on glycemic and metabolic responses at a subsequent composite meal. PLoS ONE 2012, 7, e44731. [Google Scholar] [CrossRef]
- Ostman, E.M.; Liljeberg Elmstahl, H.G.; Bjorck, I.M. Inconsistency between glycemic and insulinemic responses to regular and fermented milk products. Am. J. Clin. Nutr. 2001, 74, 96–100. [Google Scholar] [CrossRef]
- Pasin, G.; Comerford, K.B. Dairy foods and dairy proteins in the management of type 2 diabetes: A systematic review of the clinical evidence. Adv. Nutr. 2015, 6, 245–259. [Google Scholar] [CrossRef]
- Bowen, J.; Noakes, M.; Trenerry, C.; Clifton, P.M. Energy intake, ghrelin, and cholecystokinin after different carbohydrate and protein preloads in overweight men. J. Clin. Endocrinol. Metab. 2006, 91, 1477–1483. [Google Scholar] [CrossRef]
- Hamarsland, H.; Nordengen, A.L.; Nyvik Aas, S.; Holte, K.; Garthe, I.; Paulsen, G.; Cotter, M.; Børsheim, E.; Benestad, H.B.; Raastad, T. Native whey protein with high levels of leucine results in similar post-exercise muscular anabolic responses as regular whey protein: a randomized controlled trial. J. Int. Soc. Sports Nutr. 2017, 14, 43. [Google Scholar] [CrossRef]
- Manders, R.J.F.; Wagenmakers, A.J.M.; Koopman, R.; Zorenc, A.H.G.; Menheere, P.P.C.A.; Schaper, N.C.; Saris, W.H.M.; van Loon, L.J.C. Co-ingestion of a protein hydrolysate and amino acid mixture with carbohydrate improves plasma glucose disposal in patients with type 2 diabetes. Am. J. Clin. Nutr. 2005, 82, 76–83. [Google Scholar] [CrossRef] [PubMed]
- Manders, R.J.; Koopman, R.; Sluijsmans, W.E.; van den Berg, R.; Verbeek, K.; Saris, W.H.; Wagenmakers, A.J.; van Loon, L.J. Co-ingestion of a protein hydrolysate with or without additional leucine effectively reduces postprandial blood glucose excursions in Type 2 diabetic men. J. Nutr. 2006, 136, 1294–1299. [Google Scholar] [CrossRef] [PubMed]
- Manders, R.J.F.; Hansen, D.; Zorenc, A.H.G.; Dendale, P.; Kloek, J.; Saris, W.H.M.; van Loon, L.J. Protein co-ingestion strongly increases postprandial insulin secretion in type 2 diabetes patients. J. Med. Food 2014, 17, 758–763. [Google Scholar] [CrossRef] [PubMed]
- Pal, S.; Ellis, V.; Ho, S. Acute effects of whey protein isolate on cardiovascular risk factors in overweight, post-menopausal women. Atherosclerosis 2010, 212, 339–344. [Google Scholar] [CrossRef]
- Færch, K.; Torekov, S.S.; Vistisen, D.; Johansen, N.B.; Witte, D.R.; Jonsson, A.; Pedersen, O.; Hansen, T.; Lauritzen, T.; Sandbæk, A.; et al. GLP-1 Response to Oral Glucose Is Reduced in Prediabetes, Screen-Detected Type 2 Diabetes, and Obesity and Influenced by Sex: The ADDITION-PRO Study. Diabetes 2015, 64, 2513–2525. [Google Scholar] [CrossRef] [PubMed]
- Allin, K.H.; Tremaroli, V.; Caesar, R.; Jensen, B.A.H.; Damgaard, M.T.F.; Bahl, M.I.; Licht, T.R.; Hansen, T.H.; Nielsen, T.; Dantoft, T.M.; et al. Aberrant intestinal microbiota in individuals with prediabetes. Diabetologia 2018, 61, 810–820. [Google Scholar] [CrossRef] [PubMed]


| Variable | Prediabetics (n = 21) | |
|---|---|---|
| Mean | 95% CI | |
| Age (years) | 62.4 | (60.0–64.9) |
| BMI (kg/m2) | 28.1 | (26.3–30.0) |
| Systolic BP (mmHg) | 134.7 | (127.3–142.1) |
| Diastolic BP (mmHg) | 83.9 | (79.6–88.2) |
| HbA1c (%) | 5.83 | (5.69–5.97) |
| Fasting plasma glucose (mg/dL) | 109.6 | (105.3–113.9) |
| Glucose | Placebo | Low-Dosed Milk Protein Hydrolysate | High-Dosed Milk Protein Hydrolysate | ||||
|---|---|---|---|---|---|---|---|
| Variable | LS Mean 95% CI | LS Mean 95% CI | Treatment Difference 95% CI | p | LS Mean 95% CI | Treatment Difference 95% CI | p |
| iAUC0–180 min (mg/dL × min) | 4312.0 (2938.4–5685.6) | 3441.1 (2066.9–4815.3) | −870.9 (−1732.4–−9.5) | 0.0472 | 3685.8 (2312.6–5059.0) | −626.2 (−1480.5–228.1) | 0.1749 |
| ∆Cmax (mg/dL) | 52.8 (43.9–61.8) | 44.8 (35.9–53.8) | −8.00 (−15.02–−0.98) | 0.0237 | 49.1 (40.1–58.0) | −3.78 (−10.75–3.19) | 0.3627 |
© 2019 by the authors. Licensee MDPI, Basel, Switzerland. This article is an open access article distributed under the terms and conditions of the Creative Commons Attribution (CC BY) license (http://creativecommons.org/licenses/by/4.0/).
Share and Cite
Sartorius, T.; Weidner, A.; Dharsono, T.; Boulier, A.; Wilhelm, M.; Schön, C. Postprandial Effects of a Proprietary Milk Protein Hydrolysate Containing Bioactive Peptides in Prediabetic Subjects. Nutrients 2019, 11, 1700. https://doi.org/10.3390/nu11071700
Sartorius T, Weidner A, Dharsono T, Boulier A, Wilhelm M, Schön C. Postprandial Effects of a Proprietary Milk Protein Hydrolysate Containing Bioactive Peptides in Prediabetic Subjects. Nutrients. 2019; 11(7):1700. https://doi.org/10.3390/nu11071700
Chicago/Turabian StyleSartorius, Tina, Andrea Weidner, Tanita Dharsono, Audrey Boulier, Manfred Wilhelm, and Christiane Schön. 2019. "Postprandial Effects of a Proprietary Milk Protein Hydrolysate Containing Bioactive Peptides in Prediabetic Subjects" Nutrients 11, no. 7: 1700. https://doi.org/10.3390/nu11071700
APA StyleSartorius, T., Weidner, A., Dharsono, T., Boulier, A., Wilhelm, M., & Schön, C. (2019). Postprandial Effects of a Proprietary Milk Protein Hydrolysate Containing Bioactive Peptides in Prediabetic Subjects. Nutrients, 11(7), 1700. https://doi.org/10.3390/nu11071700