How Satiating Are the ‘Satiety’ Peptides: A Problem of Pharmacology versus Physiology in the Development of Novel Foods for Regulation of Food Intake


Abstract
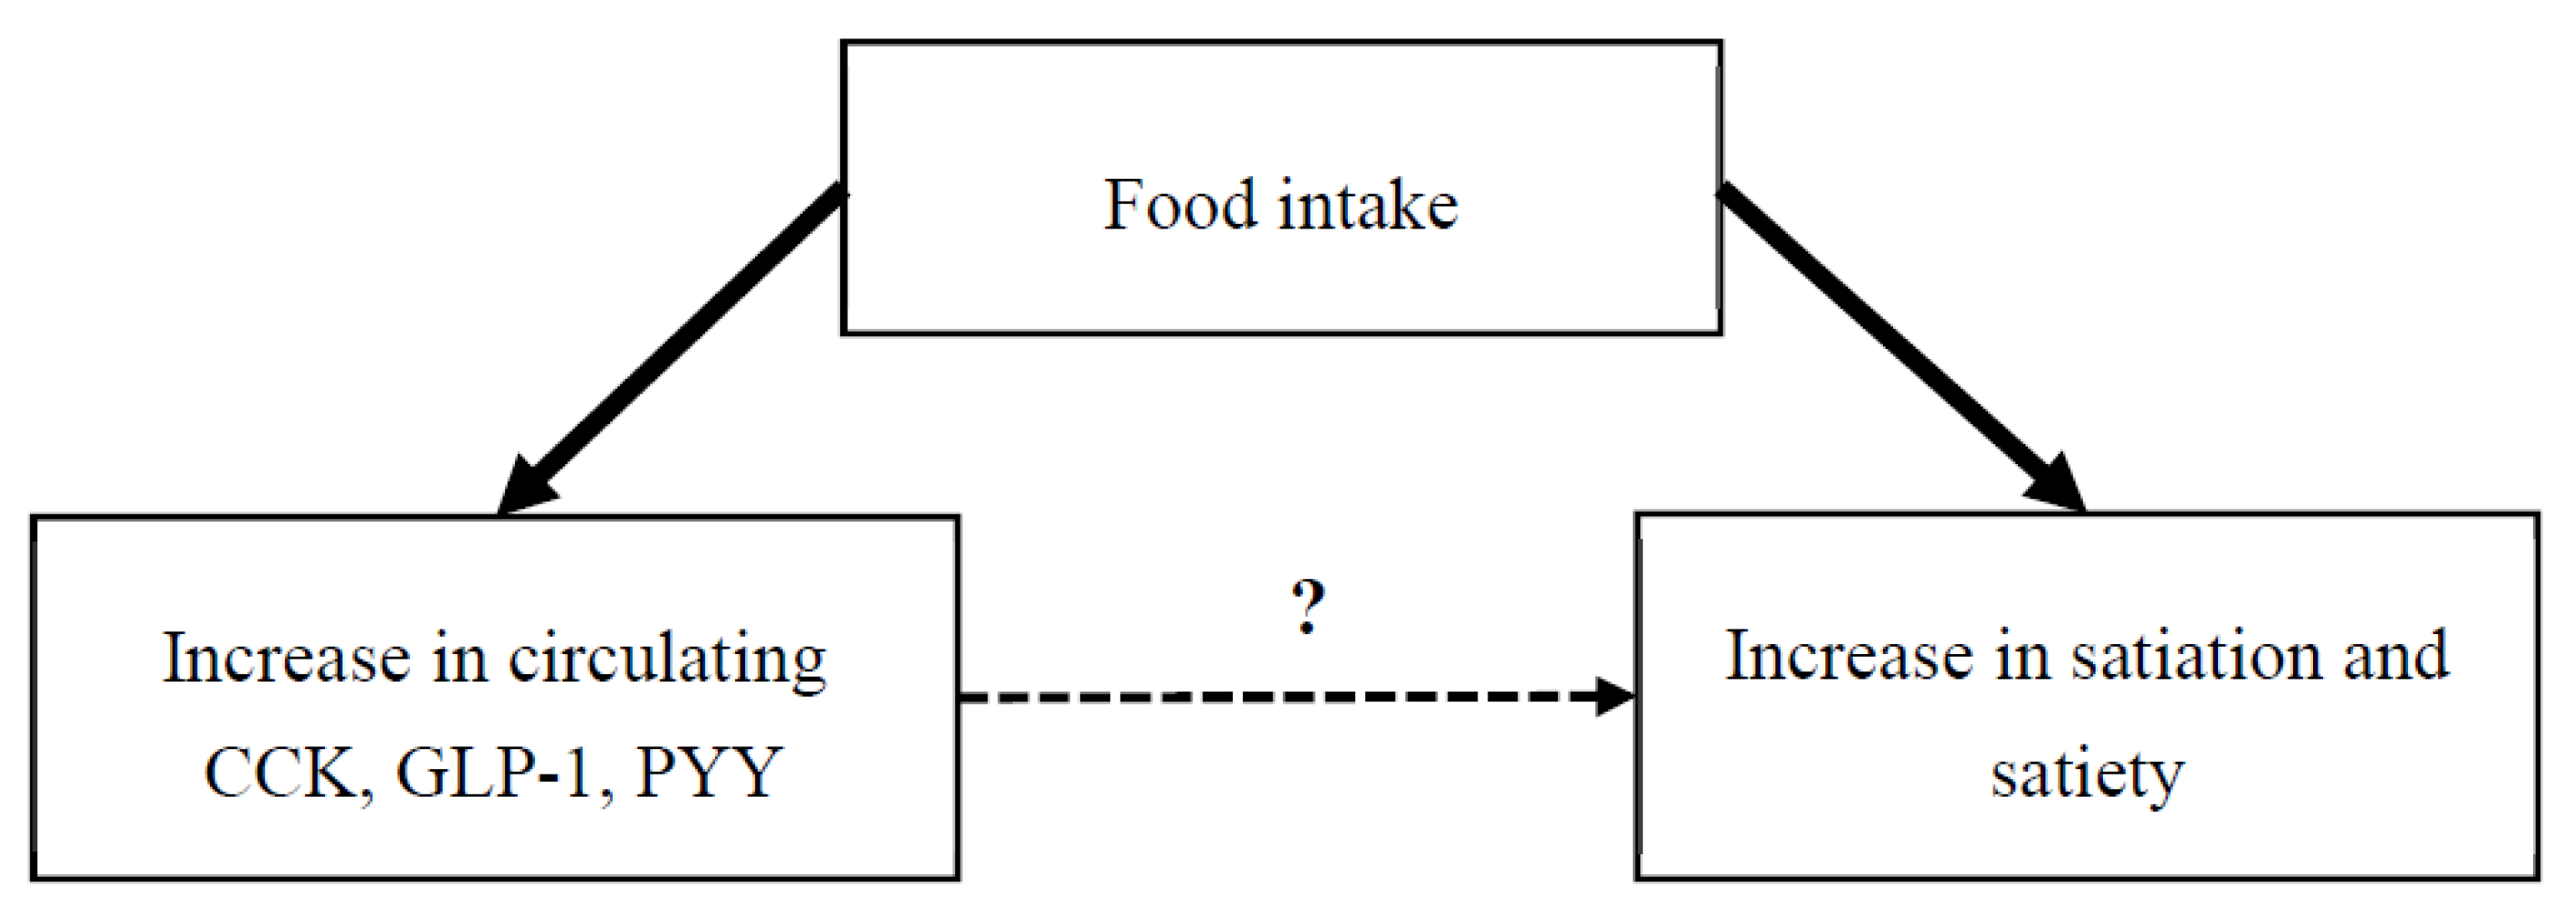
1. Introduction
2. Materials and Methods
3. Results
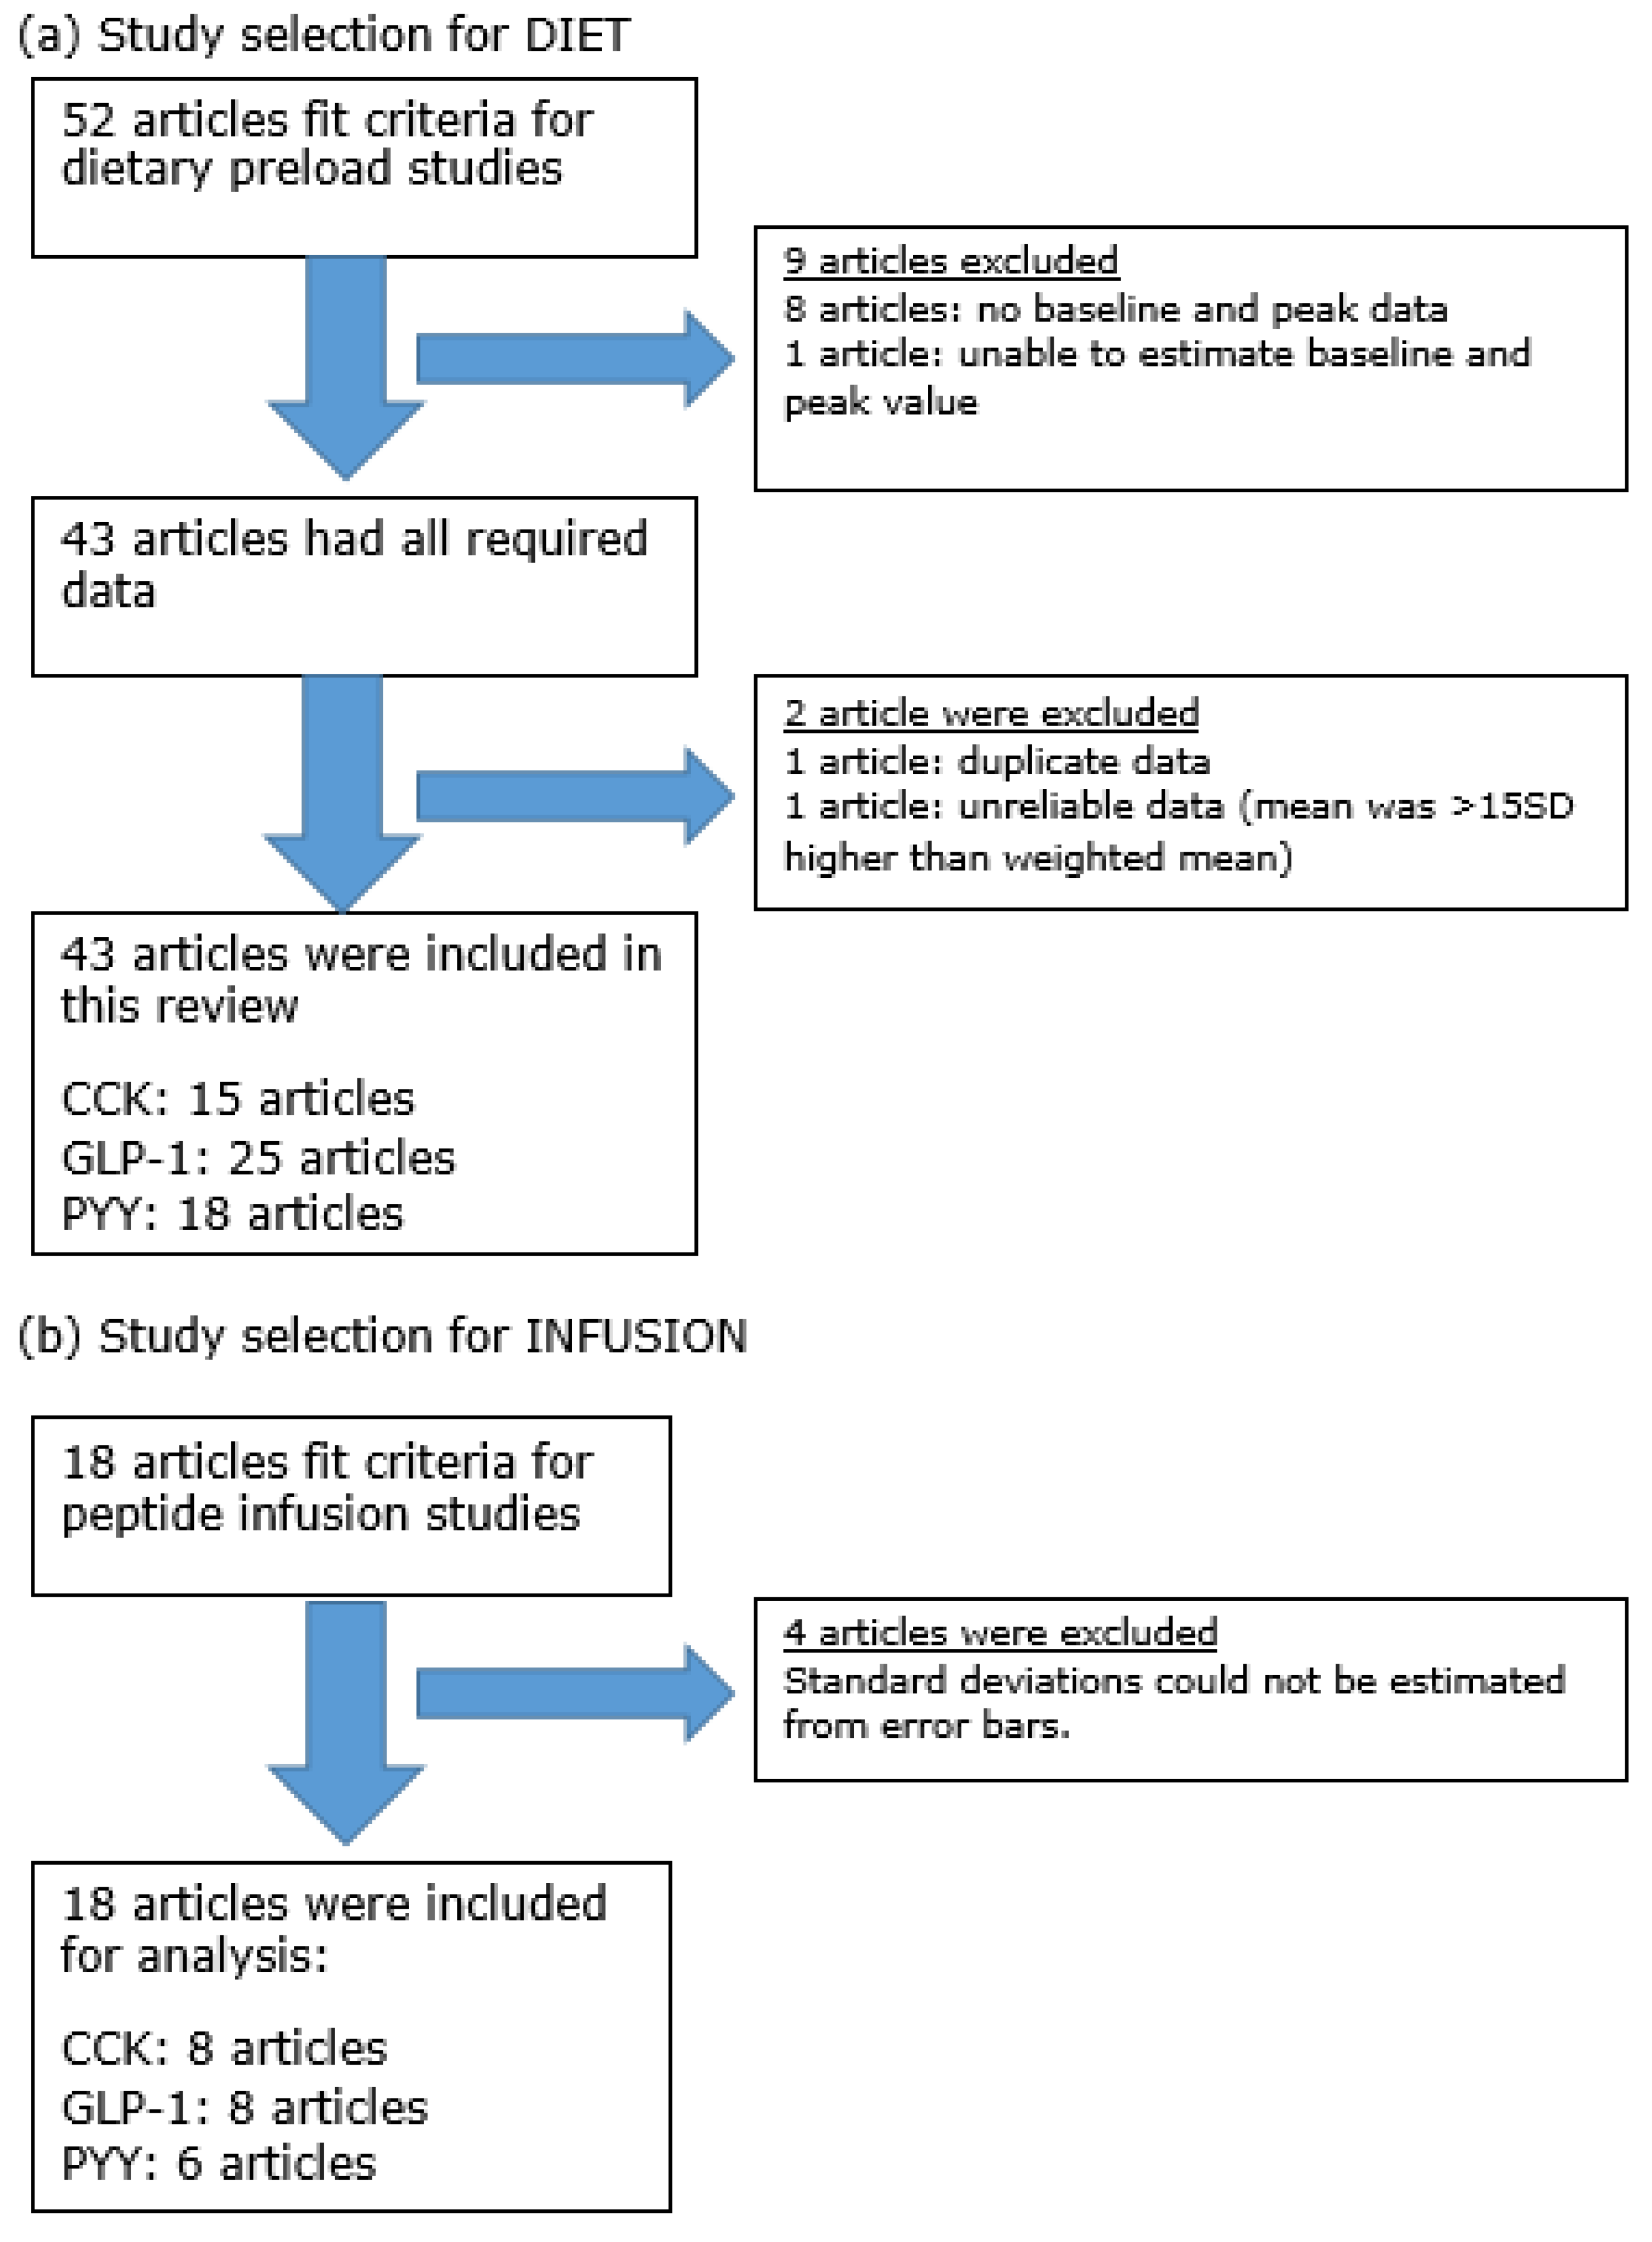
3.1. Search Results
3.2. Study Characteristics

| Reference | Gender | N | Oral Preload (mins) | Infusion Duration (mins) | Peptides | Dosage | Fold Change | Time of ad libitum Meal (mins) | Appetite Outcomes | |
|---|---|---|---|---|---|---|---|---|---|---|
| Sensation | FI | |||||||||
| Lieverse, et al. [63] | MF | 9 | — | t = 0–135 | CCK-33 | 0.2 pmol/kg ideal BW/min | 5.6 | t = 60 | ND | −12% |
| Ballinger et al. [62] | MF | 6 | 200 mL water (t = 20) | t = 0–40 | CCK-8 | 0.54 pmol/kg/min | 16.2 | t = 75 | — | −21% * |
| Lieverse et al. [61] | F | 10 | 552 kJ banana shake (t = 60) | t = 0–165 | CCK-33 | 0.2 pmol/kg/min | 4.4 | t = 75 | ND | −18% * |
| Gutzwiller, et al. [64] | M | 16 | 644 kJ banana shake (t = −20) | t = −5–5 | CCK-8 | 67.5 pmol/min | 4.9 | t = 0 – 60 | HGR▼, FUL▲ | −7% |
| MacIntosh, et al. [65] | MF | 12 | 744 kJ banana shake (t = 90) | t = 100–125 | CCK-8 | 0.9 pmol/kg/min | 18.7 | t = 140 | ND | −1% |
| MF | 12 | 744 kJ banana shake (t = 90) | t = 100–125 | CCK-8 | 2.7 pmol/kg/min | 37.8 | t = 140 | ND | −29% * | |
| Gutzwiller, et al. [66] | M | 24 | — | t = −60–60 | CCK-33 | 0.2 pmol/kg/min | 3.6 | t = 0 | ND | −11% * |
| M | 24 | — | t = −60–60 | GLP-1active | 0.9 pmol/kg/min | 4.0 | t = 0 | ND | −9% * | |
| Brennan, et al. [67] | M | 24 | — | t = 0–150 | CCK-8 | 1.8 pmol/kg/min | 3.8 | t = 120 | FUL▲ | −23% * |
| M | 24 | — | t = 0–150 | GLP-1active | 0.9 pmol/kg/min | 3.8 | t = 120 | ND | +1% | |
| Flint, et al. [68] | M | 19 | fixed meal (t = 0) | t = 0–240, 270–300 | GLP-1total | 0.83 pmol/kg/min | 8.4 | t = 120 | STT▲, HGR▼, FUL▲ | −12% * |
| Gutzwiller, et al. [69] | M | 16 | — | t = 0–80 | GLP-1active | 0.375 pmol/kg/min | 4.6 | t = 60 | HGR a | −7% |
| M | 16 | — | t = 0–80 | GLP-1active | 0.75 pmol/kg/min | 6.3 | t = 60 | HGR a | −11% * | |
| M | 16 | — | t = 0–80 | GLP-1active | 1.5 pmol/kg/min | 14.9 | t = 60 | HGR▼ b | −32% * | |
| Long, et al. [70] | M | 10 | 400 mL water (t = 20) | t= 0–60 | GLP-1total | 1.2 pmol/kg min | 9.7 | t = 40 | ND | −7% |
| Nagell, et al. [71] | NF | 8 | 300 mL beef tea (t = 15) | t = 0–60 | GLP-1total | 0.5 pmol/kg/min | 4.4 | — | HGR▼ | — |
| Neary, et al. [72] | MF | 10 | — | t = 0–120 | GLP-1total | 0.4 pmol/kg/min | 2.9 | t = 90 | — | −5% |
| MF | 10 | — | t = 0–120 | PYY | 0.4 pmol/kg/min | 6.7 | t = 90 | — | −15% | |
| Little, et al. [73] | M | 10 | 100 g minced beef tea (t = 15) | t = −30–120 | GLP-1total | 0.3 pmol/kg/min | 2.5 | — | ND | — |
| M | 10 | 100 g minced beef tea (t = 15) | t = −30–120 | GLP-1total | 0.9 pmol/kg/min | 4.3 | — | ND | — | |
| Batterham, et al. [74] | MF | 12 | — | t = 0–90 | PYY | 0.8 pmol/kg/min | 5.2 | t = 210 | HGR▼ | −33% * |
| Degen, et al. [75] | M | 16 | — | t = −60–30 | PYY | 0.2 pmol/kg/min | 2.1 | t = 0 | HGR a | −7% |
| M | 16 | — | t = −60–30 | PYY | 0.4 pmol/kg/min | 3.1 | t = 0 | HGR a | −11% * | |
| M | 16 | — | t = −60–30 | PYY | 0.6 pmol/kg/min | 5.1 | t = 0 | HGR▼ b | −32% * | |
| le Roux et al. [35] | M | 6 | — | t = 0–90 | PYY | 0.2 pmol/kg/min | 2.3 | t = 210 | FUL a | +2% |
| M | 6 | — | t = 0–90 | PYY | 0.4 pmol/kg/min | 3.6 | t = 210 | FUL a | −6% | |
| M | 6 | — | t = 0–90 | PYY | 0.5 pmol/kg/min | 4.3 | t = 210 | FUL▲ b | −12% | |
| M | 6 | — | t = 0–90 | PYY | 0.6 pmol/kg/min | 4.8 | t = 210 | FUL▲ b | −16% | |
| M | 6 | — | t = 0–90 | PYY | 0.7 pmol/kg/min | 5.5 | t = 210 | FUL▲ b | −22% * | |
| M | 6 | — | t = 0–90 | PYY | 0.8 pmol/kg/min | 6.8 | t = 210 | FUL▲ b | −23% * | |
| Batterham, et al. [76] | M | 8 | — | t = 0–90 | PYY | 0.8 pmol/kg/min | 2.3 | t = 120 | PCF▼ | −25% * |
| le Roux, et al. [77] | M | 6 | — | t = 0–90 | PYY | 1.0 pmol/kg/min | 11.2 | t = 210 | STT▲ | −18% * |
| M | 6 | — | t = 0–90 | PYY | 1.0 pmol/kg/min | 7.2 | t = 210 | STT▲ | −21% * | |
| M | 6 | — | t = 0–90 | PYY | 1.0 pmol/kg/min | 6.9 | t = 210 | STT▲ | −20% * | |
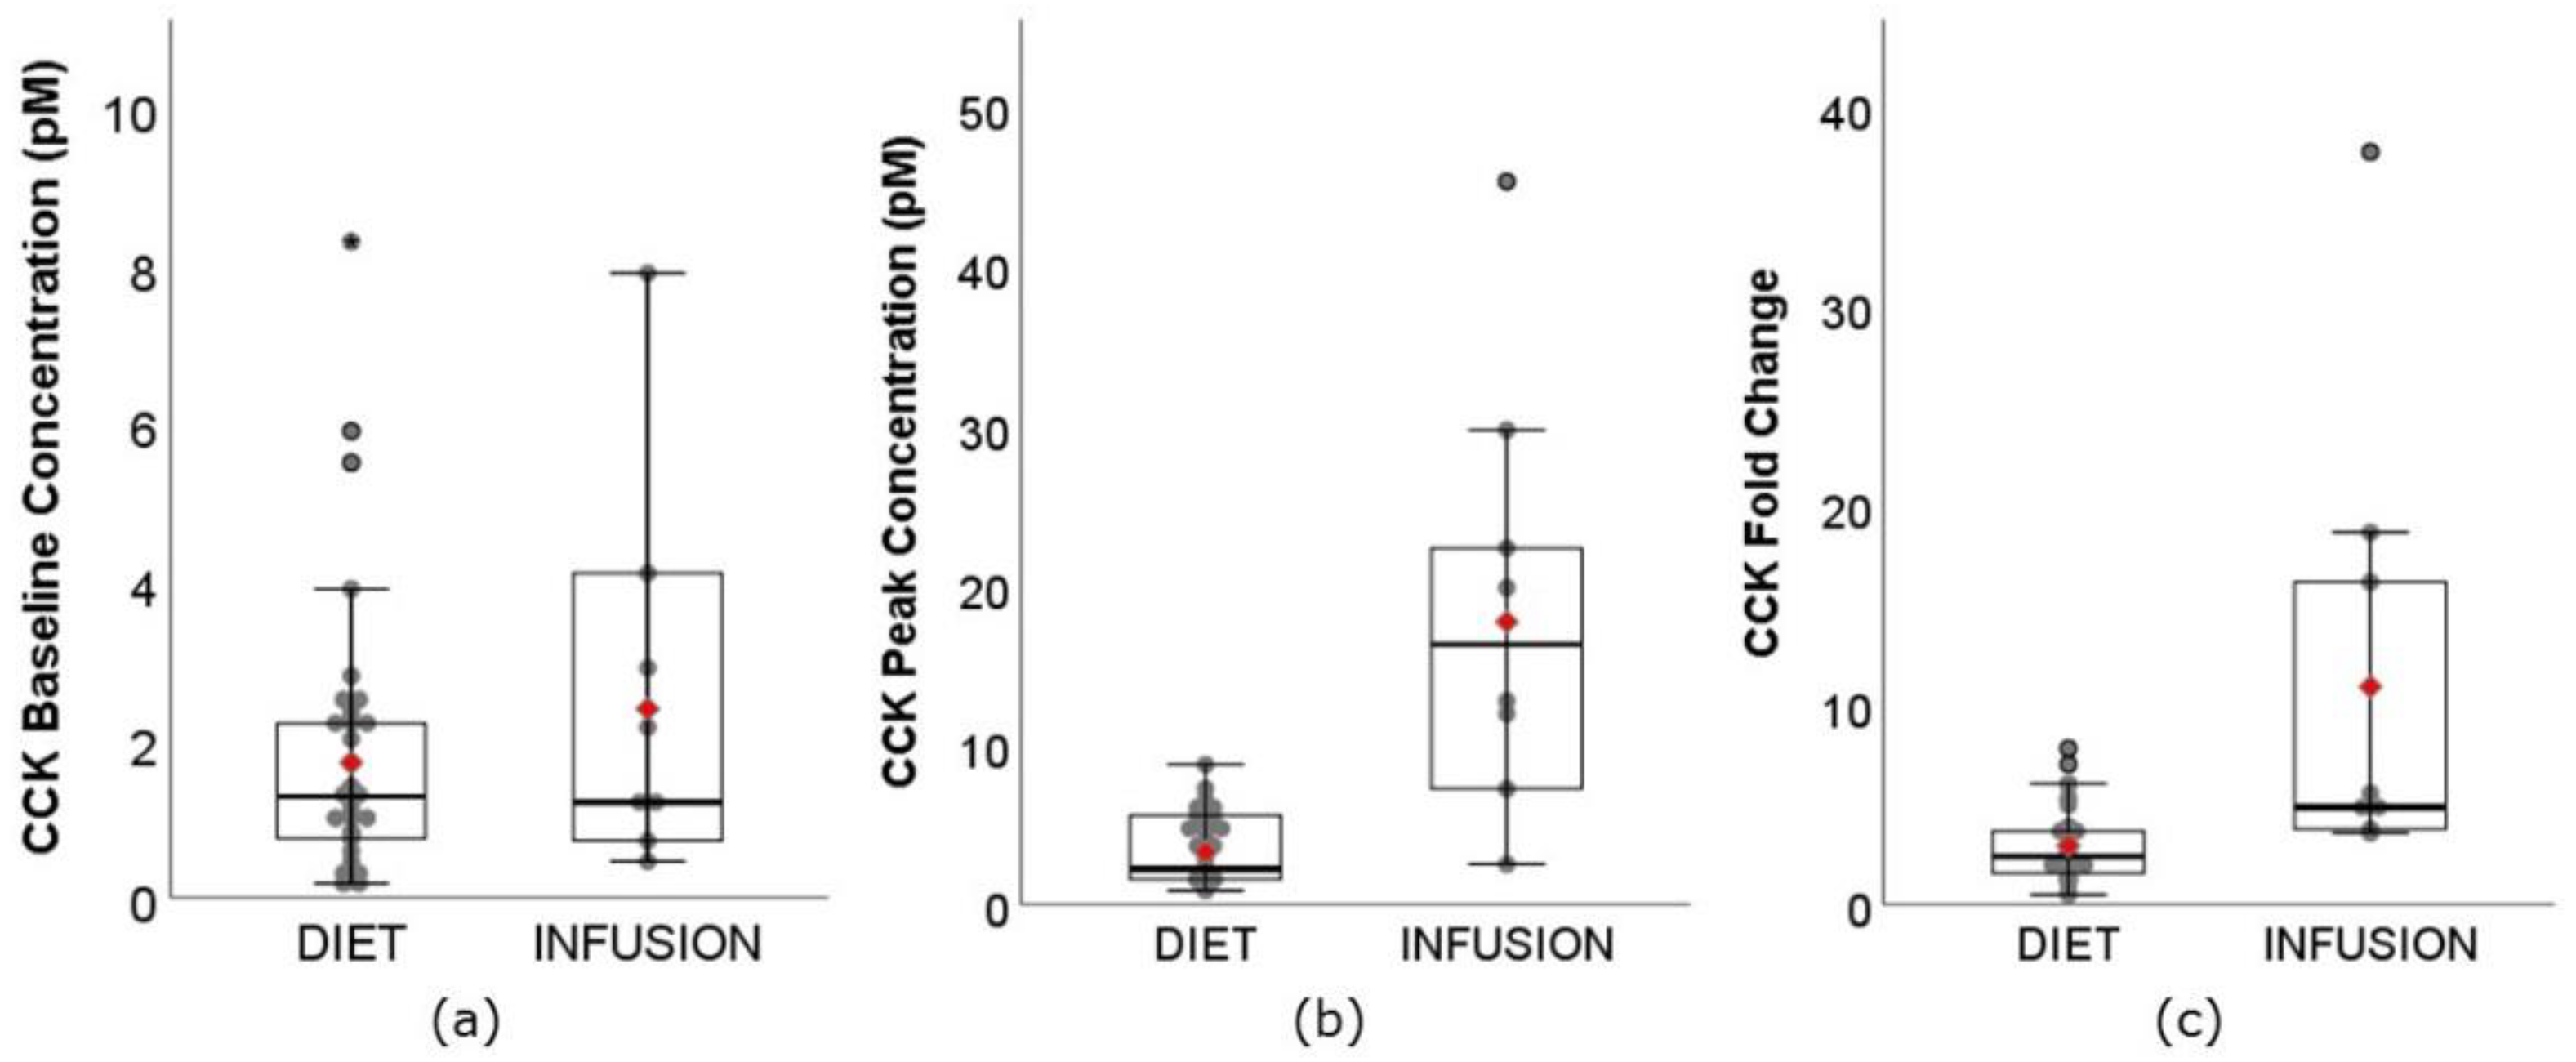
3.3. CCK
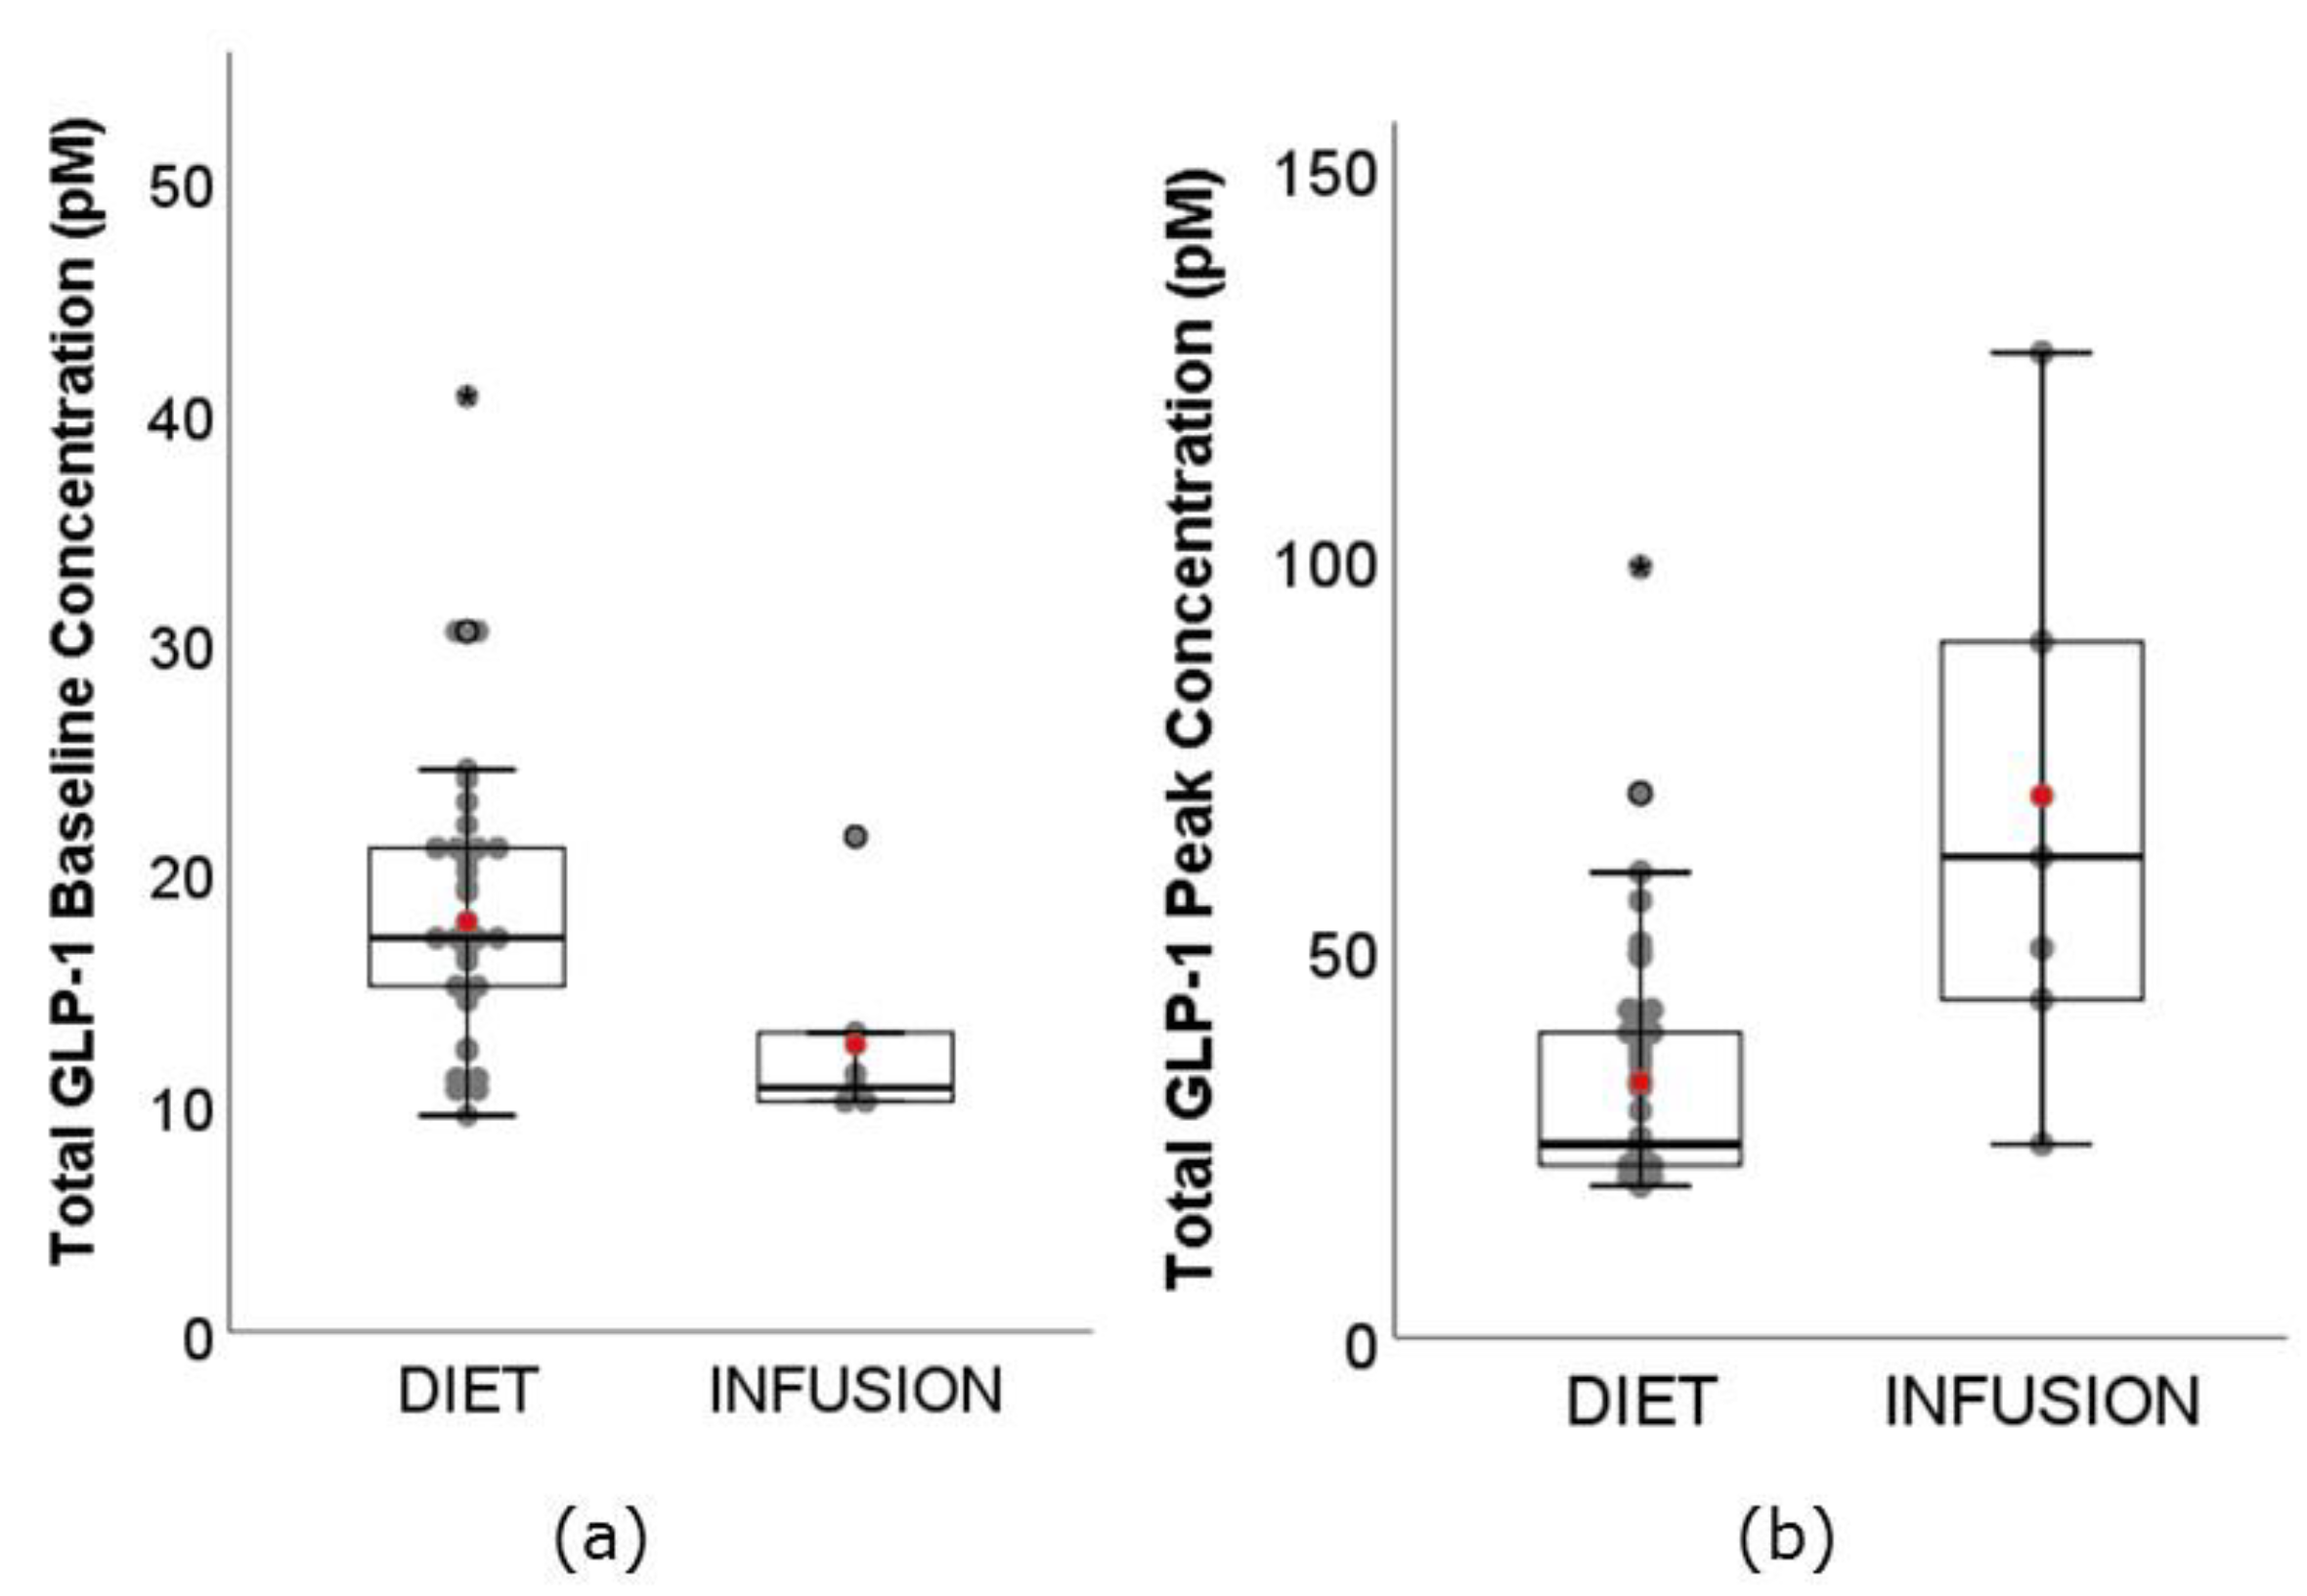
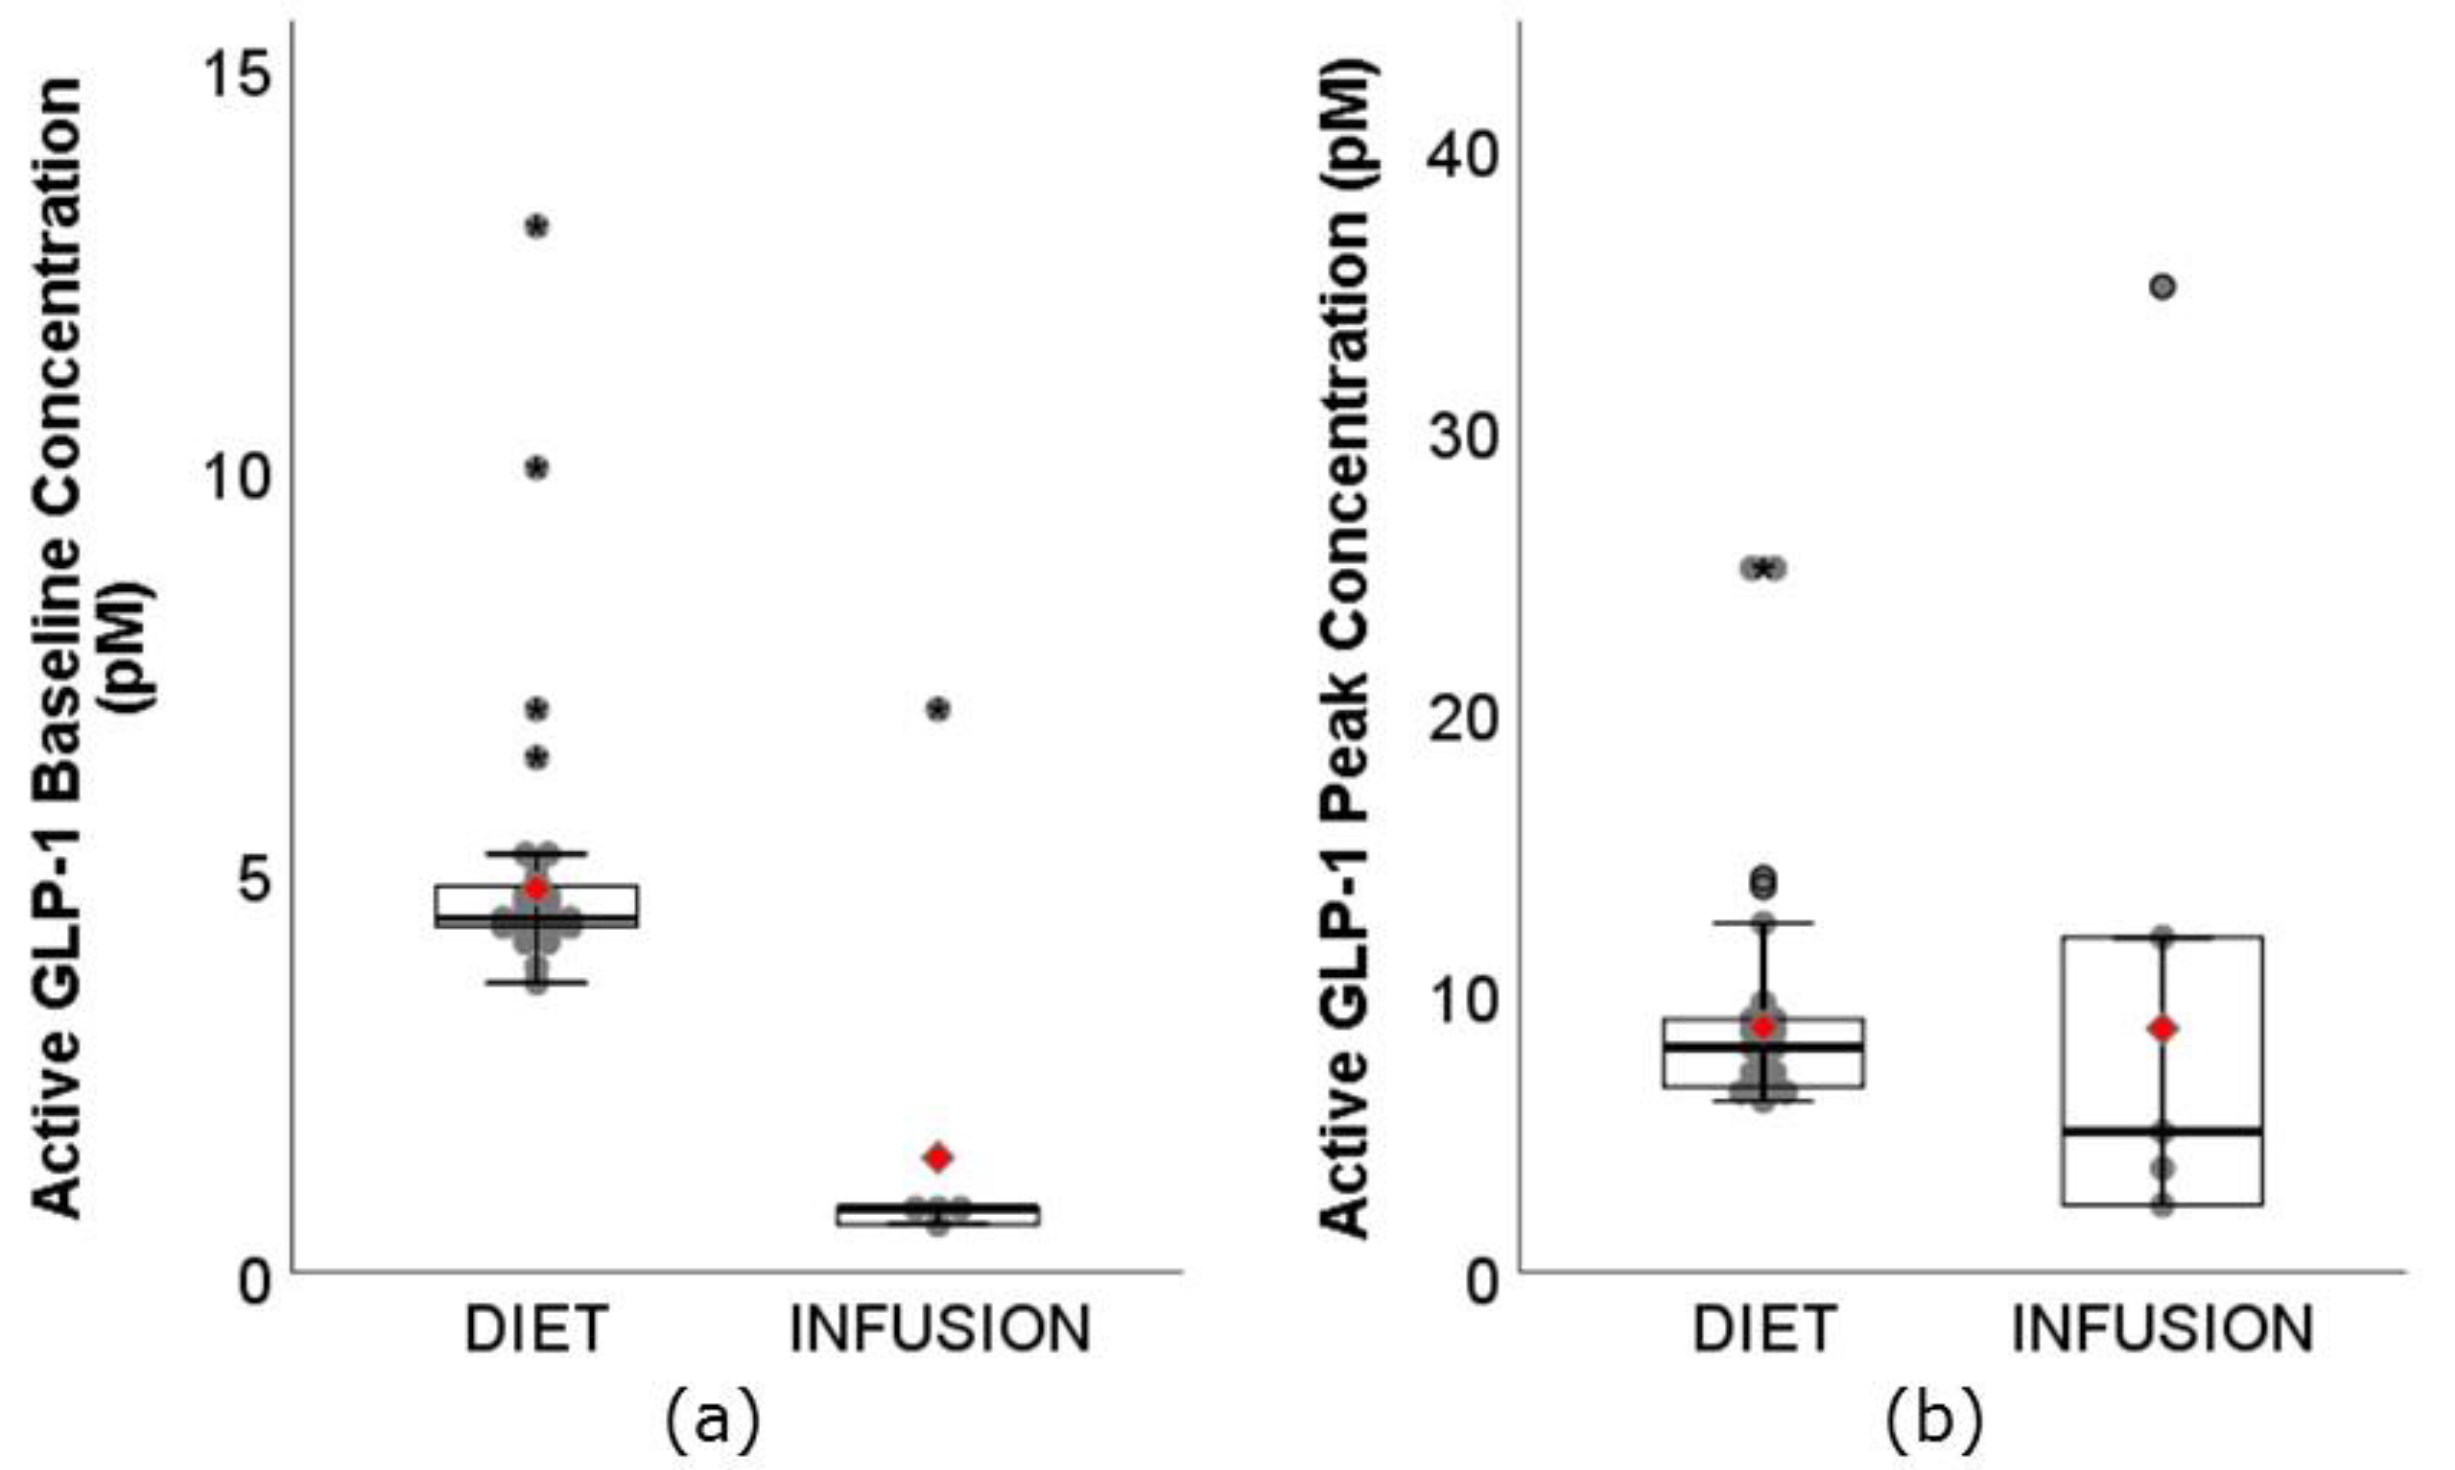
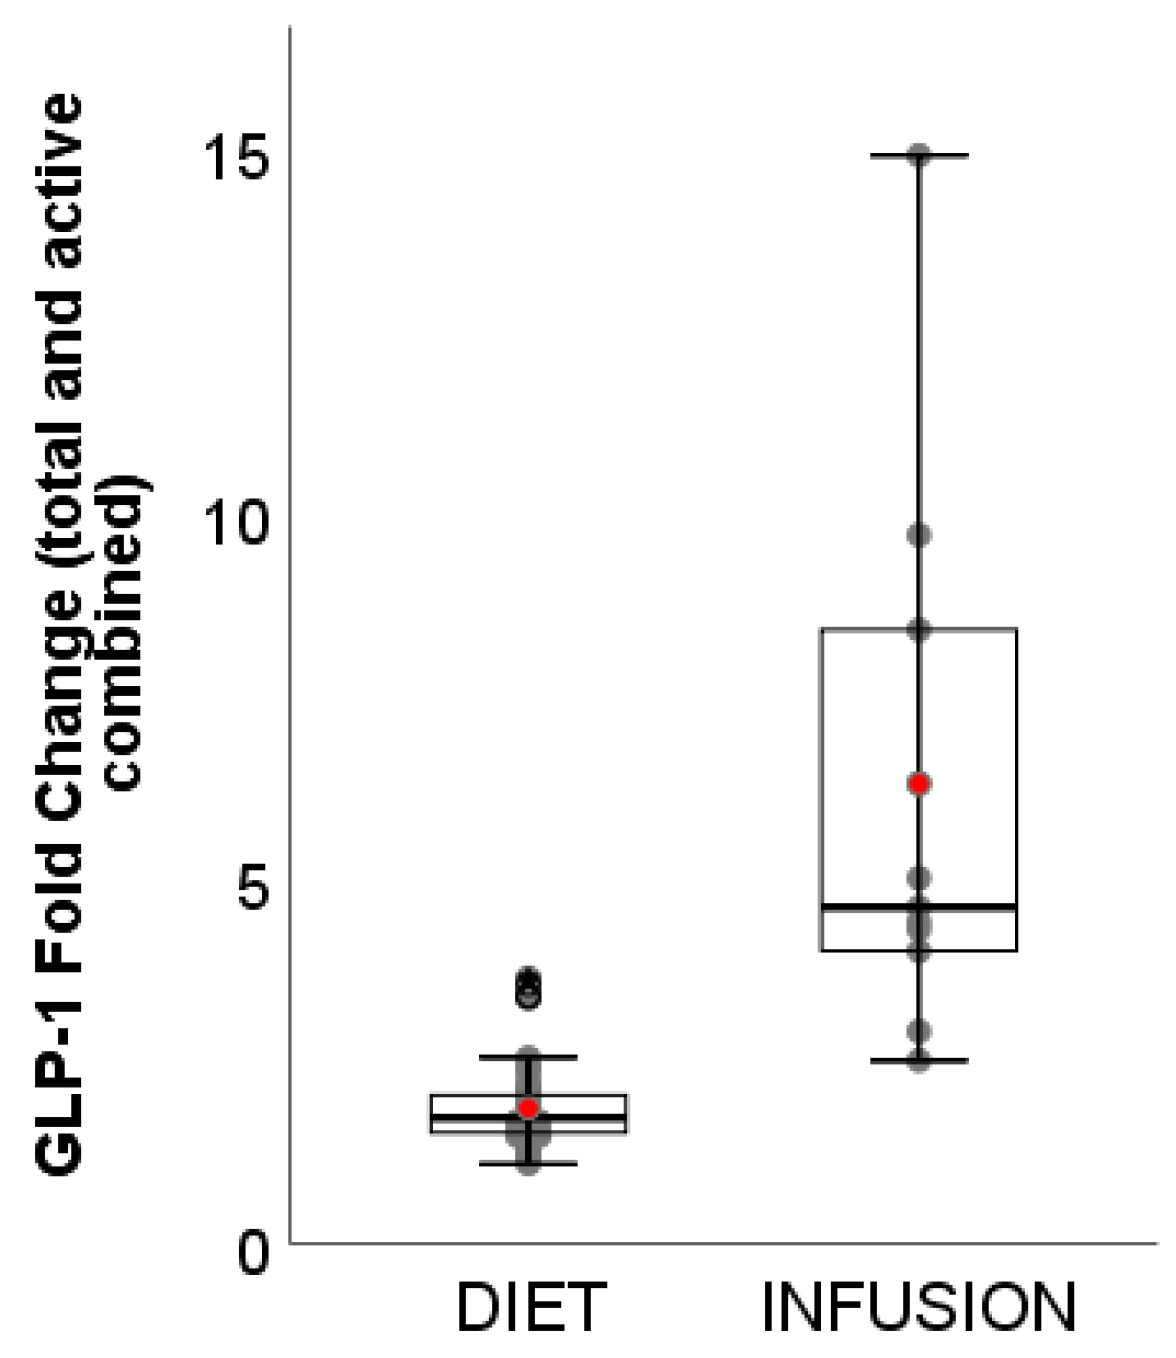
3.4. GLP-1
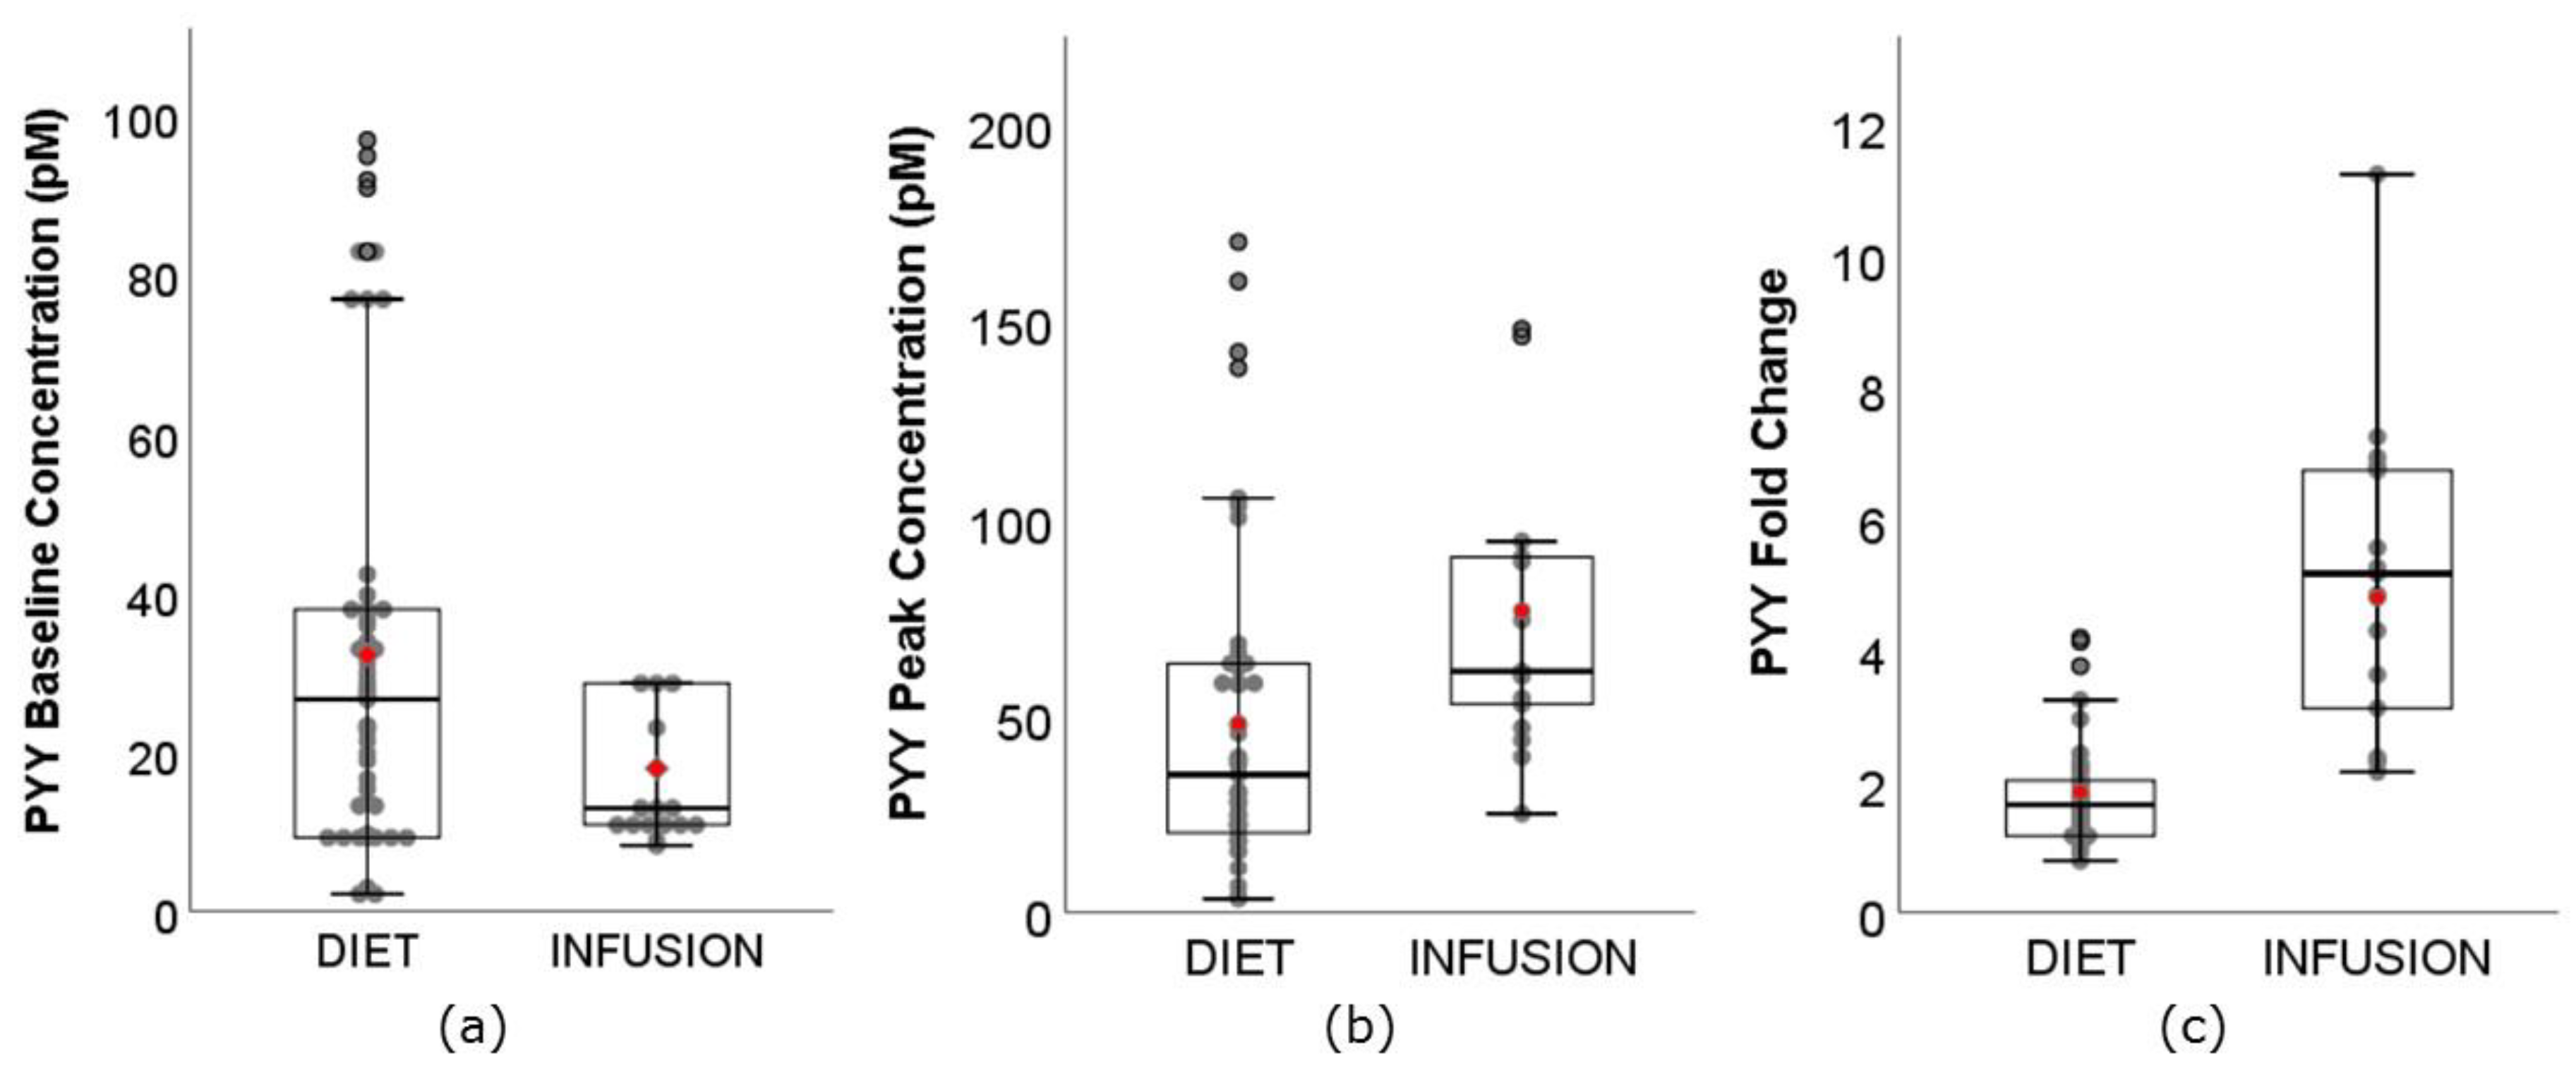
3.5. PYY
4. Discussion
4.1. Exploring the Relationship between Circulating GI Peptides and Appetite Outcomes
4.2. Implications for the Development of Satiety-Enhancing Novel Food Products
4.3. Limitations and Recommendations for Future Studies
5. Conclusions
Author Contributions
Funding
Conflicts of Interest
References
- Chambers, L.; McCrickerd, K.; Yeomans, M.R. Optimising foods for satiety. Trends Food Sci. Technol. 2015, 41, 149–160. [Google Scholar] [CrossRef]
- Poppitt, S.D.; Shin, H.S.; McGill, A.T.; Budgett, S.C.; Lo, K.; Pahl, M.; Duxfield, J.; Lane, M.; Ingram, J.R. Duodenal and ileal glucose infusions differentially alter gastrointestinal peptides, appetite response, and food intake: A tube feeding study. Am. J. Clin. Nutr. 2017, 106, 725–735. [Google Scholar] [CrossRef] [PubMed][Green Version]
- van Avesaat, M.; Ripken, D.; Hendriks, H.F.; Masclee, A.A.; Troost, F.J. Small intestinal protein infusion in humans: Evidence for a location-specific gradient in intestinal feedback on food intake and GI peptide release. Int. J. Obes. 2017, 41, 217–224. [Google Scholar] [CrossRef] [PubMed]
- Lacy, B.E.; Carter, J.; Weiss, J.E.; Crowell, M.D. The effects of intraduodenal nutrient infusion on serum CCK, LES pressure, and gastroesophageal reflux. Neurogastroenterol. Motil. 2011, 23, 631-e256. [Google Scholar] [CrossRef] [PubMed]
- Giezenaar, C.; Luscombe-Marsh, N.D.; Hutchison, A.T.; Standfield, S.; Feinle-Bisset, C.; Horowitz, M.; Chapman, I.; Soenen, S. Dose-dependent effects of randomized intraduodenal whey-protein loads on glucose, gut hormone, and amino acid concentrations in healthy older and younger men. Nutrients 2018, 10. [Google Scholar] [CrossRef] [PubMed]
- Ryan, A.T.; Luscombe-Marsh, N.D.; Saies, A.A.; Little, T.J.; Standfield, S.; Horowitz, M.; Feinle-Bisset, C. Effects of intraduodenal lipid and protein on gut motility and hormone release, glycemia, appetite, and energy intake in lean men. Am. J. Clin. Nutr. 2013, 98, 300–311. [Google Scholar] [CrossRef] [PubMed]
- Maljaars, P.W.J.; van der Wal, R.J.P.; Wiersma, T.; Peters, H.P.F.; Haddeman, E.; Masclee, A.A.M. The effect of lipid droplet size on satiety and peptide secretion is intestinal site-specific. Clin. Nutr. 2012, 31, 535–542. [Google Scholar] [CrossRef] [PubMed]
- Schmidt, W.E.; Creutzfeldt, W.; Schleser, A.; Choudhury, A.R.; Nustede, R.; Hocker, M.; Nitsche, R.; Sostmann, H.; Rovati, L.C.; Folsch, U.R. Role of CCK in regulation of pancreaticobiliary functions and GI motility in humans: Effects of loxiglumide. Am. J. Physiol. 1991, 260, G197–G206. [Google Scholar] [CrossRef]
- Holst, J.J.; Gromada, J. Role of incretin hormones in the regulation of insulin secretion in diabetic and nondiabetic humans. Am. J. Physiol. Endocrinol. Metab. 2004, 287, E199–E206. [Google Scholar] [CrossRef]
- Savage, A.P.; Adrian, T.E.; Carolan, G.; Chatterjee, V.K.; Bloom, S.R. Effects of Peptide YY (PYY) on mouth to caecum intestinal transit time and on the rate of gastric emptying in healthy volunteers. Gut 1987, 28, 166–170. [Google Scholar] [CrossRef]
- Blundell, J.; de Graaf, C.; Hulshof, T.; Jebb, S.; Livingstone, B.; Lluch, A.; Mela, D.; Salah, S.; Schuring, E.; van der Knaap, H.; et al. Appetite control: Methodological aspects of the evaluation of foods. Obes. Rev. 2010, 11, 251–270. [Google Scholar] [CrossRef] [PubMed]
- Prinz, P.; Stengel, A. Control of food intake by gastrointestinal peptides: Mechanisms of action and possible modulation in the treatment of obesity. J. Neurogastroenterol. Motil. 2017, 23, 180–196. [Google Scholar] [CrossRef] [PubMed]
- Drucker, D.J. Mechanisms of action and therapeutic application of glucagon-like peptide-1. Cell Metab. 2018, 27, 740–756. [Google Scholar] [CrossRef] [PubMed]
- Neary, M.T.; Batterham, R.L. Gut hormones: Implications for the treatment of obesity. Pharmacl. Ther. 2009, 124, 44–56. [Google Scholar] [CrossRef] [PubMed]
- Htike, Z.Z.; Zaccardi, F.; Papamargaritis, D.; Webb, D.R.; Khunti, K.; Davies, M.J. Efficacy and safety of glucagon-like peptide-1 receptor agonists in type 2 diabetes: A systematic review and mixed-treatment comparison analysis. Diabetes Obes. Metab. 2017, 19, 524–536. [Google Scholar] [CrossRef] [PubMed]
- de Boer, S.A.; Lefrandt, J.D.; Petersen, J.F.; Boersma, H.H.; Mulder, D.J.; Hoogenberg, K. The effects of GLP-1 analogues in obese, insulin-using type 2 diabetes in relation to eating behaviour. Int. J. Clin. Pharm. 2016, 38, 144–151. [Google Scholar] [CrossRef] [PubMed]
- Vilsbøll, T.; Christensen, M.; Junker, A.E.; Knop, F.K.; Gluud, L.L. Effects of glucagon-like peptide-1 receptor agonists on weight loss: Systematic review and meta-analyses of randomised controlled trials. BMJ 2012, 344, D7771. [Google Scholar] [CrossRef]
- Mars, M.; Stafleu, A.; de Graaf, C. Use of satiety peptides in assessing the satiating capacity of foods. Physiol. Behav. 2012, 105, 483–488. [Google Scholar] [CrossRef]
- Veldhorst, M.A.; Nieuwenhuizen, A.G.; Hochstenbach-Waelen, A.; van Vught, A.J.; Westerterp, K.R.; Engelen, M.P.; Brummer, R.J.; Deutz, N.E.; Westerterp-Plantenga, M.S. Dose-dependent satiating effect of whey relative to casein or soy. Physiol. Behav. 2009, 96, 675–682. [Google Scholar] [CrossRef]
- Dougkas, A.; Ostman, E. Protein-enriched liquid preloads varying in macronutrient content modulate appetite and appetite-regulating hormones in healthy adults. J. Nutr. 2016, 146, 637–645. [Google Scholar] [CrossRef]
- Smeets, A.J.; Westerterp-Plantenga, M.S. The acute effects of a lunch containing capsaicin on energy and substrate utilisation, hormones, and satiety. Eur. J. Nutr. 2009, 48, 229–234. [Google Scholar] [CrossRef] [PubMed]
- Smeets, A.J.; Soenen, S.; Luscombe-Marsh, N.D.; Ueland, O.; Westerterp-Plantenga, M.S. Energy expenditure, satiety, and plasma ghrelin, glucagon-like peptide 1, and peptide tyrosine-tyrosine concentrations following a single high-protein lunch. J. Nutr. 2008, 138, 698–702. [Google Scholar] [CrossRef] [PubMed]
- Nolan, L.J.; Guss, J.L.; Liddle, R.A.; Pi-Sunyer, F.X.; Kissileff, H.R. Elevated plasma cholecystokinin and appetitive ratings after consumption of a liquid meal in humans. Nutrition 2003, 19, 553–557. [Google Scholar] [CrossRef]
- Hall, W.L.; Millward, D.J.; Long, S.J.; Morgan, L.M. Casein and whey exert different effects on plasma amino acid profiles, gastrointestinal hormone secretion and appetite. Br. J. Nutr. 2003, 89, 239–248. [Google Scholar] [CrossRef] [PubMed]
- Bakhoj, S.; Flint, A.; Holst, J.J.; Tetens, I. Lower glucose-dependent insulinotropic polypeptide (GIP) response but similar glucagon-like peptide 1 (GLP-1), glycaemic, and insulinaemic response to ancient wheat compared to modern wheat depends on processing. Eur. J. Clin. Nutr. 2003, 57, 1254–1261. [Google Scholar] [CrossRef] [PubMed]
- Frost, G.S.; Brynes, A.E.; Dhillo, W.S.; Bloom, S.R.; McBurney, M.I. The effects of fiber enrichment of pasta and fat content on gastric emptying, GLP-1, glucose, and insulin responses to a meal. Eur. J. Clin. Nutr. 2003, 57, 293–298. [Google Scholar] [CrossRef] [PubMed]
- Pasman, W.J.; Blokdijk, V.M.; Bertina, F.M.; Hopman, W.P.; Hendriks, H.F. Effect of two breakfasts, different in carbohydrate composition, on hunger and satiety and mood in healthy men. Int. J. Obes. Relat. Metab. Disord. 2003, 27, 663–668. [Google Scholar] [CrossRef] [PubMed]
- Adam, T.C.M. Glucagon-Like Peptide 1 Stimulation in Relation to Body Weight; University Maastricht: Maastricht, The Netherlands, 2004. [Google Scholar]
- Sanggaard, K.M.; Holst, J.J.; Rehfeld, J.F.; Sandstrom, B.; Raben, A.; Tholstrup, T. Different effects of whole milk and a fermented milk with the same fat and lactose content on gastric emptying and postprandial lipaemia, but not on glycaemic response and appetite. Br. J. Nutr. 2004, 92, 447–459. [Google Scholar] [CrossRef]
- Burton-Freeman, B. Sex and cognitive dietary restraint influence cholecystokinin release and satiety in response to preloads varying in fatty acid composition and content. J. Nutr. 2005, 135, 1407–1414. [Google Scholar] [CrossRef]
- Adam, T.C.; Westerterp-Plantenga, M.S. Glucagon-like peptide-1 release and satiety after a nutrient challenge in normal-weight and obese subjects. Br. J. Nutr. 2005, 93, 845–851. [Google Scholar] [CrossRef]
- Weickert, M.O.; Mohlig, M.; Koebnick, C.; Holst, J.J.; Namsolleck, P.; Ristow, M.; Osterhoff, M.; Rochlitz, H.; Rudovich, N.; Spranger, J.; et al. Impact of cereal fibre on glucose-regulating factors. Diabetologia 2005, 48, 2343–2353. [Google Scholar] [CrossRef] [PubMed]
- Batterham, R.L.; Heffron, H.; Kapoor, S.; Chivers, J.E.; Chandarana, K.; Herzog, H.; Le Roux, C.W.; Thomas, E.L.; Bell, J.D.; Withers, D.J. Critical role for Peptide YY in protein-mediated satiation and body-weight regulation. Cell Metab. 2006, 4, 223–233. [Google Scholar] [CrossRef] [PubMed]
- Blom, W.A.; Lluch, A.; Stafleu, A.; Vinoy, S.; Holst, J.J.; Schaafsma, G.; Hendriks, H.F. Effect of a high-protein breakfast on the postprandial ghrelin response. Am. J. Clin. Nutr. 2006, 83, 211–220. [Google Scholar] [CrossRef] [PubMed]
- le Roux, C.W.; Batterham, R.L.; Aylwin, S.J.; Patterson, M.; Borg, C.M.; Wynne, K.J.; Kent, A.; Vincent, R.P.; Gardiner, J.; Ghatei, M.A.; et al. Attenuated Peptide YY release in obese subjects is associated with reduced satiety. Endocrinology 2006, 147, 3–8. [Google Scholar] [CrossRef] [PubMed]
- Weickert, M.O.; Spranger, J.; Holst, J.J.; Otto, B.; Koebnick, C.; Mohlig, M.; Pfeiffer, A.F. Wheat-fibre-induced changes of postprandial Peptide YY and ghrelin responses are not associated with acute alterations of satiety. Br. J. Nutr. 2006, 96, 795–798. [Google Scholar] [CrossRef] [PubMed]
- Doucet, E.; Laviolette, M.; Imbeault, P.; Strychar, I.; Rabasa-Lhoret, R.; Prud’homme, D. Total Peptide YY is a correlate of postprandial energy expenditure but not of appetite or energy intake in healthy women. Metabolism 2008, 57, 1458–1464. [Google Scholar] [CrossRef] [PubMed]
- Sorensen, L.B.; Cueto, H.T.; Andersen, M.T.; Bitz, C.; Holst, J.J.; Rehfeld, J.F.; Astrup, A. The effect of salatrim, a low-calorie modified triacylglycerol, on appetite and energy intake. Am. J. Clin. Nutr. 2008, 87, 1163–1169. [Google Scholar] [CrossRef]
- Zijlstra, N.; Mars, M.; de Wijk, R.A.; Westerterp-Plantenga, M.S.; Holst, J.J.; de Graaf, C. Effect of viscosity on appetite and gastro-intestinal hormones. Physiol. Behav. 2009, 97, 68–75. [Google Scholar] [CrossRef]
- Hlebowicz, J.; Hlebowicz, A.; Lindstedt, S.; Bjorgell, O.; Hoglund, P.; Holst, J.J.; Darwiche, G.; Almer, L.O. Effects of 1 and 3 g cinnamon on gastric emptying, satiety, and postprandial blood glucose, insulin, glucose-dependent insulinotropic polypeptide, glucagon-like peptide 1, and ghrelin concentrations in healthy subjects. Am. J. Clin. Nutr. 2009, 89, 815–821. [Google Scholar] [CrossRef]
- Veldhorst, M.A.; Nieuwenhuizen, A.G.; Hochstenbach-Waelen, A.; Westerterp, K.R.; Engelen, M.P.; Brummer, R.J.; Deutz, N.E.; Westerterp-Plantenga, M.S. Effects of complete whey-protein breakfasts versus whey without GMP-breakfasts on energy intake and satiety. Appetite 2009, 52, 388–395. [Google Scholar] [CrossRef]
- Veldhorst, M.A.; Nieuwenhuizen, A.G.; Hochstenbach-Waelen, A.; Westerterp, K.R.; Engelen, M.P.; Brummer, R.J.; Deutz, N.E.; Westerterp-Plantenga, M.S. Comparison of the effects of a high- and normal-casein breakfast on satiety, ‘satiety’ hormones, plasma amino acids and subsequent energy intake. Br. J. Nutr. 2009, 101, 295–303. [Google Scholar] [CrossRef] [PubMed]
- Veldhorst, M.A.; Nieuwenhuizen, A.G.; Hochstenbach-Waelen, A.; Westerterp, K.R.; Engelen, M.P.; Brummer, R.J.; Deutz, N.E.; Westerterp-Plantenga, M.S. Effects of high and normal soyprotein breakfasts on satiety and subsequent energy intake, including amino acid and ‘satiety’ hormone responses. Eur. J. Nutr. 2009, 48, 92–100. [Google Scholar] [CrossRef] [PubMed]
- Nieuwenhuizen, A.G.; Hochstenbach-Waelen, A.; Veldhorst, M.A.; Westerterp, K.R.; Engelen, M.P.; Brummer, R.J.; Deutz, N.E.; Westerterp-Plantenga, M.S. Acute effects of breakfasts containing alpha-lactalbumin, or gelatin with or without added tryptophan, on hunger, ‘satiety’ hormones and amino acid profiles. Br. J. Nutr. 2009, 101, 1859–1866. [Google Scholar] [CrossRef] [PubMed]
- Kohnke, R.; Lindbo, A.; Larsson, T.; Lindqvist, A.; Rayner, M.; Emek, S.C.; Albertsson, P.A.; Rehfeld, J.F.; Landin-Olsson, M.; Erlanson-Albertsson, C. Thylakoids promote release of the satiety hormone cholecystokinin while reducing insulin in healthy humans. Scand. J. Gastroenterol. 2009, 44, 712–719. [Google Scholar] [CrossRef] [PubMed]
- Juvonen, K.R.; Salmenkallio-Marttila, M.; Lyly, M.; Liukkonen, K.H.; Lahteenmaki, L.; Laaksonen, D.E.; Uusitupa, M.I.; Herzig, K.H.; Poutanen, K.S.; Karhunen, L.J. Semisolid meal enriched in oat bran decreases plasma glucose and insulin levels, but does not change gastrointestinal peptide responses or short-term appetite in healthy subjects. Nutr. Metab. Cardiovasc. Dis. 2011, 21, 748–756. [Google Scholar] [CrossRef] [PubMed]
- Juvonen, K.R.; Karhunen, L.J.; Vuori, E.; Lille, M.E.; Karhu, T.; Jurado-Acosta, A.; Laaksonen, D.E.; Mykkanen, H.M.; Niskanen, L.K.; Poutanen, K.S.; et al. Structure modification of a milk protein-based model food affects postprandial intestinal peptide release and fullness in healthy young men. Br. J. Nutr. 2011, 106, 1890–1898. [Google Scholar] [CrossRef] [PubMed]
- Brennan, I.M.; Luscombe-Marsh, N.D.; Seimon, R.V.; Otto, B.; Horowitz, M.; Wishart, J.M.; Feinle-Bisset, C. Effects of fat, protein, and carbohydrate and protein load on appetite, plasma cholecystokinin, Peptide YY, and ghrelin, and energy intake in lean and obese men. Am. J. Physiol. Gastrointest. Liver Physiol. 2012, 303, G129–G140. [Google Scholar] [CrossRef] [PubMed]
- Kim, S.J.; Lee, H.; Choue, R. Short-term effects of ratio of energy nutrients on appetite-related hormones in female college students. Clin. Nutr. Res. 2012, 1, 58–65. [Google Scholar] [CrossRef] [PubMed]
- Zhu, Y.; Hsu, W.H.; Hollis, J.H. The effect of food form on satiety. Int. J. Food Sci. Nutr. 2013, 64, 385–391. [Google Scholar] [CrossRef] [PubMed]
- van der Klaauw, A.A.; Keogh, J.M.; Henning, E.; Trowse, V.M.; Dhillo, W.S.; Ghatei, M.A.; Farooqi, I.S. High protein intake stimulates postprandial GLP1 and PYY release. Obesity 2013, 21, 1602–1607. [Google Scholar] [CrossRef]
- Little, T.J.; Luscombe-Marsh, N.D.; Gentilcore, D.; Brook, E.J.; Feinle-Bisset, C. Effects of varying the inter-meal interval on relationships between antral area, gut hormones and energy intake following a nutrient drink in healthy lean humans. Physiol. Behav. 2014, 135, 34–43. [Google Scholar] [CrossRef] [PubMed]
- Zhu, Y.; Hollis, J.H. Gastric emptying rate, glycemic and appetite response to a liquid meal in lean and overweight males. Int. J. Food Sci. Nutr. 2014, 65, 615–620. [Google Scholar] [CrossRef] [PubMed]
- Ohlsson, L.; Rosenquist, A.; Rehfeld, J.F.; Harrod, M. Postprandial effects on plasma lipids and satiety hormones from intake of liposomes made from fractionated oat oil: Two randomized crossover studies. Food Nutr. Res. 2014, 58. [Google Scholar] [CrossRef] [PubMed]
- Chungchunlam, S.M.; Henare, S.J.; Ganesh, S.; Moughan, P.J. Dietary whey protein influences plasma satiety-related hormones and plasma amino acids in normal-weight adult women. Eur. J. Clin. Nutr. 2015, 69, 179–186. [Google Scholar] [CrossRef] [PubMed]
- Bligh, H.F.; Godsland, I.F.; Frost, G.; Hunter, K.J.; Murray, P.; MacAulay, K.; Hyliands, D.; Talbot, D.C.; Casey, J.; Mulder, T.P.; et al. Plant-rich mixed meals based on palaeolithic diet principles have a dramatic impact on incretin, Peptide YY and satiety response, but show little effect on glucose and insulin homeostasis: An acute-effects randomised study. Br. J. Nutr. 2015, 113, 574–584. [Google Scholar] [CrossRef] [PubMed]
- Clamp, L.; Hehir, A.P.; Lambert, E.V.; Beglinger, C.; Goedecke, J.H. Lean and obese dietary phenotypes: Differences in energy and substrate metabolism and appetite. Br. J. Nutr. 2015, 114, 1724–1733. [Google Scholar] [CrossRef] [PubMed]
- Hutchison, A.T.; Piscitelli, D.; Horowitz, M.; Jones, K.L.; Clifton, P.M.; Standfield, S.; Hausken, T.; Feinle-Bisset, C.; Luscombe-Marsh, N.D. Acute load-dependent effects of oral whey protein on gastric emptying, gut hormone release, glycemia, appetite, and energy intake in healthy men. Am. J. Clin. Nutr. 2015, 102, 1574–1584. [Google Scholar] [CrossRef] [PubMed]
- Gonzalez-Anton, C.; Lopez-Millan, B.; Rico, M.C.; Sanchez-Rodriguez, E.; Ruiz-Lopez, M.D.; Gil, A.; Mesa, M.D. An enriched, cereal-based bread affects appetite ratings and glycemic, insulinemic, and gastrointestinal hormone responses in healthy adults in a randomized, controlled trial. J. Nutr. 2015, 145, 231–238. [Google Scholar] [CrossRef] [PubMed]
- Overduin, J.; Collet, T.H.; Medic, N.; Henning, E.; Keogh, J.M.; Forsyth, F.; Stephenson, C.; Kanning, M.W.; Ruijschop, R.; Farooqi, I.S.; et al. Failure of sucrose replacement with the non-nutritive sweetener erythritol to alter GLP-1 or PYY release or test meal size in lean or obese people. Appetite 2016, 107, 596–603. [Google Scholar] [CrossRef] [PubMed]
- Lieverse, R.J.; Jansen, J.B.; Masclee, A.A.; Lamers, C.B. Satiety effects of a physiological dose of cholecystokinin in humans. Gut 1995, 36, 176–179. [Google Scholar] [CrossRef] [PubMed]
- Ballinger, A.; McLoughlin, L.; Medbak, S.; Clark, M. Cholecystokinin is a satiety hormone in humans at physiological post-prandial plasma concentrations. Clin. Sci. 1995, 89, 375–381. [Google Scholar] [CrossRef] [PubMed]
- Lieverse, R.J.; Jansen, J.B.M.J.; van de Zwan, A.; Samson, L.; Masclee, A.A.M.; Lamers, C.B.H.W. Effects of a physiological dose of cholecystokinin on food intake and postprandial satiation in man. Regul. Pept. 1993, 43, 83–89. [Google Scholar] [CrossRef]
- Gutzwiller, J.-P.; Drewe, J.; Ketterer, S.; Hildebrand, P.; Krautheim, A.; Beglinger, C. Interaction between CCK and a preload on reduction of food intake is mediated by CCK-A receptors in humans. Am. J. Physiol. Regul. Integr. Comp. Physiol. 2000, 279, R189–R195. [Google Scholar] [CrossRef] [PubMed]
- MacIntosh, C.G.; Morley, J.E.; Wishart, J.; Morris, H.; Jansen, J.B.; Horowitz, M.; Chapman, I.M. Effect of exogenous cholecystokinin (CCK)-8 on food intake and plasma CCK, leptin, and insulin concentrations in older and young adults: Evidence for increased cck activity as a cause of the anorexia of aging. J. Clin. Endocrinol. Metab. 2001, 86, 5830–5837. [Google Scholar] [CrossRef] [PubMed]
- Gutzwiller, J.-P.; Degen, L.; Matzinger, D.; Prestin, S.; Beglinger, C. Interaction between GLP-1 and CCK-33 in inhibiting food intake and appetite in men. Am. J. Physiol. Regul. Integr. Comp. Physiol. 2004, 287, R562–R567. [Google Scholar] [CrossRef] [PubMed]
- Brennan, I.M.; Feltrin, K.L.; Horowitz, M.; Smout, A.J.; Meyer, J.H.; Wishart, J.; Feinle-Bisset, C. Evaluation of interactions between CCK and GLP-1 in their effects on appetite, energy intake, and antropyloroduodenal motility in healthy men. Am. J. Physiol. Regul. Integr. Comp Physiol. 2005, 288, R1477–R1485. [Google Scholar] [CrossRef] [PubMed]
- Flint, A.; Raben, A.; Astrup, A.; Holst, J.J. Glucagon-like peptide 1 promotes satiety and suppresses energy intake in humans. J. Clin. Investig. 1998, 101, 515–520. [Google Scholar] [CrossRef] [PubMed]
- Gutzwiller, J.P.; Goke, B.; Drewe, J.; Hildebrand, P.; Ketterer, S.; Handschin, D.; Winterhalder, R.; Conen, D.; Beglinger, C. Glucagon-like peptide-1: A potent regulator of food intake in humans. Gut 1999, 44, 81–86. [Google Scholar] [CrossRef] [PubMed]
- Long, S.J.; Sutton, J.A.; Amaee, W.B.; Giouvanoudi, A.; Spyrou, N.M.; Rogers, P.J.; Morgan, L.M. No effect of glucagon-like peptide-1 on short-term satiety and energy intake in man. Br. J. Nutr 1999, 81, 273–279. [Google Scholar] [CrossRef] [PubMed][Green Version]
- Nagell, C.F.; Wettergren, A.; Pedersen, J.F.; Mortensen, D.; Holst, J.J. Glucagon-like peptide-2 inhibits antral emptying in man, but is not as potent as glucagon-like peptide-1. Scand. J. Gastroenterol. 2004, 39, 353–358. [Google Scholar] [CrossRef] [PubMed]
- Neary, N.M.; Small, C.J.; Druce, M.R.; Park, A.J.; Ellis, S.M.; Semjonous, N.M.; Dakin, C.L.; Filipsson, K.; Wang, F.; Kent, A.S.; et al. Peptide YY3-36 and glucagon-like peptide-17-36 inhibit food intake additively. Endocrinology 2005, 146, 5120–5127. [Google Scholar] [CrossRef] [PubMed]
- Little, T.J.; Pilichiewicz, A.N.; Russo, A.; Phillips, L.; Jones, K.L.; Nauck, M.A.; Wishart, J.; Horowitz, M.; Feinle-Bisset, C. Effects of intravenous glucagon-like peptide-1 on gastric emptying and intragastric distribution in healthy subjects: Relationships with postprandial glycemic and insulinemic responses. J. Clin. Endocrinol. Metab. 2006, 91, 1916–1923. [Google Scholar] [CrossRef] [PubMed]
- Batterham, R.L.; Cowley, M.A.; Small, C.J.; Herzog, H.; Cohen, M.A.; Dakin, C.L.; Wren, A.M.; Brynes, A.E.; Low, M.J.; Ghatei, M.A.; et al. Gut hormone PYY3-36 physiologically inhibits food intake. Nature 2002, 418, 650–654. [Google Scholar] [CrossRef] [PubMed]
- Degen, L.; Oesch, S.; Casanova, M.; Graf, S.; Ketterer, S.; Drewe, J.; Beglinger, C. Effect of Peptide YY3-36 on food intake in humans. Gastroenterology 2005, 129, 1430–1436. [Google Scholar] [CrossRef] [PubMed]
- Batterham, R.L.; ffytche, D.H.; Rosenthal, J.M.; Zelaya, F.O.; Barker, G.J.; Withers, D.J.; Williams, S.C. PYY modulation of cortical and hypothalamic brain areas predicts feeding behaviour in humans. Nature 2007, 450, 106–109. [Google Scholar] [CrossRef] [PubMed]
- le Roux, C.W.; Borg, C.M.; Murphy, K.G.; Vincent, R.P.; Ghatei, M.A.; Bloom, S.R. Supraphysiological doses of intravenous PYY3-36 cause nausea, but no additional reduction in food intake. Ann. Clin. Biochem. 2008, 45, 93–95. [Google Scholar] [CrossRef] [PubMed]
- Deacon, C.F.; Pridal, L.; Klarskov, L.; Olesen, M.; Holst, J.J. Glucagon-like peptide 1 undergoes differential tissue-specific metabolism in the anesthetized pig. Am. J. Physiol. 1996, 271, E458–E464. [Google Scholar] [CrossRef] [PubMed]
- Hansen, L.; Deacon, C.F.; Ørskov, C.; Holst, J.J. Glucagon-like peptide-1-(7–36)amide is transformed to glucagon-like peptide-1-(9–36)amide by dipeptidyl peptidase IV in the capillaries supplying the L cells of the porcine intestine. Endocrinology 1999, 140, 5356–5363. [Google Scholar] [CrossRef] [PubMed]
- Brennan, I.M.; Little, T.J.; Feltrin, K.L.; Smout, A.J.; Wishart, J.M.; Horowitz, M.; Feinle-Bisset, C. Dose-dependent effects of cholecystokinin-8 on antropyloroduodenal motility, gastrointestinal hormones, appetite, and energy intake in healthy men. Am. J. Physiol. Endocrinol. Metab 2008, 295, E1487–E1494. [Google Scholar] [CrossRef] [PubMed]
- Dockray, G.J. Cholecystokinin and gut-brain signalling. Regul. Pept. 2009, 155, 6–10. [Google Scholar] [CrossRef]
- Steinert, R.E.; Feinle-Bisset, C.; Asarian, L.; Horowitz, M.; Beglinger, C.; Geary, N. Ghrelin, CCK, GLP-1, and PYY(3-36): Secretory controls and physiological roles in eating and glycemia in health, obesity, and after RYGB. Physiol. Rev. 2017, 97, 411–463. [Google Scholar] [CrossRef] [PubMed]
- Greenberg, D.; Smith, G.P. Hepatic-portal infusion reduces the satiating potency of CCK-8. Physiol. Behav. 1988, 44, 535–538. [Google Scholar] [CrossRef]
- Dailey, M.J.; Moran, T.H. Glucagon-like peptide 1 and appetite. Trends Endocrinol. Metab. 2013, 24, 85–91. [Google Scholar] [CrossRef] [PubMed]
- Poppitt, S.D.; McCormack, D.; Buffenstein, R. Short-term effects of macronutrient preloads on appetite and energy intake in lean women. Physiol. Behav. 1998, 64, 279–285. [Google Scholar] [CrossRef]
- Juvonen, K.R.; Purhonen, A.K.; Salmenkallio-Marttila, M.; Lahteenmaki, L.; Laaksonen, D.E.; Herzig, K.H.; Uusitupa, M.I.; Poutanen, K.S.; Karhunen, L.J. Viscosity of oat bran-enriched beverages influences gastrointestinal hormonal responses in healthy humans. J. Nutr. 2009, 139, 461–466. [Google Scholar] [CrossRef] [PubMed]
- Karhunen, L.J.; Juvonen, K.R.; Flander, S.M.; Liukkonen, K.H.; Lahteenmaki, L.; Siloaho, M.; Laaksonen, D.E.; Herzig, K.H.; Uusitupa, M.I.; Poutanen, K.S. A psyllium fiber-enriched meal strongly attenuates postprandial gastrointestinal peptide release in healthy young adults. J. Nutr. 2010, 140, 737–744. [Google Scholar] [CrossRef] [PubMed]
- Vitaglione, P.; Lumaga, R.B.; Stanzione, A.; Scalfi, L.; Fogliano, V. Beta-glucan-enriched bread reduces energy intake and modifies plasma ghrelin and Peptide YY concentrations in the short term. Appetite 2009, 53, 338–344. [Google Scholar] [CrossRef]
- Poutanen, K.S.; Dussort, P.; Erkner, A.; Fiszman, S.; Karnik, K.; Kristensen, M.; Marsaux, C.F.; Miquel-Kergoat, S.; Pentikainen, S.P.; Putz, P.; et al. A review of the characteristics of dietary fibers relevant to appetite and energy intake outcomes in human intervention trials. Am. J. Clin. Nutr. 2017, 106, 747–754. [Google Scholar] [CrossRef]
- Wanders, A.J.; van den Borne, J.J.G.C.; de Graaf, C.; Hulshof, T.; Jonathan, M.C.; Kristensen, M.; Mars, M.; Schols, H.A.; Feskens, E.J.M. Effects of dietary fibre on subjective appetite, energy intake and body weight: A systematic review of randomized controlled trials. Obes. Rev. 2011, 12, 724–739. [Google Scholar] [CrossRef]
- Hill, B.R.; De Souza, M.J.; Wagstaff, D.A.; Sato, R.; Williams, N.I. 24-hour profiles of circulating ghrelin and Peptide YY are inversely associated in normal weight premenopausal women. Peptides 2012, 38, 159–162. [Google Scholar] [CrossRef]
- MacLean, P.S.; Blundell, J.E.; Mennella, J.A.; Batterham, R.L. Biological control of appetite: A daunting complexity. Obesity 2017, 25, S8–S16. [Google Scholar] [CrossRef] [PubMed]
- Giezenaar, C.; Luscombe-Marsh, N.D.; Hutchison, A.T.; Lange, K.; Hausken, T.; Jones, K.L.; Horowitz, M.; Chapman, I.; Soenen, S. Effect of gender on the acute effects of whey protein ingestion on energy intake, appetite, gastric emptying and gut hormone responses in healthy young adults. Nutr. Diabetes 2018, 8, 40. [Google Scholar] [CrossRef] [PubMed]
- Drapeau, V.; Blundell, J.; Gallant, A.R.; Arguin, H.; Despres, J.P.; Lamarche, B.; Tremblay, A. Behavioural and metabolic characterisation of the low satiety phenotype. Appetite 2013, 70, 67–72. [Google Scholar] [CrossRef] [PubMed]


| Reference | Gender | N | Study Duration (min) | Preload Meal | Format | Energy (MJ) | CHO (g) | Protein (g) | Fat (g) | Fold Change | Appetite Outcomes | |||
|---|---|---|---|---|---|---|---|---|---|---|---|---|---|---|
| CCK | GLP-1 | PYY | Sensation | FI (kJ) | ||||||||||
| Nolan, et al. [23] | M | 4 | 30 | Tomato soup | NS | 1.4 | 60 | 7 | 7 | 1.8 | — | — | ND | — |
| F | 4 | 30 | Tomato soup | NS | 1.4 | 60 | 7 | 7 | 3.9 | — | — | ND | — | |
| Hall, et al. [24] | MF | 9 | 90 | Casein liquid meal | NS | 1.7 | 24 | 48 | 11 | 2.8 | 1.7 | — | FUL a | 3676 a |
| MF | 9 | 90 | Whey liquid meal | NS | 1.7 | 20 | 40 | 9 | 3.2 | 2.0 | — | FUL▲ b | 4537 b | |
| Bakhoj, et al. [25] | M | 11 | 180 | Einkorn honey salt bread | S | 1.2 | 54 | 9 | 4 | — | 1.3 | — | — | — |
| M | 11 | 180 | Einkorn crushed WG bread | S | 1.2 | 54 | 9 | 4 | — | 1.3 | — | — | — | |
| M | 11 | 180 | Einkorn yeast bread | S | 1.2 | 54 | 9 | 4 | — | 1.3 | — | — | — | |
| M | 11 | 180 | Modern yeast bread | S | 1.2 | 50 | 8 | 3 | — | 1.2 | — | — | — | |
| Frost, et al. [26] | MF | 10 | 240 | Control pasta | S | 1.0 | 50 | — | — | — | 1.7 | — | ND | 4807 |
| MF | 10 | 240 | Fibre enriched pasta | S | 1.0 | 50 | — | — | — | 1.4 | — | ND | 5167 | |
| MF | 10 | 240 | Control pasta + fat | S | 2.1 | 50 | — | 30 | — | 2.5 | — | ND | 4837 | |
| MF | 10 | 240 | Fibre enriched pasta + fat | S | 2.1 | 50 | — | 30 | — | 2.4 | — | ND | 4690 | |
| Pasman, et al. [27] | M | 26 | 240 | Simple CHO breakfast | S | 1.8 | 80 | 12 | 7 | 2.5 | — | — | STT a | — |
| M | 26 | 240 | Complex CHO breakfast | S | 1.7 | 72 | 12 | 7 | 2.7 | — | — | STT▲b 2 | — | |
| Adam [28] | MF | 26 | 240 | Glucose | NS | 1.3 | 75 | 0 | 0 | — | 1.8 | — | STT a | ND |
| MF | 26 | 240 | Glucose + guar gum | NS | 1.3 | 75 | 0 | 0 | — | 1.5 | — | STT▲ b | ND | |
| Sanggaard, et al. [29]) | M | 8 | 480 | Whole milk | NS | 3.7 | 62 | 48 | 49 | 5.0 | 3.4 | 1.9 | ND | — |
| M | 8 | 480 | Fermented milk + lactose | NS | 4.1 | 81 | 52 | 49 | 3.7 | 3.6 | 2.3 | ND | — | |
| Burton-Freeman [30] | MF | 25 | 45 | Low fat shake | NS | 1.1 | 52 | 10 | 1 | 2.0 | — | — | STF a | 3014 a |
| MF | 25 | 45 | Safflower oil shake | NS | 1.1 | 30 | 9 | 12 | 2.4 | — | — | STF▲ b | 3198 a,b | |
| MF | 25 | 45 | Walnut oil shake | NS | 1.1 | 30 | 10 | 12 | 2.0 | — | — | STF a | 3340 a,b | |
| MF | 25 | 45 | Ground walnut shake | NS | 1.1 | 30 | 9 | 12 | 2.3 | — | — | STF a | 3457 b | |
| Adam and Westerterp-Plantenga [31] | MF | 30 | 120 | Breakfast | NS | 1.9 | 55 | 31 | 12 | — | 1.7 | — | ND | ND |
| MF | 30 | 120 | Breakfast + galactose + guar gum | NS | 2.7 | 105 | 31 | 12 | — | 3.6 | — | ND | ND | |
| Weickert, et al. [32] | F | 14 | 300 | Control bread | S | 1.0 | 50 | 7 | 1 | — | 2.2 | — | — | — |
| F | 14 | 300 | Wheat fibre bread | S | 1.0 | 50 | 7 | 1 | — | 1.7 | — | — | — | |
| F | 14 | 300 | Oat fibre bread | S | 1.0 | 50 | 7 | 1 | — | 1.9 | — | — | — | |
| Batterham, et al. [33] | MF | 25 | 180 | High protein pasta + dessert | S | 4.6 | 47 | 178 | 21 | — | — | 2.0 | HGR▼ a | — |
| MF | 25 | 180 | High CHO pasta + dessert | S | 4.6 | 176 | 48 | 21 | — | — | 1.4 | HGR b | — | |
| MF | 25 | 180 | High fat pasta + dessert | S | 4.6 | 46 | 46 | 80 | — | — | 1.8 | HGR▼ a | — | |
| Blom, et al. [34] | M | 15 | 180 | High CHO plain yoghurt | NS | 1.6 | 46 | 19 | 14 | 3.9 | 1.5 | — | ND | 5136 |
| M | 15 | 180 | High protein whey isolates | NS | 1.7 | 14 | 57 | 12 | 7.9 | 2.0 | — | ND | 4697 | |
| le Roux, et al. [35] | MF | 20 | 180 | Liquid meal (500 mL) | NS | 1.0 | 42 | 16 | 10 | — | — | 2.0 | — | — |
| MF | 20 | 180 | Liquid meal (500 mL) | NS | 2.2 | 52 | 18 | 27 | — | — | 2.4 | — | — | |
| MF | 20 | 180 | Liquid meal (500 mL) | NS | 4.2 | 63 | 17 | 75 | — | — | 3.2 | — | — | |
| MF | 20 | 180 | Liquid meal (900 mL) | NS | 4.2 | 99 | 33 | 53 | — | — | 2.9 | — | — | |
| MF | 20 | 180 | Liquid meal (900 mL) | NS | 8.4 | 108 | 30 | 162 | — | — | 3.7 | — | — | |
| MF | 20 | 180 | Liquid meal (900 mL) | NS | 12.5 | 85 | 25 | 275 | — | — | 4.2 | — | — | |
| Weickert, et al. [36] | F | 12 | 300 | Control bread | S | 1.0 | 50 | 7 | 1 | — | — | 1.5 | ND | — |
| F | 12 | 300 | Wheat fibre bread | S | 1.0 | 50 | 7 | 1 | — | — | 1.1 | ND | — | |
| F | 12 | 300 | Oat fibre bread | S | 1.0 | 50 | 7 | 1 | — | — | 1.4 | ND | — | |
| Doucet, et al. [37] | F | 25 | 180 | Standard breakfast | S | 2.4 | 82 | 19 | 19 | — | — | 1.7 | — | 2249 |
| Smeets et al. [22] | MF | 30 | 210 | Adequate protein pasta | S | 35% ER | 60% | 10% | 30% | — | 1.6 | 1.5 | STT a | — |
| MF | 30 | 210 | High protein pasta | S | 35% ER | 45% | 25% | 30% | — | 2.0 | 1.9 | STT▲ b | — | |
| Sorensen, et al. [38] | M | 20 | 285 | Salatrim roll | S | 3.2 | 97 | 19 | 40 | 2.4 | 1.7 | 1.3 | FUL▲ a | 3414 |
| M | 20 | 285 | Margarine roll | S | 3.2 | 97 | 19 | 40 | 2.4 | 2.1 | 1.6 | FUL b | 3331 | |
| Zijlstra, et al. [39]1 | M | 12 | 90 | Chocolate milk | NS | 2.0 | 67 | 13 | 16 | 7.1 | 1.5 | — | DTE a, PCF a | — |
| F | 20 | 90 | Chocolate milk | NS | 1.6 | 53 | 11 | 13 | ||||||
| M | 12 | 90 | Chocolate custard | NS | 1.9 | 64 | 13 | 17 | 5.3 | 1.5 | — | DTE▼ b, PCF▼ b | — | |
| F | 20 | 90 | Chocolate custard | NS | 1.5 | 50 | 10 | 13 | ||||||
| Hlebowicz, et al. [40] | MF | 15 | 150 | Rice pudding | NS | 1.4 | 48 | 9 | 12 | — | 1.1 | — | ND | — |
| MF | 15 | 150 | Rice pudding + 1 g cinnamon | NS | 1.4 | 48 | 9 | 12 | — | 1.4 | — | ND | — | |
| MF | 15 | 150 | Rice pudding + 3 g cinnamon | NS | 1.4 | 48 | 9 | 12 | — | 1.5 | — | ND | — | |
| Smeets and Westerterp-Plantenga [21] | MF | 30 | 180 | Lunch meal | S | 35% ER | 60% | 10% | 30% | — | 1.6 | 2.2 | ND | — |
| MF | 30 | 180 | Lunch meal + red pepper | S | 35% ER | 60% | 10% | 30% | — | 2.1 | 4.2 | ND | — | |
| Veldhorst, et al. [41] | MF | 25 | 240 | Whey custard | NS | 2.5 | 82 | 15 | 23 | — | 2.0 | — | STT▲ a | 2877 |
| MF | 25 | 240 | Whey custard | NS | 2.5 | 82 | 37 | 13 | — | 2.1 | — | STT b | ||
| MF | 25 | 240 | Whey custard (No GMP) | NS | 2.5 | 82 | 15 | 23 | — | 1.7 | — | STT▲ a | 3208 | |
| MF | 25 | 240 | Whey custard (No GMP) | NS | 2.5 | 82 | 37 | 13 | — | 1.9 | — | STT b | ||
| Veldhorst, et al. [42] | MF | 25 | 240 | Casein custard | NS | 2.5 | 82 | 15 | 23 | — | 1.5 | — | FUL a | 3133 |
| MF | 25 | 240 | Casein custard | NS | 2.5 | 82 | 37 | 13 | — | 1.4 | — | FUL▲ b | 3080 | |
| Veldhorst, et al. [43] | MF | 25 | 240 | Soy custard | NS | 2.5 | 82 | 15 | 23 | — | 1.5 | — | STT a | 3090 |
| MF | 25 | 240 | Soy custard | NS | 2.5 | 82 | 37 | 13 | — | 1.5 | — | STT▲ b | 3212 | |
| Nieuwenhuizen, et al. [44] | MF | 24 | 240 | α-lactalbumin custard | NS | 2.5 | 82 | 15 | 23 | — | 2.0 | — | ND | 2650 |
| MF | 24 | 240 | Gelatine custard | NS | 2.5 | 82 | 15 | 23 | — | 1.9 | — | ND | 2560 | |
| MF | 24 | 240 | Gelatine custard + TRP | NS | 2.5 | 82 | 15 | 23 | — | 2.0 | — | ND | 2610 | |
| Kohnke, et al. [45] | MF | 11 | 360 | Sandwich | S | 2.3 | 34 | 12 | 40 | 2.1 | — | — | — | — |
| MF | 11 | 360 | Sandwich + 50 g thylakoid | S | 3.0 | 45 | 35 | 45 | 2.0 | — | — | — | — | |
| MF | 11 | 360 | Sandwich + 25 g thylakoid | S | 2.6 | 40 | 24 | 42 | 1.3 | — | — | — | — | |
| MF | 11 | 360 | Sandwich + 25 g delipidated thylakoid | S | 2.6 | 39 | 24 | 41 | 1.4 | — | — | — | — | |
| Juvonen, et al. [46] | MF | 20 | 180 | Pudding | NS | 1.3 | 57 | 4 | 4 | — | — | 1.1 | ND | ND |
| MF | 20 | 180 | Pudding with wheat bran | NS | 1.3 | 55 | 6 | 4 | — | — | 1.1 | ND | ND | |
| MF | 20 | 180 | Pudding with oat bran | NS | 1.3 | 53 | 8 | 4 | — | — | 1.1 | ND | ND | |
| MF | 20 | 180 | Pudding with wheat and oat bran | NS | 1.3 | 57 | 7 | 4 | — | — | 1.1 | ND | ND | |
| Juvonen, et al. [47] | M | 8 | 240 | Viscous casein beverage | NS | 1.0 | 4 | 54 | 0.5 | — | 1.9 | — | ND | — |
| M | 8 | 240 | Casein gel beverage | NS | 1.0 | 4 | 54 | 0.5 | — | 1.4 | — | ND | — | |
| M | 8 | 240 | Whey beverage | NS | 1.0 | 4 | 52 | 0.3 | — | 3.6 | — | ND | — | |
| Brennan, et al. [48] | M | 16 | 240 | High fat pasta | S | 3.8 | 68 | 34 | 55 | 1.2 | — | 1.8 | — | 4156 a,b |
| M | 16 | 240 | High protein pasta | S | 3.8 | 68 | 101 | 25 | 1.4 | — | 1.6 | — | 3890 a | |
| M | 16 | 240 | High CHO low protein pasta | S | 3.8 | 135 | 23 | 30 | 1.6 | — | 1.7 | — | 4509 b | |
| M | 16 | 240 | Adequate protein pasta | S | 3.8 | 90 | 68 | 30 | 1.5 | — | 1.8 | — | 4533 b | |
| Kim, et al. [49] | F | 10 | 180 | Regular breakfast meal | S | 2.1 | 77 | 26 | 11 | — | — | 0.8 | — | — |
| F | 10 | 180 | High protein breakfast meal | S | 2.1 | 39 | 64 | 11 | — | — | 1.1 | — | — | |
| F | 10 | 180 | High fat breakfast meal | S | 2.1 | 39 | 26 | 28 | — | — | 0.9 | — | — | |
| Zhu, et al. [50] | M | 19 | 180 | Chicken soup with solid vegetable | NS | 1.2 | 37 | 10 | 11 | 0.5 | — | — | FUL a, PWF a | 551.5 g |
| M | 19 | 180 | Chicken soup with liquid vegetable | NS | 1.2 | 37 | 10 | 11 | 0.8 | — | — | FUL▲ b, PWF▲ b | 545.6 g | |
| van der Klaauw, et al. [51] | MF | 8 | 270 | High protein pancakes | S | 1.7 | 20 | 60 | 9 | — | 1.5 | 1.4 | ND | 4280 |
| MF | 8 | 270 | High CHO pancakes | S | 1.7 | 60 | 20 | 9 | — | 1.4 | 1.2 | ND | 4845 | |
| MF | 8 | 270 | High fat pancakes | S | 1.7 | 20 | 20 | 27 | — | 1.4 | 1.0 | ND | 4251 | |
| Little, et al. [52] | MF | 16 | 180 | Ensure Plus® Nutrient Drinks | NS | 3.1 | 100 | 32 | 25 | 2.8 | — | 1.6 | — | 3305 |
| Zhu and Hollis [53] | M | 8 | 180 | Tomato basil soup | NS | 1.6 | 62 | 4 | 13 | 1.1 | — | — | — | — |
| Ohlsson, et al. [54] | MF | 19 | 300 | Breakfast + yoghurt (35 g oat oil) | NS | 3.1 | 65 | 19 | 43 | 6.0 | 2.1 | 1.7 | STT▲ a 3 | ND |
| MF | 19 | 300 | Breakfast + yoghurt (0 g oat oil) | NS | 2.9 | 65 | 19 | 39 | 5.3 | 1.8 | 1.7 | STT b | ND | |
| F | 14 | 300 | Breakfast + milk (14 g oat oil) | NS | 2.9 | 65 | 19 | 39 | 6.1 | 3.5 | 2.2 | — | ND | |
| F | 14 | 300 | Breakfast + milk (1.8 g oat oil) | NS | 2.9 | 66 | 19 | 39 | 3.7 | 3.4 | 2.1 | — | ND | |
| Chungchunlam, et al. [55] | F | 18 | 120 | Maltodextrin preload drinks | NS | 2.9 | 72 | 3 | 3 | 1.2 | 1.5 | 1.2 | ND | 2442 a |
| F | 18 | 120 | Whey preload drinks | NS | 2.9 | 26 | 46 | 3 | 1.3 | 1.5 | 1.1 | ND | 2920 b | |
| Bligh, et al. [56] | M | 19 | 180 | Reference meal | S | 1.6 | 57 | 13 | 11 | — | 1.8 | 1.0 | HGR a, FUL a, DTE a | — |
| M | 17 | 180 | Palaeolithic meal 1 | S | 2.3 | 65 | 41 | 18 | — | 1.5 | 1.1 | HGR▼ b, FUL▲ b, DTE▼ b | — | |
| M | 19 | 180 | Palaeolithic meal 2 | S | 1.6 | 66 | 16 | 11 | — | 1.2 | 1.1 | HGR▼ b, FUL▲ b, DTE▼ b | — | |
| Clamp, et al. [57] | M | 10 | 180 | Milkshake | NS | 4.7 | 56 | 11 | 98 | — | — | 1.5 | ND | 533.7 g |
| M | 10 | 180 | Milkshake | NS | 4.7 | 56 | 11 | 98 | — | — | 1.4 | ND | 509.1 g | |
| Hutchison, et al. [58] | M | 20 | 180 | 70 g whey protein drink | NS | 1.2 | — | — | — | 1.9 | 1.7 | — | — | 4176 |
| Gonzalez-Anton, et al. [59] | MF | 30 | 240 | Cereal-based bread | S | 1.1 | 38 | 13 | 4 | — | 1.7 | — | PCF▼ a, STT▲ a | 4184 |
| MF | 30 | 240 | White bread | S | 1.0 | 47 | 7 | 4 | — | 1.9 | — | PCF b, STT b | 4268 | |
| Overduin, et al. [60] | MF | 10 | 240 | Sucrose control preload | NS | 1.6 | 55 | 15 | 13 | — | 1.6 | 1.3 | HGR a | ND |
| MF | 10 | 240 | Isovolumic erythritol preload | NS | 1.2 | 29 | 14 | 29 | — | 2.3 | 1.7 | HGR a | ND | |
| MF | 10 | 240 | Isocaloric erythritol preload | NS | 1.6 | 39 | 26 | 28 | — | 2.4 | 1.5 | HGR▼ b | ND | |
© 2019 by the authors. Licensee MDPI, Basel, Switzerland. This article is an open access article distributed under the terms and conditions of the Creative Commons Attribution (CC BY) license (http://creativecommons.org/licenses/by/4.0/).
Share and Cite
Lim, J.J.; Poppitt, S.D. How Satiating Are the ‘Satiety’ Peptides: A Problem of Pharmacology versus Physiology in the Development of Novel Foods for Regulation of Food Intake. Nutrients 2019, 11, 1517. https://doi.org/10.3390/nu11071517
Lim JJ, Poppitt SD. How Satiating Are the ‘Satiety’ Peptides: A Problem of Pharmacology versus Physiology in the Development of Novel Foods for Regulation of Food Intake. Nutrients. 2019; 11(7):1517. https://doi.org/10.3390/nu11071517
Chicago/Turabian StyleLim, Jia Jiet, and Sally D. Poppitt. 2019. "How Satiating Are the ‘Satiety’ Peptides: A Problem of Pharmacology versus Physiology in the Development of Novel Foods for Regulation of Food Intake" Nutrients 11, no. 7: 1517. https://doi.org/10.3390/nu11071517
APA StyleLim, J. J., & Poppitt, S. D. (2019). How Satiating Are the ‘Satiety’ Peptides: A Problem of Pharmacology versus Physiology in the Development of Novel Foods for Regulation of Food Intake. Nutrients, 11(7), 1517. https://doi.org/10.3390/nu11071517