Nutrient Intake Prior to Exercise Is Necessary for Increased Osteogenic Marker Response in Diabetic Postmenopausal Women


Abstract
1. Introduction
2. Materials and Methods
2.1. Subjects
2.2. General Experimental Protocol
2.3. Study Design
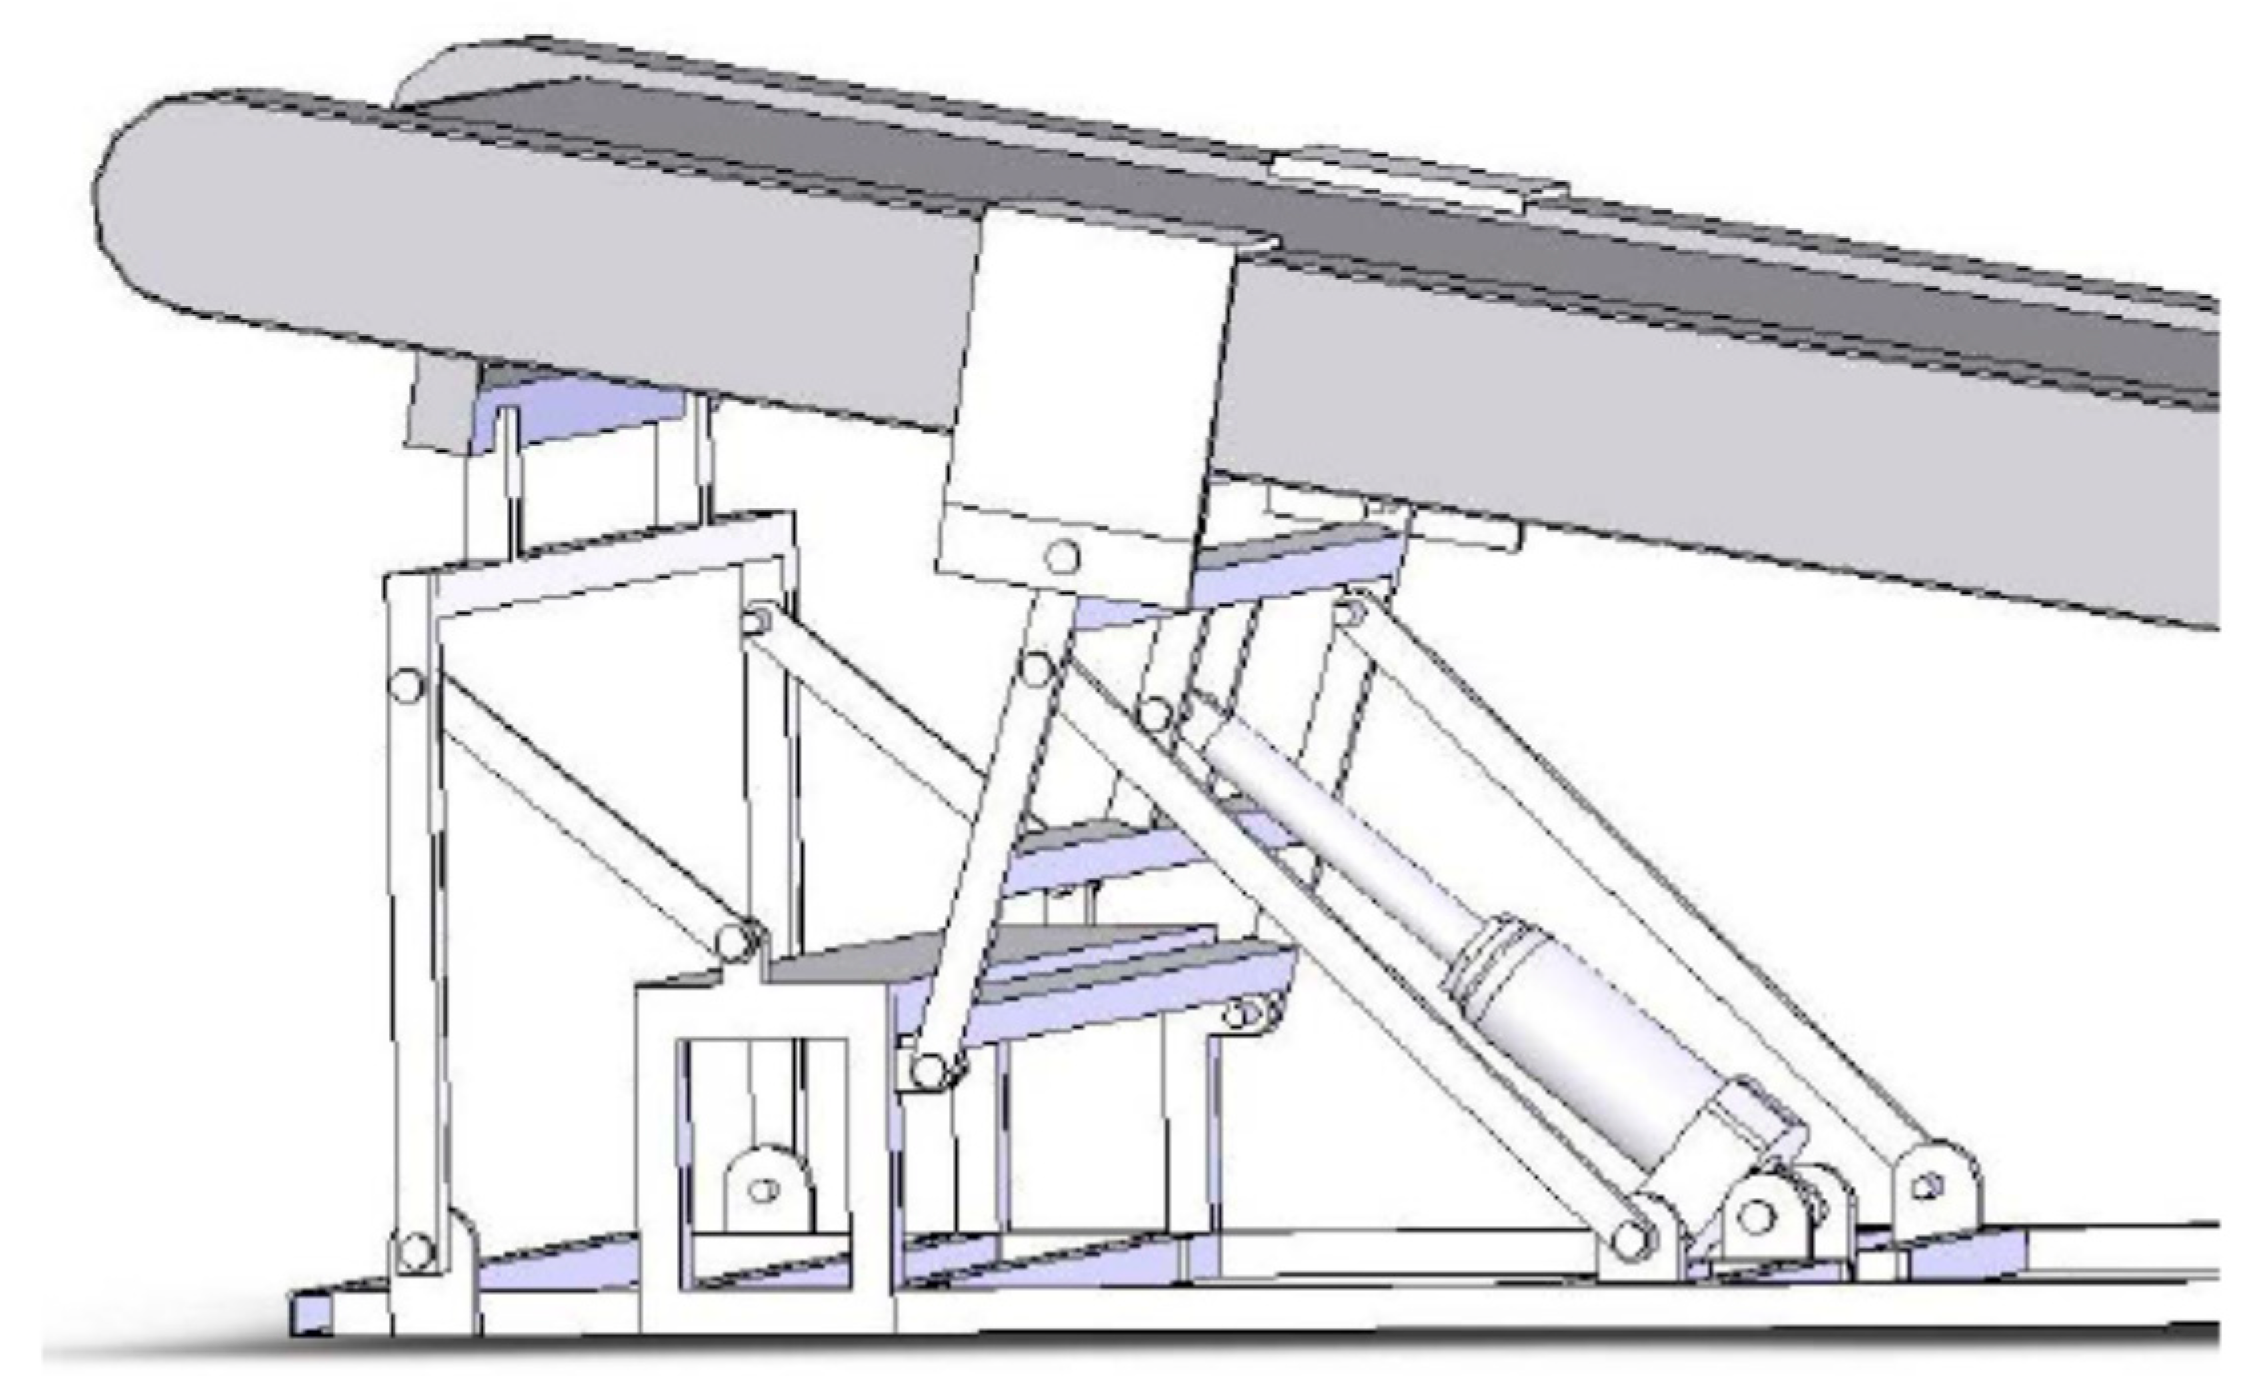
2.4. GRF Manipulation and Measurements
2.5. Exercise Intensity
2.6. Meals
2.7. DXA Measurements
2.8. Blood Collection
2.9. Markers of Bone Formation
2.10. Hormone Measurements
2.11. Statistical Analyses
3. Results
3.1. Subject Characteristics (Table 1)

| Variable | Sedentary | Uphill Before Meals | Downhill Before Meals | Uphill After Meals | Downhill After Meals | F; p |
|---|---|---|---|---|---|---|
| Subjects | N = 6 (3 AA) | N = 6 (6 C) | N = 6 (1 AA) | N = 6 (1 AA) | N = 6 (1 AA) | |
| Age (years) | 58.5 ± 1.8 | 56.7 ± 1.7 | 56.5 ± 1.4 | 56.5 ± 1.8 | 56.2 ± 1.8 | 0.294, 0.88 |
| Menopause (y) | 10.5 ± 2.8 | 5.2 ± 1.0 | 4.7 ± 1.3 | 6.0 ± 2.5 | 7.3 ±2.5 | 1.14,0.36 |
| Diabetes (years) | 11.0 ± 1.6 | 10.8 ± 1.4 | 11.3 ± 4.5 | 9.2 ± 2.7 | 7.4 ± 2.5 | 0.191, 0.94 |
| Glucose (mg/dl) | 122.5 ± 12.02 | 163.17 ±35.93 | 164.67 ± 35.25 | 118.50 ± i9.25 | 125.17 | 0.926, 0.46 |
| PTH (ng/ml) | 43.83 ± 3.79 | 38.50 ± 5.45 | 37.83 ± 4.92 | 40.83 ± 2.44 | 46.00 ± 3.52 | 0.701, 0.60 |
| TSH (ng/ml) | 2.06 ± 0.52 | 2.53 ± 0.80 | 2.01 ± 0.80 | 1.83 ± 0.46 | 2.10 ± 0.53 | 0.162, 0.96 |
| Weight (kg) | 70.57 ± 4.15 | 66.95 ± 4.46 | 71. 35 ± 4.52 | 73.20 ± 4.25 | 69.03 ± 4.37 | 0.296, 0.88 |
| BMI (kg/m2) | 27.26 ± 1.39 | 26.13 ± 1.45 | 26.43 ± 1.11 | 26.75 ± 1.08 | 26.65 ± 1.36 | 0.106, 0.98 |
| Body fat (%) | 39.97 ± 1.37 | 39.78 ± 2.24 | 37.75 ± 1.07 | 39.5 ± 1.01 | 41.00 ± 2.05 | 0.524, 0.72 |
| BMD, body (g/cm2) | 1.23 ± 0.07 | 1.16 ± 0.08 | 1.26 ± 0.05± | 1.21 ± 0.06 | 1.19 ± 0.05 | 0.379, 0.82 |
| Z score, body | 1.63 ± 0.62 | 1.15 ± 0.48 | 2.08 ± 0.49 | 1.48 ± 0.61 | 1.42 ± 0.48 | 0.406, 0.80 |
| Spine BMD (g/cm2) | 1.18 ± 0.08 | 1.11 ± 0.07 | 1.25 ± 0.05 | 1.19 ± 0.07 | 1.12 ± 0.07 | 0.459, 0.76 |
| Spine Z score | 0.78 ± 0.51 | 0.25 ± 0.43 | 0.98 ± 0.37 | 0.80 ± 0.45 | 0.38 ± 0.47 | 0.476, 0.75 |
| Hip BMD (g/cm2) | 1.06 ± 0.08 | 0.99 ± 0.08 | 1.05 ± 0.08 | 1.02 ± 0.05 | 1.05 ± 0.07 | 0.163, 0.96 |
| Hip Z score | 0.88 ± 0.52 | 0.62 ± 0.59 | 0.95 ± 0.58 | 0.73 ± 0.41 | 1.28 ± 0.47 | 0.241, 0.91 |
| VO2 max (ml O2/min) | 1301.72 ± 130.42 | 1371.70±139.16 | 1578.78 ± 210.98 | 1587.88 ± 227.93 | 1398.92 ± 131.32 | 0.552, 0.70 |
| VO2 max (ml/kg min) | 18.48 ± 1.56 | 20.32 ± 1.15 | 21.75 ± 1.67 | 21.48 ± 2.33 | 20.17 ± 1.21 | 0.625, 0.65 |
3.2. Exercise Parameters (Table 2)
| Variable | Uphill Before Meals | Downhill Before Meals | Uphill After Meals | Downhill After Meals | F (df = 3,20); p |
|---|---|---|---|---|---|
| Subjects | N = 6 (6 C) | N = 6 (1 AA) | N = 6 (1 AA) | N = 6 (1 AA) | |
| Relative effort (%) | 75.15 ± 0.89 | 48.13 ± 3.83 | 76.33 ± 2.0 | 47.60 ± 1.16 | F = 50.43; p < 0.0001 |
| RPE | 11.11 ± 0.73 | 9.95 ± 0.71 | 11.95 ± 0.77 | 11.22 ± 0.92 | F = 1.105, p = 0. 370 |
| HR (bpm) | 114.73 ± 4.36 | 103.65 ± 7.14 | 130.58 ± 2.69 | 113.72 ± 3.25 | F = 5.60, p = 0.0057 |
| Peak GRF (N) | 857.50 ± 52.80 | 1104.72 ± 40.79 | 795.27 ± 36.50 | 1105.00 ± 79.71 | F = 8.732, p < 0.0007 |
| Relative GRF (N/kg) | 1.31 ± 0.02 | 1.59 ± 0.05 | 1.12 ± 0.04 | 1.64 ± 0.07 | F = 25.60, p < 0.0001 |
| Peak pressure (KPa) | 257.68 ± 22.80 | 284.96 ± 18.13 | 225.08 ± 25.48 | 301.73 ± 37.69 | F = 1.541, p = 0.235 |
| Relative pressure (KPa/kg) | 0.39 ± 0.02 | 0.41 ± 0.02 | 0.32 ± 0.03 | 0.44 ±0.04 | F = 3.883, p = 0.00245 |
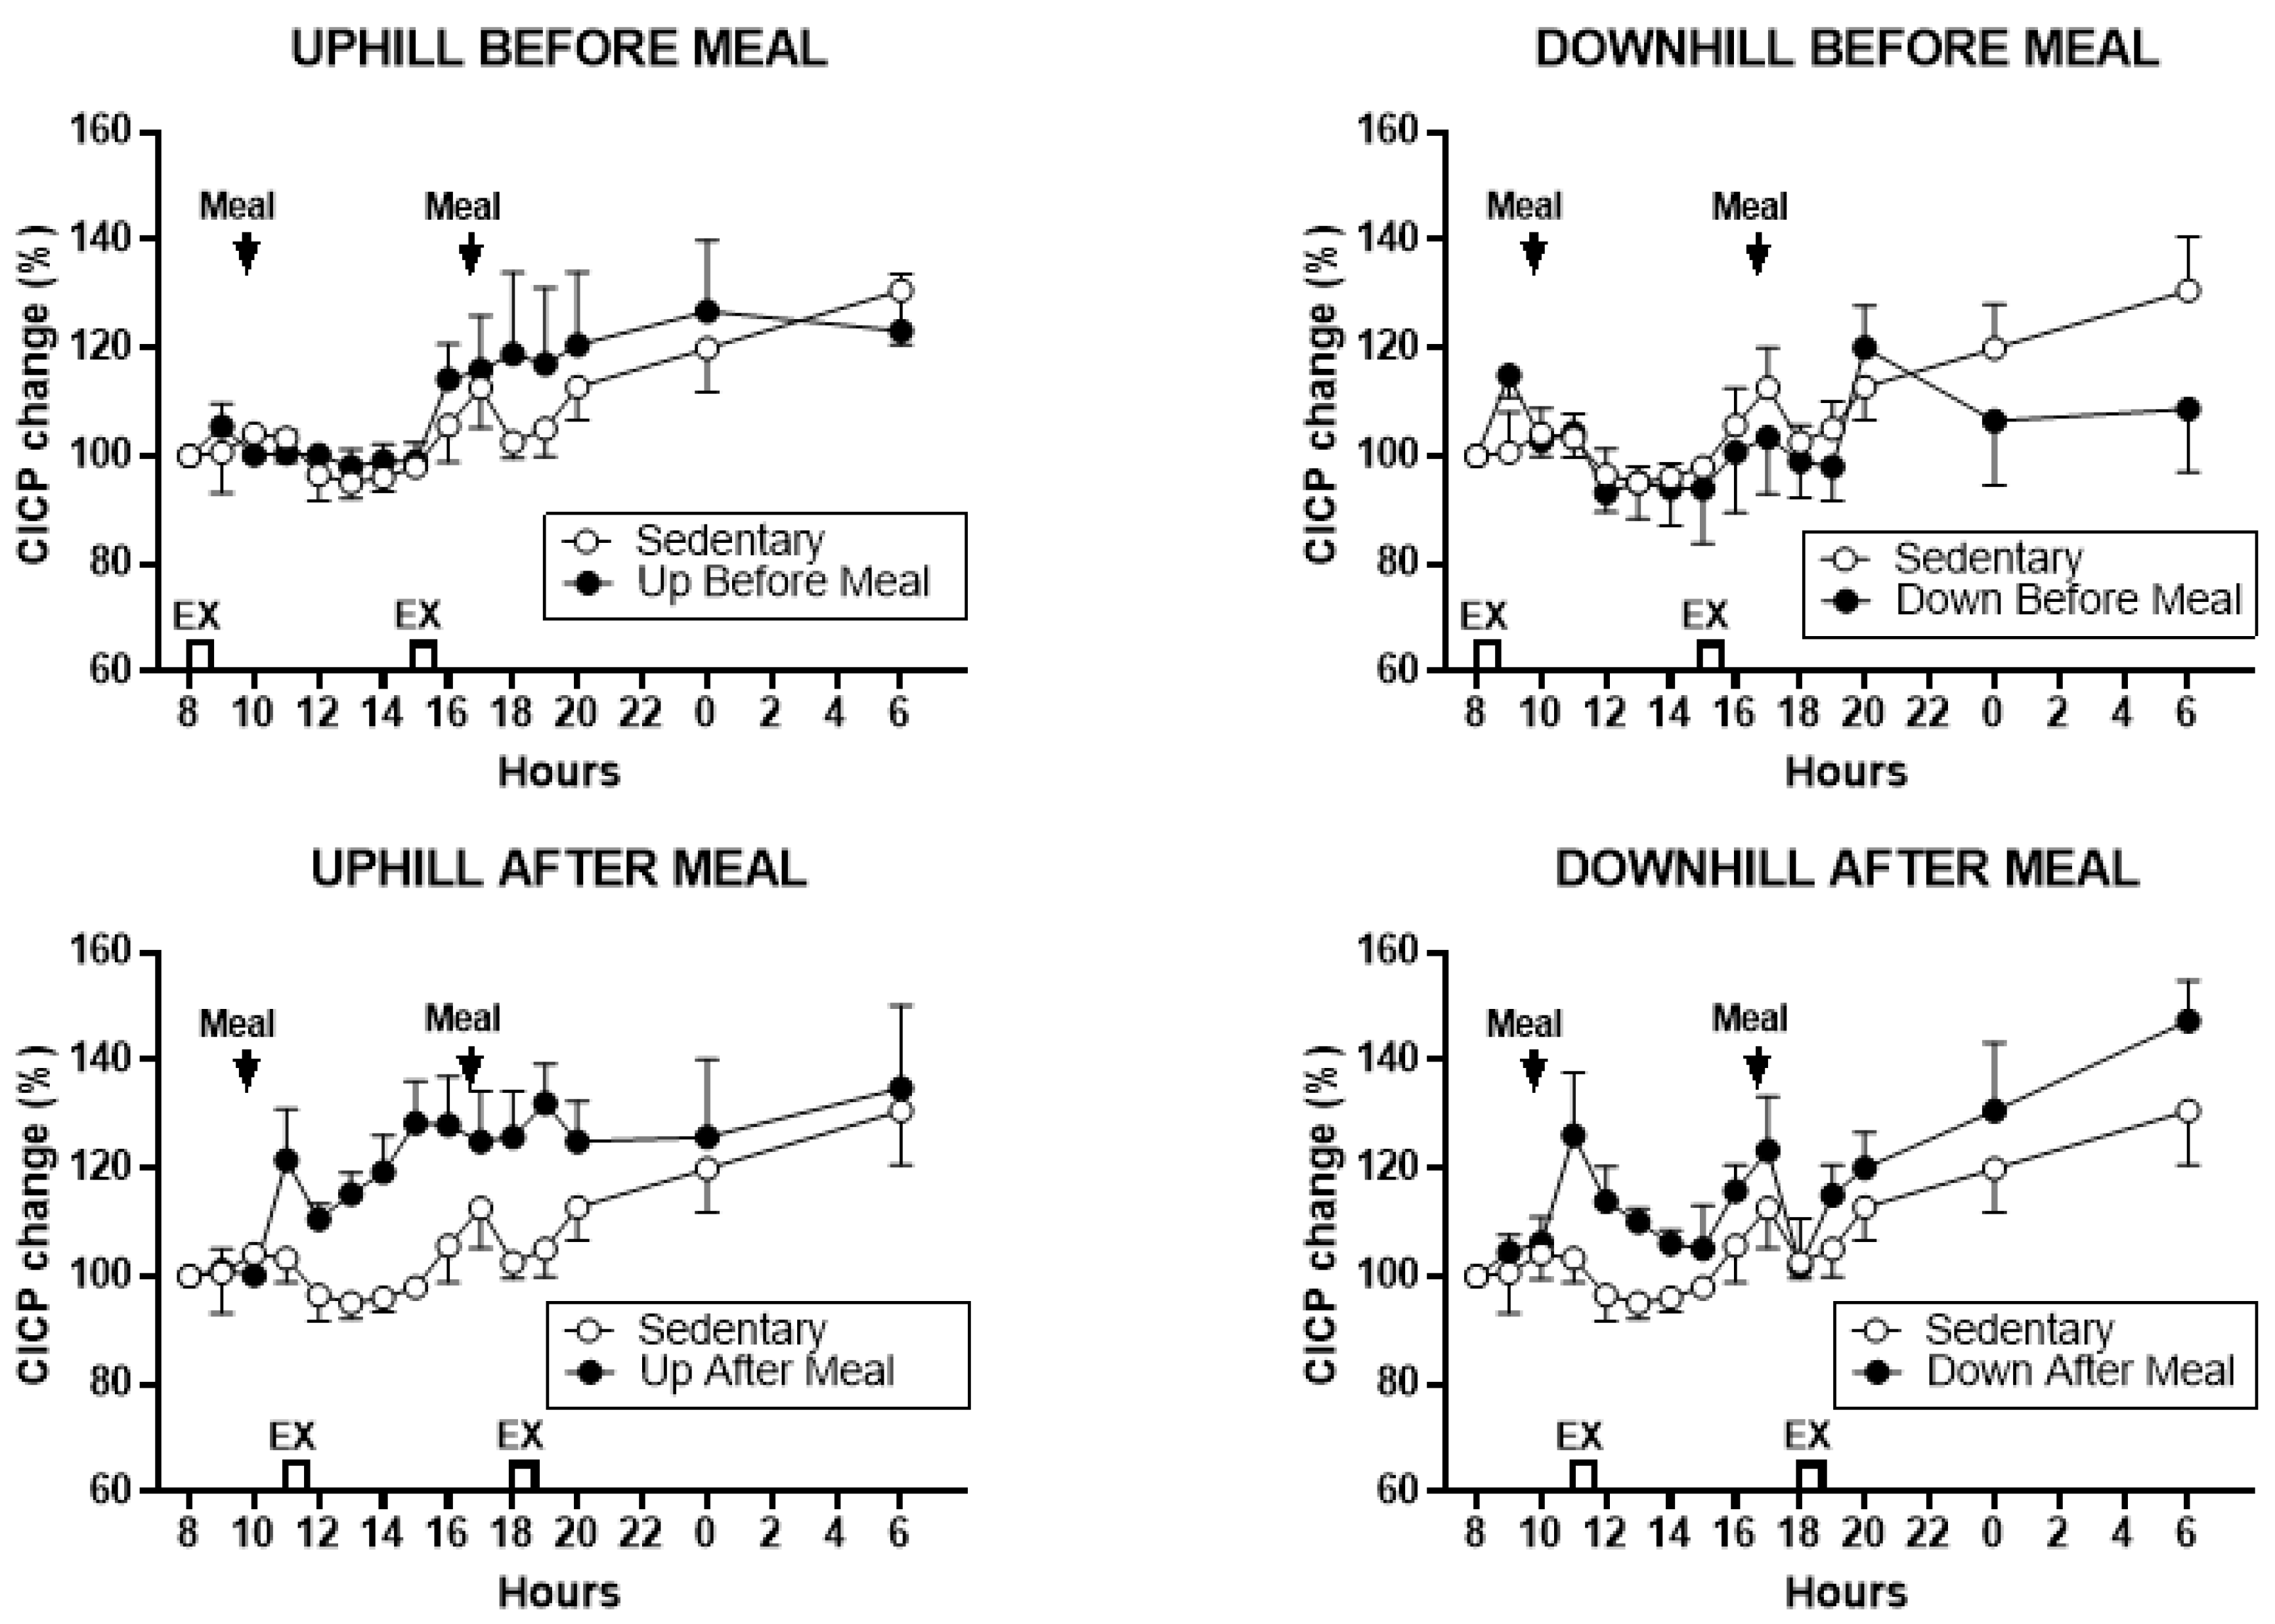
3.3. Bone Marker Measurements
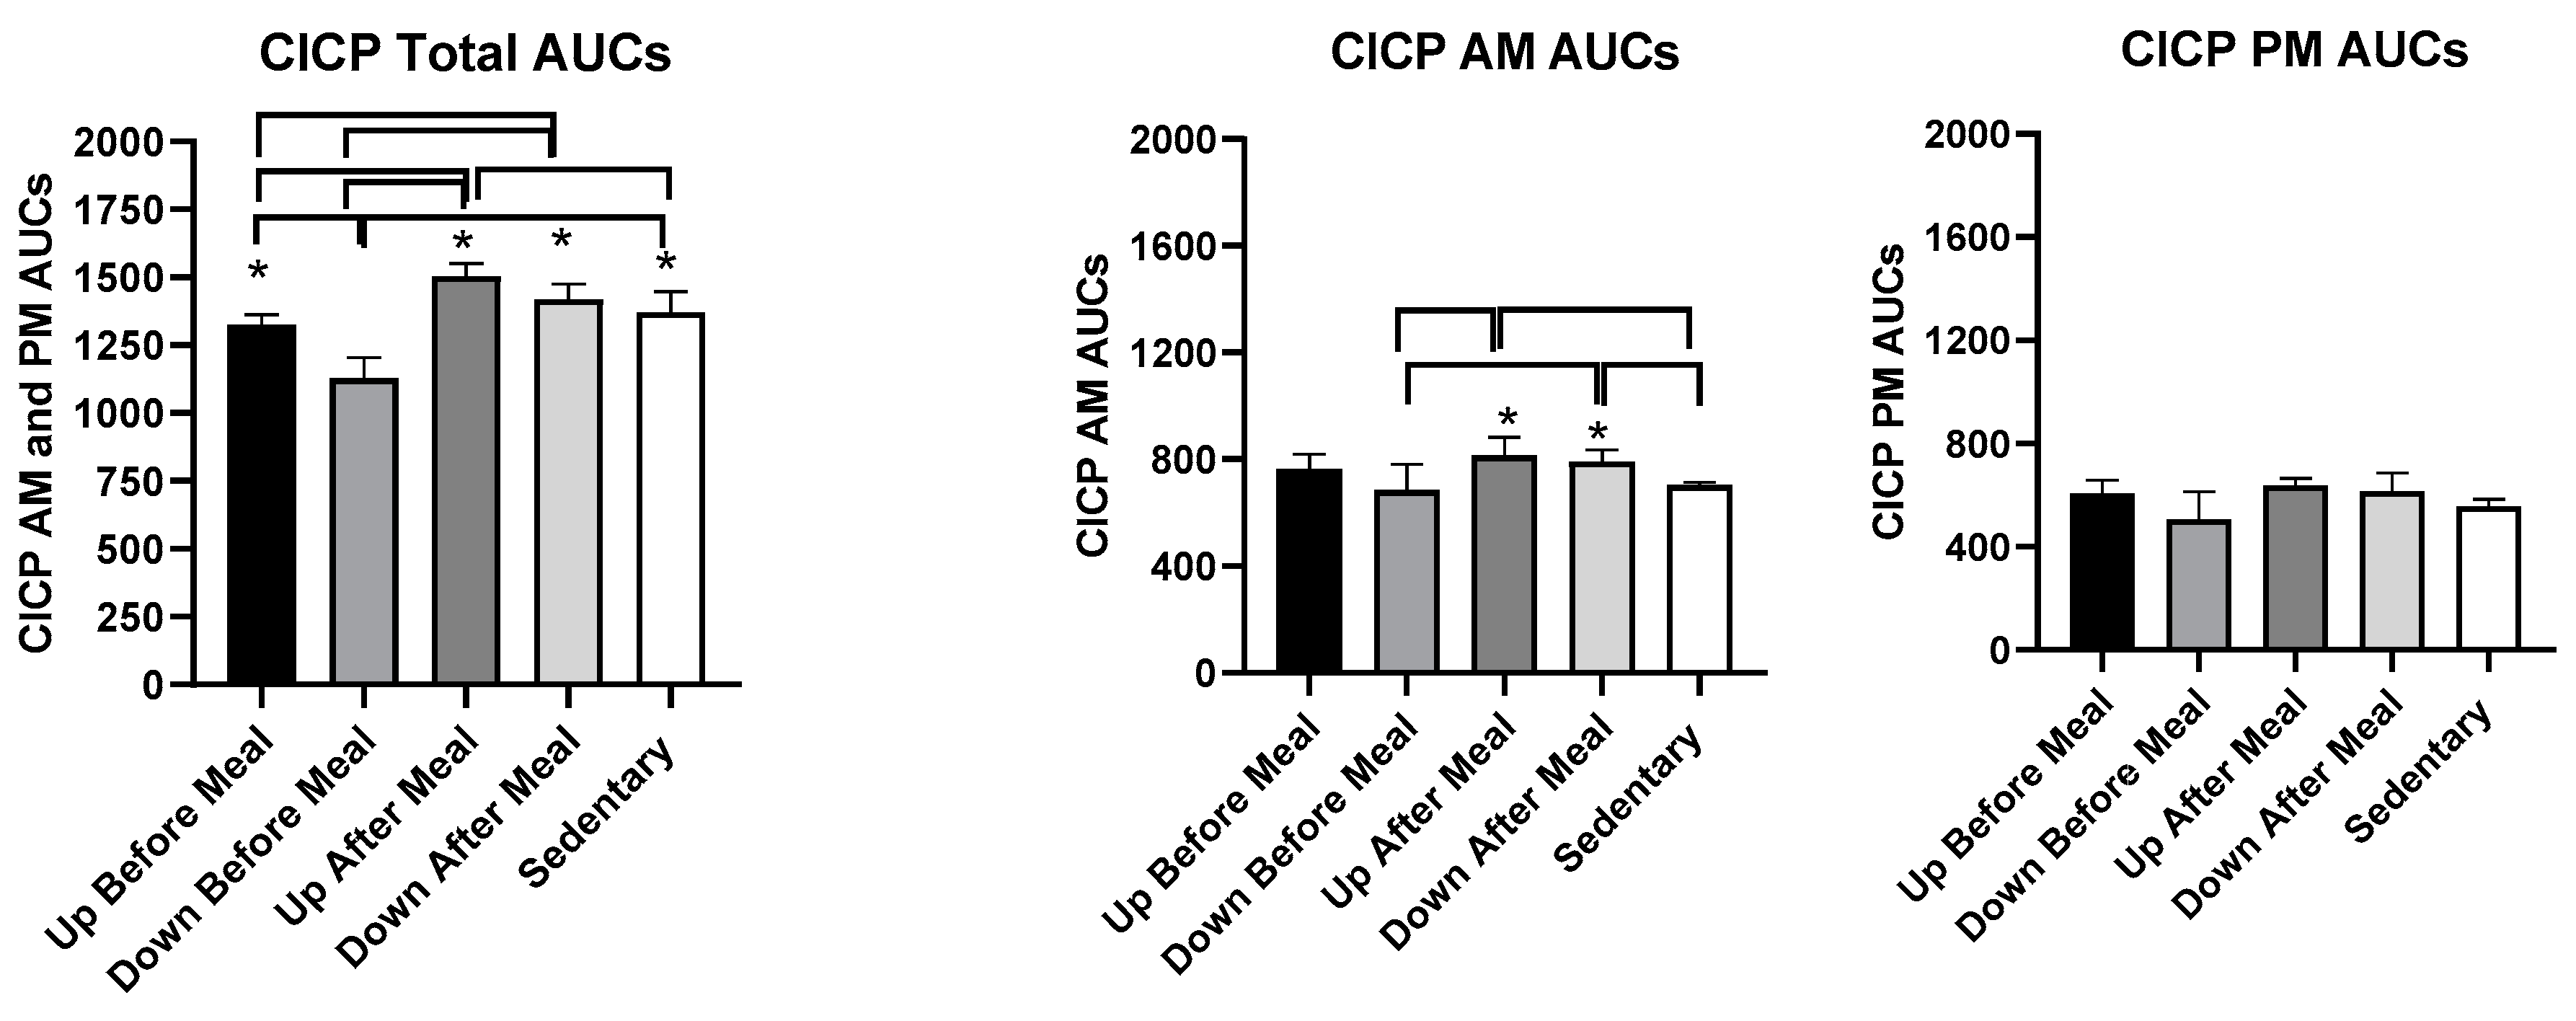
3.3.1. CICP
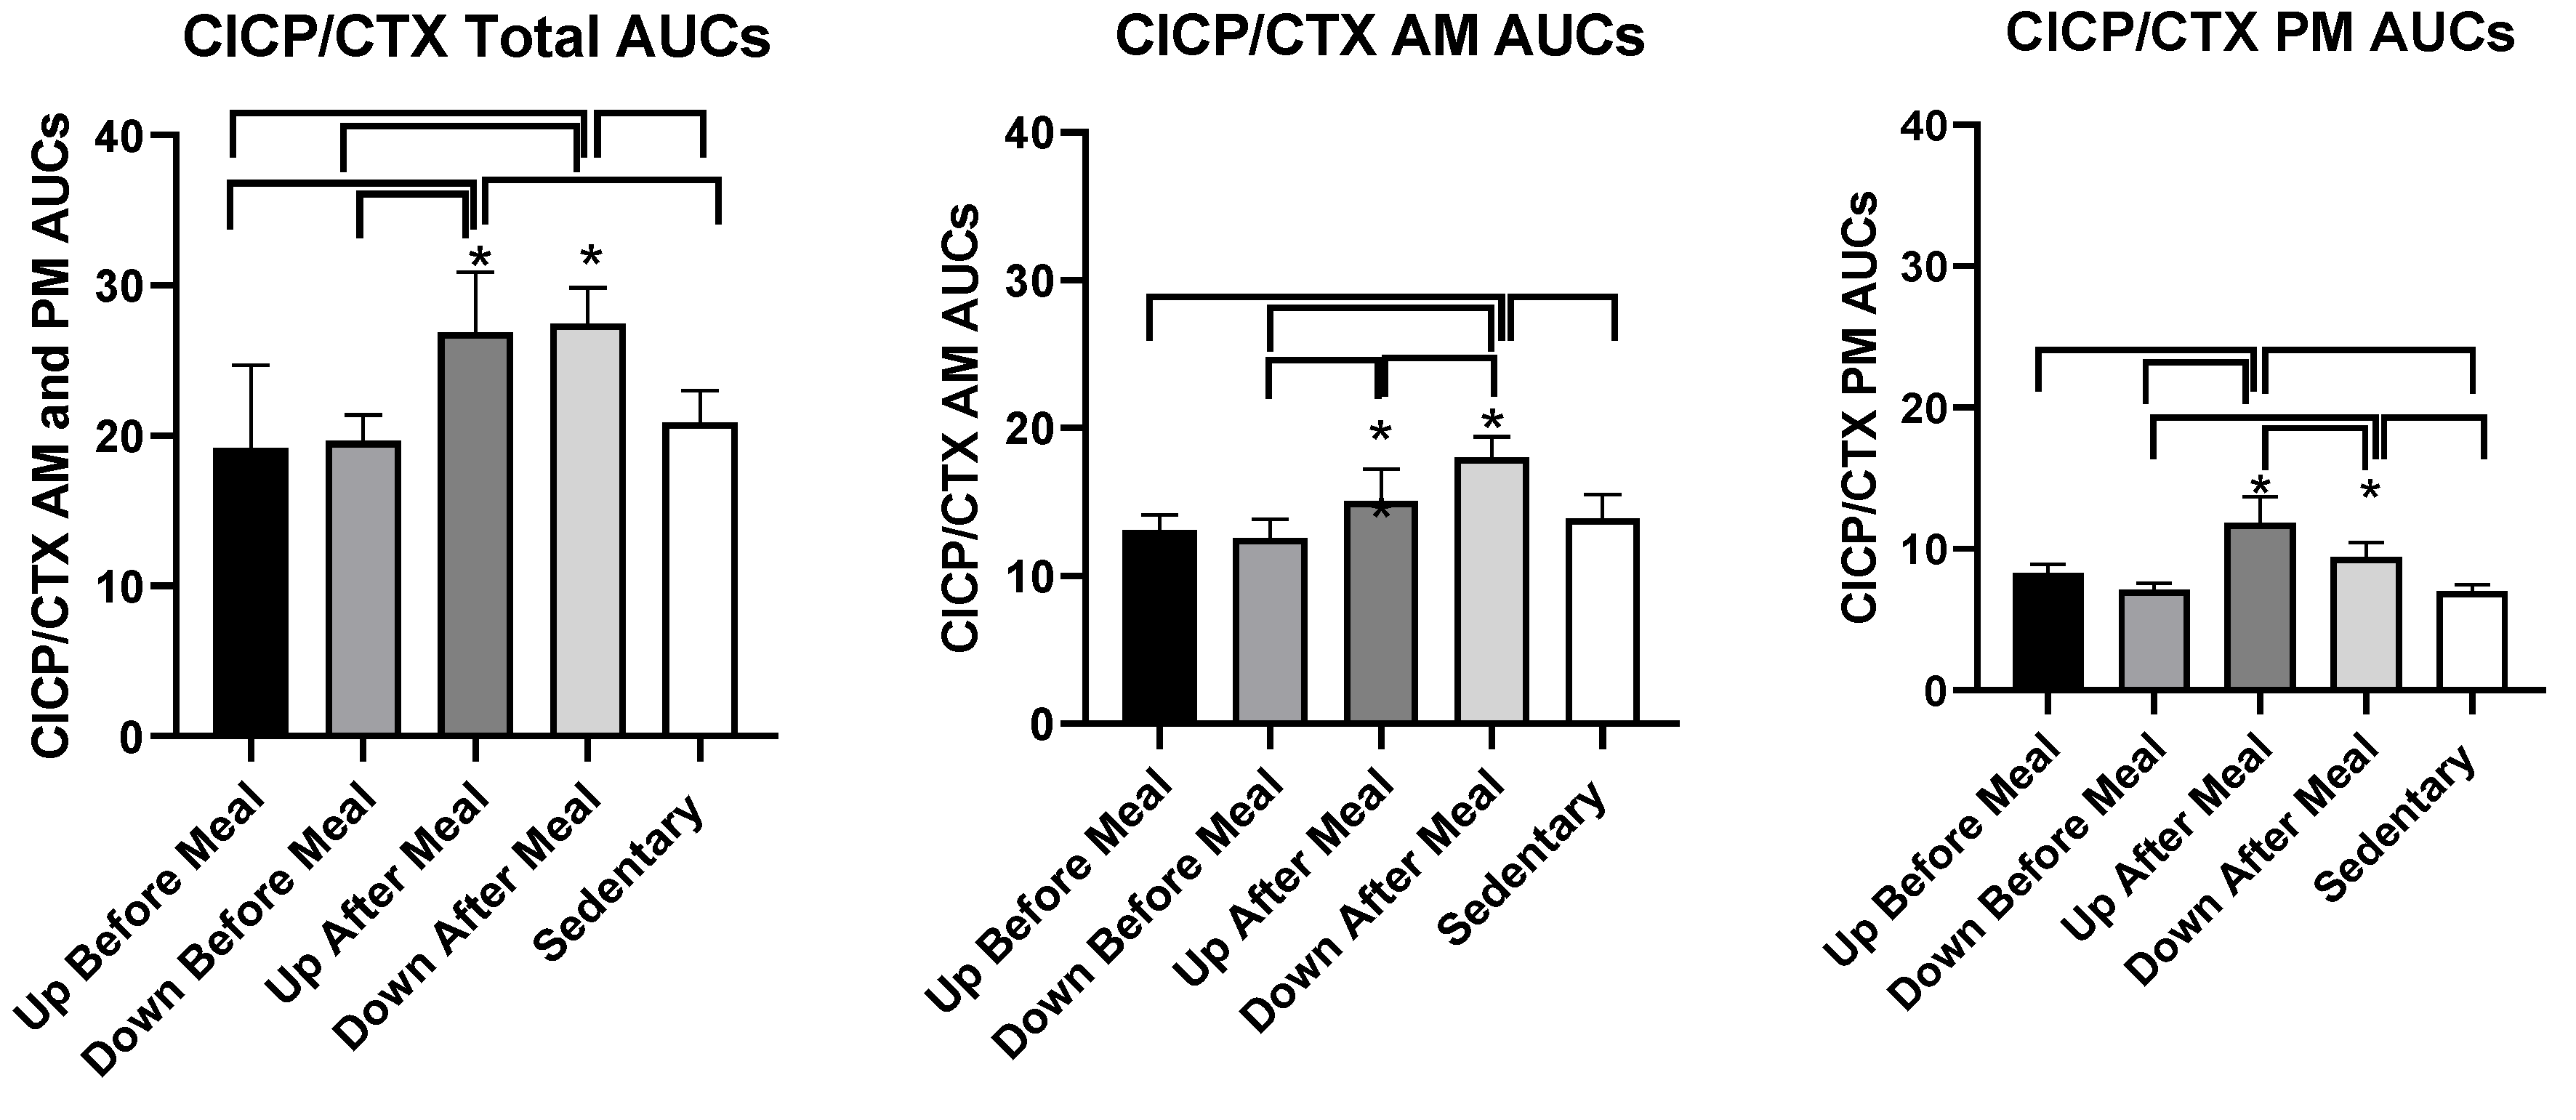
3.3.2. Comparisons Between Exercise-After-Meal and Exercise-Before Meal Bone Marker AUCs (Table 3)
| Variable | UAM vs. UBM | UAM vs. DBM | UAM vs. SED | DAM vs. UBM | DAM vs. DBM | DAM vs. SED |
|---|---|---|---|---|---|---|
| CICP AUCs, combined | t = 3.62, p = 0.0040 | t = 7.45, p < 0.0001 | t = 2.30, p = 0.042 | t = 2.31, p = 0.0412 | t = 6.14, p < 0.0001 | NS |
| CICP AUCs AM | NS | t = 3.47, p = 0.0052 | t = 2.98, p = 0.0125 | NS | t = 2.85, p = 0.0158 | t = 2.36, p = 0.038 |
| CICP/CTX AUCs combined | t = 5.45, p = 0.0002 | t = 7.57, p < 0.0001 | t = 5.63, p = 0.0002 | t = 6.03, p < 0.0001 | t = 8.15, < 0.0001 | t = 6.21, < 0.0001. |
| CICP/CTX AUCs AM | NS | t = 2.73, p = 0.0197 | NS | t = 5.09, p = 0.0003 | t = 5.99, p < 0.0001 | t = 4.58, p = 0.0008 |
| CICP/CTX AUCs PM | t = 5.96, p < 0.0001 | t = 8.23, p < 0.0001 | t = 7.26, p < 0.0001 | NS | t = 3.62, p = 0.004 | t = 2.84, p = 0.016 |
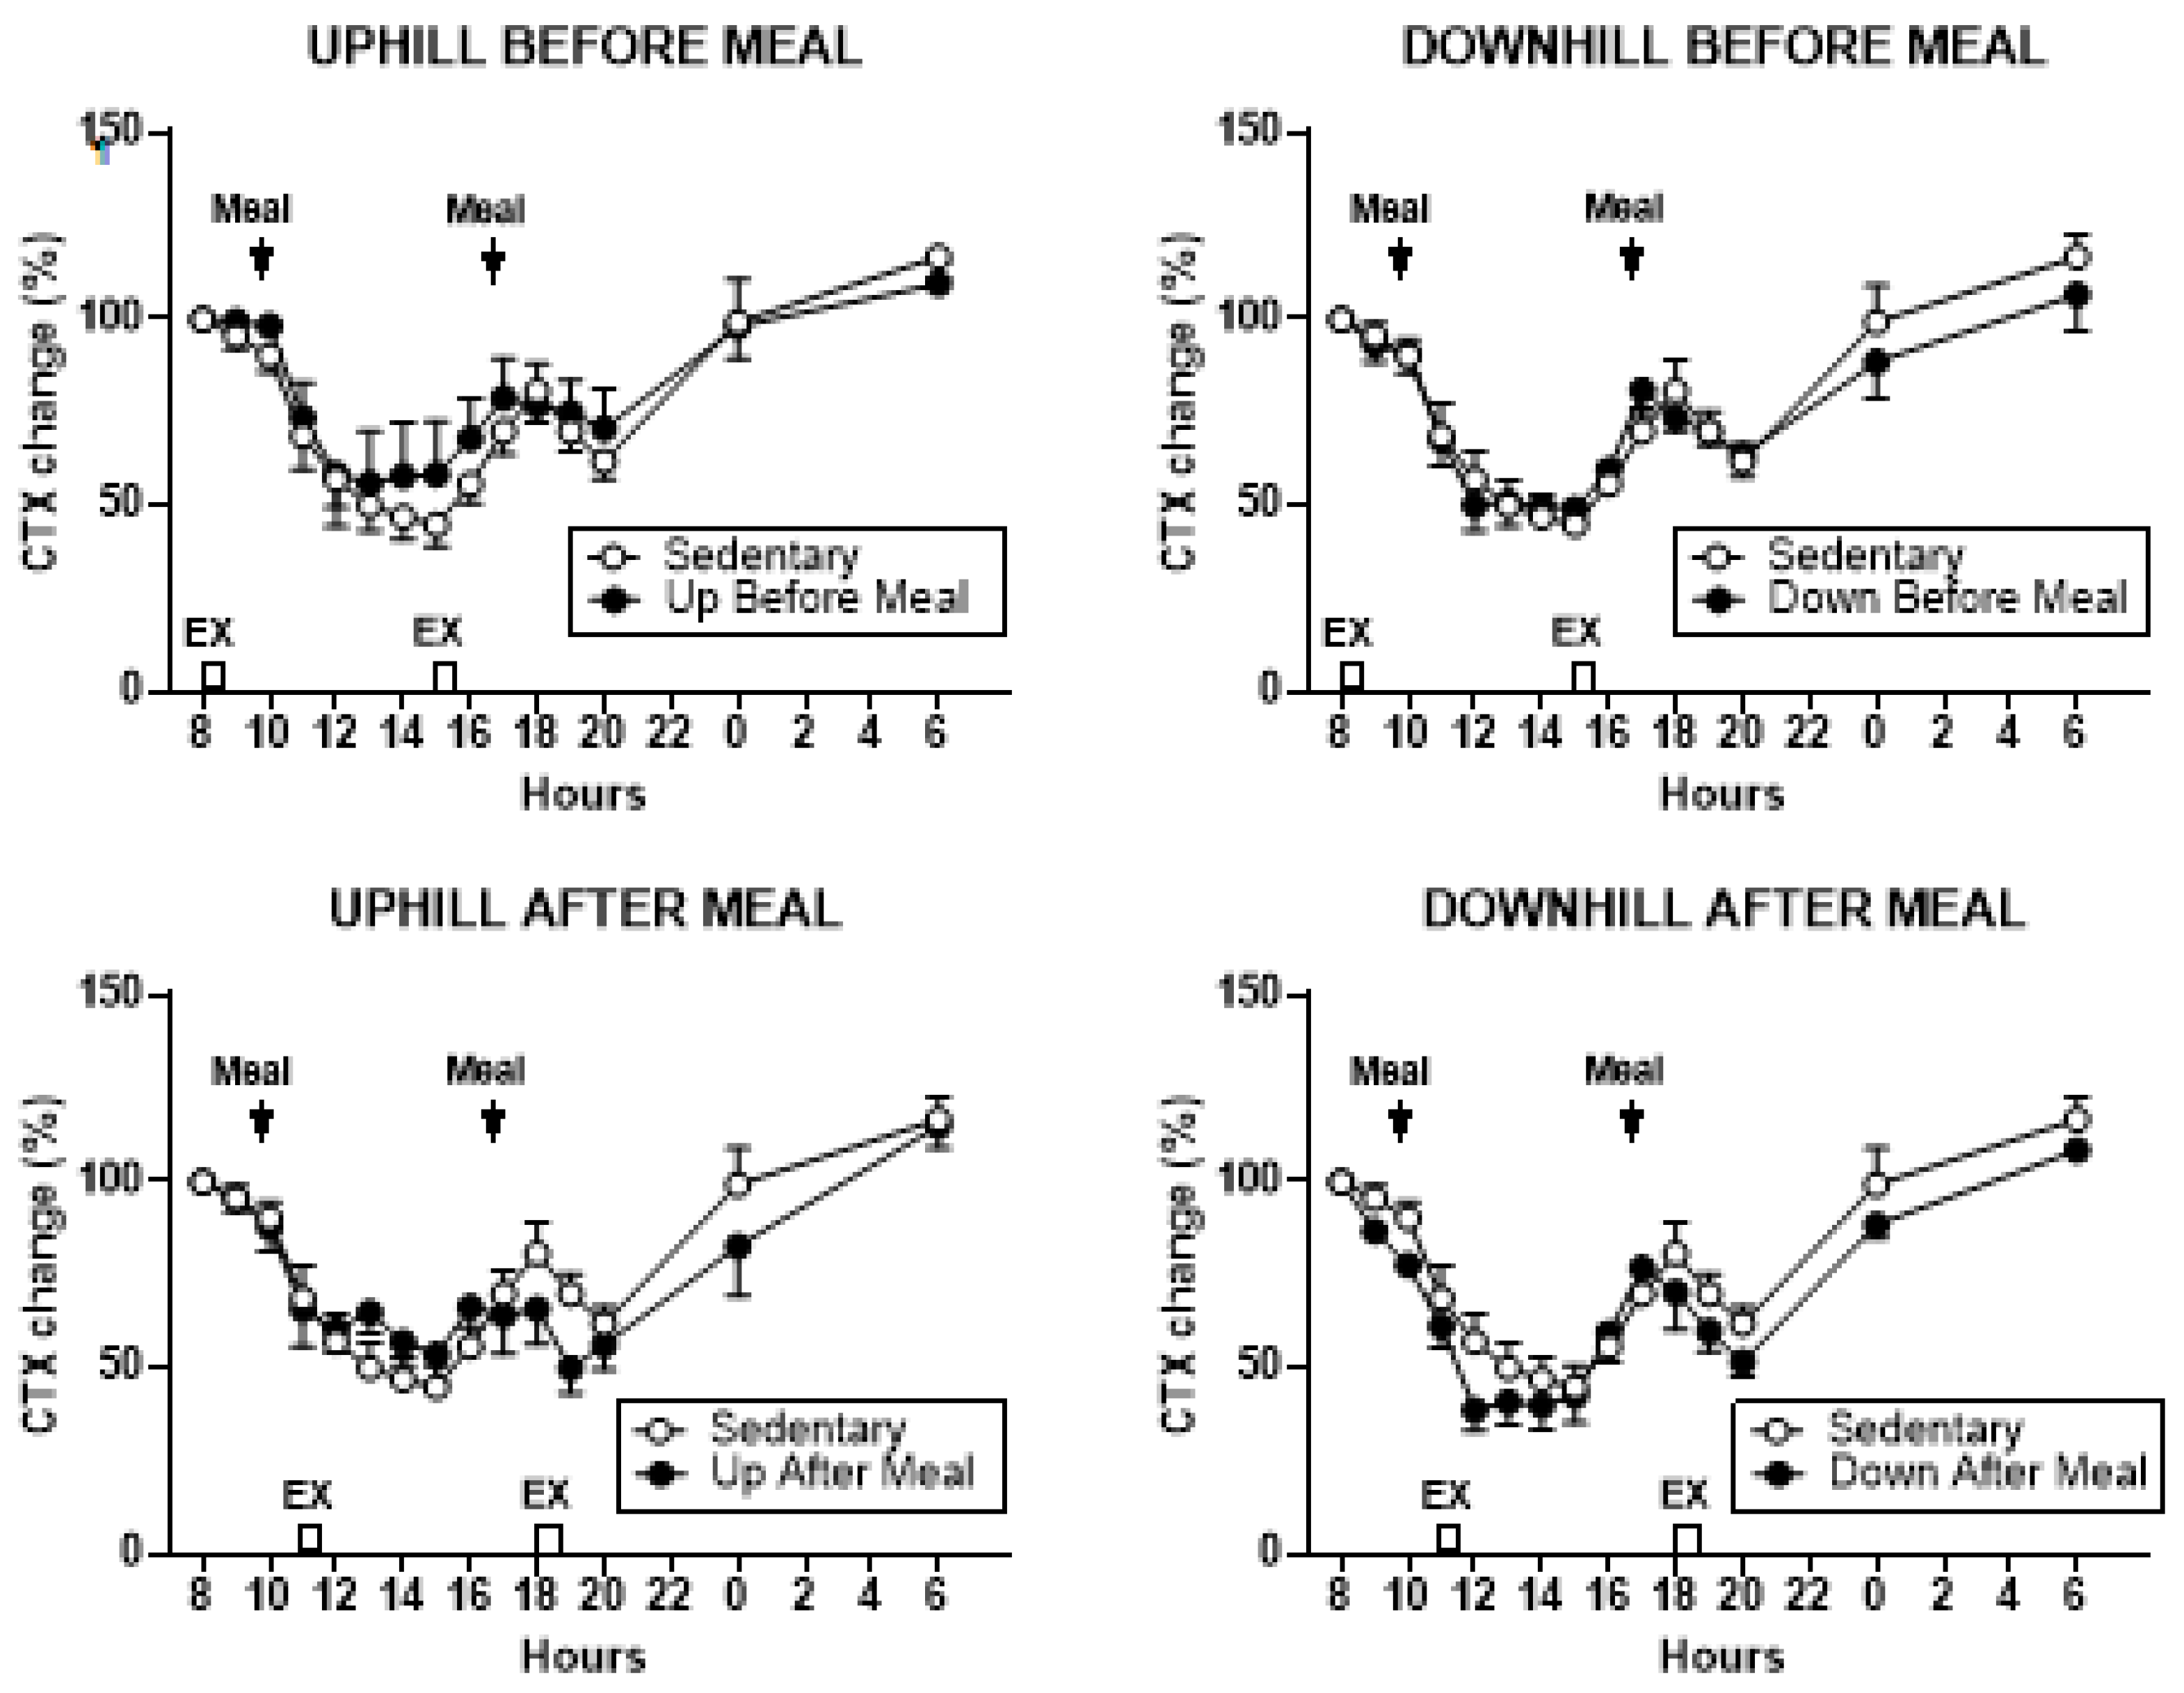
3.3.3. CTX
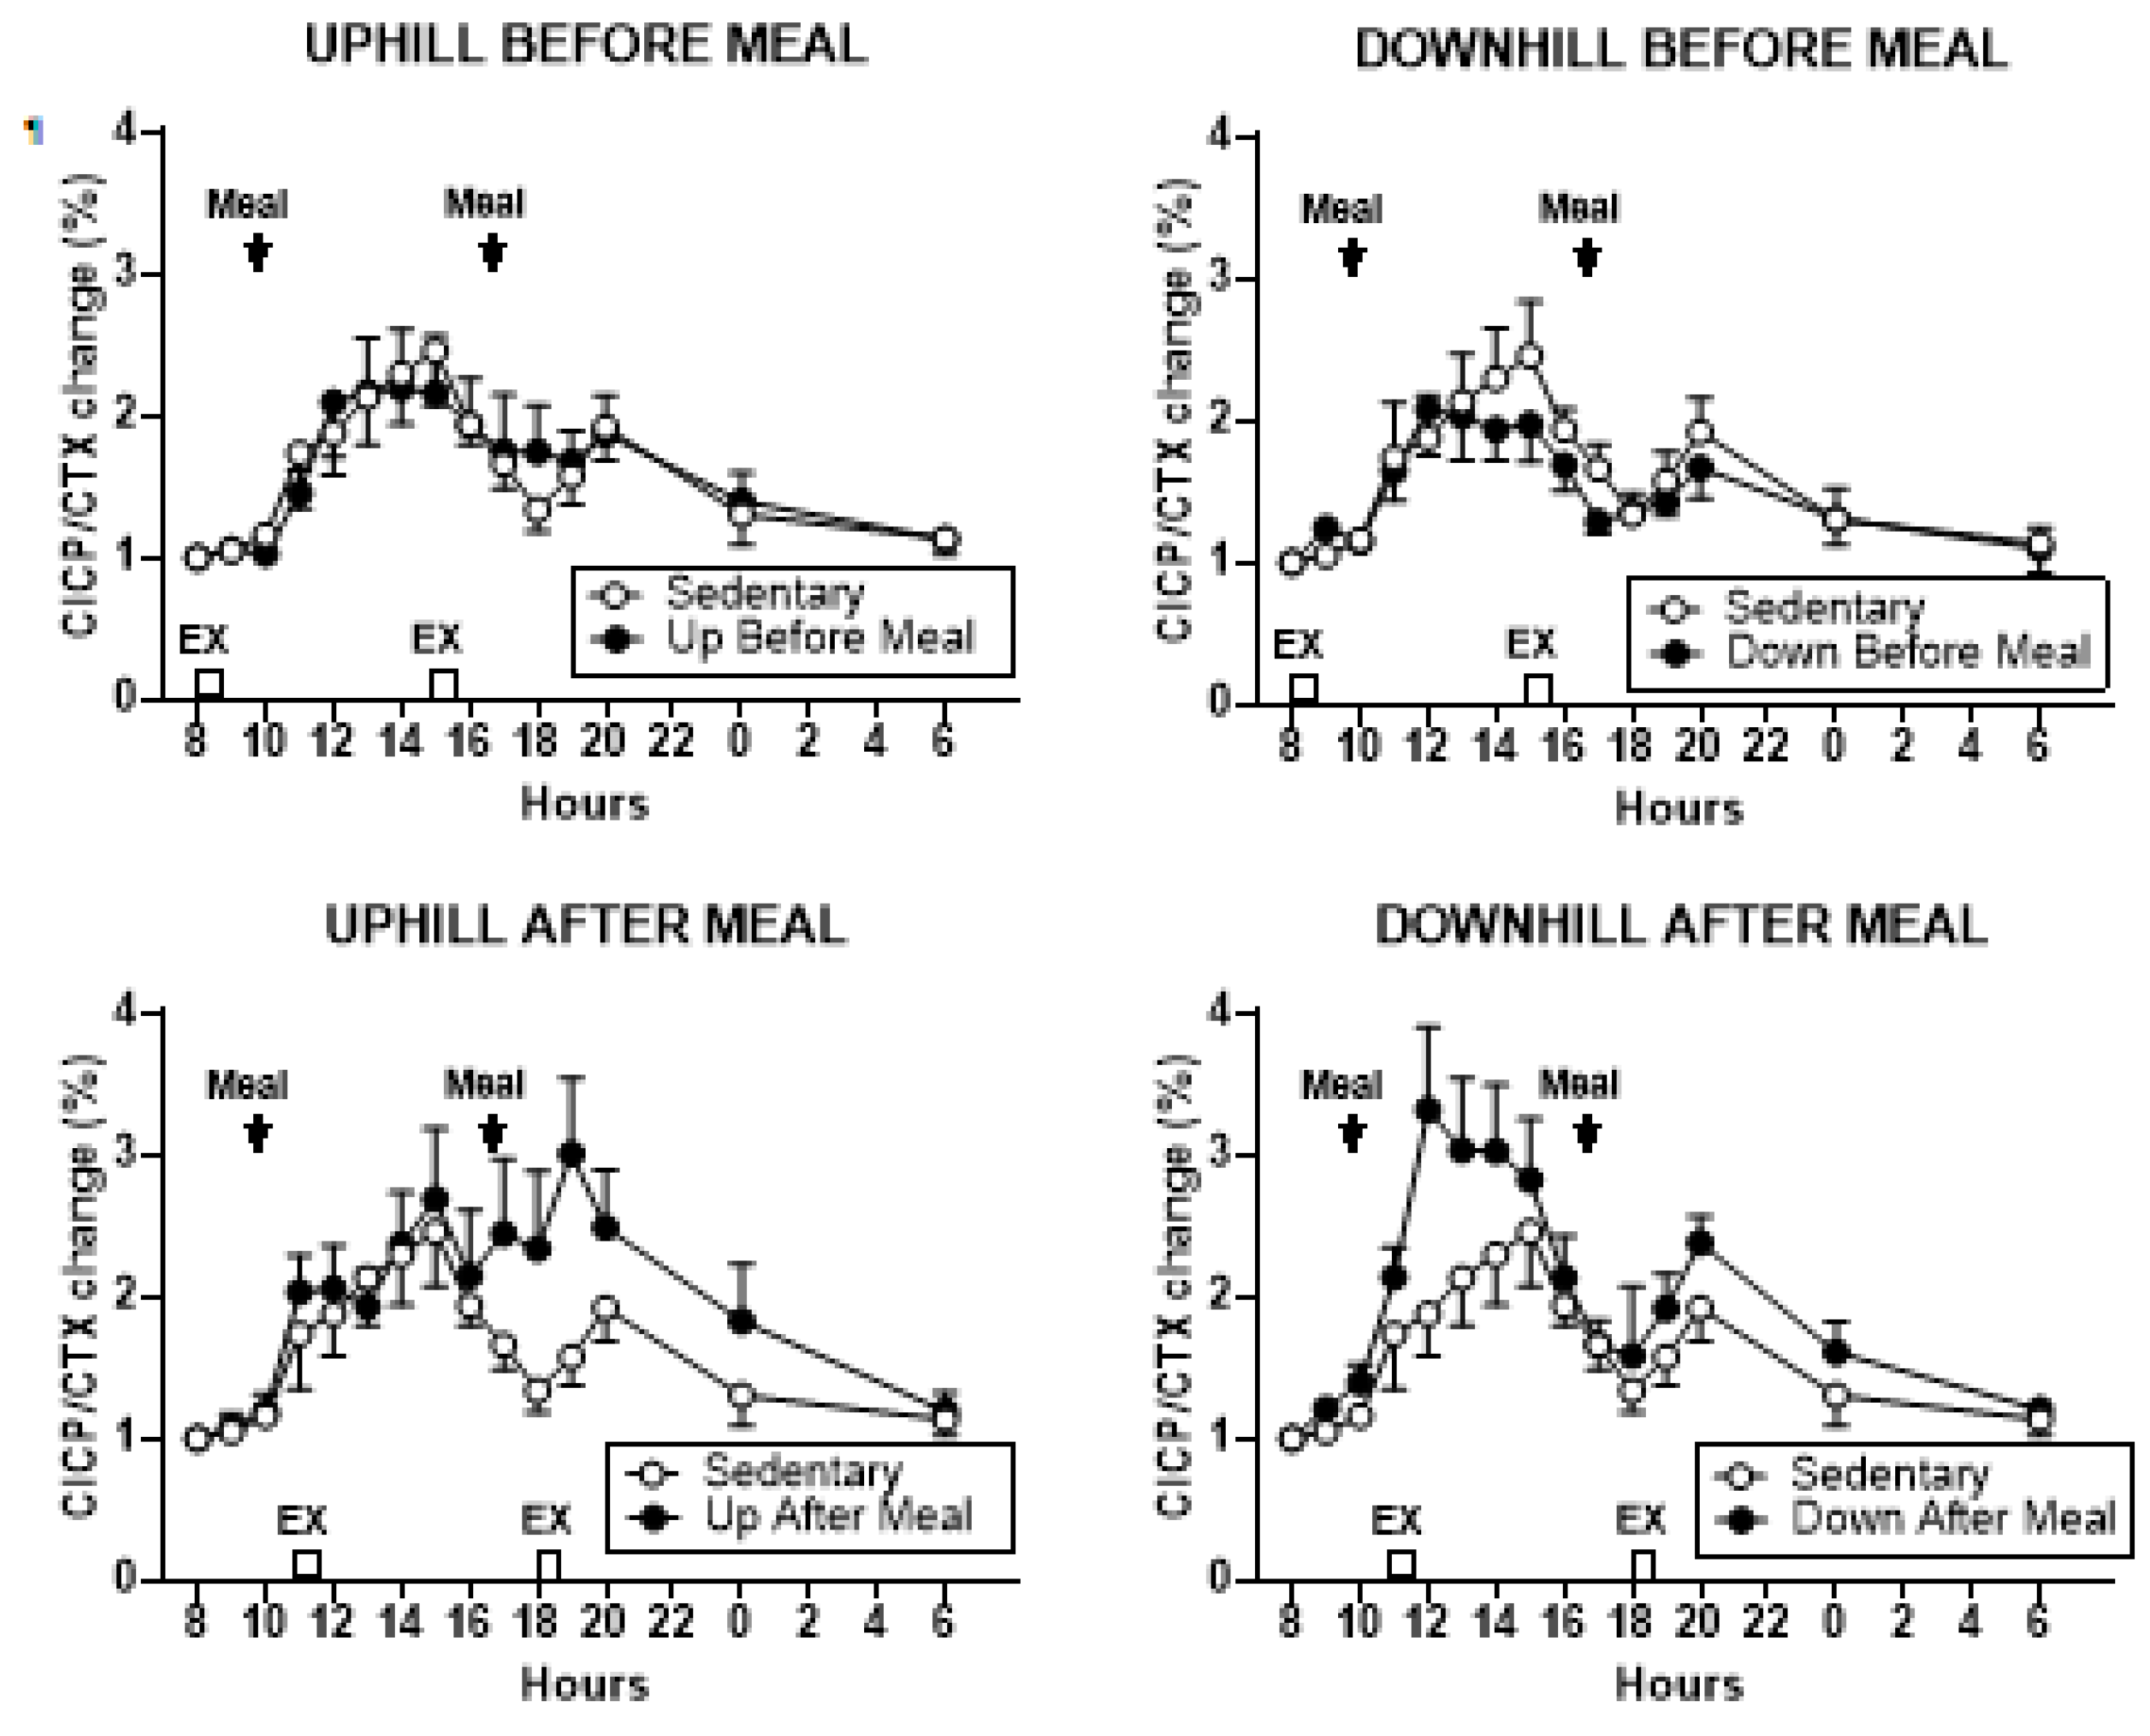
3.3.4. Osteogenic CICP/CTX Ratio
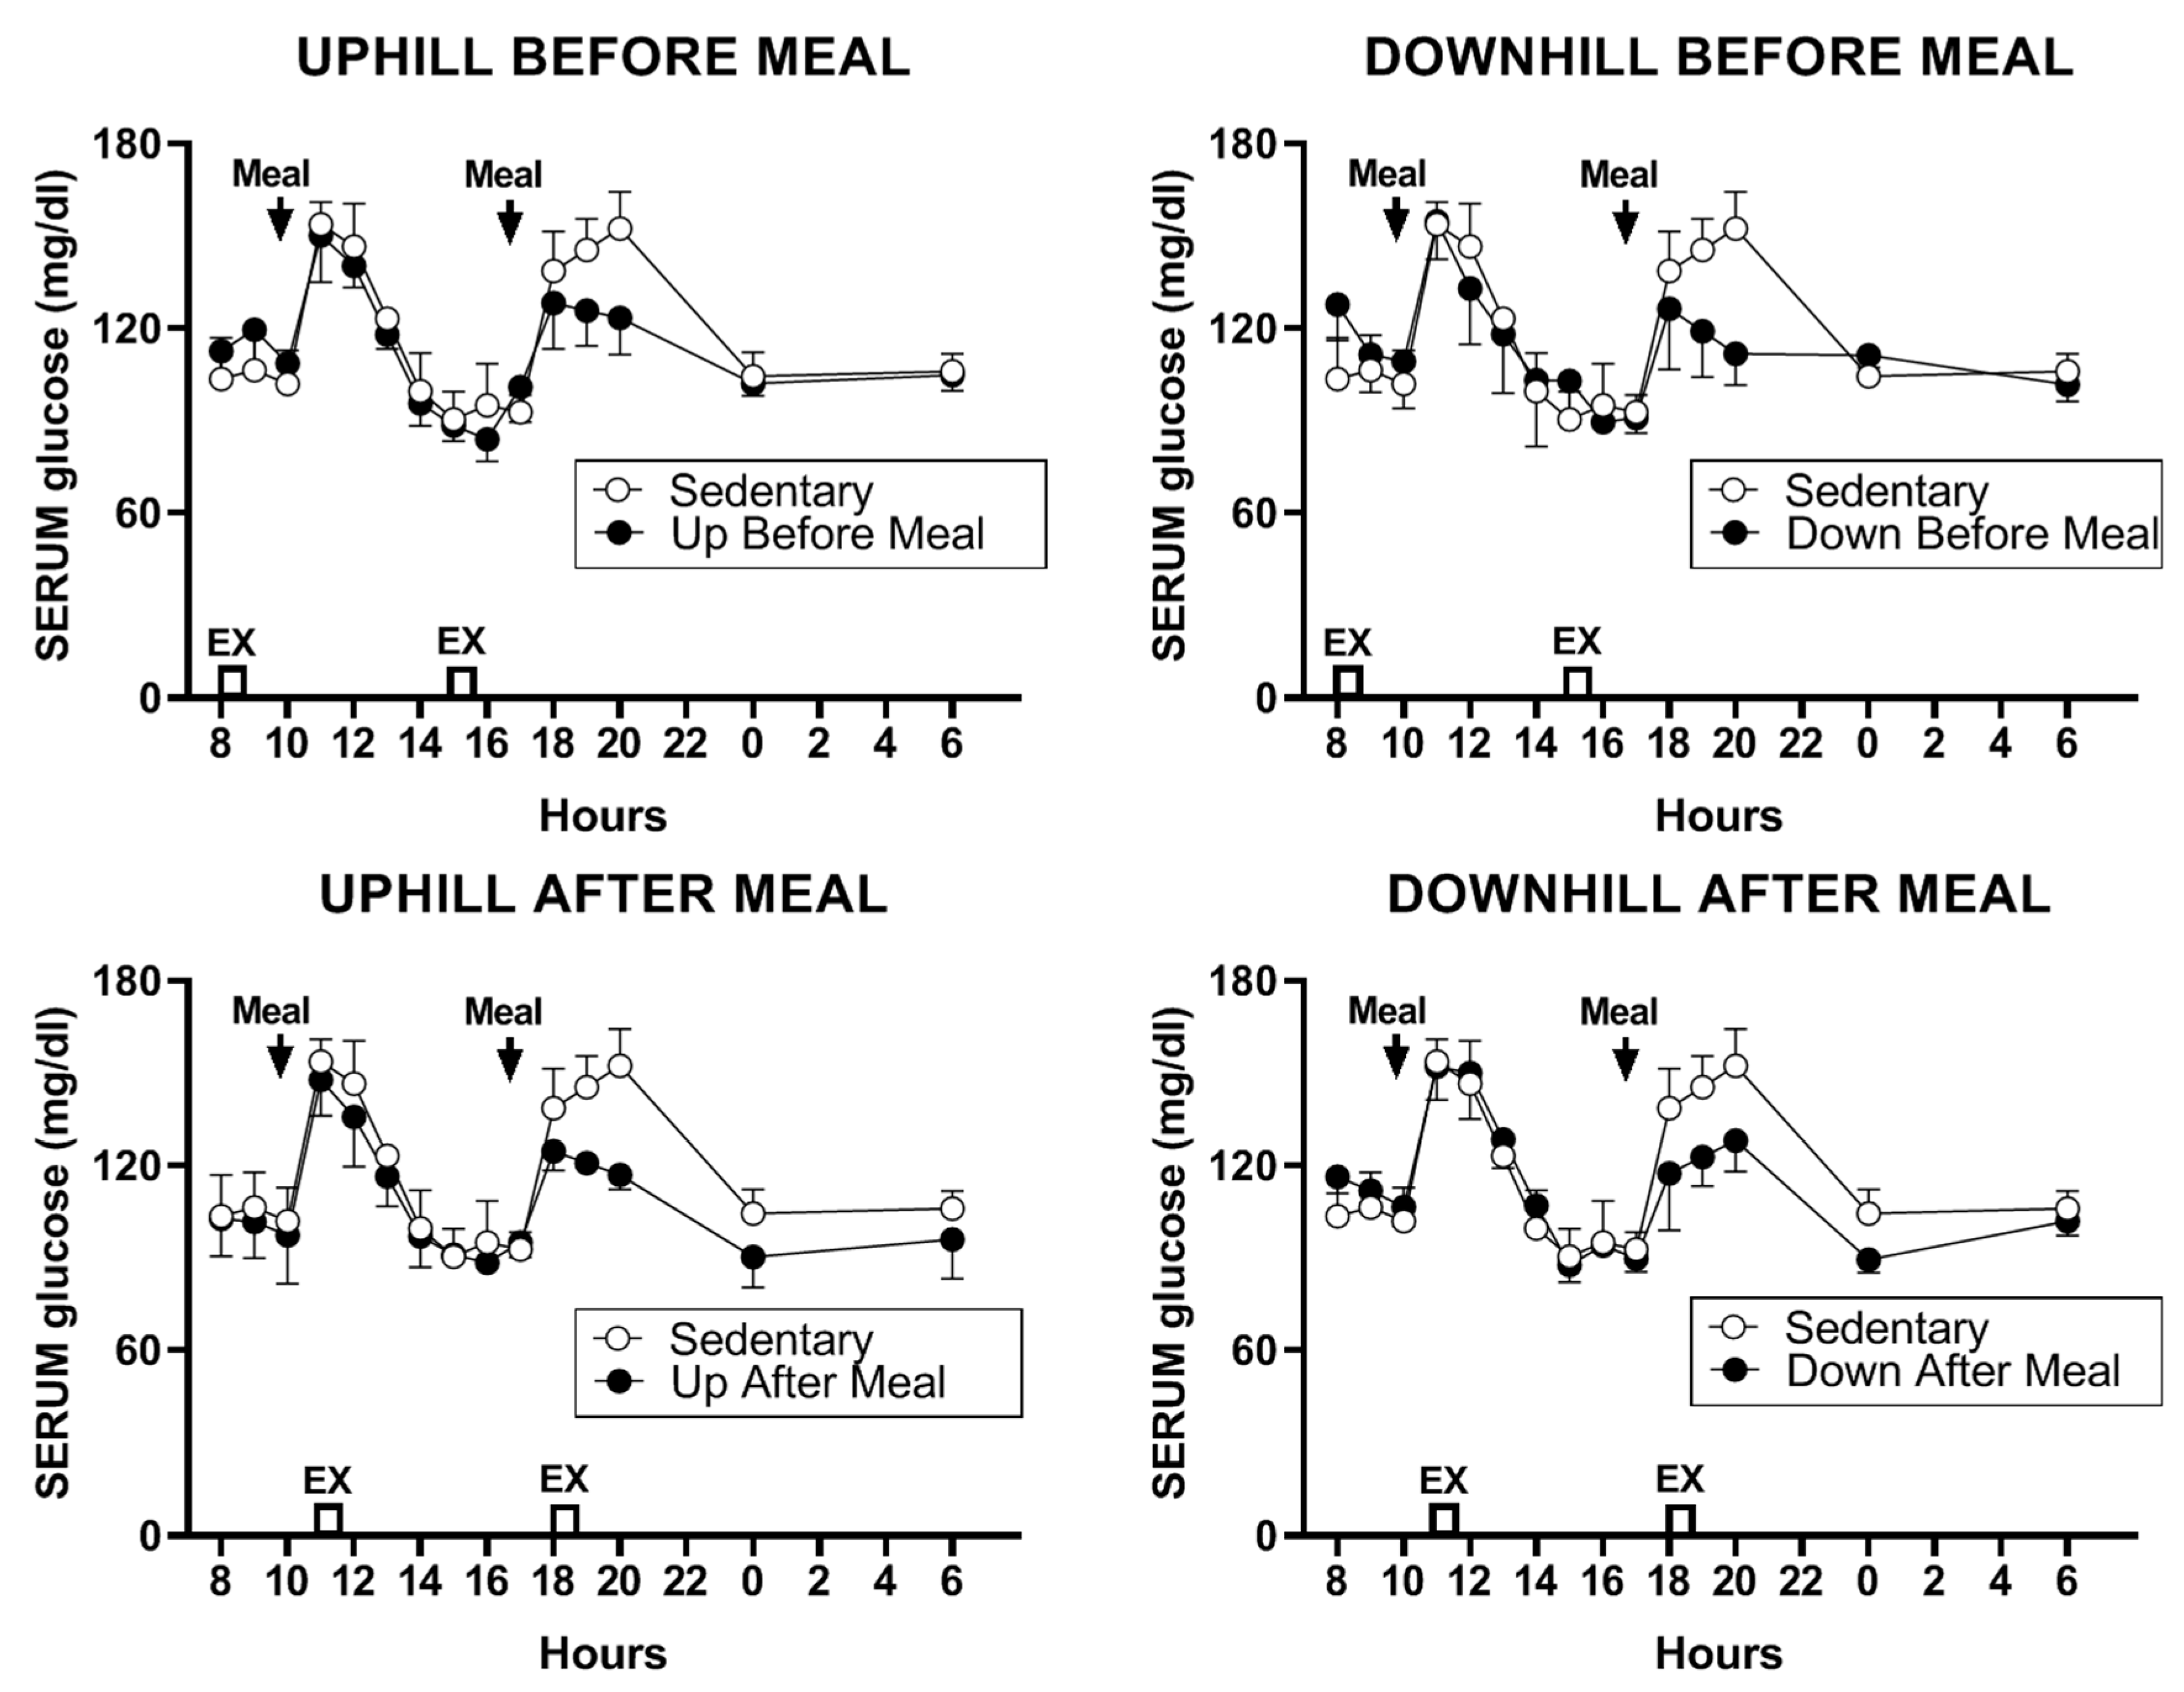
3.4. Glucose, Insulin, and HOMA-IR
3.4.1. Glucose
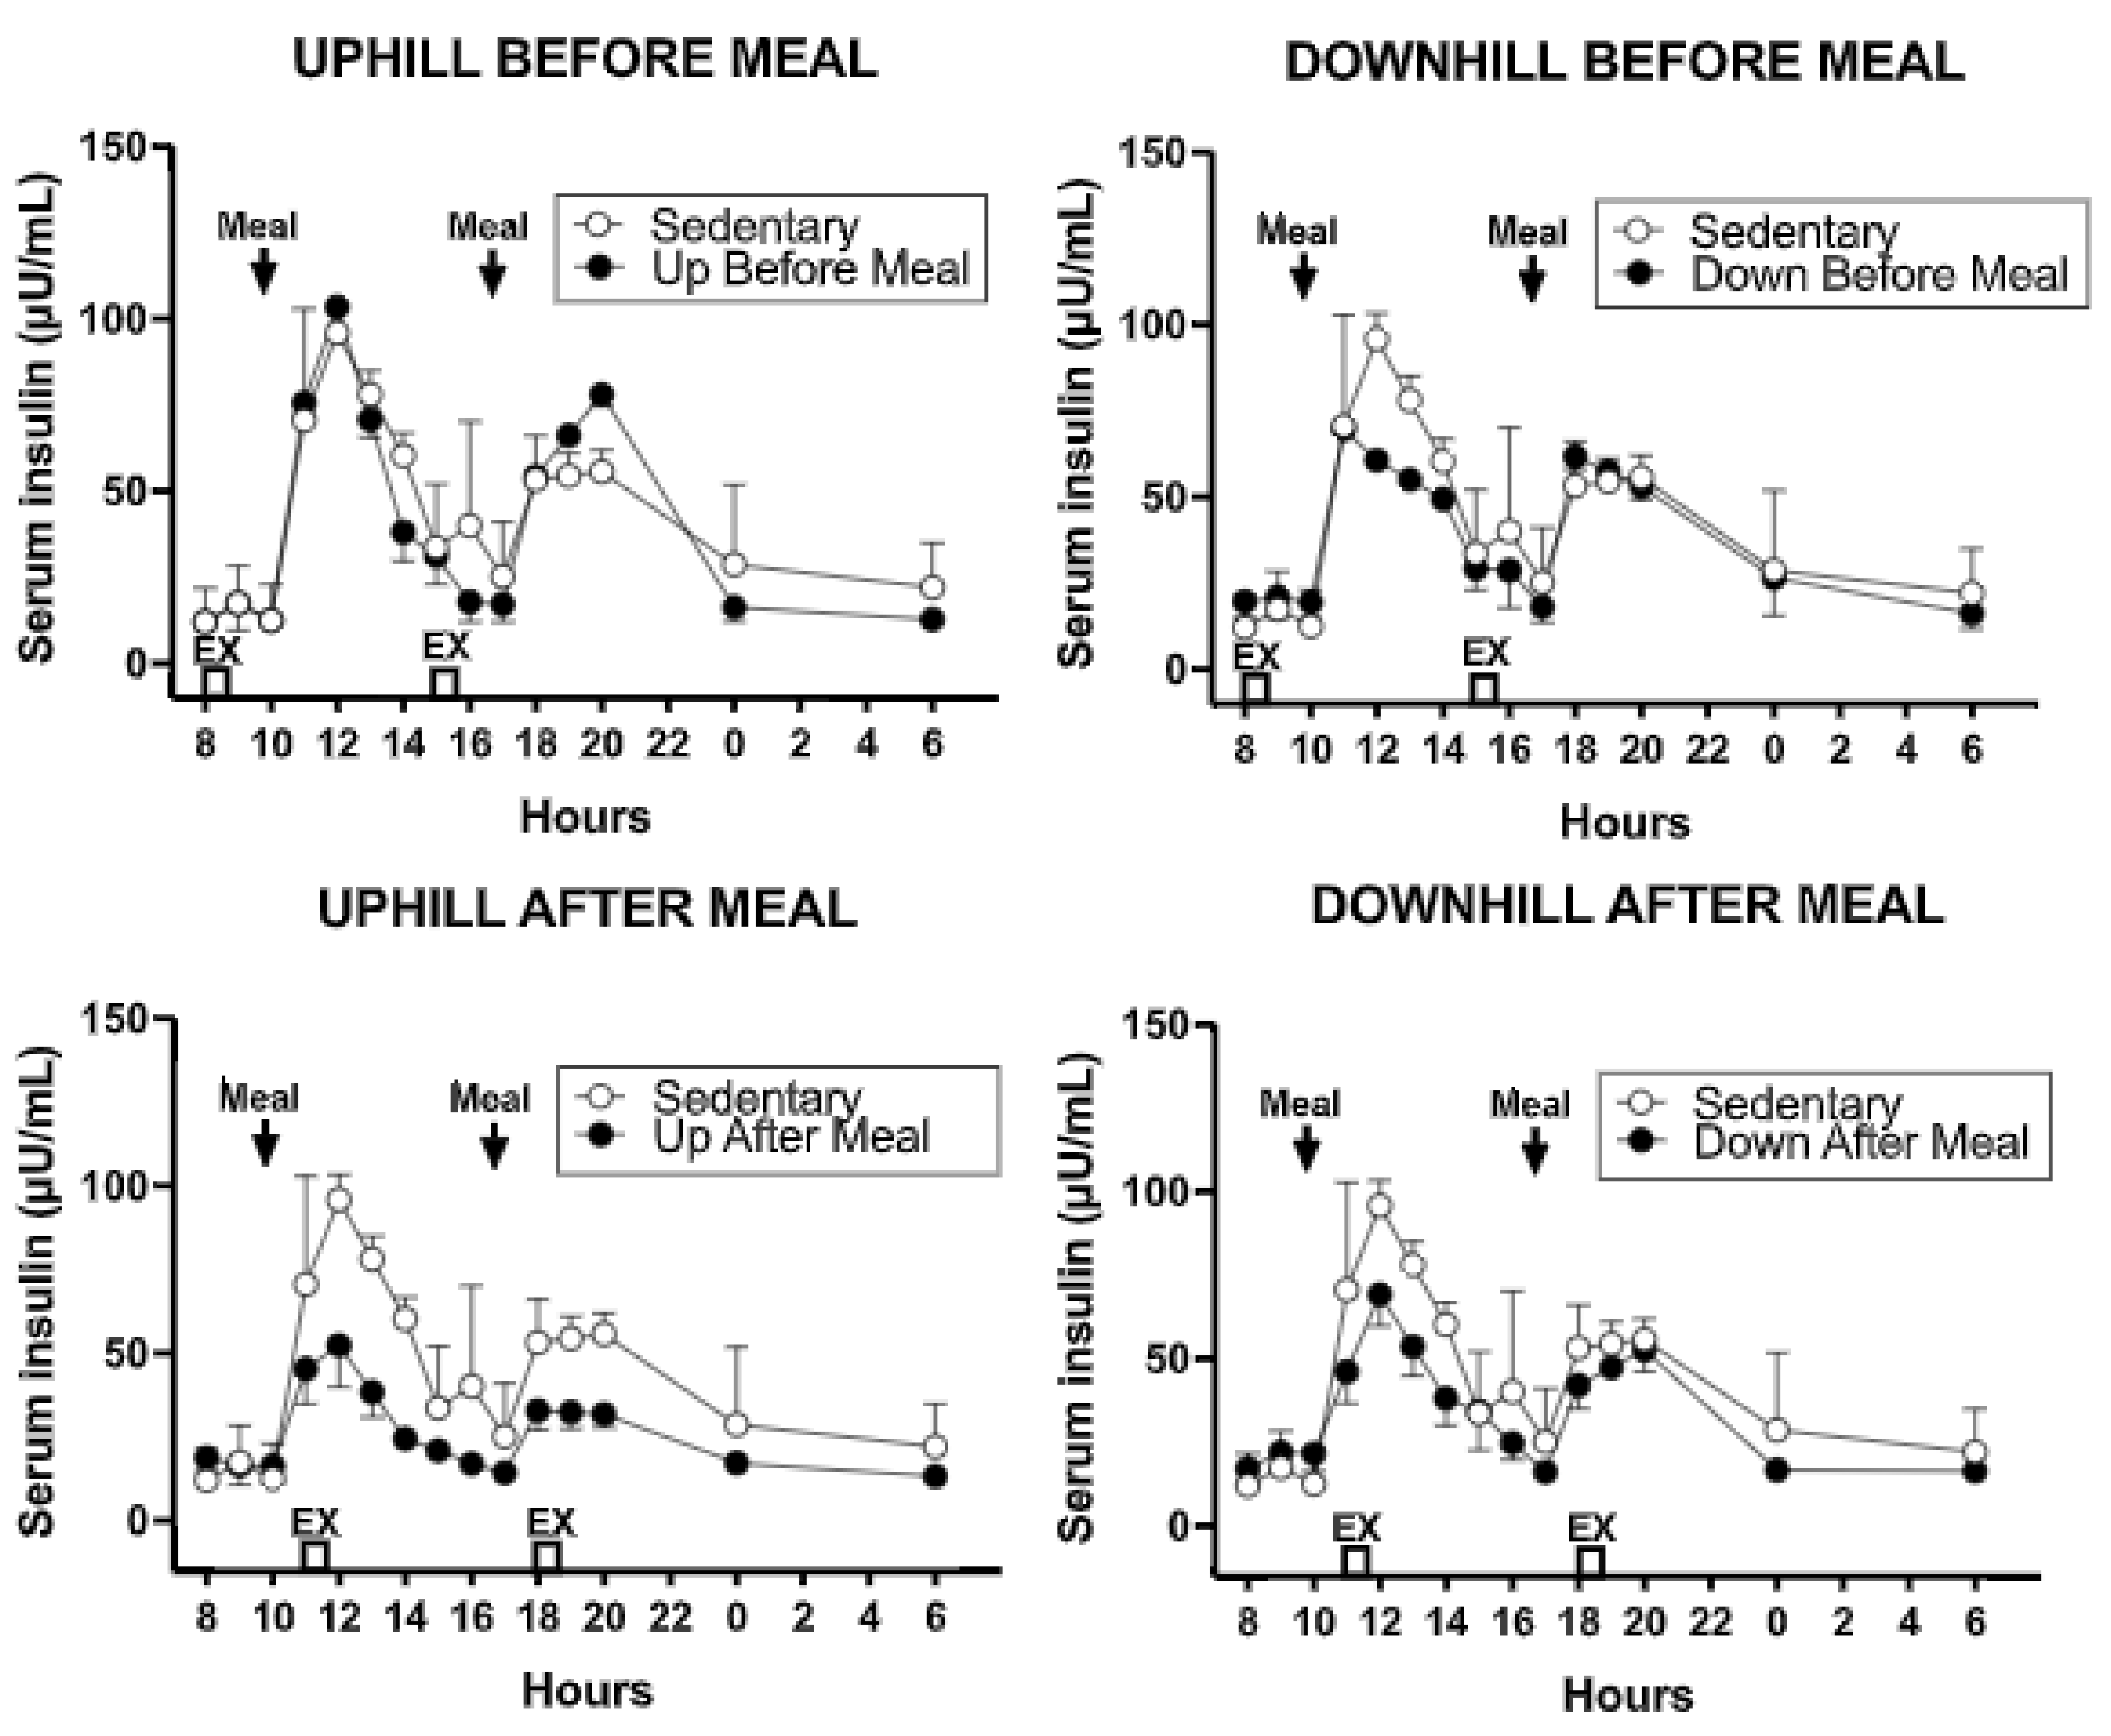
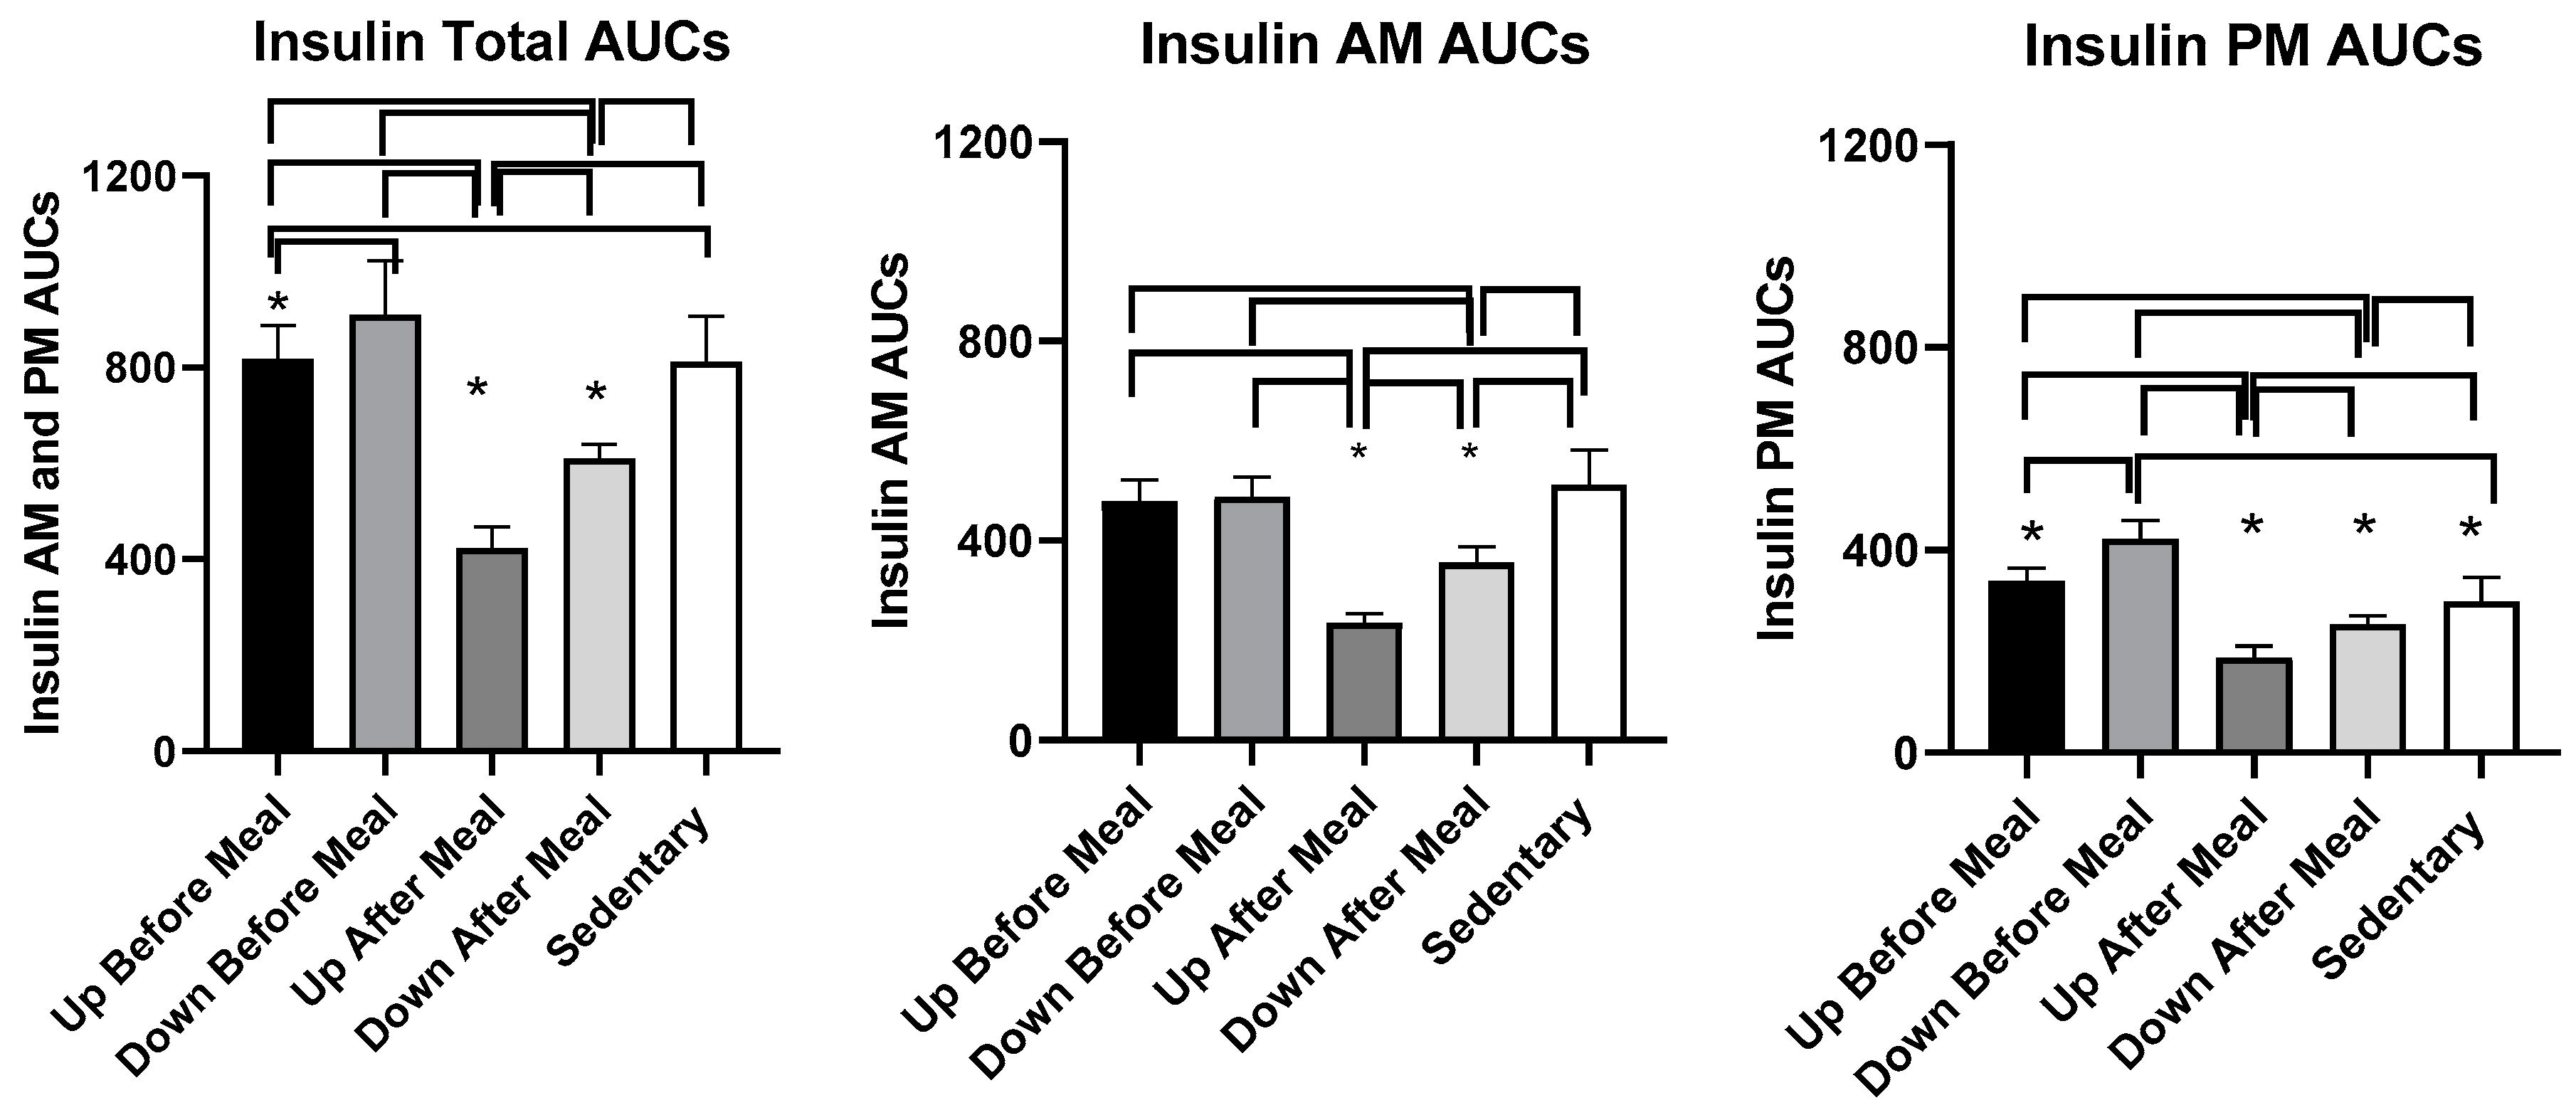
3.4.2. Insulin
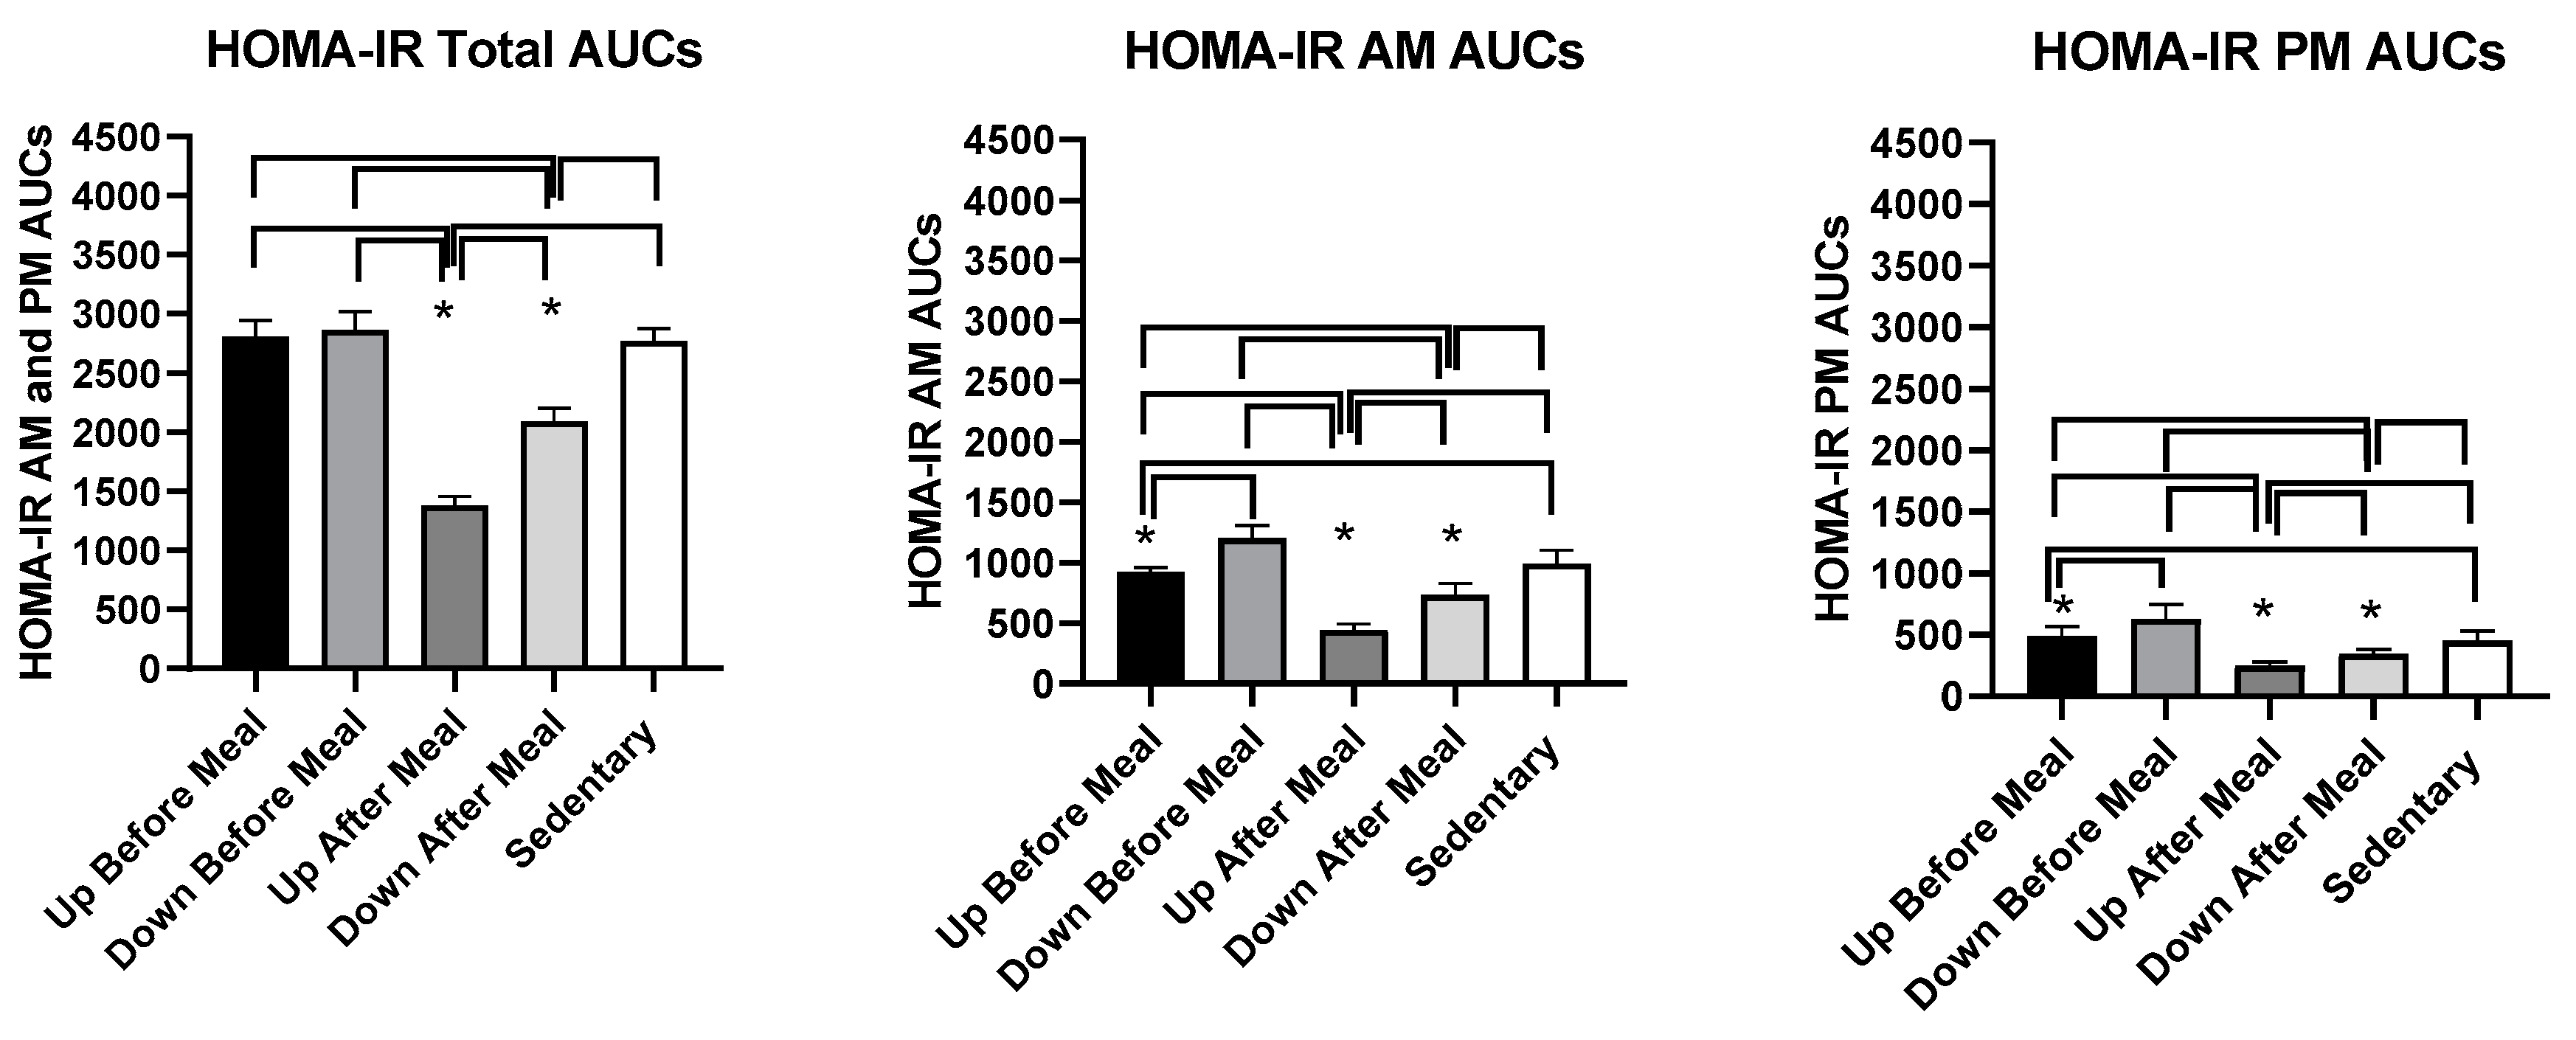
3.4.3. Comparisons Between Exercise-After-Meal and Exercise-Before Meal Insulin and HOMA-IR AUCs (Table 4)
3.4.4. HOMA-IR Measure of Insulin Resistance
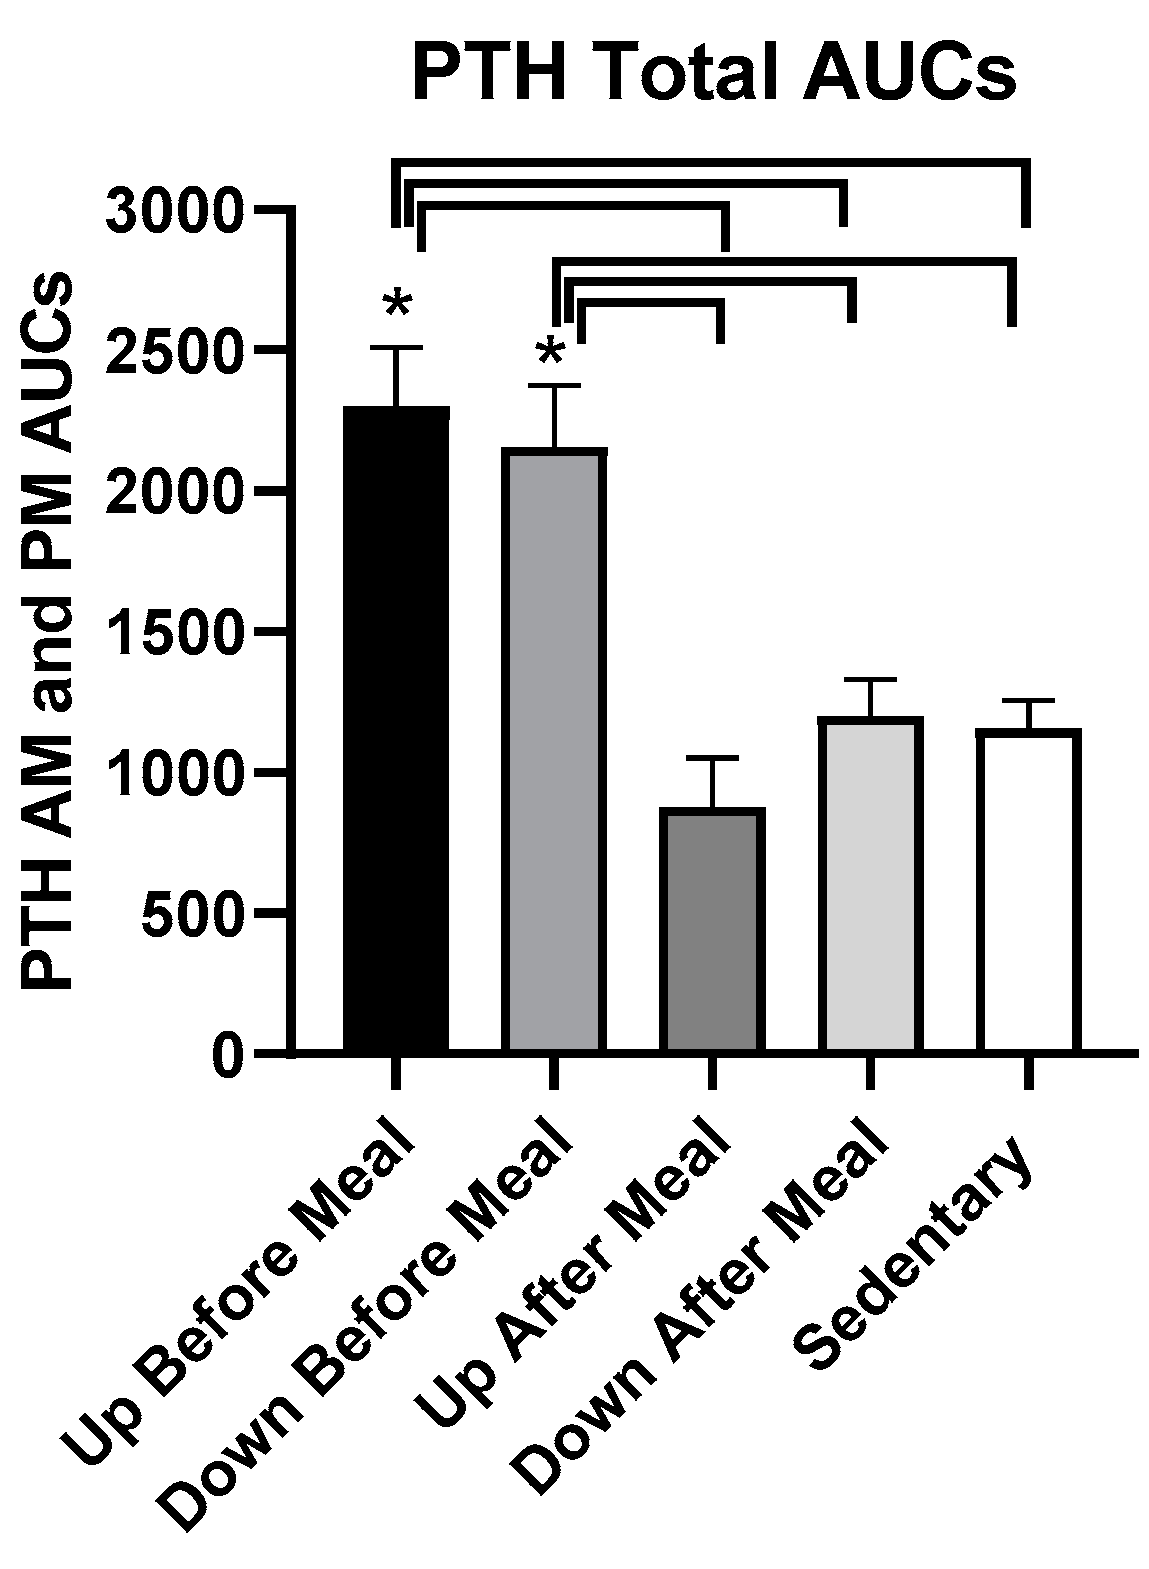
3.5. Hormone Measurements
3.5.1. PTH
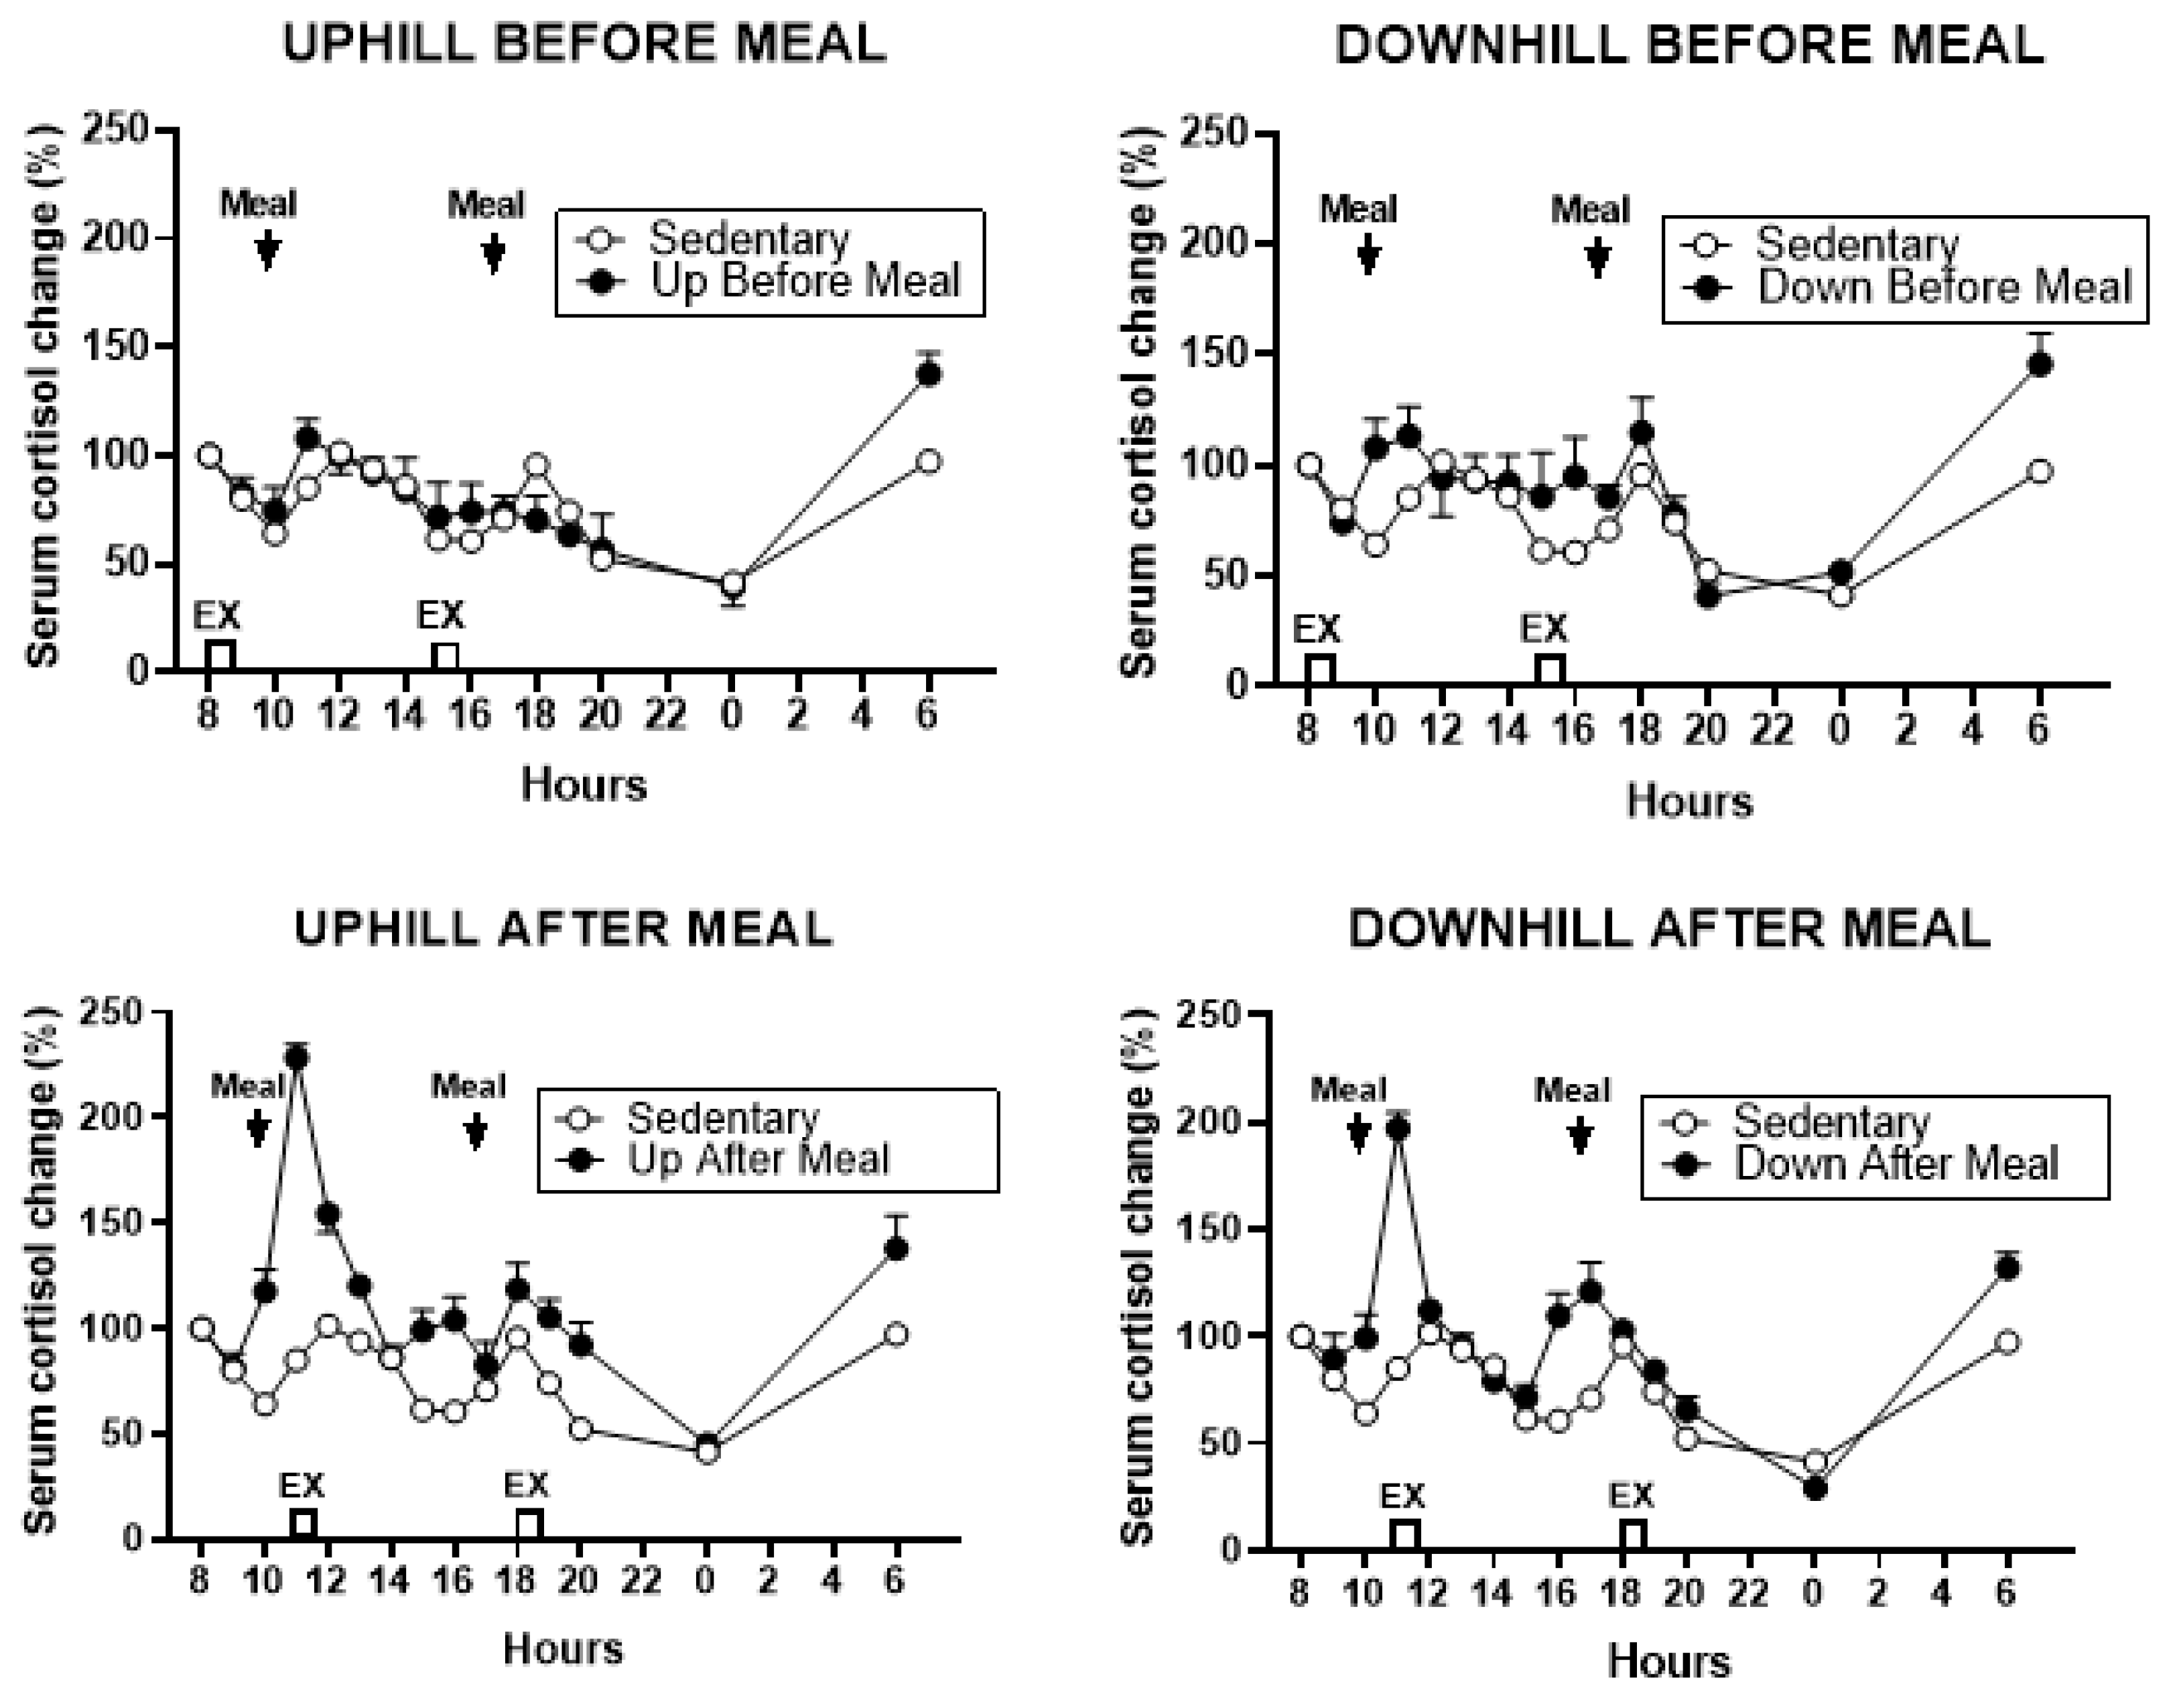
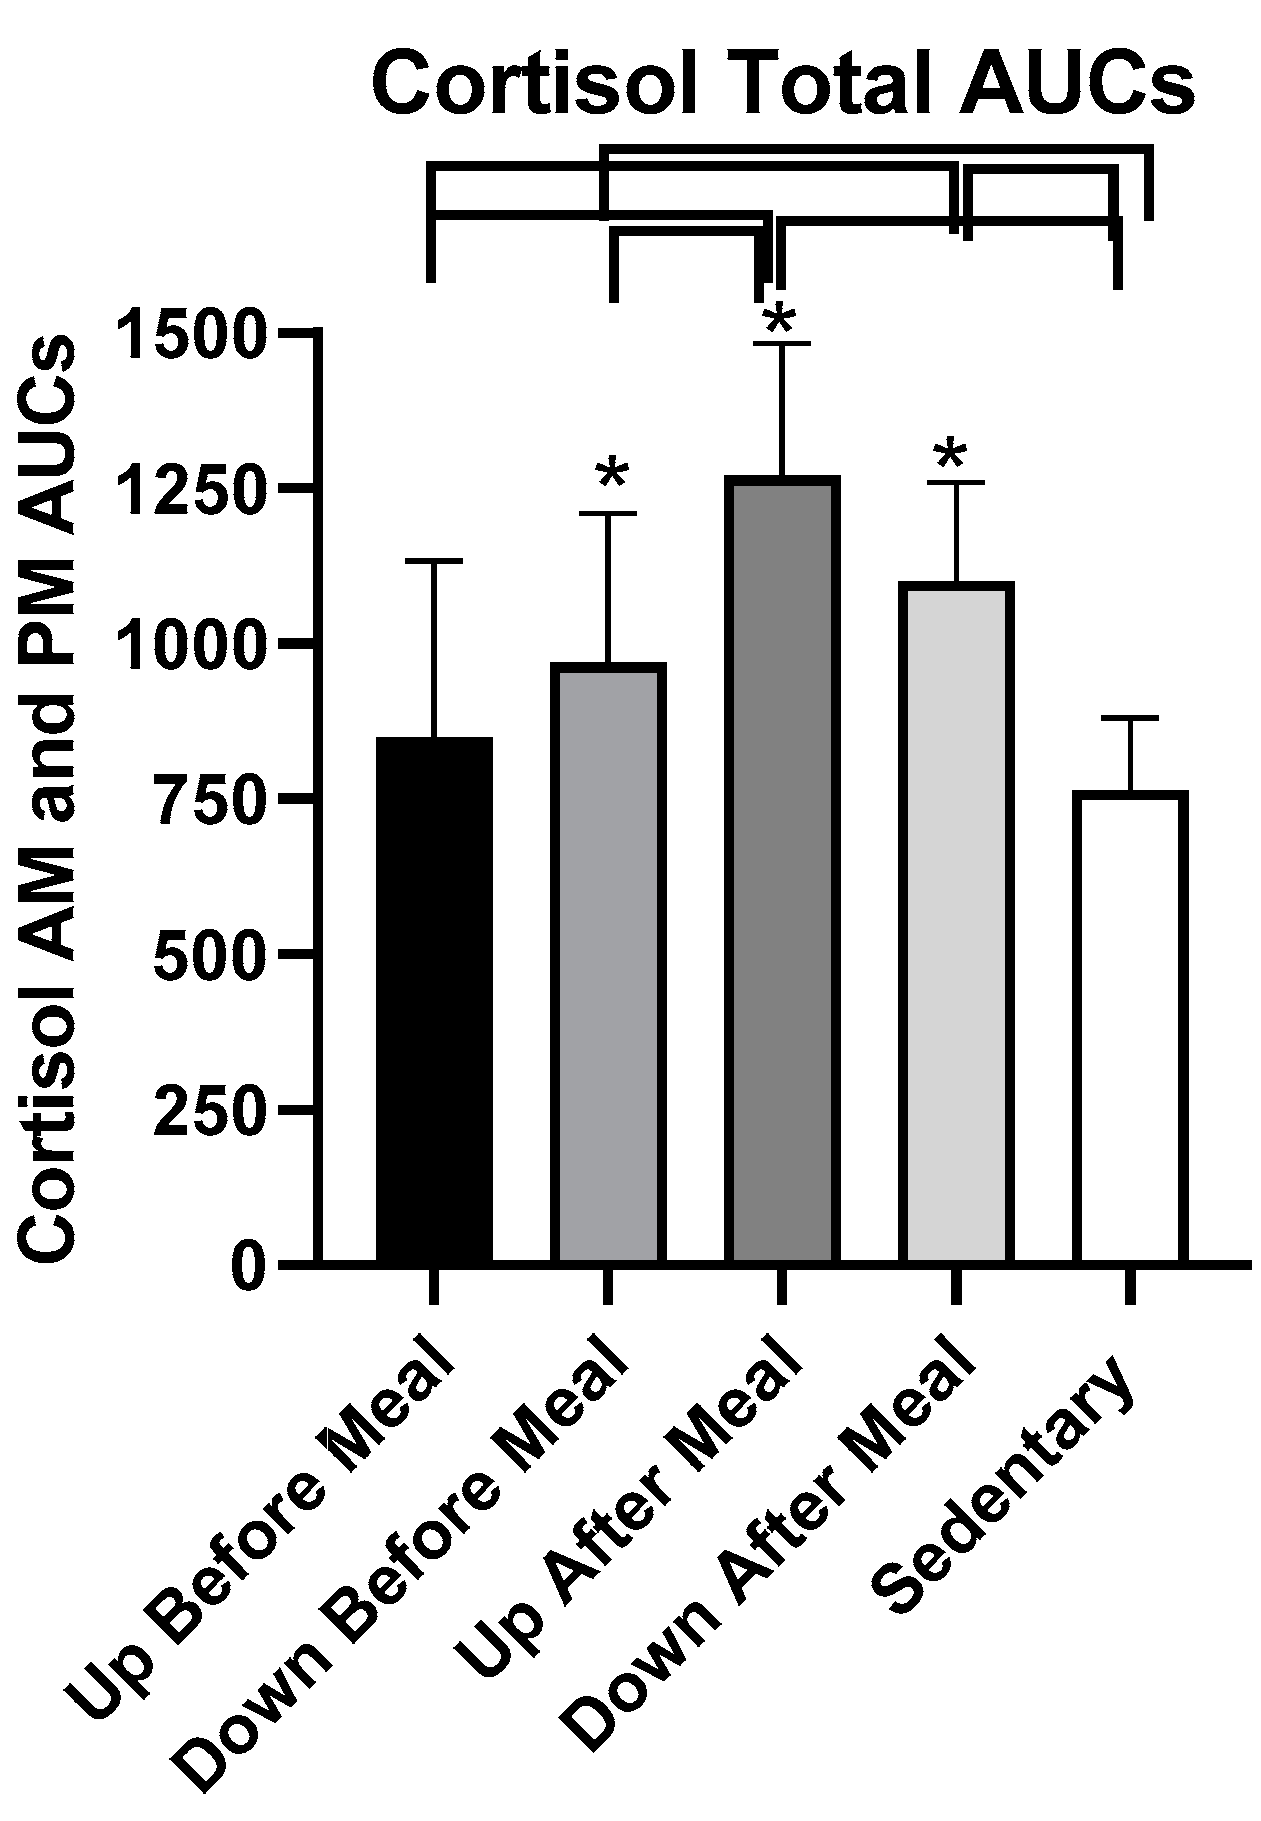
3.5.2. Cortisol
4. Discussion
5. Conclusions
Author Contributions
Funding
Acknowledgments
Conflicts of Interest
References
- Riggs, B.L.; Khosla, S.; Melton, L.J., III. A unitary model for involutional osteoporosis: Estrogen deficiency causes both type I and type II osteoporosis in postmenopausal women and contributes to bone loss in aging men. J. Bone Miner. Res. 1998, 13, 763–773. [Google Scholar] [CrossRef] [PubMed]
- Sullivan, S.D.; Lehman, A.; Nathan, N.K.; Thomson, C.A.; Howard, B.V. Age of menopause and fracture risk in postmenopausal women randomized to calcium + vitamin D, hormone therapy, or the combination: Results from the Women’s Health Initiative Clinical Trials. Menopause 2017, 24, 371–378. [Google Scholar] [CrossRef] [PubMed]
- Schwartz, A.V. Epidemiology of fractures in type 2 diabetes. Bone 2016, 82, 2–8. [Google Scholar] [CrossRef] [PubMed]
- Walsh, J.S.; Vilaca, T. Obesity, type 3 diabetes and bone in adults. Calcif. Tissue Int. 2017, 100, 528–535. [Google Scholar] [CrossRef] [PubMed]
- Baleanu, F.; Bergmann, P.; Hambye, A.S.; Dekelver, C.; Iconaru, L.; Cappelle, S.I.; Moreau, M.; Paesmans, M.; Karmali, R.; Body, J.J. Assessment of bone quality with trabecular bone score in type 2 diabetes mellitus: A study from the FRISBEE cohort. Int. J. Clin. Pract. 2019, 26, e13347. [Google Scholar] [CrossRef] [PubMed]
- Furst, J.R.; Bandeira, L.C.; Fan, W.W.; Agarwal, S.; Nishiyama, K.K.; McMahon, D.J.; Dworakowski, E.; Jiang, H.; Silverberg, S.J.; Rubin, M.R. Advanced glycation end products and bone material strength in type 2 diabetes. J. Clin. Endocrinol. Metab. 2016, 101, 2502–2510. [Google Scholar] [CrossRef]
- Arikan, S.; Tuzcu, A.; Bahceci, M.; Ozmden, S.; Gokalp, D. Insulin resistance in type 2 diabetes may be related to bone mineral density. J. Clin. Densitom. 2012, 15, 186–190. [Google Scholar] [CrossRef]
- Reaven, G.M.; Olefsky, J.M. The role of insulin resistance in the pathogenesis of diabetes mellitus. Adv. Metab. Disord. 1978, 9, 313–331. [Google Scholar]
- Al-Hariri, M. Sweet bones: The pathogenesis of bone alteration in diabetes. J. Diabetes Res. 2016, 2016, 6969040. [Google Scholar] [CrossRef]
- Jilka, R.L.; O’Brien, C.A. The role of osteocytes in age-related bone loss. Curr. Osteoporos. Rep. 2016, 14, 16–25. [Google Scholar] [CrossRef]
- Rubin, C.T.; Bain, S.D.; McLeod, K.J. Suppression of the osteogenic response in the aging skeleton. Calcif. Tissue Int. 1992, 50, 306–313. [Google Scholar] [CrossRef] [PubMed]
- Liu, G.F.; Wang, Z.Q.; Liu, L.; Zhang, B.T.; Miao, Y.Y.; Yu, S.N. A network meta-analysis on the short-term efficacy and adverse events of different anti-osteoporosis drugs for the treatment of postmenopausal osteoporosis. J. Cell. Biochem. 2018, 119, 4469–4481. [Google Scholar] [CrossRef] [PubMed]
- Schwartz, A.V. Efficacy of osteoporosis therapies in diabetic patients. Calcif. Tissue Int. 2017, 100, 165–173. [Google Scholar] [CrossRef] [PubMed]
- Reid, I.R. Efficacy, effectiveness and side effects of medications used to prevent fractures. J. Intern. Med. 2015, 277, 690–706. [Google Scholar] [CrossRef] [PubMed]
- Endo, Y.; Kumamoto, H.; Nakamura, M.; Sugawara, S.; Takan o-Yamamoto, T.; Sasaki, K.; Takahashi, K. Underlying mechanisms and therapeutic strategies for bisphosphonate-related osteonecrosis of the jaw (BRONJ). Biol. Pharm. Bull. 2017, 40, 739–750. [Google Scholar] [CrossRef] [PubMed]
- Borer, K.T. Physical activity in the prevention and amelioration of osteoporosis in women. Interaction of mechanical, hormonal and dietary factors. Sports Med. 2005, 35, 779–830. [Google Scholar] [CrossRef] [PubMed]
- Wolff, I.; van Croonenborg, J.; Kemper, H.C.G.; Kostense, P.J.; Twisk, J.W. The effect of exercise training program on bone mass. A meta-analysis of published controlled trials in pre-and postmenopausal women. Osteoporos. Int. 1999, 9, 1–12. [Google Scholar] [CrossRef]
- Rubin, C.; Recker, R.; Cullen, D.; Ryaby, J.; McCabe, J.; McLeod, K. Prevention of postmenopausal bone loss by a low-magnitude, high-frequency mechanical stimuli: A clinical trial assessing compliance, efficacy, and safety. J. Bone Miner. Res. 2004, 19, 343–351. [Google Scholar] [CrossRef]
- Verschueren, S.M.; Roelants, M.; Delecluse, C.; Swinnen, S.; Vanderschueren, D.; Boonen, S. Effect of 6-month whole-body vibration training on hip density, muscle strength, and postural control in postmenopausal women: A randomized controlled pilot study. J. Bone Miner. Res. 2004, 19, 352–359. [Google Scholar] [CrossRef]
- Sievänen, H.; Zagorski, P.; Drozdzowska, B.; Vähä-Ypyä, H.; Boron, D.; Adamczyk, P.; Pluskiewicz, W. Alpine skiing is associated with higher femoral neck bone mineral density. J. Musculoskelet. Neuronal Interact. 2015, 15, 264–269. [Google Scholar]
- Mul, J.D.; Stanford, K.I.; Hirshman, M.F.; Goodyear, L.J. Exercise and regulation of carbohydrate metabolism. Prog. Mol. Biol. Transl. Sci. 2015, 135, 17–37. [Google Scholar] [CrossRef] [PubMed]
- Holst, J.J.; Hartmann, B.; Gottschalck, I.B.; Jeppesen, P.B.; Miholic, J.; Henriksen, D.B. Bone resorption is decreased postprandially by intestinal factors and glucagon-like peptide 2 is a possible candidate. Scand. J. Gastroenterol. 2007, 42, 814–820. [Google Scholar] [CrossRef] [PubMed]
- Gottschall, J.S.; Kram, R. Ground reaction forces during downhill and uphill running. J. Biomech. 2005, 38, 445–452. [Google Scholar] [CrossRef] [PubMed]
- Borer, K.T.; Fogleman, K.; Gross, M.; LaNew, J.M.; Dengel, D. Walking intensity for postmenopausal bone mineral preservation and accrual. Bone 2007, 41, 713–721. [Google Scholar] [CrossRef] [PubMed]
- Turner, C.H.; Robling, A.G. Designing exercise regimens to increase bone strength. Exerc. Sports Sci. Rev. 2003, 31, 45–50. [Google Scholar] [CrossRef]
- Rubin, C.T.; Lanyon, L.E. Regulation of bone formation by applied dynamic loads. J. Bone Jt. Surg. 1984, 66, 397–402. [Google Scholar] [CrossRef]
- Robling, A.G.; Burr, D.B.; Turner, C.H. Recovery periods restore mechanosensitivity to dynamically loaded bone. J. Exp. Biol. 2001, 204 Pt 19, 3389–3399. [Google Scholar]
- Seeman, E.; Delmas, P.D. Reconstructing the skeleton with intermittent parathyroid hormone. Trends Endocrinol. Metab. 2001, 12, 281–283. [Google Scholar] [CrossRef]
- Gardinier, J.D.; Al-Omaishi, S.; Morris, M.D.; Kohn, D.H. PTH signaling mediates perilacunar remodeling during exercise. Matrix Biol. 2016, 52–54, 162–175. [Google Scholar] [CrossRef]
- Scott, J.P.; Sale, C.; Greeves, J.P.; Casey, A.; Dutton, J.; Fraser, W.D. The role of exercise intensity in the bone metabolic response to an acute bout of weight-bearing exercise. J. Appl. Physiol. 2011, 110, 423–432. [Google Scholar] [CrossRef]
- Shea, K.L.; Barry, D.W.; Sherk, V.D.; Hansen, K.C.; Wolfe, P.; Kohrt, W.M. Calcium supplementation and parathyroid hormone response to vigorous walking in postmenopausal women. Med. Sci. Sports Exerc. 2014, 46, 2007–2013. [Google Scholar] [CrossRef] [PubMed]
- Lindsay, R.; Krege, J.H.; Marin, F.; Jin, L.; Stepan, J.J. Teriparatide for osteoporosis: Importance of the full course. Osteoporos. Int. 2016, 27, 2395–2410. [Google Scholar] [CrossRef] [PubMed]
- Burke, H.M.; Davis, M.C.; Otte, C.; Mohr, D.C. Depression and cortisol responses to psychological stress: A meta-analysis. Psychoneuroendocrinology 2005, 30, 846–856. [Google Scholar] [CrossRef] [PubMed]
- Komori, T. Glucocorticoid signaling and bone biology. Horm. Metab. Res. 2016, 48, 755–763. [Google Scholar] [CrossRef] [PubMed]
- Caumo, A.; Bergman, R.N.; Cobelli, C. Insulin sensitivity from meal tolerance tests in normal subjects: A minimal model index. J. Clin. Endocrinol. Metab. 2000, 85, 4396–4402. [Google Scholar] [CrossRef] [PubMed]
- Williams, N. The Borg Rating of Perceived Exertion (RPE) scale. Occup. Med. 2017, 67, 404–405. [Google Scholar] [CrossRef]
- Matthews, D.R.; Hosker, J.P.; Rudenski, A.S.; Naylor, B.A.; Treacher, D.F.; Turner, R.C. Homeostasis model assessment: Insulin resistance and beta-cell function from fasting plasma glucose and insulin concentrations in man. Diabetologia 1985, 28, 412–419. [Google Scholar] [CrossRef]
- Aloulou, I.; Brun, J.-F.; Mercier, J. Evaluation of insulin sensitivity and glucose effectiveness during a standardized breakfast test: Comparison with the minimal model analysis of an intravenous glucose tolerance test. Metabolism 2006, 55, 676–690. [Google Scholar] [CrossRef]
- Follenius, M.; Brandenberger, G.; Hietter, B. Diurnal cortisol peaks and their relationship to meals. J. Clin. Endocrinol. Metab. 1982, 55, 757–761. [Google Scholar] [CrossRef]
- Stimson, R.H.; Mohd-Shukri, N.A.; Bolton, J.L.; Andrew, R.; Reynolds, R.M.; Walker, B.R. The postprandial rise in plasma cortisol in men is mediated by macronutrient-specific stimulation of adrenal and extra-adrenal cortisol production. J. Clin. Endocrinol. Metab. 2014, 99, 160–168. [Google Scholar] [CrossRef]
- Khani, S.; Tayek, J.J. Cortisol increases gluconeogenesis in humans: Its role in the metabolic syndrome. Clin. Sci. 2001, 101, 739–747. [Google Scholar] [CrossRef] [PubMed]
- Brandenberger, G.; Follenius, M.; Hietter, B. Feedback from meal-related peaks determines diurnal changes in cortisol response to exercise. J. Clin. Endocrinol. Metab. 1982, 54, 592–596. [Google Scholar] [CrossRef] [PubMed]
- Dixit, V.; Tripathi, R.L.; Dhanwal, D.K. All 25-hydroxyvitamin D-deficient Insian postmenopausal women do not have secondary hyperparathyroidism. Arch. Osteoporos 2018, 13, 62. [Google Scholar] [CrossRef] [PubMed]


| Variable | UAM vs UBM | UAM vs DBM | UAM vs SED | DAM vs UBM | DAM vs DBM | DAM vs SED |
|---|---|---|---|---|---|---|
| Insulin AUCs, combined | t = 11.86, p ≤ 0.0001 | t = 14.68, p ≤ 0.0001 | t = 11.69, p ≤ 0.0001 | t = 6.25, p ≤ 0.0001 | t = 9.07, p ≤ 0.0001 | t = 6.08, p ≤ 0.0001 |
| Insulin AUCs, AM | t = 9.43, p ≤ 0.0001 | t = 9.80, p ≤ 0.0001 | t = 10.75, p ≤ 0.0001 | t = 4.76, p=0.0006 | t = 5.13, p = 0.0003 | t = 6.09, p ≤ 0.0001 |
| Insulin AUCs, PM | t = 8.25, p ≤ 0.0001 | t = 12.87, p ≤ 0.0001 | t = 6.08, p ≤ 0.0001 | t = 4.68, p=0.0007 | t = 9.30, p ≤ 0.0001 | t = 2.51, p = 0.029 |
| HOMA-IR AUCs, combined | t = 20.91, p ≤ 0.0001 | t = 22.12, p ≤ 0.0001 | t = 20.52, p ≤ 0.0001 | t = 10.49, p ≤ 0.0001 | t = 11.42, p ≤ 0.0001 | t = 9.97, p ≤ 0.0001 |
| HOMA-IR AUCs, AM | t = 9.54, p ≤ 0.0001 | t = 15.22, p ≤ 0.0001 | t = 11.02, p ≤ 0.0001 | t = 3.72, p = 0.0034 | t = 9.40, p ≤ 0.0001 | t = 5.20, p = 0.0003 |
| HOMA-IR AUCs, PM | t = 8.54, p ≤ 0.0001 | t = 13.78, p ≤ 0.0001 | t = 6.04, p ≤ 0.0001 | t = 5.73, p = 0.0001 | t = 10.66, p ≤ 0.0001 | t = 3.12, p = 0.0098 |
© 2019 by the authors. Licensee MDPI, Basel, Switzerland. This article is an open access article distributed under the terms and conditions of the Creative Commons Attribution (CC BY) license (http://creativecommons.org/licenses/by/4.0/).
Share and Cite
Borer, K.T.; Zheng, Q.; Jafari, A.; Javadi, S.; Kernozek, T. Nutrient Intake Prior to Exercise Is Necessary for Increased Osteogenic Marker Response in Diabetic Postmenopausal Women. Nutrients 2019, 11, 1494. https://doi.org/10.3390/nu11071494
Borer KT, Zheng Q, Jafari A, Javadi S, Kernozek T. Nutrient Intake Prior to Exercise Is Necessary for Increased Osteogenic Marker Response in Diabetic Postmenopausal Women. Nutrients. 2019; 11(7):1494. https://doi.org/10.3390/nu11071494
Chicago/Turabian StyleBorer, Katarina T., Qingyun Zheng, Akram Jafari, Saba Javadi, and Thomas Kernozek. 2019. "Nutrient Intake Prior to Exercise Is Necessary for Increased Osteogenic Marker Response in Diabetic Postmenopausal Women" Nutrients 11, no. 7: 1494. https://doi.org/10.3390/nu11071494
APA StyleBorer, K. T., Zheng, Q., Jafari, A., Javadi, S., & Kernozek, T. (2019). Nutrient Intake Prior to Exercise Is Necessary for Increased Osteogenic Marker Response in Diabetic Postmenopausal Women. Nutrients, 11(7), 1494. https://doi.org/10.3390/nu11071494