Article

Association between Postpartum Nutritional Status and Postpartum Depression Symptoms

1
Department of Obstetrics and Gynecology, Shin-Kong Wu Ho-Su Memorial Hospital, Taipei 11101, Taiwan
2
School of Medicine, Fu-Jen Catholic University, New Taipei City 24205, Taiwan
3
Department of Obstetrics and Gynecology, Taipei Medical University, Taipei 11031, Taiwan
4
Department of Obstetrics and Gynecology, National Taiwan University Hospital, Taipei 10041, Taiwan
5
Department of Food Science, Nutrition, and Nutraceutical Biotechnology, Shih Chien University, Taipei 10462, Taiwan
6
Physiology, College of Medicine, National Taiwan University, Taipei 10051, Taiwan
7
Department of Pediatrics, Shin-Kong Wu Ho-Su Memorial Hospital, Taipei 11101, Taiwan
8
School of Nutrition and Health Sciences, College of Nutrition, Taipei Medical University, 250 Wu-Hsing Street, Taipei 11031, Taiwan
*
Author to whom correspondence should be addressed.
Current address: No. 95, Wen Chang Road, Shih Lin District, Taipei City 111, Taiwan.
These authors contributed equally to this work.
Nutrients 2019, 11(6), 1204; https://doi.org/10.3390/nu11061204
Submission received: 5 May 2019 / Revised: 21 May 2019 / Accepted: 23 May 2019 / Published: 28 May 2019
(This article belongs to the Special Issue Nutritional Biomarkers in Health and Disease)

Abstract

:
Taiwanese women may practice traditional confinement after childbirth, and no study has investigated the nutritional status and the effects of postpartum depression on such women. The aim of this study was to investigate the association between nutritional status and postpartum depression at 6–8 weeks postpartum. A cross-sectional study was conducted on postpartum women who returned to the obstetrics and gynecology clinic for routine examination from January 2016 to September 2017. A total of 344 women received assessments based on the Edinburgh Postnatal Depression Scale (EPDS). An EPDS score of ≥10 indicated the presence of postpartum depressive symptoms (PPDS). A total of 97 women without such symptoms and 23 with PPDS completed nutritional parameter analyses and questionnaires. The results showed that the prevalence of postpartum depression (PPD) was 8.4%. The proportion was 70% for those who practiced confinement at home, significantly higher than for those in the non-PPDS group (45%). The overall psychological stress score was significantly higher and the postpartum care satisfaction score was significantly lower in those with PPDS compared to those without. In terms of nutritional biomarkers, the plasma riboflavin levels in the PPDS group were significantly lower than those in their symptomless counterparts (13.9%). The vitamin D insufficiency and deficiency rates in the non-PPD and PPDS groups were 35%, 41%, 48%, 26%, respectively. However, compared with those in the non-PPDS group, those with PPDS had significantly higher ratios of Σn-6/Σn-3, C20:3n-6/C18:3n-6, and C20:4n-6/(C20:5n-3 + C22:6n-3) (by 8.2%, 79.7%, and 8.8%, respectively), whereas they had lower ratios of C22:6n-3/C22:5n-6 (by 15.5%). Higher plasma riboflavin and erythrocyte C16:1n-9, C24:1n-9, C18:3n-6, and C20:5n-3 levels and lower Σn-6 fatty acid and C22:5n-6 levels decreased the risk of PPD after type of confinement, overall mental stress scores, and postpartum care satisfaction scores were adjusted for the logistic regression analysis. In conclusion, the plasma riboflavin level and erythrocyte fatty acid composition are potentially major contributors to PPD development.

Graphical Abstract

1. Introduction

Postpartum depression (PPD) is a debilitating mental disorder with a prevalence of between 3.5% and 63.3% in Asian countries [1]. An international study exploring levels of PPD showed European and Australian women had the lowest levels of PPDS, women in the USA fell at the midpoint, and women in Asia and South America had the highest depressive symptom scores [2]. The national prevalence of minor/major and major PPDS was found to be 8.46% and 8.69%, respectively among Canadian women [3]. PPD in women can manifest as sleep disorder, mood swings, sadness and crying, fear of injury, loss of appetite, serious concerns about their child, a lack of interest in daily activities, and even suicide and death [4]. The risk factors of PPD are complicated; they include psychiatric (e.g., a previous history of depression and anxiety), obstetric (e.g., postpartum complications), biological (e.g., young age, glucose metabolism disorders), hormonal (e.g., oxytocin and estrogen imbalances), social (e.g., a lack of familial support or financial support), and lifestyle (e.g., food intake patterns, sleep status, exercise, and physical activity) factors [5,6,7,8,9,10].
The Edinburgh Postnatal Depression Scale (EPDS) is the most commonly used screening scale for PPD symptoms (PPDS) because it is reliable, has been sufficiently validated, and is often more practical and cost-effective than other methods for the comprehensive screening of PPD risks [11]. The Chinese version of the EPDS has appropriate reliability and validity for screening for PPD among Taiwanese women [12]. The prevalence of PPD screened using the EPDS in Taiwan was 21%, 42%, and 39% in 2004, 2007, and 2013, respectively [13,14,15]. The results of these studies also indicated that cesarean section, postpartum complications, a previous history of depression, unplanned pregnancy, low income, and a lack of familial support increase PPDS risk.
Recent evidence from studies has shown that malnutrition also contributes to PPD development, including deficiencies in n-3 polyunsaturated fatty acids (PUFA), B vitamins, vitamin D, and trace minerals [16]. Taiwan has a traditional custom involving the confinement of the mother after childbirth. During this period, mothers are supposed to eat nutritious foods and herbs to aid their recovery. The relationship between the nutritional status of postpartum women in confinement and postpartum depression has never been investigated. Thus, this study investigated the association between nutritional status and postpartum depressive symptoms at 6–8 weeks postpartum.

2. Participants and Methods

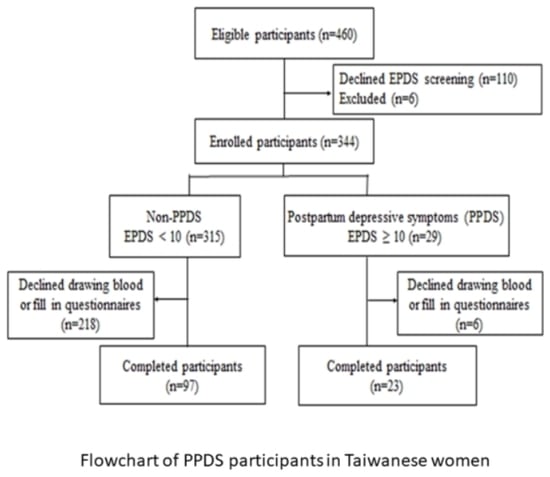
2.1. Study Participants

A cross-sectional study was conducted on postpartum women who returned to the obstetrics and gynecology clinic of Shin Kong Wu Ho-Su Memorial Hospital for a routine postpartum examination and who met the inclusion criteria. They were recruited from January 2016 to September 2017. The inclusion criteria for the participants were postpartum women (6–8 weeks) who were healthy and without diseases, did not smoke or drink alcohol, and who had infants born at term who were not diagnosed with any diseases. Any participant with a congenital disease (e.g., thalassemia, thyroid abnormality, and diabetes), multiple births, a premature birth, an acute infection (e.g., a cold, mastitis) or who had ever been diagnosed with a mental disorder (including schizophrenia, depression, and bipolar disorder) were excluded.
The Ethics Committee of Shin Kong Wu Ho-Su Memorial Hospital approved this study according to the International Organizations of Medical "International Ethical Guidelines for Biomedical Research Involving Human Subjects” and the ethical principles of the Declaration of Helsinki (20150810R). We obtained written informed consent from the participants before the study procedures were performed.

2.2. PPDS Screening and Questionnaires

PPDS screening in this study was conducted using the Chinese version of the EPDS, which has good reliability and validity and is widely used in Taiwan [12]. A total of 344 women received EPDS assessments; an EPDS score of ≥10 was defined as the presence of PPDS and an EPDS score of <10 indicated no PPSS. In addition, participants were asked to answer a questionnaire designed to obtain the following sociodemographic information: age, education level, occupation, parity, baby’s sex, type of delivery, baby’s main caregiver, breastfeeding status, perinatal and lactation nutritional supplements, type of postpartum confinement, self-perceived psychological stress, and postpartum care satisfaction scores. The self-perceived psychological stress item consisted of seven yes-or-no questions (no = 0, yes = 1), with all scores added to obtain the overall stress score. Postpartum care satisfaction was assessed by using a visual analog scale (VAS). The VAS was altered to a numeric scale from 0 to 10. Pre-pregnancy body weight (kg) and gestational weight gain (kg) were determined from self-reported data; current body weight (kg), and height (m) were measured with an electronic health scale (WB-380H, TANITA, Japan).

2.3. Blood Sample Collections

Blood samples (6 mL) were collected from a vein of one arm into vacutainers with and without anticoagulant (EDTA) by a trained technician. The serum was collected after centrifugation at 1400 g for 10 min at 4 °C. Half of the aliquot was stored at −80 °C for vitamin analysis and the other half kept at 4 °C and immediately sent to Zhong-yi Medical Laboratory for analysis. After the plasma and buffy coat layer were removed, the remaining red blood cells (RBCs) were washed three times with normal saline (0.9% NaCl) that was approximately twice the volume of the RBCs and stored at −80 °C for RBC fatty acid analysis.

2.4. Biochemical Analyses

The complete blood count was determined using a hematology analyzer (XN10, Xysmex, Japan), and serum 25-hydroxyvitamin D [25(OH)D] and ferritin levels were determined using an electrochemiluminescence immunoassay (Roche Cobas 6000, Switzerland); the interday coefficients of variation (CVs) were 8.64%, 3.97%, and 2.25%, respectively. Plasma α-tocopherol and retinol levels were determined using a reverse-phase high performance liquid chromatography (HPLC) method according to Bieri et al. [17]. Briefly, α-tocopherol and retinol in plasma were extracted with hexane and then quantified using an HPLC system (Hitachi, Japan) equipped with a LiChroCART C-18 column (4 × 250 nm2, 4 μm; Perkin-Elmer, West Lafayette, IN, USA) and a UV/VIS detector (Hitachi, Japan). The concentration of plasma α-tocopherol and retinol was calculated with the assistance of a standard curve constructed using pure α-tocopherol and retinol (Sigma-Aldrich); the intraday CVs were 3.3% and 3.1%, and the interday CVs were 10.6% and 11.7%, respectively. Plasma riboflavin was assessed using an LSBio vitamin B2/riboflavin enzyme-linked immunosorbent assay (ELISA) kit (Lifespan Biosciences, Seattle, WA, USA); the intraday CV was 6% and the interday CV was 13.7%.

2.5. Erythrocyte Fatty Acid Profiles Analysis

Aliquots of 200 μL of RBC suspension were pipetted into a Teflon-sealable Sovirel tube containing 3 mL of methanol/chloroform (2:1 v/v) and 100 μL of 13:0 internal standard that was filled with nitrogen gas to avoid fatty acid (FA) oxidation. After these were mixed and left to react for 4 hours at 4 °C, chloroform and 0.7% NaCl were added. The lower phase was aspirated and dried under nitrogen flow and then mixed with methanol/dichloromethane (3:1 v/v) and acetyl chloride to prepare FA methyl esters (FAMEs). FAMEs were extracted by hexane and analyzed on an Agilent Technologies 7820A gas chromatograph using flame ionization detection. The FA peaks were identified from external standard runs through the comparison of the retention times with those of an authentic standard mixture of 68A (Nu-Chek Prep, Elysian, MN, USA), 37 FAME, PUFA2, and PUFA3 (all from SUPELCO, Bellefonte, PA, USA). The FA composition of each lipid was expressed with the weight of that lipid as a percentage of the total weight of the carbon 12 to carbon 22 FAs (wt %).

2.6. Statistical Analysis

Data are presented as means ± standard deviations (SDs) or as a percentage. Our data were confirmed to have a normal distribution by using a Kolmogorov–Smirnov test. Between-group analyses were conducted using a Student’s t test or a Pearson’s chi-squared test. Correlations were made using a multivariable logistic regression to assess the associations between nutritional biomarkers and PPDS risk. All data analyses were performed using SPSS version 19 (SPSS Inc., Chicago, IL, USA). Differences were considered significant at p < 0.05.

3. Results

3.1. Participant Characteristics

A total of 460 women were eligible for this study. EPDS screening was administered in 344 women after six were excluded for having multiple births and 110 declined to participate. A total of 315 women were without symptoms (EPDS score < 10), and the remaining 29 were deemed to have PPSD (EPDS score ≥ 10), resulting in a prevalence of 8.4%. Blood samples and completed questionnaires of 120 participants (97 with and 23 without PPDS) were obtained (Figure 1).
The characteristics of the participants are listed in Table 1, which provides proportions and means. The general demographic information for the two groups (with and without PPDS) was comparable. No significant differences were noted in pre-pregnancy body mass index (BMI), gestational weight gain, current BMI, years of education, occupation, parity, baby’s sex, type of delivery, baby’s caregiver, breastfeeding, and nutritional supplements during the perinatal and lactation periods. Overall, 70% of the participants in the PPDS group practiced confinement at home, a significantly larger proportion than those who did in the non-PPDS group (45%). The PPDS group also had more self-perceived psychological stress, especially in terms of ability to care for the baby and support from the baby’s father and their families. The overall psychological stress and postpartum care satisfaction scores of the PPDS group were significantly higher and lower, respectively, compared with those of the women in the non-PPDS group.

3.2. Biochemical Analyses

The nutritional biomarkers of the postpartum women are shown in Table 2. No significant differences were noted in average of HGB (hemoglobin), ferritin, 25(OH)D3, retinol, and α-tocopherol between the two groups, except for riboflavin. The plasma riboflavin level in the PPDS group was significantly lower than in the non-PPDS group (by 13.9%). Vitamin D insufficiency and deficiency were defined as serum 25 (OH)D3 levels of <30 ng/mL and <20 ng/mL, respectively [18]. The average concentrations of 25 (OH)D3 in the two groups were insufficient. We noted that postpartum women generally had insufficient vitamin D status, and the vitamin D insufficiency and deficiency rates in the non-PPDS and PPDS women were 35%, 41%, 48%, and 26%, respectively.
Erythrocyte FA compositions are shown in Table 3. Our data indicate that total saturated FAs, monounsaturated FAs (MUFAs), and n-6 PUFAs were not significantly different between the two groups, except for n-3 PUFAs. The PPDS group had significantly lower total n-3 PUFA levels, especially C20:5n-3 (eicosapentaenoic acid, EPA), and C22:6n-3 (docosahexaenoic acid, DHA), which decreased by 16.8% and 4.5%, respectively. Moreover, women with PPDS had significantly lower C16:1n-9, C24:1n-9, and C18:3n-6 levels and higher C20:3n-6 (dihomo-γ-linolenic acid, DGLA) and C22:5n-6 (n-6 docosapentaenoic acid, n-6DPA) levels. Furthermore, compared with the values of the non-PPDs group, the PPDS group had significantly elevated ratios of Σn-6/Σn-3, C20:3n-6/C18:3n-6, and C20:4n-6/(C20:5n-3 + C22:6n-3) by 8.2%, 79.7%, and 8.8%, respectively, whereas they had a decreased ratio of C22:6n-3/C22:5n-6 by 15.5%.

3.3. Association of Nutritional Biomarkers with Postpartum Depression

Correlations between nutritional biomarkers and PPDS are shown in Table 4. We fit two multivariate models to the data. In Model 1, no covariates were adjusted, and in Model 2, the type of postpartum confinement, overall psychological stress scores, and postpartum care satisfaction scores were adjusted. The data revealed that the plasma riboflavin level was associated with a decreased risk of having PPDS (odds ratio [OR]: 0.747; 95% CI: 0.566–0.987; p = 0.040). A similar trend was noted after covariates were adjusted (OR: 0.684; 95% CI: 0.504–0.930; p = 0.015). By contrast, no significant associations were observed between PPDS and serum 25(OH)D3, retinol, and α-tocopherol levels (all p > 0.05).
The associations between PPDS and erythrocytes FA composition are shown in Table 5. The data indicate that the total MUFA levels significantly decreased PPDS risk, whereas n-6 PUFA levels increased the risk after the covariates were adjusted. In terms of the MUFA profiles, C16:1n-9 and C24:1n-9 levels had a negative correlation with PPDS (OR = 0.504, 95% CI = 0.314–0.808, p = 0.004 and OR = 0.967, 95% CI = 0.943–0.990, p = 0.006, respectively). In terms of the n-6 PUFA profiles, more long-chain FA C22:5n-6 contributed to an increased PPDS risk (OR = 1.044, 95% CI = 1.001–1.089, p = 0.045), whereas C18:3n-6 reduced the risk of PPDS after covariates were adjusted (OR = 0.630, 95% CI = 0.472–0.842, p = 0.002). We found that total n-3 PUFAs significantly decreased PPDS risk, but no significant difference was observed after the covariates were adjusted. Regardless of whether the covariates were adjusted, the C20:5n-3 level and ratio of C22:6n-3/C22:5n-6 significantly reduced the risk of PPDS, whereas the ratio of C20:3n-6/C18:3n-6 and C20:4n-6/(C20:5n-3 + C22:6n-3) significantly increased said risk.

4. Discussion

In total, 120 participants submitted complete data, and 23 of those had PPDS. Although the number of patients in the non-PPDs group was four times higher than in the PPDS group, the data were confirmed to have a normal distribution by using the Kolmogorov–Smirnov test. Therefore, the sample was representative.
The prevalence of patients with PPD screened by the EPDS in Taiwan was found to be 21%, 42%, and 39% in 2004, 2007, and 2013, respectively [13,14,15]. The incidence of PPDS in this study was thus significantly lower than in these past surveys. We speculate that this reduction could be related to a policy implemented by the National Health Agency. Since 2011, this agency has provided information during pregnancy to women via a maternal health handbook, and the agency has strengthened the implementation of postpartum depression screening and referral services through the provision of health care resource information during pregnancy checkups.
We found the practice of confinement in postpartum care centers by the non-PPDS group was as high as 55%, compared with 30% in the PPDS group. The non-PPDS group also exhibited lower levels of self-perceived mental stress, higher postpartum care satisfaction scores, and lower PPDS prevalence (12% vs. 27%; p = 0.045). We speculate that women might obtain more rest and have reduced anxiety when they practice confinement in a postpartum care center due to the presence of professional care personnel to help them care for their babies and provide postpartum maternal care.
Few studies have investigated the relationship between vitamin B2 levels and PPD. Miyake et al. investigated the association between the dietary intake of B vitamins and PPD occurrence in a prospective cohort of 865 women. Only an inverse association was identified between vitamin B2 intake and PPD [19]. Based on the Nutrition and Health Surveys in Taiwan, the prevalence rates of normal and marginally deficient statuses for riboflavin were 71.6% and 21.3%, respectively. Among age strata, women aged 19–30 years and 31–50 years had a higher prevalence in terms of having a deficient or marginally deficient status than other age strata [20]. Although no data were available on the riboflavin status of women in the perinatal and postpartum stages, according to the aforementioned surveys, women of childbearing age seem to have poor vitamin B2 nutritional status in Taiwan. Our data are the first to reveal the negative correlation between plasma riboflavin levels and PPDS in Taiwan. Future nutritional educational policies should encourage the consumption of vitamin B2-rich foods in pregnant and postpartum women, which may help to reduce the incidence of PPDS.
Numerous studies have demonstrated that vitamin D deficiency during pregnancy and the postpartum stage increases the risk of PPD [21,22,23,24]. However, this was not evident in our study results. Our results indicate that the ratio of vitamin D insufficiency and deficiency was high in both groups. Thus, we posit that the vitamin D status in these groups was not sufficient to produce a protective effect. Ethnically Chinese people have a tradition of confinement after childbirth. During confinement, women are provided with nutritious foods, including stewed chicken, fish soup, and fried eggs. We speculate that the reasons for the poor vitamin D nutritional status of these participants may be as follows: (1) They had a poor vitamin D nutritional status during prenatal and perinatal periods. We did not investigate the nutritional status of vitamin D before or during pregnancy. Some studies have shown that women of childbearing age have poor vitamin D status in Taiwan. Li et al. investigated the vitamin D status of 3954 individuals without chronic kidney disease aged ≥30 years in northern Taiwan. Their results indicated that the mean 25(OH)D3 concentration was 28.94 ± 10.27 ng/mL, and the prevalence of vitamin D deficiency was highest in participants aged 30 to 39 years (38.4%) [25]. Our data agree with their results. (2) They unintentionally reduced the synthesis of vitamin D in their skin by reducing their exposure to sunlight. Traditionally, women in confinement cannot go outdoors, which may reduce exposure to the sun, thus worsening vitamin D status. Therefore, we suggest that if women are to follow the tradition of confinement, vitamin D supplementation may be required.
Early observational studies have consistently demonstrated that serum and dietary n-3 PUFA levels are low in patients with depression [26]. Recent studies have also indicated that decreased serum EPA and DHA concentrations in postpartum women were correlated with a higher PPD in China [27,28]. Our results show that the EPA concentration in women with PPDS was significantly lower than in those without PPDS. Logistic regression also revealed that reduced EPA concentrations increase the risk of postpartum depression. The mechanism of n-3 polyunsaturated FAs might decrease the prevalence and improve the symptoms of depression by limiting the production of proinflammatory eicosanoids and cytokines and regulating the production, function and metabolism of serotoninergic neurotransmitters [29,30]. Bove et al. showed that cortical serotonin concentrations were significantly lower in animals pre- and post-natal fed with n-3 PUFA deficient diet, which lead to impairments in neurochemical parameters. Furthermore, n-3 PUFA might influence serotonin neurotransmission acting through the inflammatory pathways [31]. In particular, it has been reported that low n-3 PUFA intake in diets is correlated with the development of depressive and anxiety-like symptoms [32]. The fish oil treatment significantly attenuated the decrease of serotonin levels in brain areas induced by lipopolysaccharide [33]. Therefore, whether the higher n-3 PUFA content contributes to PPD in clinical improvement warrants further research.
Lotrich et al. demonstrated that higher plasma DGLA (C20:3n-6,) levels and the ratio of arachidonic acid (C20:4n-6, AA) divided by EPA + DHA were associated with subsequent depression [34]. Mamalakis et al. investigated the relationship between adipose tissue FA profiles and depression. Their results showed that Beck Depression Inventory scores correlated positively with the adipose tissue C20:3n-6/C18:3n-6 ratio. [35] The higher ratios of AA /(EPA + DHA) and C20:3n-6/C18:3n-6 indicate that the body tends to activate the cyclo-oxygenase (COX) inflammation pathway. The COX pathway converts the body’s primary n-6 PUFA, and arachidonic acid to proinflammatory cytokines such as prostaglandins and prostacyclins. Therefore, we speculate that the PPDS group had a higher Σn-6/Σn-3 ratio, which promoted long-chain n-6 FA synthesis and the production of proinflammatory eicosanoids, thus increasing PPDS. Otto et al. conducted an observational study and demonstrated that functional DHA status, expressed as the ratio of DHA/n-6DPA, was significantly lower in a possibly depressed group compared with a non-depressed group [36]. Our data show that the PPDS group significantly elevated C22:5n-6 levels and reduced the ratio of C22:6n-3 (DHA)/C22:5n-6 (n-6DPA) compared with the non-PPDS group. This result indicates that participants in the PPDS group might also increase depressive symptoms by decreasing functional DHA status.
In this study, notably, we found that C16:1n-9 (palmitoleic acid) and C24:1n-9 (nervonic acid) levels were significantly lower in the PPDS group. No study has explored the relationship between these two FAs and depression, except for one that found a significant decrease in nervonic acid levels in patients with recent-onset schizophrenia [37]. More research is required in the future to clarify its role in PPD.
The strength of the present work is that it is the first to investigate the relationship between postpartum nutrition status and PPDS in Taiwan. The results can serve as a reference for nutrition policymakers. However, the study had some limitations. First, this was a cross-sectional study that was unable to clarify the effects of longitudinal nutritional status on PPD development. Second, the sample size was relatively small, and all participants lived in northern Taiwan, which might limit the generalizability of the results. Therefore, further large-sample, multicenter studies are required. Third, we only prioritized examining several nutrients that Taiwanese women are more likely to be deficient in and are related to PPDS development. Studying the relationship of other nutrients and PPDS development is warranted.

5. Conclusions

Plasma vitamin B2 levels and erythrocyte FA composition might have a major effect on PPD development. Our results suggest that the moderate consumption of riboflavin and n-3 FA could have protective effects on PPDS.

Author Contributions

Conceptualization, S.-C.L., C.-M.C., and Y.-H.L.; methodology, all.; data curation; S.-C.M., M.-L.C., and P.-Y.C.; validation: C.-M.C., H.-M.S., S.-C.L., and M.-L.C.; drafting of the manuscript: S.-C.L.; critical revision of the manuscript: Y.-H.L. and C.-M.C.; final approval of the version to be published: S.-C.L.

Funding

This study was supported by Shin Kong Wu Ho-Su Memorial Hospital (SKH-8302-105-DR-14).

Acknowledgments

We thank the participants and medical staff for their participation. This manuscript was edited by Wallace Academic Editing.

Conflicts of Interest

The authors have no conflicts of interest to declare.

References

  1. Klainin, P.; Arthur, D.G. Postpartum depression in Asian cultures: A literature review. Int. J. Nurs. Stud. 2009, 46, 1355–1373. [Google Scholar] [CrossRef]
  2. Affonso, D.D.; De, A.K.; Horowitz, J.A.; Mayberry, L.J. An international study exploring levels of postpartum depressive symptomatology. J. Psychosom. Res. 2000, 49, 207–216. [Google Scholar] [CrossRef]
  3. Lanes, A.; Kuk, J.L.; Tamim, H. Prevalence and characteristics of postpartum depression symptomatology among Canadian women: A cross-sectional study. BMC Public Health 2011, 11, 302. [Google Scholar] [CrossRef] [PubMed]
  4. Norhayati, M.N.; Hazlina, N.H.; Asrenee, A.R.; Emilin, W.M. Magnitude and risk factors for postpartum symptoms: A literature review. J. Affect. Disord. 2015, 175, 34–52. [Google Scholar] [CrossRef] [Green Version]
  5. Lancaster, C.A.; Gold, K.J.; Flynn, H.A.; Yoo, H.; Marcus, S.M.; Davis, M.M. Risk factors for depressive symptoms during pregnancy: A systematic review. Am. J. Obs. Gynecol. 2010, 202, 5–14. [Google Scholar] [CrossRef]
  6. Feng, Z.; Jones, K.; Wang, W.W. An exploratory discrete-time multilevel analysis of the effect of social support on the survival of elderly people in China. Soc. Sci. Med. 2015, 130, 181–189. [Google Scholar] [CrossRef] [PubMed] [Green Version]
  7. Chatzi, L.; Melaki, V.; Sarri, K.; Apostolaki, I.; Roumeliotaki, T.; Georgiou, V.; Vassilaki, M.; Koutis, A.; Bitsios, P.; Kogevinas, M. Dietary patterns during pregnancy and the risk of postpartum depression: The mother-child ‘Rhea’ cohort in Crete, Greece. Public Health Nutr. 2011, 14, 1663–1670. [Google Scholar] [CrossRef]
  8. Gaillard, A.; Le Strat, Y.; Mandelbrot, L.; Keita, H.; Dubertret, C. Predictors of postpartum depression: Prospective study of 264 women followed during pregnancy and postpartum. Psychiatr. Res. 2014, 215, 341–346. [Google Scholar] [CrossRef]
  9. Huang, T.; Rifas-Shiman, S.L.; Ertel, K.A.; Rich-Edwards, J.; Kleinman, K.; Gillman, M.W.; Oken, E.; James-Todd, T. Pregnancy Hyperglycaemia and Risk of Prenatal and Postpartum Depressive Symptoms. Paediatr. Perinat. Epidemiol. 2015, 29, 281–289. [Google Scholar] [CrossRef] [Green Version]
  10. Douma, S.L.; Husband, C.; O’Donnell, M.E.; Barwin, B.N.; Woodend, A.K. Estrogen-related mood disorders: Reproductive life cycle factors. Adv. Nurs. Sci. 2005, 28, 364–375. [Google Scholar] [CrossRef]
  11. Harris, B.; Huckle, P.; Thomas, R.; Johns, S.; Fung, H. The use of rating scales to identify post-natal depression. Br. J. Psychiatr. J. Ment. Sci. 1989, 154, 813–817. [Google Scholar] [CrossRef]
  12. Heh, S.-S. Validation of the Chinese version of the Edinburgh Postnatal Depression Scale: Detecting postnatal depression in Taiwanese women. Hu Li Yan Jiu Nurs. Res. 2001, 9, 105–113. [Google Scholar]
  13. Chen, C.M.; Kuo, S.F.; Chou, Y.H.; Chen, H.C. Postpartum Taiwanese women: Their postpartum depression, social support and health-promoting lifestyle profiles. J. Clin. Nurs. 2007, 16, 1550–1560. [Google Scholar] [CrossRef] [PubMed]
  14. Heh, S.-S.; Coombes, L.; Bartlett, H. The association between depressive symptoms and social support in Taiwanese women during the month. Int. J. Nurs. Stud. 2004, 41, 573–579. [Google Scholar] [CrossRef] [PubMed]
  15. Ho, C.-L.; Chang, L.-I.; Wan, K.-S. The relationships between postpartum adaptation and postpartum depression symptoms of first pregnancy mothers in Taiwan. Int. J. Psychiat. Med. 2013, 45, 1–13. [Google Scholar] [CrossRef] [PubMed]
  16. Ellsworth-Bowers, E.R.; Corwin, E.J. Nutrition and the psychoneuroimmunology of postpartum depression. Nutr. Res. Rev. 2012, 25, 180–192. [Google Scholar] [CrossRef] [PubMed]
  17. Bieri, J.G.; Tolliver, T.J.; Catignani, G.L. Simultaneous determination of alpha-tocopherol and retinol in plasma or red cells by high pressure liquid chromatography. Am. J. Clin. Nutr. 1979, 32, 2143–2149. [Google Scholar] [CrossRef] [PubMed]
  18. Forrest, K.Y.; Stuhldreher, W.L. Prevalence and correlates of vitamin D deficiency in US adults. Nutr. Res. 2011, 31, 48–54. [Google Scholar] [CrossRef] [PubMed]
  19. Miyake, Y.; Sasaki, S.; Tanaka, K.; Yokoyama, T.; Ohya, Y.; Fukushima, W.; Saito, K.; Ohfuji, S.; Kiyohara, C.; Hirota, Y. Dietary folate and vitamins B 12, B 6, and B 2 intake and the risk of postpartum depression in Japan: The Osaka Maternal and Child Health Study. J. Affect. Disord. 2006, 96, 133–138. [Google Scholar] [CrossRef]
  20. Yang, H.W.; Luo, F. 2005-2008 Nutrition and Health Survey in Taiwan (NAHSIT): Thiamin and riboflavin biochemical status and associated factors of 19-64 year old adults. Minist. Health Welf. 2011, 20, 309–318. [Google Scholar]
  21. Fu, C.W.; Liu, J.T.; Tu, W.J.; Yang, J.Q.; Cao, Y. Association between serum 25-hydroxyvitamin D levels measured 24 hours after delivery and postpartum depression. Int. J. Obs. Gynaecol. 2015, 122, 1688–1694. [Google Scholar] [CrossRef] [PubMed]
  22. Murphy, P.K.; Mueller, M.; Hulsey, T.C.; Ebeling, M.D.; Wagner, C.L. An exploratory study of postpartum depression and vitamin d. J. Am. Psychiatr. Nurses Assoc. 2010, 16, 170–177. [Google Scholar] [CrossRef] [PubMed]
  23. Gur, E.B.; Gokduman, A.; Turan, G.A.; Tatar, S.; Hepyilmaz, I.; Zengin, E.B.; Eskicioglu, F.; Guclu, S. Mid-pregnancy vitamin D levels and postpartum depression. Eur. J. Obs. Gynecol. Reprod. Biol. 2014, 179, 110–116. [Google Scholar] [CrossRef] [PubMed]
  24. Robinson, M.; Whitehouse, A.J.; Newnham, J.P.; Gorman, S.; Jacoby, P.; Holt, B.J.; Serralha, M.; Tearne, J.E.; Holt, P.G.; Hart, P.H. Low maternal serum vitamin D during pregnancy and the risk for postpartum depression symptoms. Arch. Women Ment. Health 2014, 17, 213–219. [Google Scholar] [CrossRef] [PubMed]
  25. Lee, M.J.; Hsu, H.J.; Wu, I.W.; Sun, C.Y.; Ting, M.K.; Lee, C.C. Vitamin D deficiency in northern Taiwan: A community-based cohort study. BMC Public Health 2019, 19, 337. [Google Scholar] [CrossRef] [PubMed]
  26. Liperoti, R.; Landi, F.; Fusco, O.; Bernabei, R.; Onder, G. Omega-3 polyunsaturated fatty acids and depression: A review of the evidence. Curr. Pharm. Des. 2009, 15, 4165–4172. [Google Scholar] [CrossRef] [PubMed]
  27. Li, L.; Ya, L.; Mannong, L.; Zhang, Q.; Wang, Z.; Duan, Y. Research of correlation between polyunsaturated fatty acids and postpartum depression. Int. J. Lab. Med. 2015, 6, 765–767. [Google Scholar]
  28. Su, H.; Sun, H.L.; Zhang, J.; Fan, W. Analysis of Correlation between Serum ω-3 Polyunsaturated Fatty Acids of Pregnant Women and Postpartum Depression. J. Kunming Med. Univ. 2014, 35, 138–144. [Google Scholar]
  29. Lu, D.-Y.; Tsao, Y.-Y.; Leung, Y.-M.; Su, K.-P. Docosahexaenoic acid suppresses neuroinflammatory responses and induces heme oxygenase-1 expression in BV-2 microglia: Implications of antidepressant effects for omega-3 fatty acids. Neuropsychopharmacology 2010, 35, 2238. [Google Scholar] [CrossRef]
  30. Su, K.-P. Biological Mechanism of Antidepressant Effect of Omega–3 Fatty Acids: How Does Fish Oil Act as a ‘Mind-Body Interface’? Neurosignals 2009, 17, 144–152. [Google Scholar] [CrossRef]
  31. Bove, M.; Mhillaj, E.; Tucci, P.; Giardino, I.; Schiavone, S.; Morgese, M.G.; Trabace, L. Effects of n-3 PUFA enriched and n-3 PUFA deficient diets in naïve and Aβ-treated female rats. Biochem. Pharmacol. 2018, 155, 326–335. [Google Scholar] [CrossRef] [PubMed]
  32. Morgese, M.G.; Tucci, P.; Mhillaj, E.; Bove, M.; Schiavone, S.; Trabace, L.; Cuomo, V. Lifelong Nutritional Omega-3 Deficiency Evokes Depressive-Like State Through Soluble Beta Amyloid. Mol. Neurobiol. 2017, 54, 2079–2089. [Google Scholar] [CrossRef] [PubMed]
  33. de Gomes, M.G.; Souza, L.C.; Goes, A.R.; Del Fabbro, L.; Filho, C.B.; Donato, F.; Prigol, M.; Luchese, C.; Roman, S.S.; Puntel, R.L.; et al. Fish oil ameliorates sickness behavior induced by lipopolysaccharide in aged mice through the modulation of kynurenine pathway. J. Nutr. Biochem. 2018, 58, 37–48. [Google Scholar] [CrossRef] [PubMed]
  34. Lotrich, F.E.; Sears, B.; McNamara, R.K. Elevated ratio of arachidonic acid to long-chain omega-3 fatty acids predicts depression development following interferon-alpha treatment: Relationship with interleukin-6. Brain Behav. Immun. 2013, 31, 48–53. [Google Scholar] [CrossRef] [PubMed]
  35. Mamalakis, G.; Kiriakakis, M.; Tsibinos, G.; Kafatos, A. Depression and adipose polyunsaturated fatty acids in an adolescent group. Prostaglandins Leukot. Essent. Fat. Acids 2004, 71, 289–294. [Google Scholar] [CrossRef] [PubMed]
  36. Otto, S.; De Groot, R.; Hornstra, G. Increased risk of postpartum depressive symptoms is associated with slower normalization after pregnancy of the functional docosahexaenoic acid status. Prostaglandins Leukot. Essent. Fat. Acids 2003, 69, 237–243. [Google Scholar] [CrossRef]
  37. Assies, J.; Lieverse, R.; Vreken, P.; Wanders, R.J.; Dingemans, P.M.; Linszen, D.H. Significantly reduced docosahexaenoic and docosapentaenoic acid concentrations in erythrocyte membranes from schizophrenic patients compared with a carefully matched control group. Biol. Psychiatry 2001, 49, 510–522. [Google Scholar] [CrossRef]
Figure 1. Flowchart of the study.
Nutrients 11 01204 g001
Table 1. Characteristics of the participants.
Non-PPDSPPDS
N = 97N = 23
n (%) or mean ± SDp value
Age (year)32.6 ± 4.5 31.6 ± 4.30.353
Anthropometric
 Pre-pregnancy BMI (kg/m2)21.6 ± 3.221.5 ± 3.20.853
 Gestational weight gain (kg)12.9 ± 4.413.1 ± 3.90.842
 Current BMI (kg/m2)23.4 ± 3.523.2 ± 3.90.789
Years of education
 ≤1219 (20) 5 (22)0.817
 ≥1679 (80)18 (78)
Working state
 Homemaking31 (32)11 (48)0.529
 Full-time 49 (51)9 (39)
 Part-time 16 (17)3 (13)
Parity
 Primipara60 (62)15 (65)0.765
 Multipara37 (38)8 (35)
Baby’s gender
 Male 58 (60)12 (52)0.505
Type of delivery
 Vaginal67 (69)13 (57)0.251
 Caesarian section30 (31)10 (43)
Baby’s caregiver
 Self72 (75)15 (65)0.342
 Family members24 (25)8 (35)
Breast-feeding
 Exclusive breast feed 34 (35)6 (26)0.533
 Mix feed53 (55)13 (57)
 Formula feed10 (10)4 (17)
Nutritional supplements
 Pregnancy first trimester88 (91)23 (100)0.129
 Pregnancy second trimester82 (85)19 (83)0.820
 Pregnancy third trimester78 (81)18 (78)0.817
 Lactation40 (41)9 (39)0.853
Postpartum confinement
 Home care44 (45)16 (70) *0.037
 Postpartum care center53 (55)7 (30)
Self-perceived psychological stress
 The ability to care for the baby49 (51)15 (65)0.204
 Families unable to provide support8 (8)7 (30) *0.004
 Husband unable to provide support1 (1)5 (22) *0.000
 Self-health status8 (8)5 (22)0.061
 Baby health status35 (36)10 (44)0.510
 Financial ability15 (16)4 (17)0.820
 Other3 (3)3 (13) *0.049
Overall psychological stress scores1.2 ± 1.02.1 ± 1.0*0.000
Postpartum care satisfaction scores6.1 ± 1.05.2 ± 1.2*0.005
*: Significant difference between postpartum depressive symptom (PPDS) and non-PPDS groups as analyzed by an independent Student’s t test or chi-squared test (p < 0.05).
Table 2. Nutritional biomarkers of the postpartum women a.
Non-PPDSPPDS
N = 97N = 23p Value
HGB (g/dL)13.0 ± 1.213.3 ± 0.90.363
Ferritin (ng/mL)58.0 ± 51.957.7 ± 48.40.977
25(OH)D3 (ng/mL)24.0 ± 8.026.3 ± 7.10.197
Retinol (μmol/L)1.3 ± 0.41.5 ± 0.50.050
α-tocopherol (μmol/L)26.0 ± 6.624.9 ± 8.60.496
Riboflavin (ng/mL)7.2 ± 2.06.2 ± 2.1 *0.036
a Values are presented as means ± SDs. *: Significant differences between postpartum depressive symptom (PPDS) and non-PPDS groups as analyzed by an independent Student’s t test (p < 0.05).
Table 3. Fatty acids composition of erythrocytes a.
Fatty AcidsNon-PPDSPPDS
% of total FAsN = 97N = 23p value
Total saturated fatty acids41.45 ± 0.8141.59 ± 0.630.432
 C12:00.08 ± 0.020.08 ± 0.020.492
 C14:00.17 ± 0.050.17 ± 0.040.986
 C15:00.09 ± 0.020.09 ± 0.020.875
 C16:022.63 ± 0.7022.62 ± 0.500.926
 C17:00.27 ± 0.030.27 ± 0.030.940
 C18:014.41 ± 0.7514.48 ± 0.540.740
 C20:00.30 ± 0.040.30 ± 0.030.699
 C22:01.09 ± 0.121.09 ± 0.120.939
 C24:02.40 ± 0.292.50 ± 0.320.971
Total monounsaturated fatty acids17.50 ± 0.7917.37 ± 0.600.469
 C14:1n-50.04 ± 0.030.04 ± 0.020.757
 C16:1n-90.08 ± 0.010.07 ± 0.01*0.007
 C16:1n-70.25 ± 0.110.25 ± 0.040.745
 C18:1n-912.46 ± 0.6412.47 ± 0.500.933
 C18:1n-71.02 ± 0.081.01 ± 0.110.668
 C20:1n-90.27 ± 0.040.28 ±0.040.359
 C24:1n-93.38 ± 0.283.24 ±0.22*0.032
Total polyunsaturated fatty acids
Σn-630.35 ± 1.45 30.97 ± 1.160.059
  C18:2n-611.14 ± 1.4711.28 ± 0.980.668
  C18:3n-60.05 ± 0.020.04 ± 0.02*0.001
  C20:2n-60.48 ± 0.050.47 ± 0.050.684
  C20:3n-61.24 ± 0.191.34 ± 0.22*0.030
  C20:4n-614.25 ± 1.0114.44 ± 0.830.408
  C22:4n-62.63 ± 0.382.77 ± 0.500.134
  C22:5n-60.56 ± 0.120.63 ± 0.14*0.013
Σn-310.07 ± 1.069.50 ± 0.93*0.020
  C18:3n-30.15 ± 0.030.15 ± 0.040.100
  C20:5n-3 (EPA)1.61 ± 0.431.34 ± 0.34*0.006
  C22:5n-31.94 ± 0.221.91 ± 0.210.543
  C22:6n-3 (DHA)6.40 ± 0.766.11 ± 0.720.102
Σn-6/Σn-3 ratio3.05 ± 0.423.30 ± 0.44*0.015
C20:3n-6/C18:3n-630.57 ± 23.4254.93 ± 36.76*0.005
C20:4n-6/(C20:5n-3 + C22:6n-3)1.81 ± 0.271.97 ± 0.29*0.012
C22:6n-3/C22:5n-611.90 ± 2.8810.05 ± 2.33*0.005
a Values are presented as means ± SDs. * Mean significant difference between postpartum depressive symptom (PPDS) and non-PPDS groups as analyzed by independent Student’s t tests (p < 0.05).
Table 4. Association between nutritional biomarkers and postpartum depression.
βS.E aORp Value95% CI
25(OH)D3 (ng/mL)
 Model 1b0.0370.0291.0380.1980.981–1.099
 Model 20.0310.0331.032 0.3520.966–1.101
Retinol (μmol/L)
 Model 10.9980.5172.7140.0540.985–7.480
 Model 21.2070.6183.3430.0510.996–11.228
α-tocopherol (μmol/L)
 Model 1−0.0240.0350.9760.4930.912–1.045
 Model 2−0.0130.0400.9870.7390.912–1.068
Riboflavin (ng/mL)
 Model 1−0.2910.1420.747*0.0400.566–0.987
 Model 2−0.3790.1570.684*0.0150.504–0.930
a S.E = standard error of the mean; OR = odds ratio; 95% CI = 95% confidence interval. *: Significant difference between postpartum depressive symptom (PPDS) and non-PPDS groups as analyzed by binary logistic regression (p < 0.05). b Model 1: not adjusted; Model 2: adjusted for the type of postpartum confinement, overall psychological stress scores, and postpartum care satisfaction scores.
Table 5. Association between fatty acid composition of erythrocyte and postpartum depression a.
βS.EORp Value95% CI
Total saturated fatty acids
   Model 1 b0.002 0.003 1.002 0.432 0.997–1.008
   Model 20.003 0.003 1.003 0.364 0.997–1.009
Total monounsaturated fatty acids
   Model 1−0.002 0.003 0.998 0.466 0.992–1.004
   Model 2−0.009 0.004 0.991* 0.0030.983–0.999
C16:1n-9
   Model 1 −0.522 0.200 0.593*0.0090.401–0.878
   Model 2−0.686 0.241 0.504* 0.0040.314–0.808
C24:1n-9
   Model 1−0.019 0.009 0.981* 0.0360.964–0.999
   Model 2−0.034 0.012 0.967* 0.0060.943–0.990
n-6 Polyunsaturated fatty acids
   Σn-6
   Model 10.004 0.002 1.004 0.055 1.000–1.008
   Model 20.005 0.002 1.005* 0.0381.000–1.009
   C18:3n-6
     Model 1−0.386 0.125 0.680* 0.0020.532–0.869
     Model 2−0.461 0.148 0.630* 0.0020.472–0.842
   C20:3n-6
     Model 10.025 0.012 1.025* 0.0361.002–1.050
     Model 20.021 0.015 1.022 0.141 0.993–1.051
   C22:5n-6
     Model 10.042 0.018 1.043* 0.0181.007–1.079
     Model 20.043 0.021 1.044* 0.0451.001–1.089
n-3 Polyunsaturated fatty acids
   Σn-3
   Model 1−0.006 0.002 0.994* 0.0230.990–0.999
   Model 2−0.004 0.003 0.996 0.155 0.991–1.001
   C20:5n-3
     Model 1−0.020 0.008 0.980* 0.0080.966–0.995
     Model 2−0.019 0.008 0.982* 0.0200.966–0.997
   C22:6n-3
     Model 1−0.005 0.003 0.995 0.104 0.989–1.001
     Model 2−0.003 0.004 0.997 0.356 0.990–1.004
Σn-6/Σn-3
   Model 10.013 0.005 1.013* 0.0191.002–1.024
   Model 20.010 0.006 1.010 0.113 0.998–1.023
C20:3n-6/C18:3n-6
   Model 10.0250.0081.025*0.0011.010–1.041
   Model 20.0310.0091.031*0.0011.014–1.049
C20:4n-6/(C20:5n-3 + C22:6n-3)
   Model 10.0220.0091.022*0.0151.004–1.040
   Model 20.0200.0101.020*0.0481.000–1.041
C22:6n-3/C22:5n-6
   Model 1−0.2700.1000.764*0.0070.627–0.930
   Model 2−0.2410.1160.786*0.0370.626–0.986
a 95% CI = 95% confidence interval; OR = odds ratio. *: Significant difference between postpartum depressive symptom (PPDS) and non-PPDS groups as analyzed by binary logistic regression (p < 0.05). b Model 1: not adjusted; Model 2: adjusted for the type of postpartum confinement, overall psychological stress scores, and postpartum care satisfaction scores.

