Maintaining the Outcomes of a Successful Weight Gain Prevention Intervention in Mid-Age Women: Two Year Results from the 40-Something Randomized Control Trial


Abstract
1. Introduction
2. Materials and Methods
2.1. Study Design and Participants in the 40-Something Intervention Phase
2.2. The 40 Something Intervention Description
2.3. Study Design and Participants in the 40-Something Monitoring Phase
2.4. Outcome Measures
2.5. Statistical Analyses
3. Results
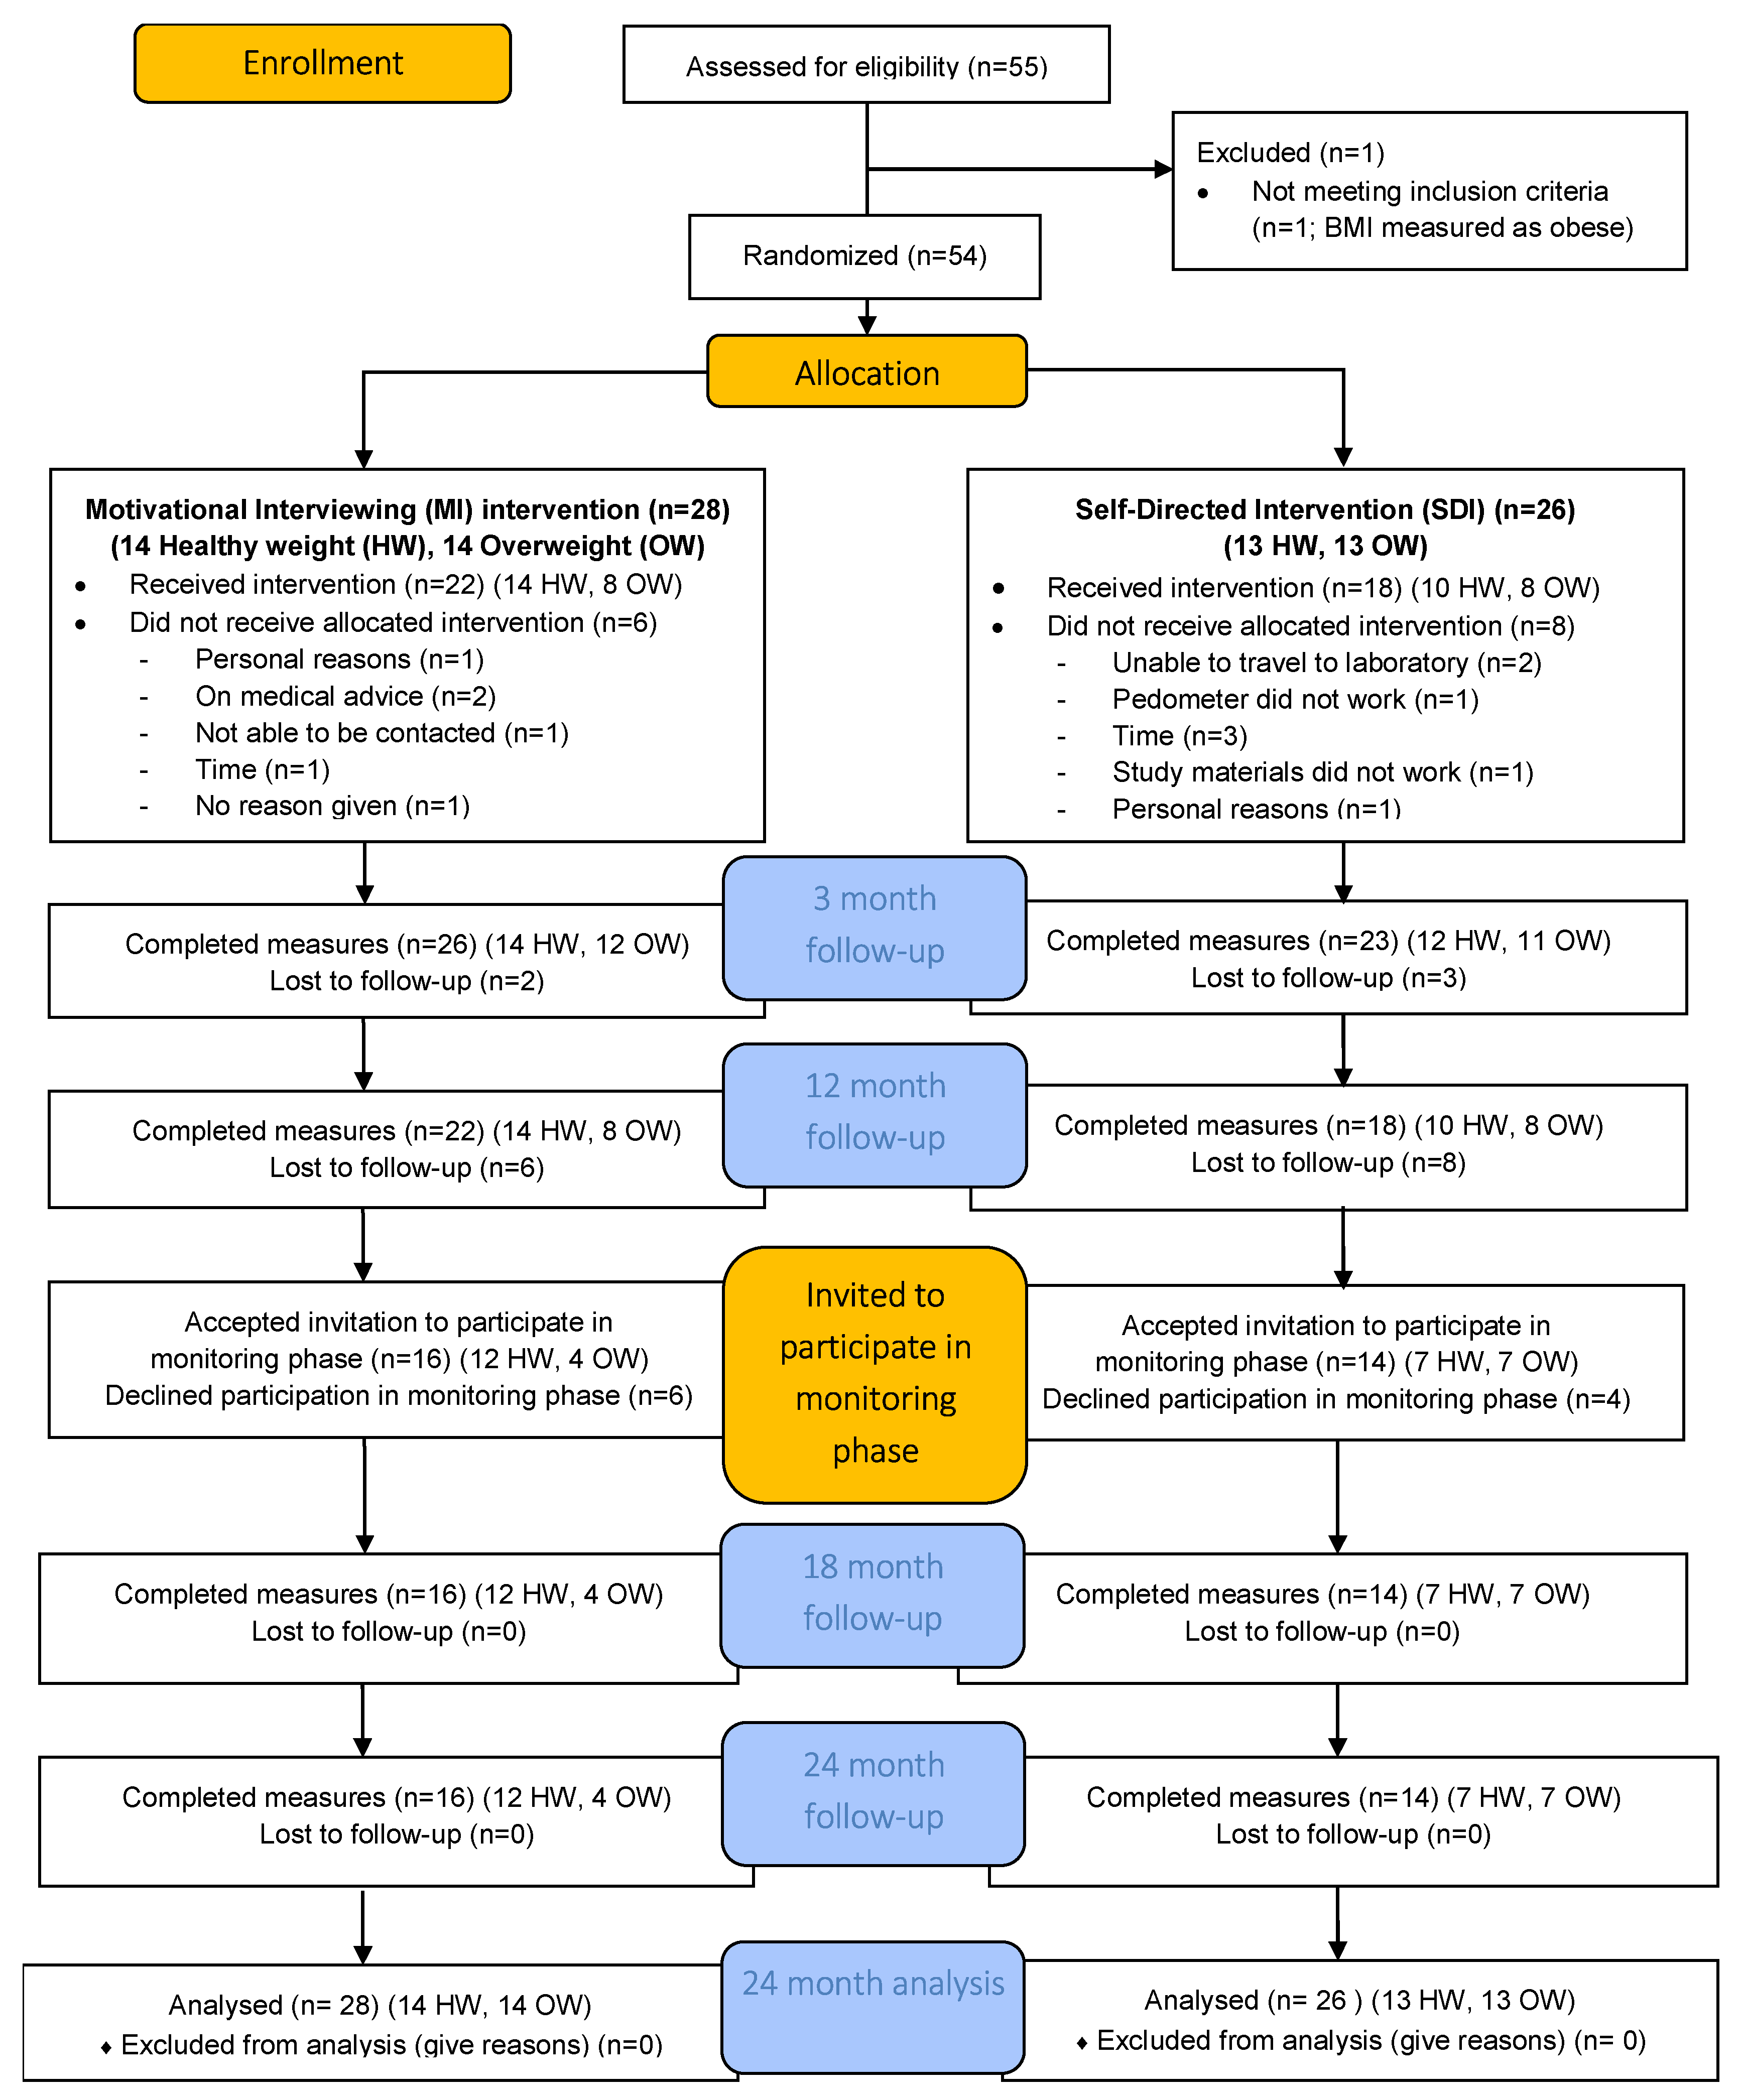
3.1. Participants
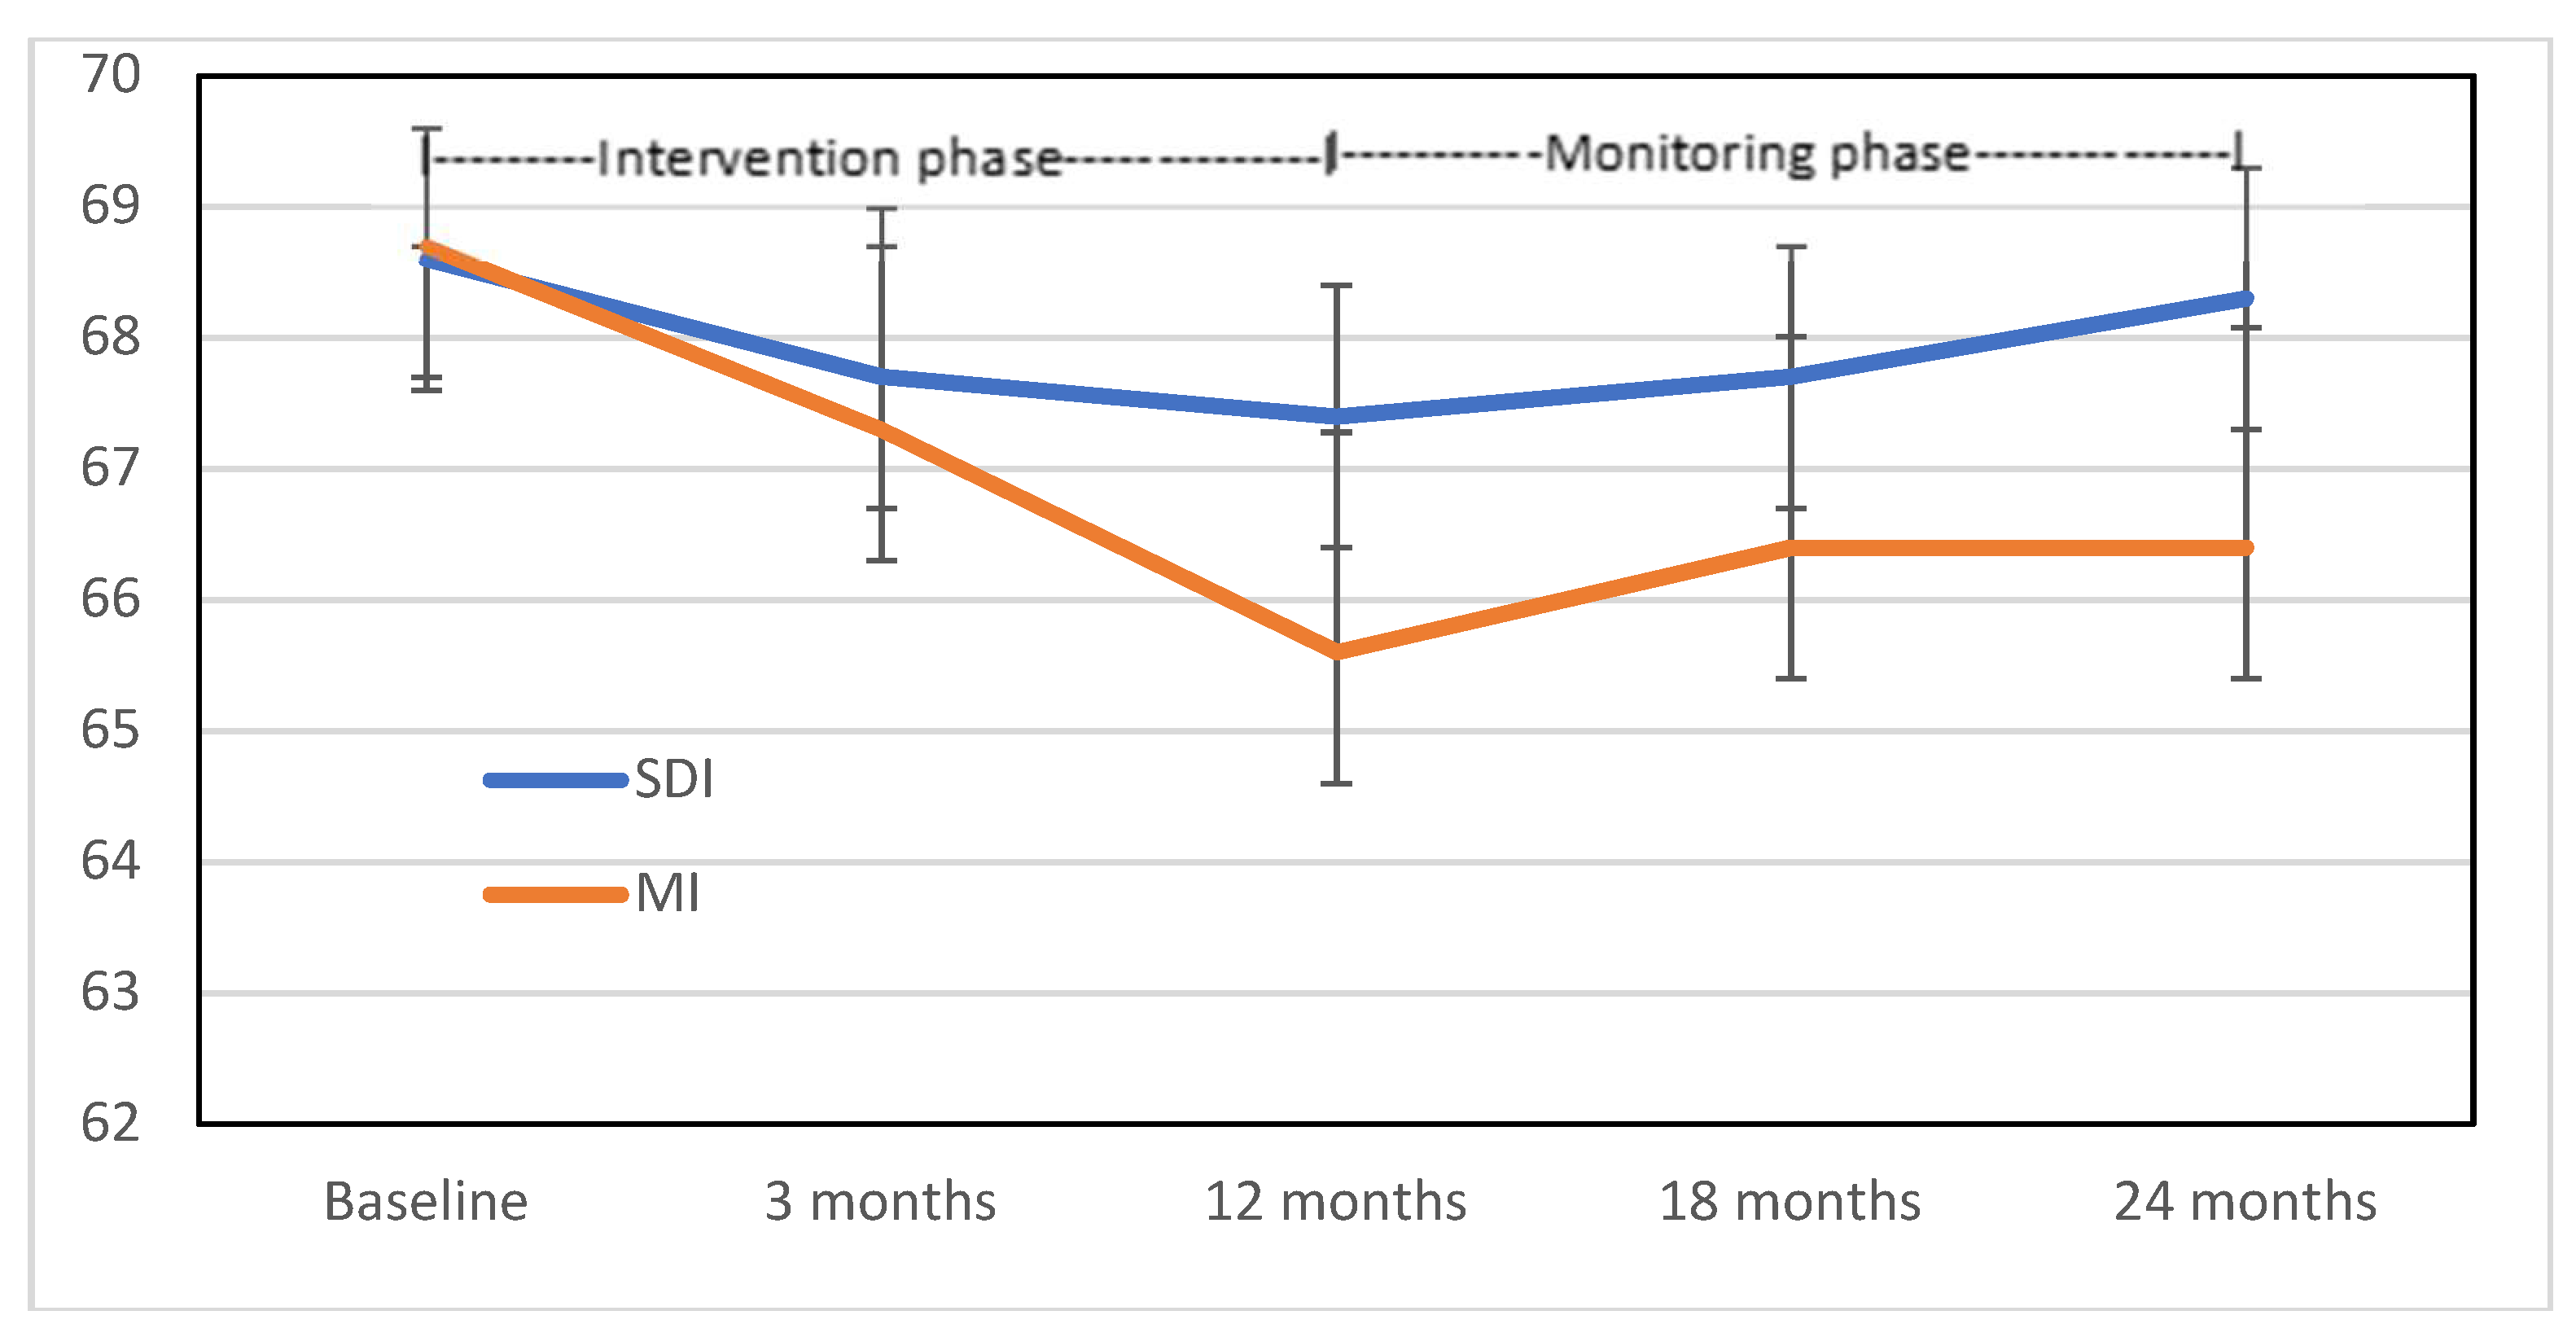
3.2. ITT Weight Analyses
3.3. Secondary Outcome Measures: Physical Measures
3.4. Secondary Outcome Measures: Quality of Life
4. Discussion
5. Conclusions
Author Contributions
Funding
Acknowledgments
Conflicts of Interest
References
- Al-Azzawi, F.; Palacios, S. Hormonal changes during menopause. Maturitas 2009, 63, 135–137. [Google Scholar] [CrossRef] [PubMed]
- Sowers, M.F.; Zheng, H.; Tomey, K.; Karvonen-Gutierrez, C.; Jannausch, M.; Li, X.; Yosef, M.; Symons, J. Changes in Body Composition in Women over Six Years at Midlife: Ovarian and Chronological Aging. J. Clin. Endocrinol. Metab. 2007, 92, 895–901. [Google Scholar] [CrossRef]
- Lovejoy, J.C. Weight gain in women at midlife: The influence of menopause. Obes. Manag. 2009, 5, 52–56. [Google Scholar] [CrossRef]
- Kuller, L.H.; Meilahn, E.N.; Cauley, J.A.; Gutai, J.P.; Matthews, K.A. Epidemiologic Studies of Menopause: Changes in Risk Factors and Disease. Exp. Gerontol. 1994, 29, 495–509. [Google Scholar] [CrossRef]
- Jull, J.; Stacey, D.; Beach, S.; Dumas, A.; Strychar, I.; Ufholz, L.-A.; Prince, S.; Abdulnour, J.; Prud’homme, D. Lifestyle interventions targeting body weight changes during the menopause transition: A systematic review. J. Obes. 2014, 2014. [Google Scholar] [CrossRef]
- Hagner, W.; Hagner-Derengowska, M.; Wiacek, M.; Zubrzycki, I.Z. Changes in level of V˙ O2max, blood lipids, and waist circumference in the response to moderate endurance training as a function of ovarian aging. Menopause 2009, 16, 1009–1013. [Google Scholar] [CrossRef] [PubMed]
- Ogwumike, O.; Arowojolu, A.; Sanya, A. Effects of a 12-week endurance exercise program on adiposity and flexibility of Nigerian perimenopausal and postmenopausal women. Niger. J. Physiol. Sci. 2011, 26, 199–206. [Google Scholar]
- Simkin-Silverman, L.R.; Wing, R.R.; Boraz, M.A.; Kuller, L.H.; Simkin-Silverman, L.R.; Wing, R.R.; Boraz, M.A.; Kuller, L.H. Lifestyle intervention can prevent weight gain during menopause: Results from a 5-year randomized clinical trial. Ann. Behav. Med. 2003, 26, 212–220. [Google Scholar] [CrossRef]
- Wing, R.R.; Phelan, S. Long-term weight loss maintenance. Am. J. Clin. Nutr. 2005, 82, 222S–225S. [Google Scholar] [CrossRef]
- Teixeira, P.J.; Carraça, E.V.; Marques, M.M.; Rutter, H.; Oppert, J.-M.; De Bourdeaudhuij, I.; Lakerveld, J.; Brug, J. Successful behavior change in obesity interventions in adults: A systematic review of self-regulation mediators. BMC Med. 2015, 13, 84. [Google Scholar] [CrossRef]
- Williams, L.T.; Hollis, J.L.; Collins, C.E.; Morgan, P.J. The 40-Something randomized controlled trial to prevent weight gain in mid-age women. BMC Public Health 2013, 13, 1007. [Google Scholar] [CrossRef]
- Barnes, R.; Ivezaj, V. A systematic review of motivational interviewing for weight loss among adults in primary care. Obes. Rev. 2015, 16, 304–318. [Google Scholar] [CrossRef]
- Hollis, J.L.; Williams, L.T.; Collins, C.E.; Morgan, P.J. Effectiveness of interventions using Motivational Interviewing for dietary and physical activity modification in adults: A systematic review. JBI Database Syst. Rev. Implementat. Rep. 2013, 11, 1–27. [Google Scholar] [CrossRef]
- Williams, L.; Hollis, J.; Collins, C.; Morgan, P. Can a relatively low-intensity intervention by health professionals prevent weight gain in mid-age women? 12-Month outcomes of the 40-Something randomised controlled trial. Nutr. Diabetes 2014, 4, e116. [Google Scholar] [CrossRef]
- Hollis, J.L.; Williams, L.T.; Morgan, P.J.; Collins, C.E. The 40-Something Randomised Controlled Trial improved fruit intake and nutrient density of the diet in mid-age women. Nutr. Diabetes 2015, 72, 316–326. [Google Scholar] [CrossRef]
- Lean, M.; Hankey, C. Keeping it off: The challenge of weight-loss maintenance. Lancet Diabetes Endocrinol. 2018, 6, 681–683. [Google Scholar] [CrossRef]
- Barte, J.; Ter Bogt, N.; Bogers, R.; Teixeira, P.; Blissmer, B.; Mori, T.; Bemelmans, W. Maintenance of weight loss after lifestyle interventions for overweight and obesity, a systematic review. Obes. Rev. 2010, 11, 899–906. [Google Scholar] [CrossRef]
- Collins, C.E.; Neve, M.J.; Williams, R.; Young, M.D.; Morgan, P.J.; Fletcher, K.; Callister, R. Effectiveness of interventions with a dietary component on weight loss maintenance: A systematic review. JBI Database Syst. Rev. Implementat. Rep. 2013, 11, 317–414. [Google Scholar] [CrossRef]
- Teixeira, P.J.; Silva, M.N.; Coutinho, S.R.; Palmeira, A.L.; Mata, J.; Vieira, P.N.; Carraca, E.V.; Santos, T.C.; Sardinha, L.B. Mediators of weight loss and weight loss maintenance in middle-aged women. Obesity 2010, 18, 725–735. [Google Scholar] [CrossRef]
- Bandura, A. Social Foundations of Thought and Action: A Social Cognitive Theory; Prentice-Hall: Englewood Cliffs, NJ, USA, 1986. [Google Scholar]
- Miller, W.R.; Rollnick, S. Motivational Interviewing: Preparing People for Change, 2nd ed.; The Guilford Press: New York, NY, USA, 2002. [Google Scholar]
- Mader, U.; Martin, B.W.; Schutz, Y.; Marti, B. Validity of four short physical activity questionnaires in middle-aged persons. Med. Sci. Sports Exerc. 2006, 38, 1255–1266. [Google Scholar] [CrossRef]
- Ware, J.E., Jr.; Kosinski, M.; Keller, S. SF-36 Physical and Mental Health Summary Scales: A User’s Manual; New England Medical Centre: Boston, MA, USA, 1994. [Google Scholar]
- Mishra, G.; Schofield, M. Norms for the physical and mental health component summary scores of the SF-36 for young, middle-aged and older Australian women. Qual. Life Res. 1998, 7, 215–220. [Google Scholar] [CrossRef]
- Dudley, E.C.; Hopper, J.L.; Guthrie, J.R.; Burger, H.G.; Dennerstein, L. Using longitudinal data to define the perimenopause by menstrual cycle characteristics. Climacteric 1998, 1, 18–25. [Google Scholar] [CrossRef]
- Williams, L.T.; Young, A.F.; Brown, W.J. Weight gained in two years by a population of mid-aged women: How much is too much? Int. J. Obes. 2006, 30, 1229–1233. [Google Scholar] [CrossRef]
- Williams, L.; Germov, J.; Young, A. Preventing weight gain: A population cohort study of the nature and effectiveness of mid-age women’s weight control practices. Int. J. Obes. 2007, 31, 978–986. [Google Scholar] [CrossRef][Green Version]
- Hollis, J.L.; Williams, L.T.; Young, M.D.; Pollard, K.T.; Collins, C.E.; Morgan, P.J. Compliance to step count and vegetable serve recommendations mediates weight gain prevention in mid-age, premenopausal women. Findings of the 40-Something RCT. Appetite 2014, 83, 33–41. [Google Scholar] [CrossRef]
- Santos, I.; Silva, M.N.; Teixeira, P.J. A self-determination theory perspective on weight loss maintenance. Eur. Health Psychol. 2016, 18, 194–199. [Google Scholar]
- Williams, L.; Germov, J.; Young, A. The effect of social class on mid-age women’s weight control practices and weight gain. Appetite 2011, 56, 7. [Google Scholar] [CrossRef]
- Jansen, S.; Ball, L.; Lowe, C. Impact of the Medicare Chronic Disease Management program on the conduct of Australian dietitians’ private practices. Aust. Health Rev. 2015, 39, 183–189. [Google Scholar] [CrossRef]
- Batsis, J.A.; Huyck, K.L.; Bartels, S.J. Challenges with the Medicare obesity benefit: Practical concerns & proposed solutions. J. Gen. Int. Med. 2015, 30, 118–122. [Google Scholar]
- Hardcastle, S.J.; Taylor, A.H.; Bailey, M.P.; Harley, R.A.; Hagger, M.S. Effectiveness of a motivational interviewing intervention on weight loss, physical activity and cardiovascular disease risk factors: A randomised controlled trial with a 12-month post-intervention follow-up. Int. J. Behav. Nutr. Phys. Act. 2013, 10, 40. [Google Scholar] [CrossRef]
- Williams, L.T.; Barnes, K.; Ball, L.; Ross, L.J.; Sladdin, I.; Mitchell, L.J. How Effective Are Dietitians in Weight Management? A Systematic Review and Meta-Analysis of Randomized Controlled Trials. Healthcare 2019, 7, 20. [Google Scholar] [CrossRef]


| Characteristics | Completed to 24 Months (n = 30) | Withdrew after 12 Months (n = 10) | Withdrew before 12 Months (n = 14) | Total N = 54 | p Value |
|---|---|---|---|---|---|
| Allocation group | 0.689 | ||||
| MI (n) | 16 | 6 | 6 | 28 | |
| SDI (n) | 14 | 4 | 8 | 26 | |
| Age (y) mean (Standard Deviation (SD)) | 47.3 (1.8) | 47.3 (1.5) | 47.1 (2.1) | 47.3 (1.8) | 0.905 |
| Weight (kg) mean (SD) | 66.8 (7.6) | 69.0 (8.2) | 72.2 (7.6) | 68.7 (7.9) | 0.103 |
| Height (m) mean (SD) | 1.65 (0.01) | 1.65 (0.07) | 1.67 (0.05) | 1.65 (0.06) | 0.575 |
| Body fat % mean (SD) | 34.8 (5.3) | 35.6 (5.1) | 38.4 (5.9) | 35.9 (5.6) | 0.123 |
| Waist (cm) mean (SD) | 81.7 (7.2) | 83.9 (6.5) | 86.0 (8.7) | 83.1 (7.6) | 0.190 |
| Body Mass Index (kg/m2) mean (SD) | 24.6 (2.3) | 25.2 (1.9) | 26.0 (2.8) | 25.1 (2.4) | 0.205 |
| Body Mass Index 18.5–24.99 kg/m2 (n) | 19 (MI = 12; SDI = 7) | 5 (MI = 2; SDI = 3) | 3 (MI = 0; SDI = 3) | 27 (MI = 14; SDI = 13) | 0.035 |
| Body Mass Index 25–29.99 kg/m2 (n) | 11 (MI = 4; SDI = 7) | 5 (MI = 4; SDI = 1) | 11 (MI=6; SDI=5) | 27 (MI=14; SDI=13) | |
| Country of birth 1 n (%) | 0.289 | ||||
| Australia | 25 (83.3) | 10 (100) | 10 (71.4) | 45 (84.9) | |
| Other | 5 (16.7) | 0 (0.0) | 3 (21.4) | 8 (15.1) | |
| Marital status 1 n (%) | 0.494 | ||||
| Married/defacto, | 23 (76.6) | 9 (90.0) | 10 (71.4) | 41 (77.4) | |
| Divorced/separated/widowed/never married | 7 (23.3) | 1 (10.0) | 3 (21.4) | 12 (22.6) | |
| Highest qualification 1 n (%) | 0.723 | ||||
| School only | 6 (20.0) | 2 (20.0) | 4 (28.5) | 12 (22.6) | |
| Post-school qualifications | 24 (80.0) | 8 (80.0) | 9 (64.4) | 41 (77.4) | |
| Work status 1 n (%) | 0.123 | ||||
| Full/part time employment | 28 (93.3) | 10 (100) | 10 (71.4) | 48 (90.6) | |
| Home duties/care | 2 (6.7) | 0 (0.0) | 1 (7.1) | 3 (5.7) | |
| Full time student | 0 (0.0) | 0 (0.0) | 2 (14.3) | 2 (3.8) | |
| Difficulty managing on income 1 n (%) | 0.004 | ||||
| Not too bad/easy | 26 (86.7) | 8 (80.0) | 5 (35.7) | 39 (73.6) | |
| Difficult sometimes/all times/impossible | 4 (13.3) | 2 (20.0) | 8 (57.1) | 14 (26.4) | |
| Self-rated health 1 n (%) | 0.208 | ||||
| Excellent/very good/good | 30 (100) | 10 (100) | 12 (85.7) | 52 (98.1) | |
| Fair/poor | 0 (0.0) | 0 (0.0) | 1 (7.1) | 1 (1.9) | |
| Fruit and vegetable intake 3 mean (SD) | |||||
| Vegetable (serves) | 2.78 (1.39) | 2.84 (1.13) | 2.56 (1.11) | 2.74 (1.26) | 0.857 |
| Fruit (serves) | 1.40 (0.81) | 1.39 (0.80) | 1.02 (0.72) | 1.30 (0.79) | 0.334 |
| Physical Activity (IPAQ 2) n (%) | 0.056 | ||||
| Low | 3 (10.0) | 1 (10.0) | 5 (35.7) | 10 (22.2) | |
| Moderate | 8 (26.7) | 4 (40.0) | 5 (35.7) | 16 (35.6) | |
| High | 14 (46.7) | 4 (40.0) | 1 (7.1) | 19 (42.2) |
| Data Collection Point | Group N = 54 | MI N = 28 | SDI N = 26 | Unadjusted Difference p (95%CI) | Adjusted 1 Difference p Value |
|---|---|---|---|---|---|
| Baseline—group | 68.7 (7.9) | 68.7 (8.9) | 68.6 (6.7) | 0.982 (−4.30;4.39) | n/a |
| Healthy weight only | 62.9 (5.3) | 62.0 (6.4) | 63.9 (3.7) | 0.373 (−6.01;2.36) | n/a |
| Overweight only | 74.4 (5.5) | 75.3 (5.4) | 73.4 (5.6) | 0.365 (−2.41;6.32) | n/a |
| 12 months—group | 66.5 (7.7) | 65.6 (8.5) | 67.4 (6.7) | 0.402 (−5.99;2.44) | 0.034 |
| Healthy weight only | 61.6 (5.3) | 59.5 (5.4) | 63.8 (4.4) | 0.032 (−8.23;−0.40) | 0.002 |
| Overweight only | 71.5 (6.4) | 71.8 (6.3) | 71.1 (6.8) | 0.764 (−4.42;5.95) | 0.467 |
| 24 months—group | 67.3 (8.0) | 66.4 (8.7) | 68.3 (7.2) | 0.401 (−6.25;2.54) | 0.024 |
| Healthy weight only | 62.0 (5.5) | 60.1 (5.9) | 64.0 (4.3) | 0.063 (−8.05;0.23) | 0.031 |
| Overweight only | 72.7 (6.4) | 72.8 (6.0) | 72.6 (7.1) | 0.937 (−5.00;5.40) | 0.197 |
| Group n = 54 Mean (SD) | MI n = 28 Mean (SD) | SDI n = 26 Mean (SD) | Unadjusted Difference p (95% CI) | Adjusted 1 Difference p (95% CI) | |
|---|---|---|---|---|---|
| SBP mmHg | |||||
| Baseline | 120.3 (11.8) | 120.7 (11.6) | 119.9 (12.2) | 0.807 (−5.755; 7.356) | n/a |
| 12 months | 119.1 (11.2) | 117.6 (7.8) | 120.7 (13.8) | 0.316 (−9.249; 3.048) | 0.137 (−8.341; 1.174) |
| 24 months | 113.1 (11.3) | 111.1 (7.8) | 115.1 (14.0) | 0.201 (−10.204; 2.197) | 0.114 (−9842; 1.094) |
| DBP mmHg | |||||
| Baseline | 75.7 (8.3) | 76.1 (7.0) | 75.4 (9.6) | 0.741 (−3.852; 5.381) | n/a |
| 12 months | 75.6 (7.3) | 74.4 (5.5) | 76.8 (8.7) | 0.237 (−6.375; 1.613) | 0.037 (−5.572; −0.175) |
| 24 months | 74.3 (7.4) | 73.1 (6.1) | 75.5 (8.4) | 0.231 (−6.494; 1.634) | 0.067 (−5.976; 0.206) |
| Body fat % | |||||
| Baseline | 35.9 (5.6) | 35.6 (5.8) | 36.2 (5.4) | 0.703 (−3.680; 2.500) | n/a |
| 12 months | 34.3 (5.5) | 33.5 (6.0) | 35.2 (4.9) | 0.253 (−4.709; 1.264) | 0.235 (−2.586; 0.650) |
| 24 months | 35.0 (5.8) | 33.7 (6.5) | 36.3 (4.8) | 0.111 (−5.673; 0.5997) | 0.030 (−3.455; −0.187) |
| Lean muscle % | |||||
| Baseline | 27.4 (2.7) | 27.5 (2.8) | 27.2 (2.5) | 0.649 (−1.154; 1.834) | n/a |
| 12 months | 27.8 (2.5) | 28.1 (2.9) | 27.6 (2.2) | 0.432 (−0.844; 0.943) | 0.592 (−0.607; 1.053) |
| 24 months | 27.6 (2.8) | 28.1 (3.3) | 27.1 (2.1) | 0.231 (−6.494; 1.604) | 0.119 (−0.182; 1.553) |
| Waist circumference cm | |||||
| Baseline | 83.1 (7.6) | 83.3 (8.2) | 83.0 (7.0) | 0.905 (−3.937; 4.440) | n/a |
| 12 months | 81.5 (8.1) | 80.4 (8.6) | 82.6 (7.5) | 0.0307 (−6.705; 2.149) | 0.045 (−4.941; −0.061) |
| 24 months | 80.6 (8.6) | 79.0 (9.1) | 82.3 (8.0) | 0.163 (−8.015; 1.389) | 0.006 (−6.046; −1.061) |
| VAT cm3 | |||||
| 12 months | 79.5 (26.3) | 75.6 (26.3) | 84.4 (26.2) | 0.296 (−25.737; 8.050) | n/a |
| 24 months | 84.5 (31.0) | 79.3 (28.6) | 90.9 (33.4) | 0.241 (−31.485; 8.175) | 0.601 (−10.894; 6.392) |
| Group Mean (SD) | MI Mean (SD) | SDI Mean (SD) | Difference 1 | ||
|---|---|---|---|---|---|
| PCS | Baseline | 50.6 (6.9) | 51.6 (5.5) | 49.4 (8.1) | 0.451 |
| 12 months | 50.7 (7.2) | 51.8 (7.2) | 49.8 (7.8) | 0.374 | |
| 24 months | 50.2 (7.2) | 51.5 (6.1) | 47.9 (7.3) | 0.107 | |
| MCS | Baseline | 49.4 (9.2) | 47.8 (10.7) | 51.2 (7.0) | 0.502 |
| 12 months | 51.4 (10.1) | 49.9 (11.0) | 52.0 (9.7) | 0.762 | |
| 24 months | 49.7 (11.3) | 48.7 (12.0) | 51.5 (9.1) | 0.840 |
© 2019 by the authors. Licensee MDPI, Basel, Switzerland. This article is an open access article distributed under the terms and conditions of the Creative Commons Attribution (CC BY) license (http://creativecommons.org/licenses/by/4.0/).
Share and Cite
Williams, L.T.; Collins, C.E.; Morgan, P.J.; Hollis, J.L. Maintaining the Outcomes of a Successful Weight Gain Prevention Intervention in Mid-Age Women: Two Year Results from the 40-Something Randomized Control Trial. Nutrients 2019, 11, 1100. https://doi.org/10.3390/nu11051100
Williams LT, Collins CE, Morgan PJ, Hollis JL. Maintaining the Outcomes of a Successful Weight Gain Prevention Intervention in Mid-Age Women: Two Year Results from the 40-Something Randomized Control Trial. Nutrients. 2019; 11(5):1100. https://doi.org/10.3390/nu11051100
Chicago/Turabian StyleWilliams, Lauren T., Clare E. Collins, Philip J. Morgan, and Jenna L. Hollis. 2019. "Maintaining the Outcomes of a Successful Weight Gain Prevention Intervention in Mid-Age Women: Two Year Results from the 40-Something Randomized Control Trial" Nutrients 11, no. 5: 1100. https://doi.org/10.3390/nu11051100
APA StyleWilliams, L. T., Collins, C. E., Morgan, P. J., & Hollis, J. L. (2019). Maintaining the Outcomes of a Successful Weight Gain Prevention Intervention in Mid-Age Women: Two Year Results from the 40-Something Randomized Control Trial. Nutrients, 11(5), 1100. https://doi.org/10.3390/nu11051100