Influence of Green Leafy Vegetables in Diets with an Elevated ω-6:ω-3 Fatty Acid Ratio on Rat Blood Pressure, Plasma Lipids, Antioxidant Status and Markers of Inflammation

Abstract
1. Introduction
2. Materials and Methods
2.1. Dietary Formulations
2.2. Animal Feeding
2.3. Systolic Blood Pressure
2.4. Adiponectin and hsCRP
2.5. Antioxidant Capacity
2.6. Lipid Profile: Plasma Triglycerides, Total Cholesterol, High-Density Lipoprotein- Cholesterol (HDL-C) and Low-Density Lipoprotein-Cholesterol (LDL-C) + Very Low-Density Lipoprotein-Cholesterol (VLDL-C)
2.7. Statistical Analysis
3. Results
3.1. Dietary Intake, Body Weight
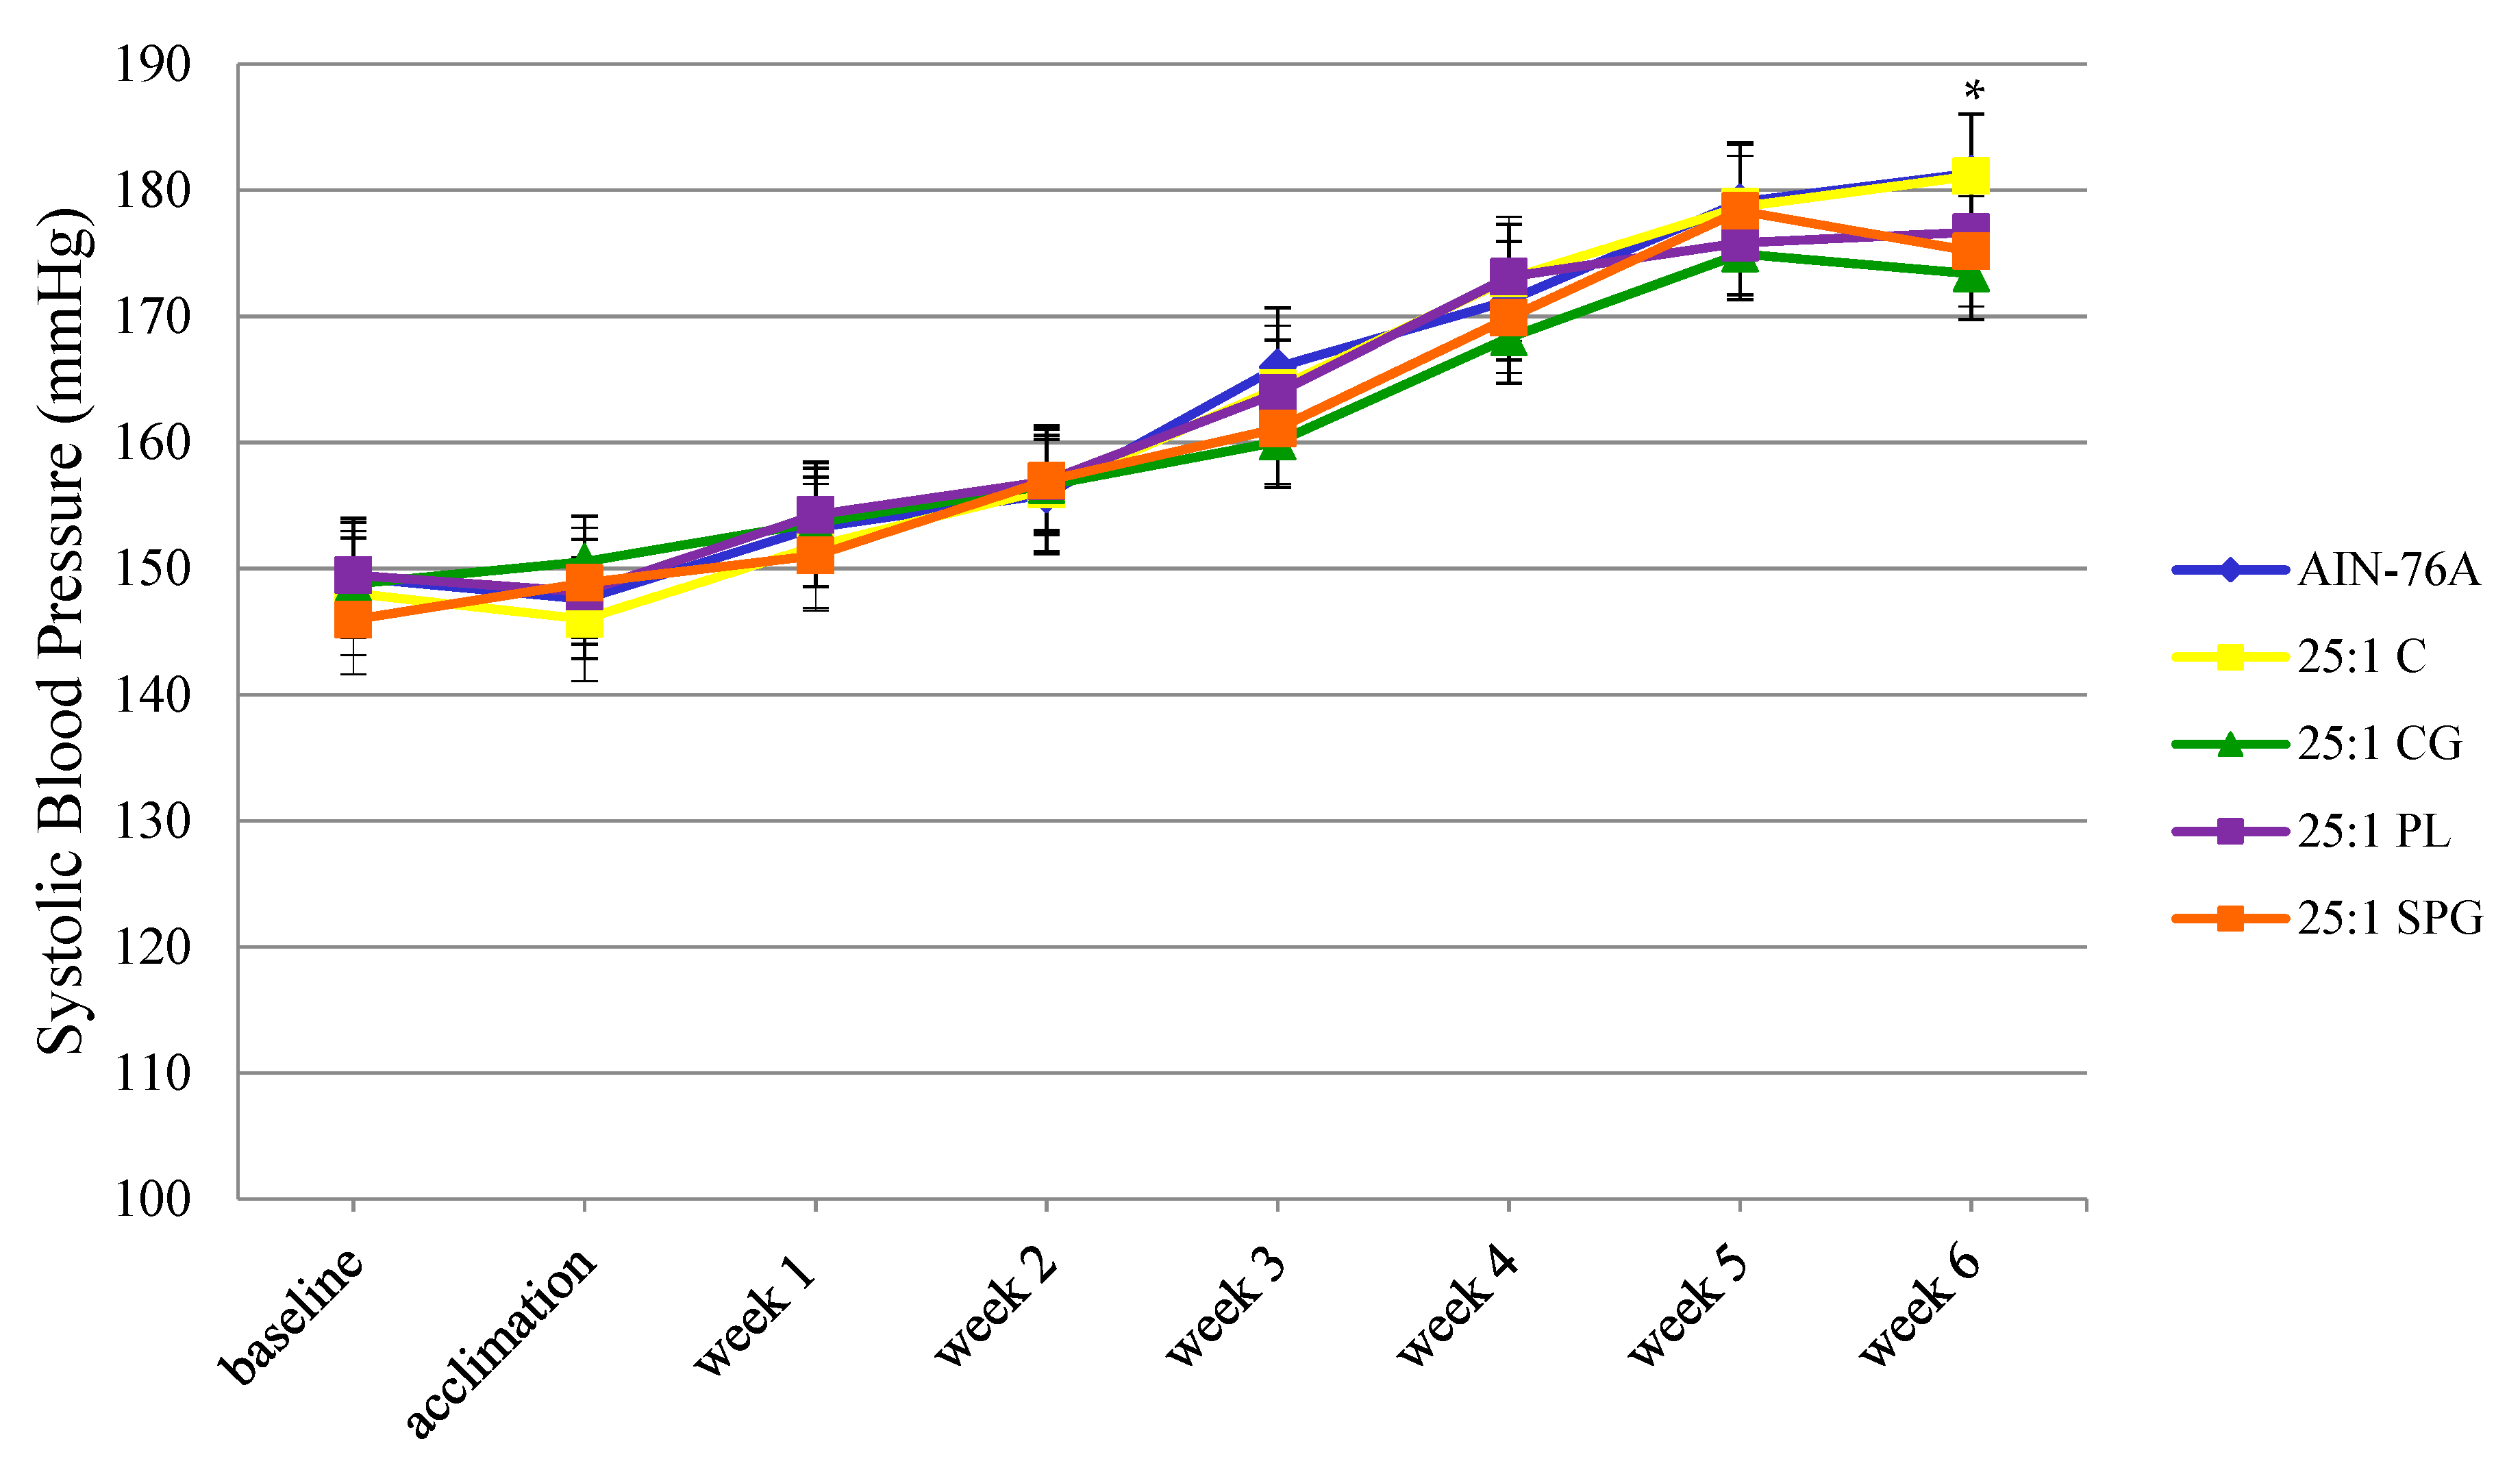
3.2. Systolic Blood Pressure
3.3. Adiponectin and hsCRP
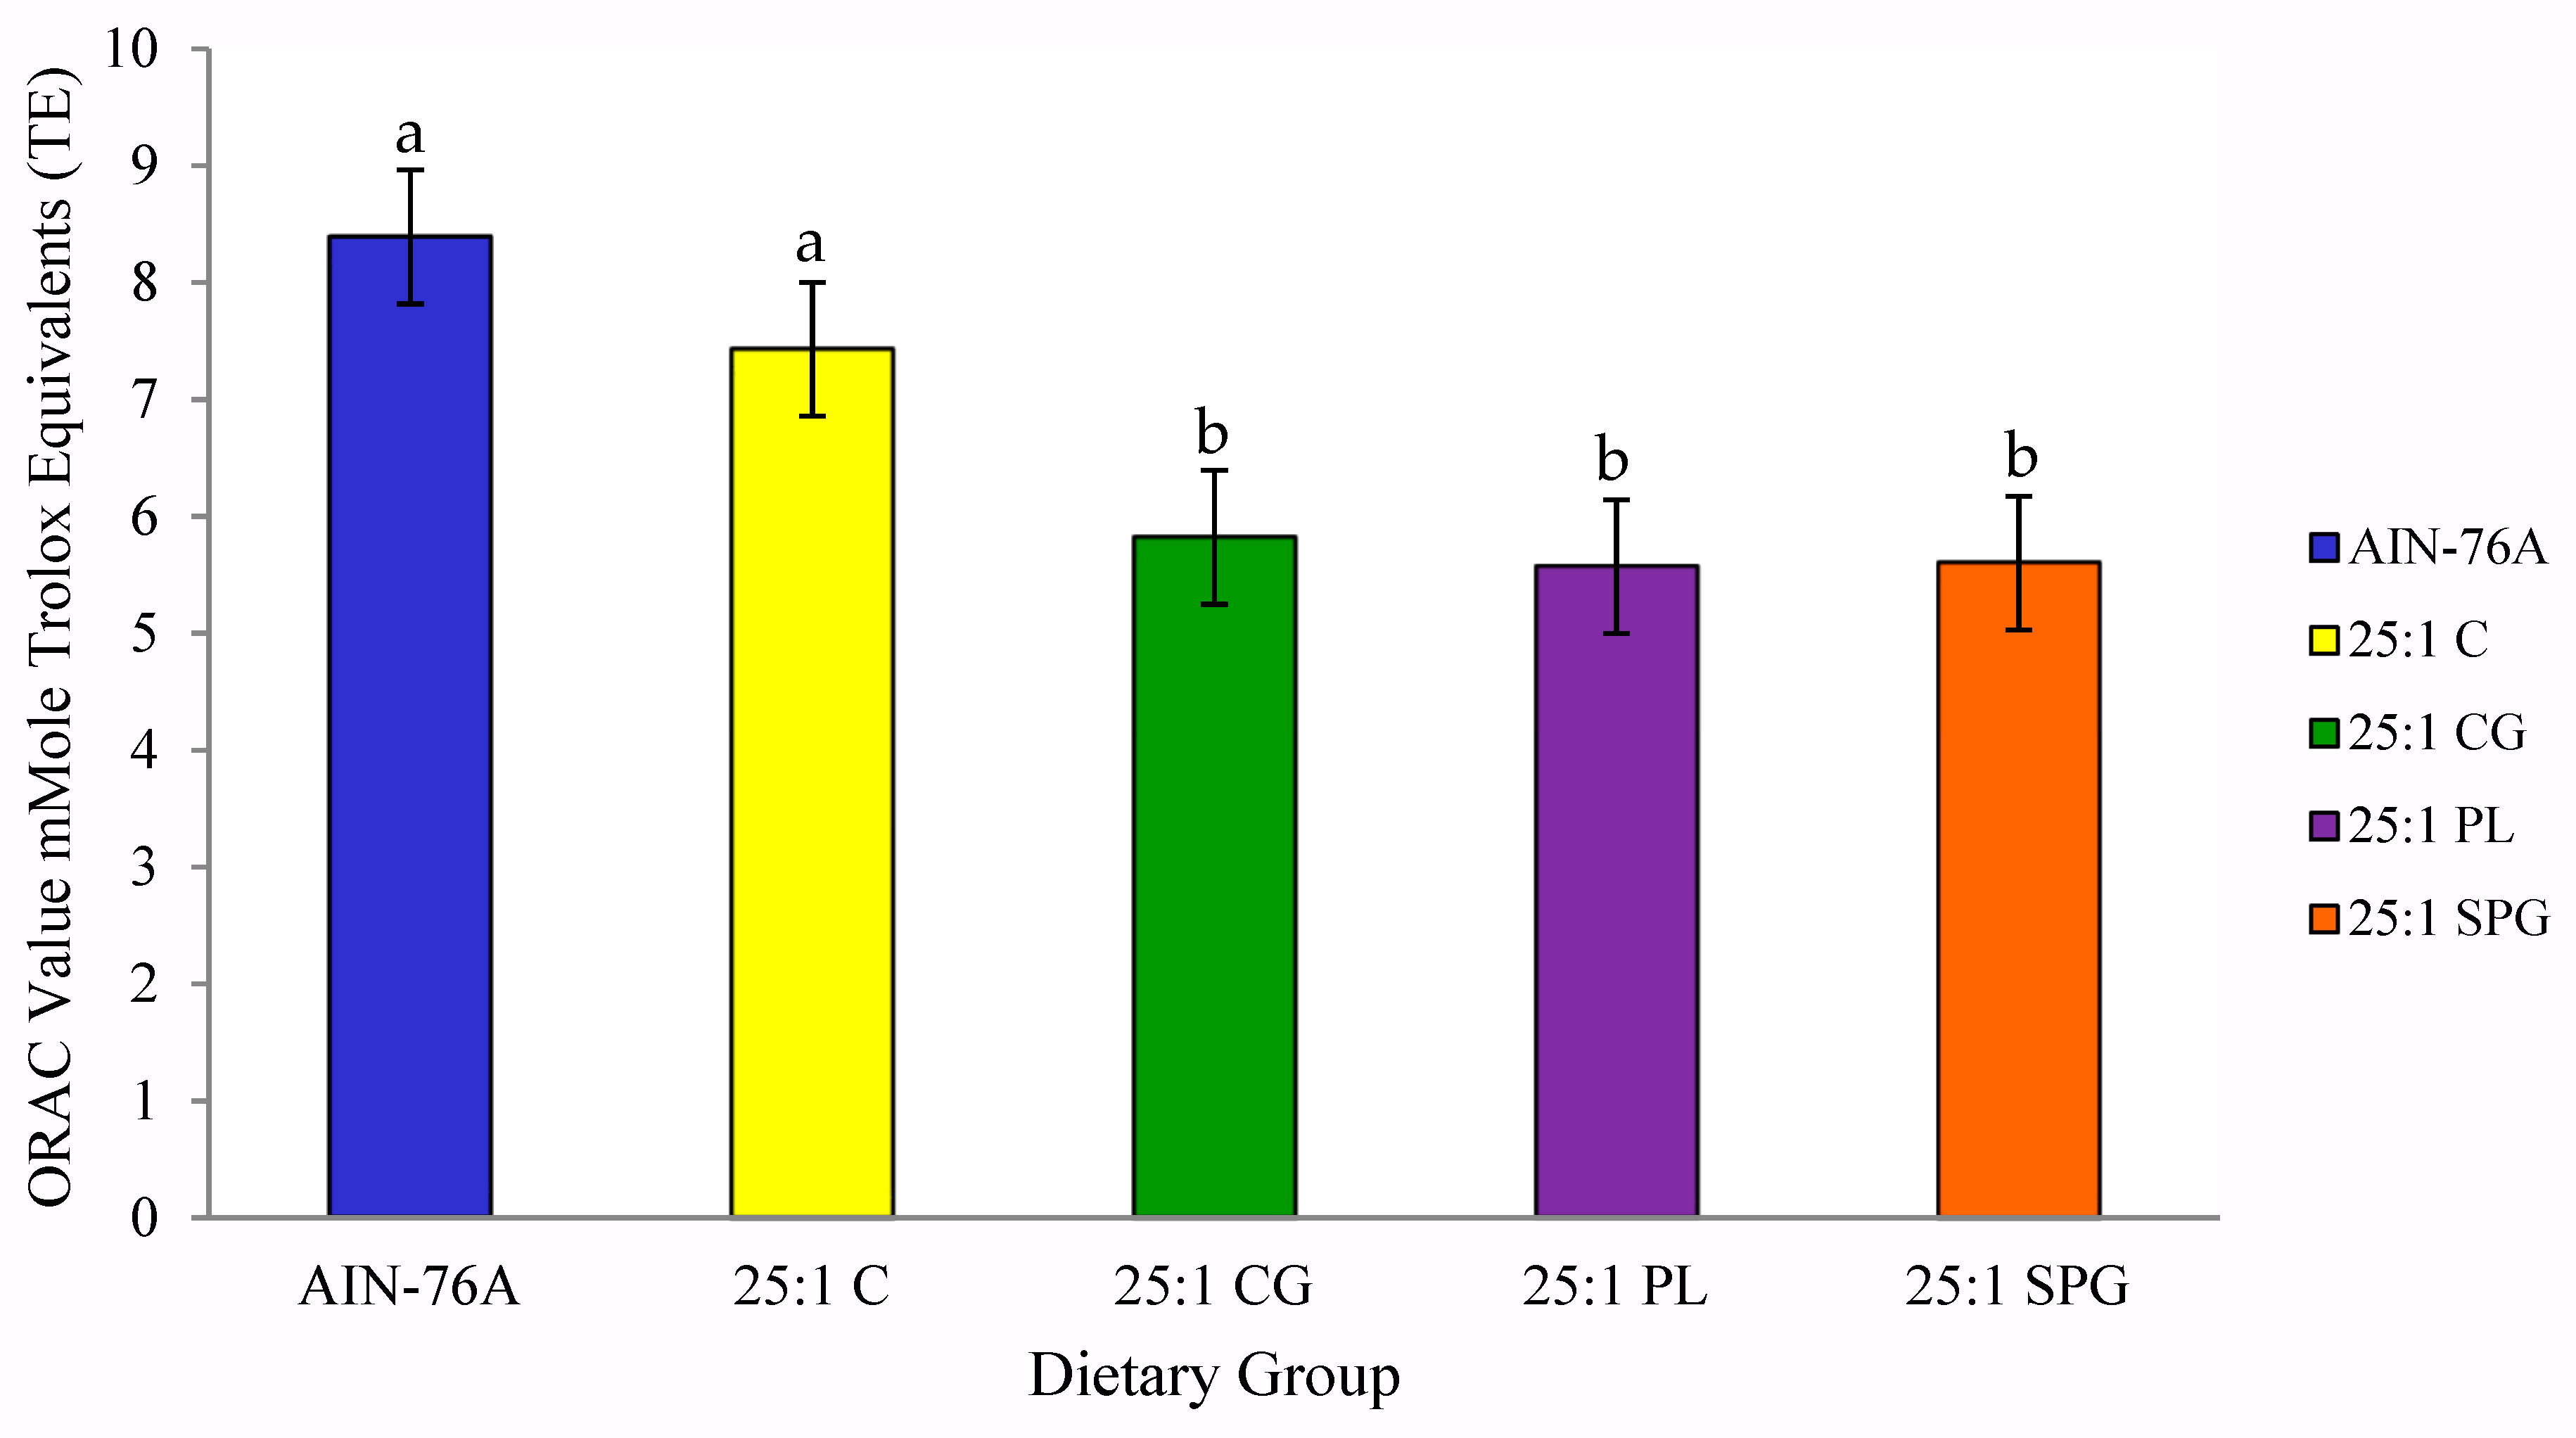
3.4. Antioxidant Capacity
3.5. Lipid Profile
4. Discussion
5. Conclusions
Author Contributions
Funding
Conflicts of Interest
References
- Benjamin, E.J.; Virani, S.S.; Callaway, C.W.; Chamberlain, A.M.; Chang, A.R.; Cheng, S.; Chiuve, S.E.; Cushman, M.; Delling, F.N.; Deo, R. Heart disease and stroke statistics—2018 update: A report from the American Heart Association. Circulation 2018, 137, e67–e492. [Google Scholar] [CrossRef] [PubMed]
- Medina-Remón, A.; Kirwan, R.; Lamuela-Raventós, R.M.; Estruch, R. Dietary patterns and the risk of obesity, type 2 diabetes mellitus, cardiovascular diseases, asthma, and neurodegenerative diseases. Crit. Rev. Food Sci. Nutr. 2018, 58, 262–296. [Google Scholar] [CrossRef] [PubMed]
- Monge, A.; Lajous, M.; Ortiz-Panozo, E.; Rodríguez, B.L.; Góngora, J.J.; López-Ridaura, R.J.N.J. Western and Modern Mexican dietary patterns are directly associated with incident hypertension in Mexican women: A prospective follow-up study. Nutr. J. 2018, 17, 21. [Google Scholar] [CrossRef] [PubMed]
- Hojhabrimanesh, A.; Akhlaghi, M.; Rahmani, E.; Amanat, S.; Atefi, M.; Najafi, M.; Hashemzadeh, M.; Salehi, S.; Faghih, S. A Western dietary pattern is associated with higher blood pressure in Iranian adolescents. Eur. J. Nutr. 2017, 56, 399–408. [Google Scholar] [CrossRef] [PubMed]
- Fanelli Kuczmarski, M.; Bodt, B.A.; Stave Shupe, E.; Zonderman, A.B.; Evans, M.K. Dietary Patterns Associated with Lower 10-Year Atherosclerotic Cardiovascular Disease Risk among Urban African-American and White Adults Consuming Western Diets. Nutrients 2018, 10, 158. [Google Scholar] [CrossRef]
- Drake, I.; Sonestedt, E.; Ericson, U.; Wallström, P.; Orho-Melander, M. A Western dietary pattern is prospectively associated with cardio-metabolic traits and incidence of the metabolic syndrome. Br. J. Nutr. 2018, 119, 1168–1176. [Google Scholar] [CrossRef] [PubMed]
- Oikonomou, E.; Psaltopoulou, T.; Georgiopoulos, G.; Siasos, G.; Kokkou, E.; Antonopoulos, A.; Vogiatzi, G.; Tsalamandris, S.; Gennimata, V.; Papanikolaou, A.; et al. Western Dietary Pattern Is Associated With Severe Coronary Artery Disease. Angiology 2018, 69, 339–346. [Google Scholar] [CrossRef]
- Simopoulos, A.P.J.B. Pharmacotherapy. Evolutionary aspects of diet, the omega-6/omega-3 ratio and genetic variation: Nutritional implications for chronic diseases. Biomed. Pharmacother. 2006, 60, 502–507. [Google Scholar] [CrossRef]
- Saini, R.K.; Keum, Y.-S. Omega-3 and omega-6 polyunsaturated fatty acids: Dietary sources, metabolism, and significance—A review. Life Sci. 2018, 203, 255–267. [Google Scholar] [CrossRef]
- Simopoulos, A. Essential fatty acids in health and chronic disease. Am. J. Clin. Nutr. 1999, 70, 560s–569s. [Google Scholar] [CrossRef]
- Simopoulos, A.P. Omega-3 fatty acids in health and disease and in growth and development. Am. J. Clin. Nutr. 1991, 54, 438–463. [Google Scholar] [CrossRef] [PubMed]
- Fedacko, J.; Vargova, V.; Singh, R.B.; Anjum, B.; Takahashi, T.; Tongnuka, M.; Dharwadkar, S.; Singh, S.; Singh, V.; Kulshresth, S.K. Association of high w-6/w-3 fatty acid ratio diet with causes of death due to noncommunicable diseases among urban decedents in North India. Open Nutr. J. 2012, 5, 113–123. [Google Scholar] [CrossRef]
- Salas-Salvadó, J.; Becerra-Tomás, N.; García-Gavilán, J.F.; Bulló, M.; Barrubés, L. Mediterranean Diet and Cardiovascular Disease Prevention: What Do We Know? Prog. Cardiovasc. Dis. 2018, 61, 62–67. [Google Scholar] [CrossRef] [PubMed]
- Schulze, M.B.; Martínez-González, M.; Fung, T.T.; Lichtenstein, A.H.; Forouhi, N.G. Food based dietary patterns and chronic disease prevention. BMJ 2018, 361. [Google Scholar] [CrossRef] [PubMed]
- Tsioufis, C. The Mediterranean and the DASH dietary patterns: Insights into their role in cardiovascular disease prevention. Hellenic. J. Cardiol. 2018, 59, 134–135. [Google Scholar] [CrossRef]
- Maddock, J.; Ziauddeen, N.; Ambrosini, G.L.; Wong, A.; Hardy, R.; Ray, S. Adherence to a Dietary Approaches to Stop Hypertension (DASH)-type diet over the life course and associated vascular function: A study based on the MRC 1946 British birth cohort. Br. J. Nutr. 2018, 119, 581–589. [Google Scholar] [CrossRef] [PubMed]
- Johnston, C.S.; Taylor, C.A.; Hampl, J.S. More Americans are eating “5 a day” but intakes of dark green and cruciferous vegetables remain low. J. Nutr. 2000, 130, 3063–3067. [Google Scholar] [CrossRef]
- Lee-Kwan, S.H.; Moore, L.V.; Blanck, H.M.; Harris, D.M.; Galuska, D. Disparities in State-Specific Adult Fruit and Vegetable Consumption—United States, 2015. MMWR 2017, 66, 1241–1247. [Google Scholar] [CrossRef]
- Adams, M.R.; Golden, D.L.; Chen, H.; Register, T.C.; Gugger, E.T. A diet rich in green and yellow vegetables inhibits atherosclerosis in mice. Food Chem. 2006, 136, 1886–1889. [Google Scholar] [CrossRef]
- Chen, G.-C.; Koh, W.-P.; Yuan, J.-M.; Qin, L.-Q.; van Dam, R.M. Green leafy and cruciferous vegetable consumption and risk of type 2 diabetes: Results from the Singapore Chinese Health Study and meta-analysis. Br. J. Nutr. 2018, 119, 1057–1067. [Google Scholar] [CrossRef]
- Mori, N.; Shimazu, T.; Charvat, H.; Mutoh, M.; Sawada, N.; Iwasaki, M.; Yamaji, T.; Inoue, M.; Goto, A.; Takachi, R.; et al. Cruciferous vegetable intake and mortality in middle-aged adults: A prospective cohort study. Clin. Nutr. 2018, 1–13. [Google Scholar] [CrossRef] [PubMed]
- Pollock, R.L. The effect of green leafy and cruciferous vegetable intake on the incidence of cardiovascular disease: A meta-analysis. JRSM Cardiovasc. Dis. 2016, 5, 1–9. [Google Scholar] [CrossRef] [PubMed]
- Huang, Z.; Wang, B.; Eaves, D.; Shikany, J.; Pace, R. Phenolic compound profile of selected vegetables frequently consumed by African Americans in the southeast United States. Food Chem. 2007, 103, 1395–1402. [Google Scholar] [CrossRef]
- Huang, Z.; Wang, B.; Eaves, D.; Shikany, J.; Pace, R.D. Total phenolics and antioxidant capacity of indigenous vegetables in the southeast United States: Alabama Collaboration for Cardiovascular Equality Project. Int. J. Food Sci. Nutr. 2009, 60, 100–108. [Google Scholar] [CrossRef] [PubMed]
- Mohamed, A.I.; Hussein, A.S. Chemical composition of purslane (Portulaca oleracea). Plant Foods Hum. Nutr. 1994, 45, 1–9. [Google Scholar] [CrossRef] [PubMed]
- Petropoulos, S.A.; Karkanis, A.; Fernandes, A.; Barros, L.; Ferreira, I.C.; Ntatsi, G.; Petrotos, K.; Lykas, C.; Khah, E. Chemical Composition and Yield of Six Genotypes of Common Purslane (Portulaca oleracea L.): An Alternative Source of Omega-3 Fatty Acids. Plant Foods Hum. Nutr. 2015, 70, 420–426. [Google Scholar] [CrossRef] [PubMed]
- Almazan, A.M.; Begum, F.; Johnson, C. Nutritional quality of sweetpotato greens from greenhouse plants. J. Food Compos. Anal. 1997, 10, 246–253. [Google Scholar] [CrossRef]
- Almazan, A.M.; Adeyeye, S.O. Fat and fatty acid concentrations in some green vegetables. J. Food Compos. Anal. 1998, 11, 375–380. [Google Scholar] [CrossRef]
- Lin, L.-Z.; Harnly, J.M. Identification of the Phenolic Components of Collard Greens, Kale, and Chinese Broccoli. Agric. Food. Chem. 2009, 57, 7401–7408. [Google Scholar] [CrossRef] [PubMed]
- Johnson, M.; Pace, R. Sweet potato leaves: Properties and synergistic interactions that promote health and prevent disease. Nutr. Rev. 2010, 68, 604–615. [Google Scholar] [CrossRef] [PubMed]
- Oduro, I.; Ellis, W.O.; Owusu, D. Nutritional potential of two leafy vegetables: Moringa oleifera and Ipomoea batatas leaves. Sci. Res. Essay 2008, 3, 57–60. [Google Scholar]
- Joshipura, K.J.; Hu, F.B.; Manson, J.E.; Stampfer, M.J.; Rimm, E.B.; Speizer, F.E.; Colditz, G.; Ascherio, A.; Rosner, B.; Spiegelman, D. The effect of fruit and vegetable intake on risk for coronary heart disease. Ann. Intern. Med. 2001, 134, 1106–1114. [Google Scholar] [CrossRef] [PubMed]
- Blekkenhorst, L.C.; Bondonno, C.P.; Lewis, J.R.; Devine, A.; Zhu, K.; Lim, W.H.; Woodman, R.J.; Beilin, L.J.; Prince, R.L.; Hodgson, J.M. Cruciferous and allium vegetable intakes are inversely associated with 15-year atherosclerotic vascular disease deaths in older adult women. J. Am. Heart Assoc. 2017, 6, e006558. [Google Scholar] [CrossRef] [PubMed]
- Blekkenhorst, L.C.; Bondonno, C.P.; Lewis, J.R.; Woodman, R.J.; Devine, A.; Bondonno, N.P.; Lim, W.H.; Zhu, K.; Beilin, L.J.; Thompson, P.L. Cruciferous and total vegetable intakes are inversely associated with subclinical atherosclerosis in older adult women. J. Am. Heart Assoc. 2018, 7, e008391. [Google Scholar] [CrossRef] [PubMed]
- Duarte, J.; Pérez-Palencia, R.; Vargas, F.; Ocete, M.A.; Pérez-Vizcaino, F.; Zarzuelo, A.; Tamargo, J. Antihypertensive effects of the flavonoid quercetin in spontaneously hypertensive rats. Br. J. Pharmacol. 2001, 133, 117–124. [Google Scholar] [CrossRef] [PubMed]
- Edwards, R.L.; Lyon, T.; Litwin, S.E.; Rabovsky, A.; Symons, J.D.; Jalili, T. Quercetin reduces blood pressure in hypertensive subjects. J. Nutr. 2007, 137, 2405–2411. [Google Scholar] [CrossRef] [PubMed]
- Larson, A.J.; Symons, J.D.; Jalili, T. Therapeutic Potential of Quercetin to Decrease Blood Pressure: Review of Efficacy and Mechanisms. Adv. Nutr. 2012, 3, 39–46. [Google Scholar] [CrossRef]
- Serban, M.C.; Sahebkar, A.; Zanchetti, A.; Mikhailidis, D.P.; Howard, G.; Antal, D.; Andrica, F.; Ahmed, A.; Aronow, W.S.; Muntner, P. Effects of quercetin on blood pressure: A systematic review and meta-analysis of randomized controlled trials. J. Am. Heart Assoc. 2016, 5, e002713. [Google Scholar] [CrossRef]
- Delgado, C.; Chertow, G.M.; Kaysen, G.A.; Dalrymple, L.S.; Kornak, J.; Grimes, B.; Johansen, K.L. Associations of Body Mass Index and Body Fat With Markers of Inflammation and Nutrition Among Patients Receiving Hemodialysis. Am. J. Kidney Dis. 2017, 70, 817–825. [Google Scholar] [CrossRef]
- Han, S.J.; Boyko, E.J.; Fujimoto, W.Y.; Kahn, S.E.; Leonetti, D.L. Low Plasma Adiponectin Concentrations Predict Increases in Visceral Adiposity and Insulin Resistance. J. Clin. Endocrinol. Metab. 2017, 102, 4626–4633. [Google Scholar] [CrossRef]
- Peri-Okonny, P.; Ayers, C.; Maalouf, N.; Das, S.R.; de Lemos, J.A.; Berry, J.D.; Turer, A.T.; Neeland, I.J.; Scherer, P.E.; Vongpatanasin, W. Adiponectin protects against incident hypertension independent of body fat distribution: Observations from the Dallas Heart Study. Diabetes Metab. Res. Rev. 2017, 33, e2840. [Google Scholar] [CrossRef] [PubMed]
- Kyrou, I.; Tsantarlioti, O.; Panagiotakos, D.B.; Tsigos, C.; Georgousopoulou, E.; Chrysohoou, C.; Skoumas, I.; Tousoulis, D.; Stefanadis, C.; Pitsavos, C. Adiponectin circulating levels and 10-year (2002–2012) cardiovascular disease incidence: The ATTICA Study. Endocrine 2017, 58, 542–552. [Google Scholar] [CrossRef] [PubMed]
- Furuhashi, M.; Ura, N.; Higashiura, K.; Murakami, H.; Tanaka, M.; Moniwa, N.; Yoshida, D.; Shimamoto, K. Blockade of the renin-angiotensin system increases adiponectin concentrations in patients with essential hypertension. Hypertens 2003, 42, 76–81. [Google Scholar] [CrossRef] [PubMed]
- Cnop, M.; Havel, P.J.; Utzschneider, K.M.; Carr, D.B.; Sinha, M.K.; Boyko, E.J.; Retzlaff, B.M.; Knopp, R.H.; Brunzell, J.D.; Kahn, S.E. Relationship of adiponectin to body fat distribution, insulin sensitivity and plasma lipoproteins: Evidence for independent roles of age and sex. Diabetologia 2003, 46, 459–469. [Google Scholar] [CrossRef] [PubMed]
- Dehghan, F.; Soori, R.; Gholami, K.; Abolmaesoomi, M.; Yusof, A.; Muniandy, S.; Heidarzadeh, S.; Farzanegi, P.; Ali azarbayjani, M. Purslane (Portulaca oleracea) Seed Consumption And Aerobic Training Improves Biomarkers Associated with Atherosclerosis in Women with Type 2 Diabetes (T2D). Sci. Rep. 2016, 6, 37819. [Google Scholar] [CrossRef] [PubMed]
- Nazeam, J.A.; El-Hefnawy, H.M.; Omran, G.; Singab, A.-N. Chemical profile and antihyperlipidemic effect of Portulaca oleracea L. seeds in streptozotocin-induced diabetic rats. Nat. Prod. Res. 2018, 32, 1484–1488. [Google Scholar] [CrossRef] [PubMed]
- Soori, R.; Shahedi, V.; Akbarnejad, A.; Choobineh, S. Biochemical changes in oxidative stress markers following endurance training and consumption of purslane seed in rats with hydrogen peroxide-induced toxicity. Sport Sci. Health 2018, 1–7. [Google Scholar] [CrossRef]
- Hussein, M.A. Purslane extract effects on obesity-induced diabetic rats fed a high-fat diet. Malaysian J. Nutr. 2010, 16, 419–429. [Google Scholar]
- Gray, B.; Steyn, F.; Davies, P.S.W.; Vitetta, L. Omega-3 fatty acids: A review of the effects on adiponectin and leptin and potential implications for obesity management. Eur. J. Clin. Nutr. 2013, 67, 1234–1242. [Google Scholar] [CrossRef]
- DeClercq, V.; d'Eon, B.; McLeod, R.S. Fatty acids increase adiponectin secretion through both classical and exosome pathways. Biochim. Biophys. Acta Mol. Cell. Biol. Lipids 2015, 1851, 1123–1133. [Google Scholar] [CrossRef]
- Simopoulos, A. An Increase in the Omega-6/Omega-3 Fatty Acid Ratio Increases the Risk for Obesity. Nutrients 2016, 8, 128. [Google Scholar] [CrossRef] [PubMed]
- Hu, E.; Liang, P.; Spiegelman, B.M. AdipoQ Is a Novel Adipose-specific Gene Dysregulated in Obesity. J. Biol. Chem. 1996, 271, 10697–10703. [Google Scholar] [CrossRef] [PubMed]
- Asayama, K.; Hayashibe, H.; Dobashi, K.; Uchida, N.; Nakane, T.; Kodera, K.; Shirahata, A.; Taniyama, M. Decrease in serum adiponectin level due to obesity and visceral fat accumulation in children. Obes. Res. 2003, 11, 1072–1079. [Google Scholar] [CrossRef]
- Fontana, L.; Eagon, J.C.; Trujillo, M.E.; Scherer, P.E.; Klein, S. Visceral fat adipokine secretion is associated with systemic inflammation in obese humans. Diabetes 2007, 56, 1010–1013. [Google Scholar] [CrossRef] [PubMed]
- Esposito, K.; Nappo, F.; Giugliano, F.; Di Palo, C.; Ciotola, M.; Barbieri, M.; Paolisso, G.; Giugliano, D. Meal modulation of circulating interleukin 18 and adiponectin concentrations in healthy subjects and in patients with type 2 diabetes mellitus. Am. J. Clin. Nutr. 2003, 78, 1135–1140. [Google Scholar] [CrossRef] [PubMed]
- Pischon, T.; Girman, C.J.; Rifai, N.; Hotamisligil, G.S.; Rimm, E.B. Association between dietary factors and plasma adiponectin concentrations in men. Am. J. Clin. Nutr. 2005, 81, 780–786. [Google Scholar] [CrossRef] [PubMed]
- Peake, P.W.; Kriketos, A.D.; Denyer, G.S.; Campbell, L.V.; Charlesworth, J.A. The postprandial response of adiponectin to a high-fat meal in normal and insulin-resistant subjects. Int. J. Obes. 2003, 27, 657–662. [Google Scholar] [CrossRef]
- Lithander, F.E.; Keogh, G.F.; Wang, Y.; Cooper, G.J.S.; Mulvey, T.B.; Chan, Y.-K.; McArdle, B.H.; Poppitt, S.D. No evidence of an effect of alterations in dietary fatty acids on fasting adiponectin over 3 weeks. Obesity 2008, 16, 592–599. [Google Scholar] [CrossRef]
- Huang, T.; Tobias, D.K.; Hruby, A.; Rifai, N.; Tworoger, S.S.; Hu, F.B. An Increase in Dietary Quality Is Associated with Favorable Plasma Biomarkers of the Brain-Adipose Axis in Apparently Healthy US Women. J. Nutr. 2016, 146, 1101–1108. [Google Scholar] [CrossRef]
- Suzuki, K.; Inoue, T.; Hashimoto, S.; Ochiai, J.; Kusuhara, Y.; Ito, Y.; Hamajima, N.J. Association of serum carotenoids with high molecular weight adiponectin and inflammation markers among Japanese subjects. Clin. Chim. Acta 2010, 411, 1330–1334. [Google Scholar] [CrossRef]
- Saura-Calixto, F. Dietary fiber as a carrier of dietary antioxidants: An essential physiological function. J. Agric. Food Chem. 2010, 59, 43–49. [Google Scholar] [CrossRef] [PubMed]
- Ntalla, I.; Dedoussis, G.; Yannakoulia, M.; Smart, M.C.; Louizou, E.; Sakka, S.D.; Papoutsakis, C.; Talmud, P. ADIPOQ gene polymorphism rs1501299 interacts with fibre intake to affect adiponectin concentration in children: The GENe–Diet Attica Investigation on childhood obesity. Eur. J. Nutr. 2009, 48, 493. [Google Scholar] [CrossRef] [PubMed]
- Hermsdorff, H.H.M.; Puchau, B.; Volp, A.C.P.; Barbosa, K.B.F.; Bressan, J.; Zulet, M.Á.; Martínez, J.A. Dietary total antioxidant capacity is inversely related to central adiposity as well as to metabolic and oxidative stress markers in healthy young adults. Nutr. Metab. 2011, 8, 59. [Google Scholar] [CrossRef] [PubMed]
- Devaraj, S.; Torok, N.; Dasu, M.R.; Samols, D.; Jialal, I. Adiponectin decreases C-reactive protein synthesis and secretion from endothelial cells: Evidence for an adipose tissue-vascular loop. Arterioscler. Thromb. Vasc. Biol. 2008, 28, 1368–1374. [Google Scholar] [CrossRef] [PubMed]
- Detopoulou, P.; Panagiotakos, D.; Chrysohoou, C.; Fragopoulou, E.; Nomikos, T.; Antonopoulou, S.; Pitsavos, C.; Stefanadis, C. Dietary antioxidant capacity and concentration of adiponectin in apparently healthy adults: The ATTICA study. Eur. J. Clin. Nutr. 2010, 64, 161. [Google Scholar] [CrossRef] [PubMed]
- Franzini, L.; Ardigo, D.; Valtuena, S.; Pellegrini, N.; Del Rio, D.; Bianchi, M.; Scazzina, F.; Piatti, P.; Brighenti, F.; Zavaroni, I. Food selection based on high total antioxidant capacity improves endothelial function in a low cardiovascular risk population. Nutr. Metab. Cardiovasc. Dis. 2012, 22, 50–57. [Google Scholar] [CrossRef]
- Kamigaki, M.; Sakaue, S.; Tsujino, I.; Ohira, H.; Ikeda, D.; Itoh, N.; Ishimaru, S.; Ohtsuka, Y.; Nishimura, M. Oxidative stress provokes atherogenic changes in adipokine gene expression in 3T3-L1 adipocytes. Biochem. Biophys. Res. Commun. 2006, 339, 624–632. [Google Scholar] [CrossRef]
- D’Archivio, M.; Filesi, C.; Di Benedetto, R.; Gargiulo, R.; Giovannini, C.; Masella, R. Polyphenols, dietary sources and bioavailability. Ann. Ist. Super Sanità 2007, 43, 348. [Google Scholar]
- D’Archivio, M.; Filesi, C.; Varì, R.; Scazzocchio, B.; Masella, R. Bioavailability of the polyphenols: Status and controversies. Int. J. Mol. Sci. 2010, 11, 1321–1342. [Google Scholar] [CrossRef]
- Kahlon, T.; Chapman, M.; Smith, G. In vitro binding of bile acids by spinach, kale, brussels sprouts, broccoli, mustard greens, green bell pepper, cabbage and collards. Food Chem. 2007, 100, 1531–1536. [Google Scholar] [CrossRef]
- Kahlon, T.S.; Chiu, M.-C.M.; Chapman, M.H. Steam cooking significantly improves in vitro bile acid binding of collard greens, kale, mustard greens, broccoli, green bell pepper, and cabbage. Nutr. Res. 2008, 28, 351–357. [Google Scholar] [CrossRef] [PubMed]
- Innami, S.; Tabata, K.; Shimizu, J.; Kusunoki, K.; Ishida, H.; Matsuguma, M.; Wada, M.; Sugiyama, N.; Kondo, M. Dried green leaf powders of Jew‘s mellow (Corchorus), persimmon (Diosphyros kaki) and sweet potato (Ipomoea batatas poir) lower hepatic cholesterol concentration and increase fecal bile acid excretion in rats fed a cholesterol-free diet. Plant Foods Hum. Nutr. 1998, 52, 55–66. [Google Scholar] [CrossRef] [PubMed]
- Sadakane, A.; Tsutsumi, A.; Gotoh, T.; Ishikawa, S.; Ojima, T.; Kario, K.; Nakamura, Y.; Kayaba, K. Dietary patterns and levels of blood pressure and serum lipidsin a japanese population. J. Epiddemiol. 2008, 18, 58–67. [Google Scholar] [CrossRef]
- Gallaher, D.D.; Hassel, C.A.; Lee, K.-J.; Gallaher, C.M. Viscosity and fermentability as attributes of dietary fiber responsible for the hypocholesterolemic effect in hamsters. J. Nutr. 1993, 123, 244–252. [Google Scholar] [PubMed]
- Brown, L.; Rosner, B.; Willett, W.W.; Sacks, F.M. Cholesterol-lowering effects of dietary fiber: A meta-analysis. Am. J. Clin. Nutr. 1999, 69, 30–42. [Google Scholar] [CrossRef] [PubMed]
- Estruch, R.; Martínez-González, M.A.; Corella Piquer, D.; Basora-Gallisá, J.; Ruiz-Gutiérrez, V.; Covas Planells, M.I.; Fiol Sala, M.; Gómez Gracia, E.; López Sabater, M.C. Effects of dietary fibre intake on risk factors for cardiovascular disease in subjects at high risk. J. Epidemiol. Community Health 2009, 63, 582–588. [Google Scholar] [CrossRef]
- Anderson, J.W.; Baird, P.; Davis, R.H.; Ferreri, S.; Knudtson, M.; Koraym, A.; Waters, V.; Williams, C.L. Health benefits of dietary fiber. Nutr. Rev. 2009, 67, 188–205. [Google Scholar] [CrossRef]
- Jacobs, D.R., Jr.; Mebane, I.L.; Bangdiwala, S.I.; Criqui, M.H.; Tyroler, H.A. High density lipoprotein cholesterol as a predictor of cardiovascular disease mortality in men and women: The follow-up study of the Lipid Research Clinics Prevalence Study. Am. J. Epidemiol. 1990, 131, 32–47. [Google Scholar] [CrossRef]
- Johnson, M.; Pace, R.D.; McElhenney, W. Green leafy vegetables in diets with a 25:1 omega-6/omega-3 fatty acid ratio modify the erythrocyte fatty acid profile of spontaneously hypertensive rats. Lipids Health Dis. 2018, 17, 140. [Google Scholar] [CrossRef]
- Balk, E.; Lichtenstein, A.H.; Chung, M.; Kupelnick, B.; Chew, P.; Lau, J. Effects of omega-3 fatty acids on serum markers of cardiovascular disease risk: A systematic review. Atherosclerosis 2006, 189, 19–30. [Google Scholar] [CrossRef]
- Harris, W.S.; Miller, M.; Tighe, A.P.; Davidson, M.H.; Schaefer, E.J. Omega-3 fatty acids and coronary heart disease risk: Clinical and mechanistic perspectives. Atherosclerosis 2008, 197, 12–24. [Google Scholar] [CrossRef] [PubMed]
- Lundberg, J.O.; Carlström, M.; Weitzberg, E. Metabolic effects of dietary nitrate in health and disease. Cell Metab. 2018, 28, 9–22. [Google Scholar] [CrossRef] [PubMed]
- van Breda, S.G.J.; de Kok, T.M.C.M. Smart Combinations of Bioactive Compounds in Fruits and Vegetables May Guide New Strategies for Personalized Prevention of Chronic Diseases. Mol. Nutr. Food Res. 2018, 62, 1700597. [Google Scholar] [CrossRef] [PubMed]
- Hadi, A.; Pourmasoumi, M.; Najafgholizadeh, A.; Kafeshani, M.; Sahebkar, A. Effect of purslane on blood lipids and glucose: A systematic review and meta-analysis of randomized controlled trials. Phytother. Res. 2019, 33, 3–12. [Google Scholar] [CrossRef] [PubMed]
- Sun, H.; Mu, B.; Song, Z.; Ma, Z.; Mu, T. The In Vitro Antioxidant Activity and Inhibition of Intracellular Reactive Oxygen Species of Sweet Potato Leaf Polyphenols. Oxid. Med. Cell Longev. 2018, 2018. [Google Scholar] [CrossRef] [PubMed]
- Mozaffarian, D.; Wu, J.H.Y. Omega-3 Fatty Acids and Cardiovascular Disease: Effects on Risk Factors, Molecular Pathways, and Clinical Events. J. Am. Coll. Cardiol. 2011, 58, 2047–2067. [Google Scholar] [CrossRef]
- Trayhurn, P.; Wood, I.S. Adipokines: Inflammation and the pleiotropic role of white adipose tissue. Br. J. Nutr. 2004, 92, 347–355. [Google Scholar] [CrossRef]


| Ingredient (%) | Dietary Group * | ||||
|---|---|---|---|---|---|
| AIN-76A | Control | CG | PL | SPG | |
| Sucrose | 50.00 | 41.96 | 39.27 | 39.49 | 39.39 |
| Casein (Vitamin Free) | 20.00 | 18.00 | 16.82 | 16.53 | 16.68 |
| Corn Starch | 15.00 | 15.00 | 15.00 | 15.00 | 15.00 |
| Powdered Cellulose | 5.00 | 5.00 | 5.00 | 5.00 | 5.00 |
| AIN-76 Mineral Mix | 3.50 | 3.50 | 3.50 | 3.50 | 3.50 |
| AIN-76 Vitamin Mix | 1.00 | 1.00 | 1.00 | 1.00 | 1.00 |
| DL-Methionine | 0.30 | 0.30 | 0.30 | 0.30 | 0.30 |
| Choline Bitartrate | 0.20 | 0.20 | 0.20 | 0.20 | 0.20 |
| Ethoxyquin † | 0.00 | 0.00 | 0.00 | 0.00 | 0.00 |
| Corn Oil | 5.00 | 12.06 | 11.96 | 12.01 | 11.97 |
| Soybean oil | 2.91 | 2.88 | 2.89 | 2.89 | |
| Fish Oil | |||||
| Cholesterol | 0.07 | 0.07 | 0.07 | 0.07 | |
| Collard Greens | 4.00 | ||||
| Purslane | 4.00 | ||||
| Sweetpotato Greens | 4.00 | ||||
| Nutrient | Dietary Group | ||||
|---|---|---|---|---|---|
| AIN-76A | Control | CG | PL | SPG | |
| Energy, kcal/100 g | 370 | 436 | 441 | 436 | 438 |
| Carbohydrates, % | 66.10 | 60.30 | 60.30 | 61.70 | 61.90 |
| Protein, % | 17.20 | 15.70 | 16.30 | 15.20 | 15.30 |
| Total dietary fiber, % | 5.95 | 5.62 | 7.20 | 7.41 | 7.45 |
| Moisture, % | 10.00 | 6.86 | 5.56 | 5.55 | 5.49 |
| Ash, % | 2.57 | 2.53 | 2.93 | 3.25 | 2.96 |
| Total Fat, g/100g | 4.10 | 14.70 | 14.90 | 14.20 | 14.30 |
| SFAs | 0.66 | 2.19 | 2.25 | 2.25 | 2.75 |
| MUFAs | 1.17 | 4.03 | 3.91 | 3.61 | 3.20 |
| PUFAs | 1.97 | 7.47 | 7.40 | 6.81 | 7.39 |
| TFAs | 0.05 | 0.16 | 0.50 | 0.82 | 0.09 |
| Linoleic acid, % | 49.40 | 51.20 | 49.30 | 46.6 | 39.10 |
| Arachidonic acid, % | <0.10 | <0.10 | <0.10 | <0.10 | 0.31 |
| α-Linolenic acid, % | 1.08 | 2.27 | 2.55 | 2.76 | 5.81 |
| Eicosapentaenoic acid, % | <0.10 | <0.10 | <0.10 | <0.10 | 3.68 |
| Docosahexaenoic acid, % | <0.10 | <0.10 | <0.10 | 0.21 | 1.69 |
| Dietary Group | Initial Dietary Intake (g) | Final Dietary Intake (g) | Total Dietary Intake (g) | Baseline Weight (g) | Initial Body Weight (g) | Final Body Weight (g) |
|---|---|---|---|---|---|---|
| AIN-76A | 11.8 ± 0.4 a | 13.8 ± 1.6 a | 81.5 ± 3.3 a | 65.3 ± 5.0 a | 147.1 ± 8.0 a | 252.9 ± 9.1 a |
| Control | 11.7 ± 0.3 a | 13.6 ± 1.6 a | 80.4 ± 3.5 a | 66.4 ± 6.7 a | 146.5 ± 9.6 a | 284.7 ± 13.2 b |
| CG | 11.9 ± 0.4 a | 13.8 ± 1.6 a | 81.5 ± 3.4 a | 63.5 ± 8.0 a | 149.2 ± 11.9 a | 290.8 ± 9.9 b |
| PL | 11.6 ± 0.6 a | 14.1 ± 1.6 a | 80.6 ± 4.8 a | 60.9 ± 6.9 a | 143.5 ± 11.4 a | 285.6 ± 16.2 b |
| SPG | 11.8 ± 0.4 a | 13.9 ± 1.5 a | 81.0 ± 3.7 a | 65.8 ± 8.2 a | 148.7 ± 10.0 a | 285.3 ± 11.9 b |
| Variable | Dietary Group | ||||
|---|---|---|---|---|---|
| AIN-76A | Control | CG | PL | SPG | |
| APN (μg/mL) | 43.0 ± 1.7 a | 38.6 ± 1.6 ab | 35.1 ± 2.3 abc | 29.5 ± 2.8 c | 31.5 ± 4.0 bc |
| hsCRP (μg/mL) | 397.0 ± 52.5 a | 1092.2 ± 168.2 b | 1164.0 ± 209.2 b | 1452.0 ± 302.0 b | 1084.2 ± 87.9 b |
| Variable | Dietary Group | ||||
|---|---|---|---|---|---|
| AIN-76A | Control | CG | PL | SPG | |
| TAG (mg/dL) | 150.1 ± 7.2 a | 97.0 ± 4.2 c | 92.2 ± 7.3 c | 113.0 ± 4.0 bc | 118.4 ± 12.6 b |
| TC (mg/dL) | 75.5 ± 11.8 a | 64.1 ± 2.8 a | 62.5 ± 3.1 a | 61.6 ± 2.5 a | 58.0 ± 2.3 a |
| HDL-C (mg/dL) | 39.2 ± 2.5 a | 33.7 ± 2.6 a | 38.7 ± 1.9 a | 41.3 ± 1.3 a | 19.4 ± 6.6 b |
| LDL-C + VLDL-C (mg/dL) | 10.5 ± 3.6 a | 15.1 ± 1.2 a | 12.6 ± 1.5 a | 10.5 ± 0.6 a | 11.2 ± 0.98 a |
© 2019 by the authors. Licensee MDPI, Basel, Switzerland. This article is an open access article distributed under the terms and conditions of the Creative Commons Attribution (CC BY) license (http://creativecommons.org/licenses/by/4.0/).
Share and Cite
Johnson, M.; McElhenney, W.H.; Egnin, M. Influence of Green Leafy Vegetables in Diets with an Elevated ω-6:ω-3 Fatty Acid Ratio on Rat Blood Pressure, Plasma Lipids, Antioxidant Status and Markers of Inflammation. Nutrients 2019, 11, 301. https://doi.org/10.3390/nu11020301
Johnson M, McElhenney WH, Egnin M. Influence of Green Leafy Vegetables in Diets with an Elevated ω-6:ω-3 Fatty Acid Ratio on Rat Blood Pressure, Plasma Lipids, Antioxidant Status and Markers of Inflammation. Nutrients. 2019; 11(2):301. https://doi.org/10.3390/nu11020301
Chicago/Turabian StyleJohnson, Melissa, Wendell H. McElhenney, and Marceline Egnin. 2019. "Influence of Green Leafy Vegetables in Diets with an Elevated ω-6:ω-3 Fatty Acid Ratio on Rat Blood Pressure, Plasma Lipids, Antioxidant Status and Markers of Inflammation" Nutrients 11, no. 2: 301. https://doi.org/10.3390/nu11020301
APA StyleJohnson, M., McElhenney, W. H., & Egnin, M. (2019). Influence of Green Leafy Vegetables in Diets with an Elevated ω-6:ω-3 Fatty Acid Ratio on Rat Blood Pressure, Plasma Lipids, Antioxidant Status and Markers of Inflammation. Nutrients, 11(2), 301. https://doi.org/10.3390/nu11020301