Effects of Glycemic Index and Cereal Fiber on Postprandial Endothelial Function, Glycemia, and Insulinemia in Healthy Adults

 and
and
Abstract
1. Introduction
2. Materials and Methods
2.1. Participants
2.2. Study Design
2.3. Meals
2.4. Measurements
2.4.1. Anthropometrics and Body Composition
2.4.2. Flow-Mediated Dilation (FMD)
2.4.3. Blood Analyses
2.4.4. Statistical Analyses
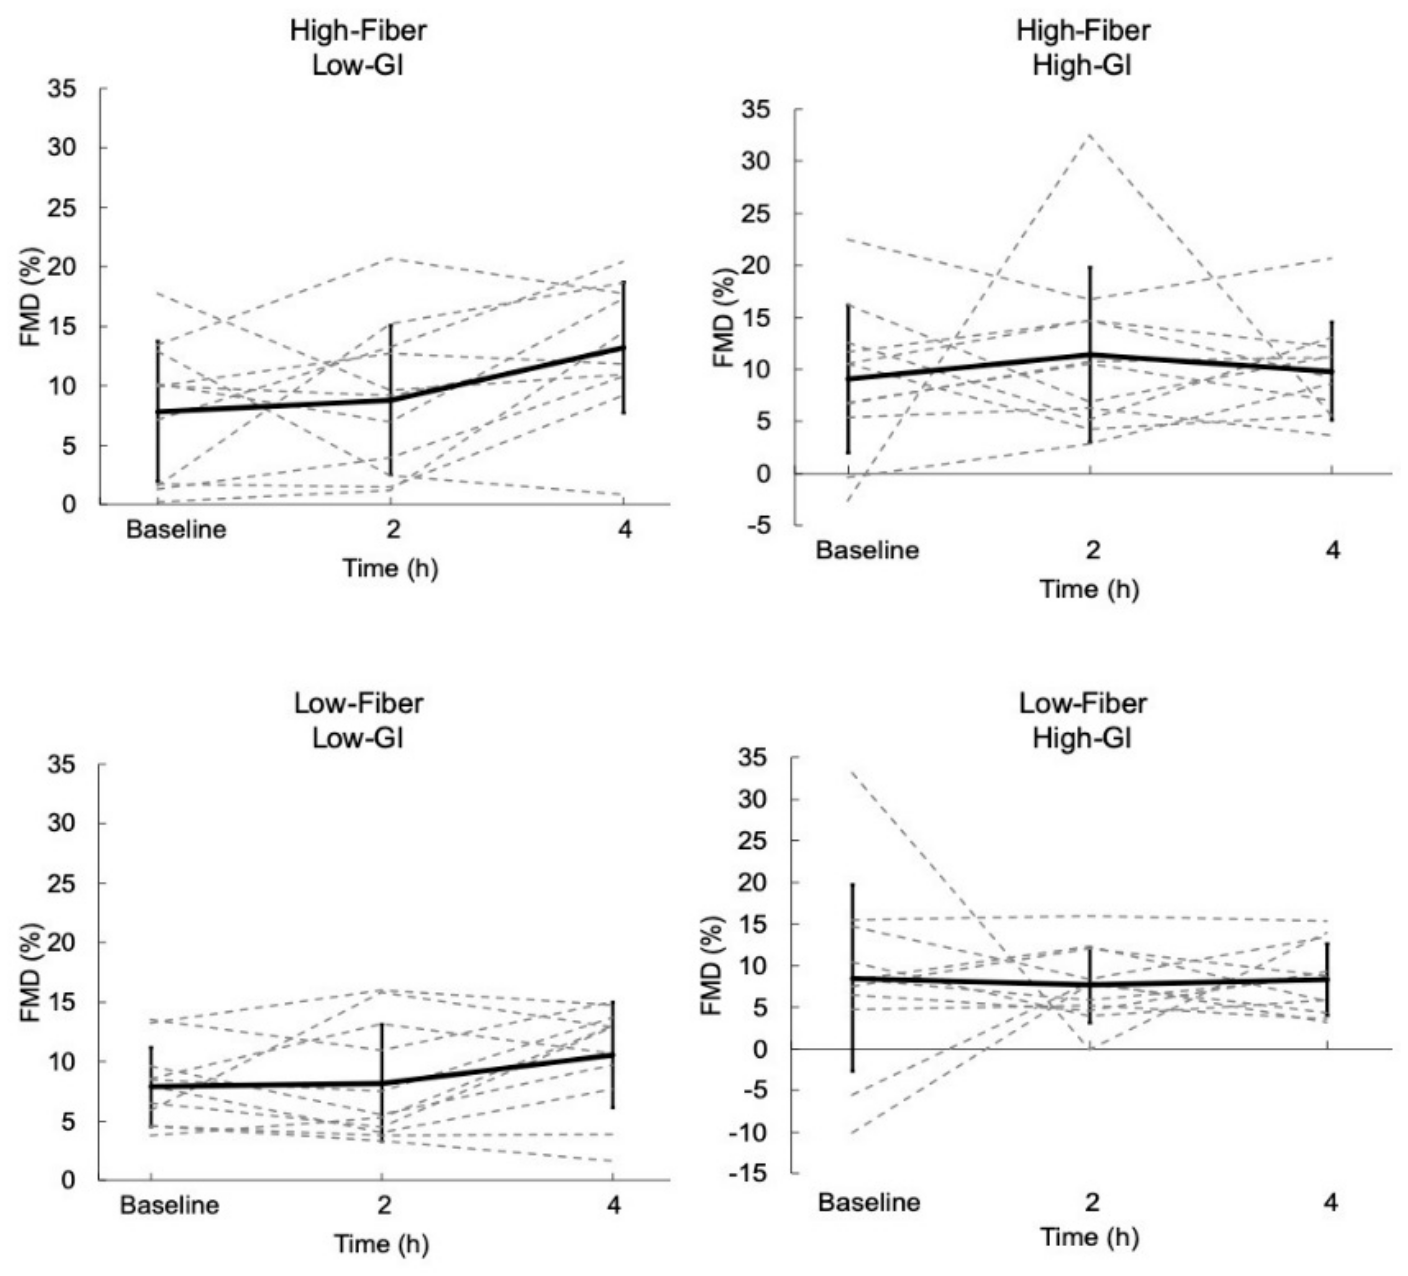
2-h and 4-h Changes in FMD
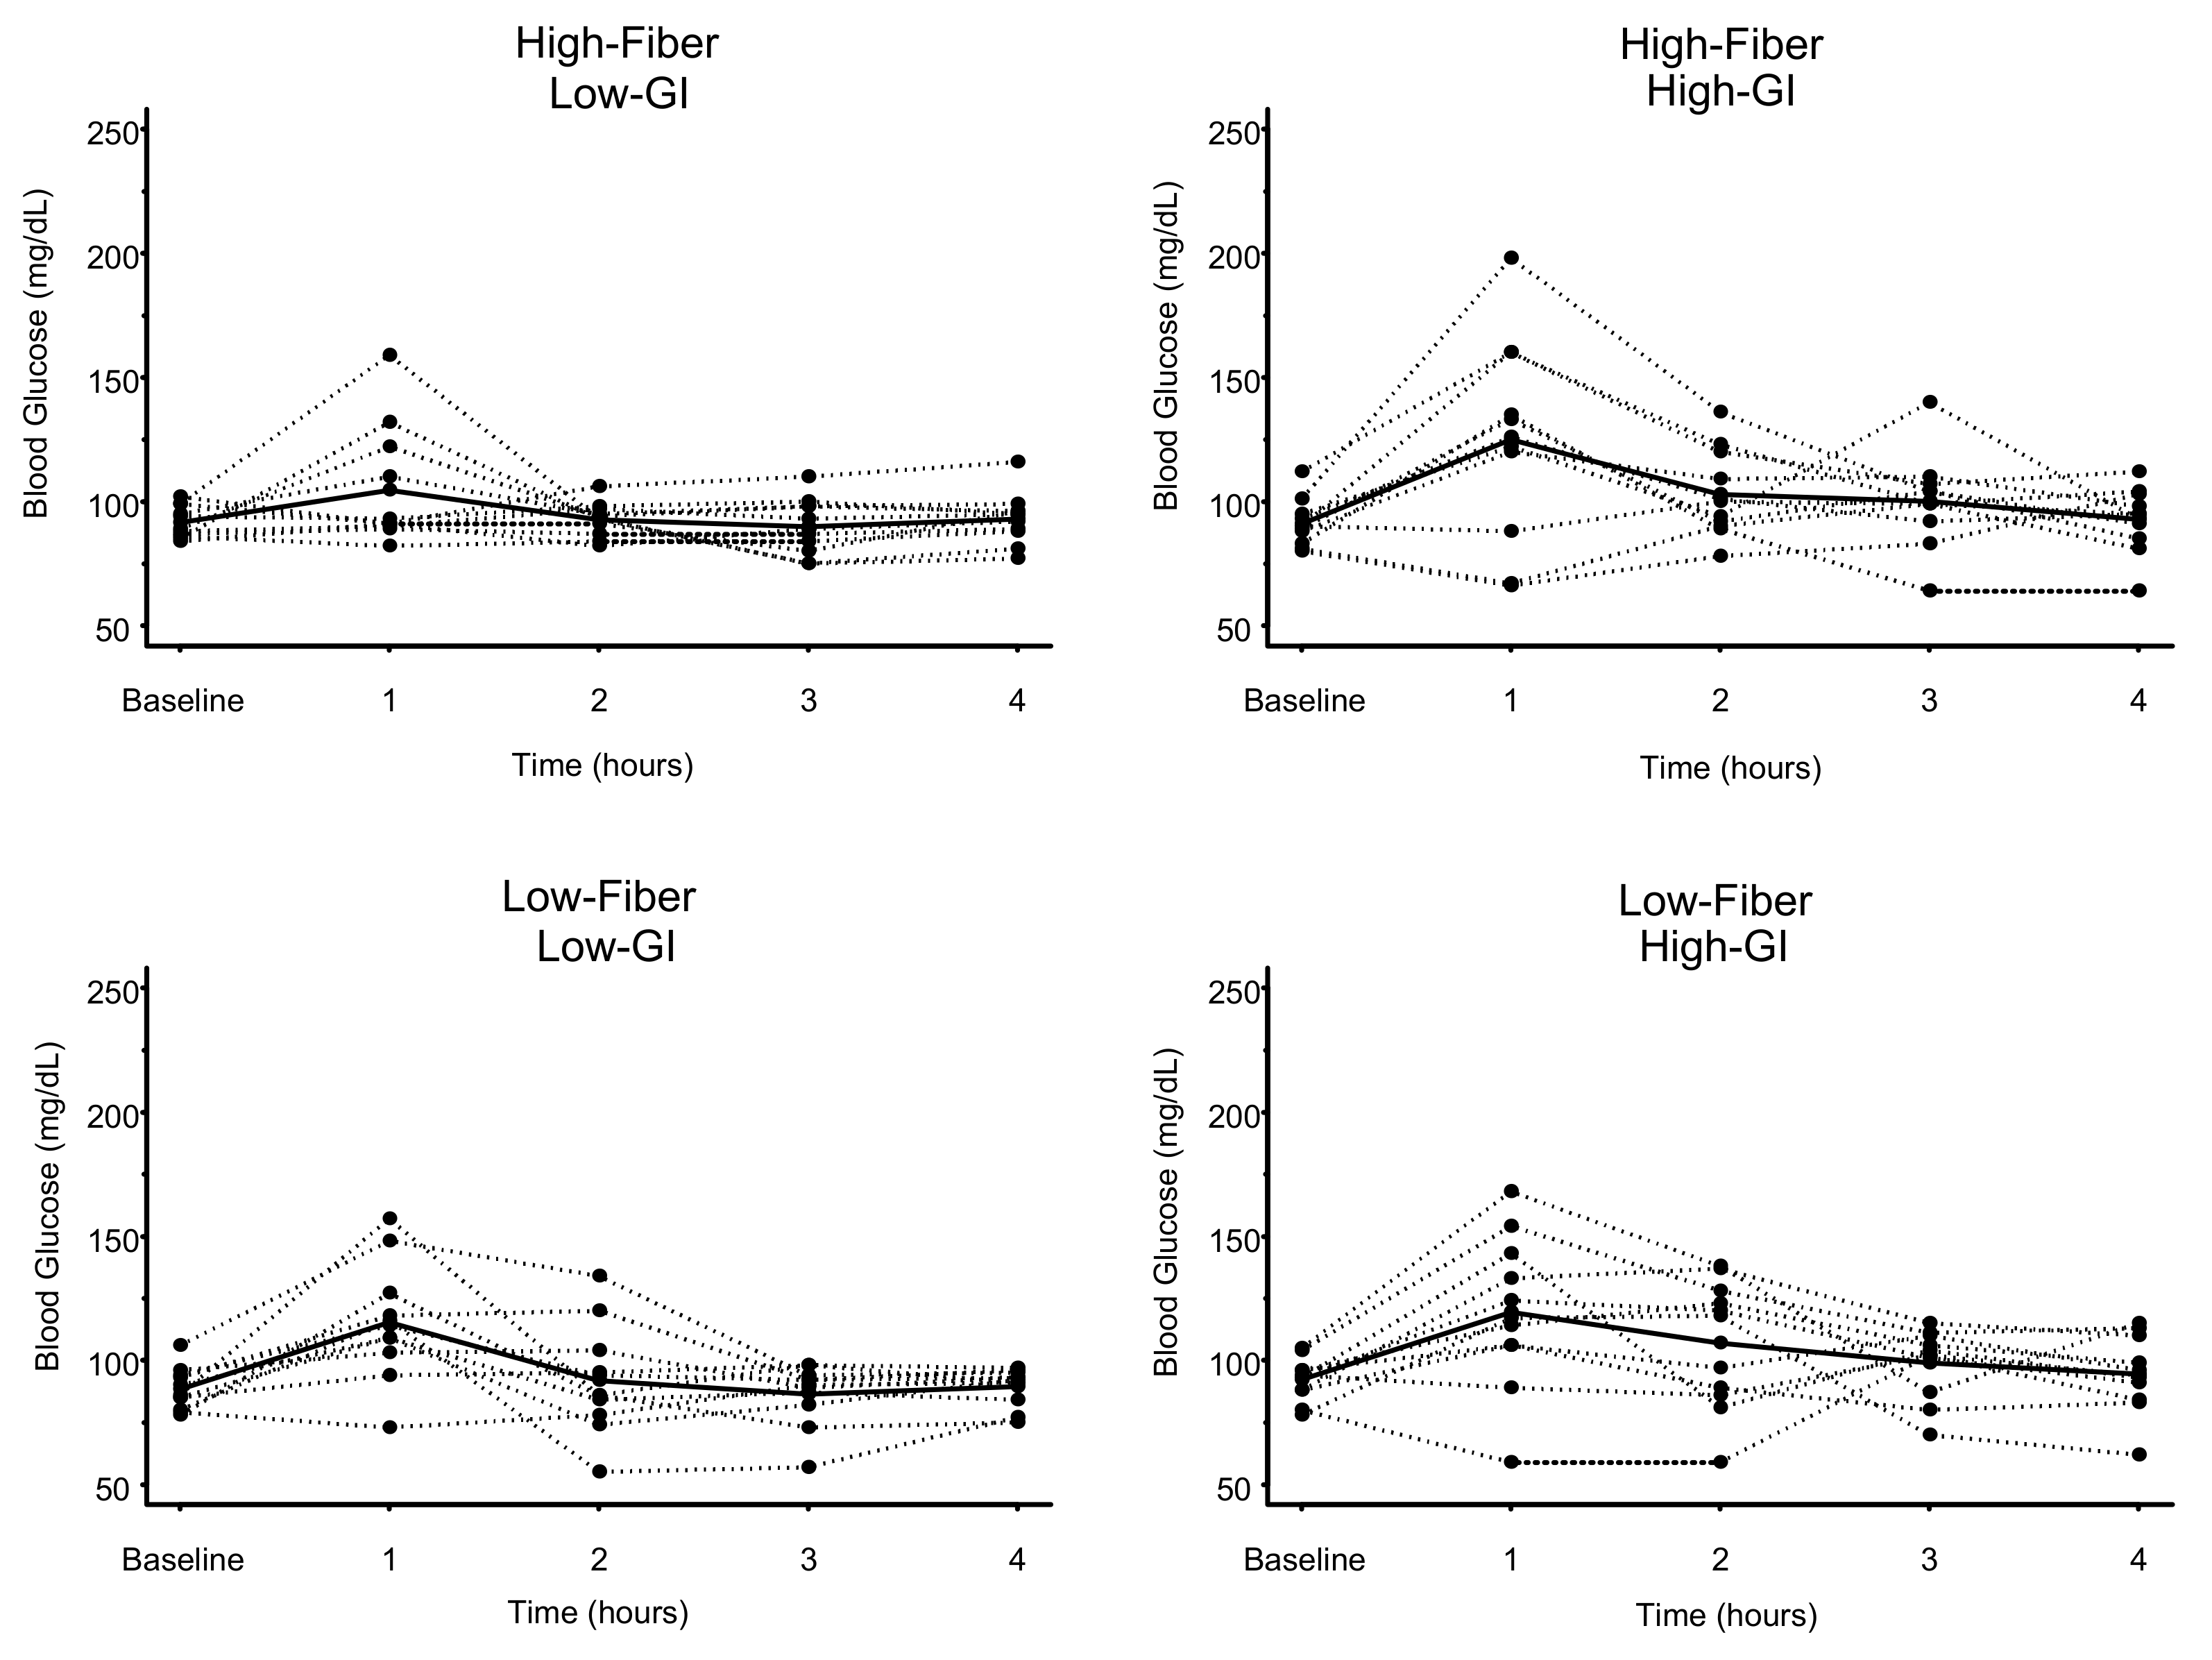
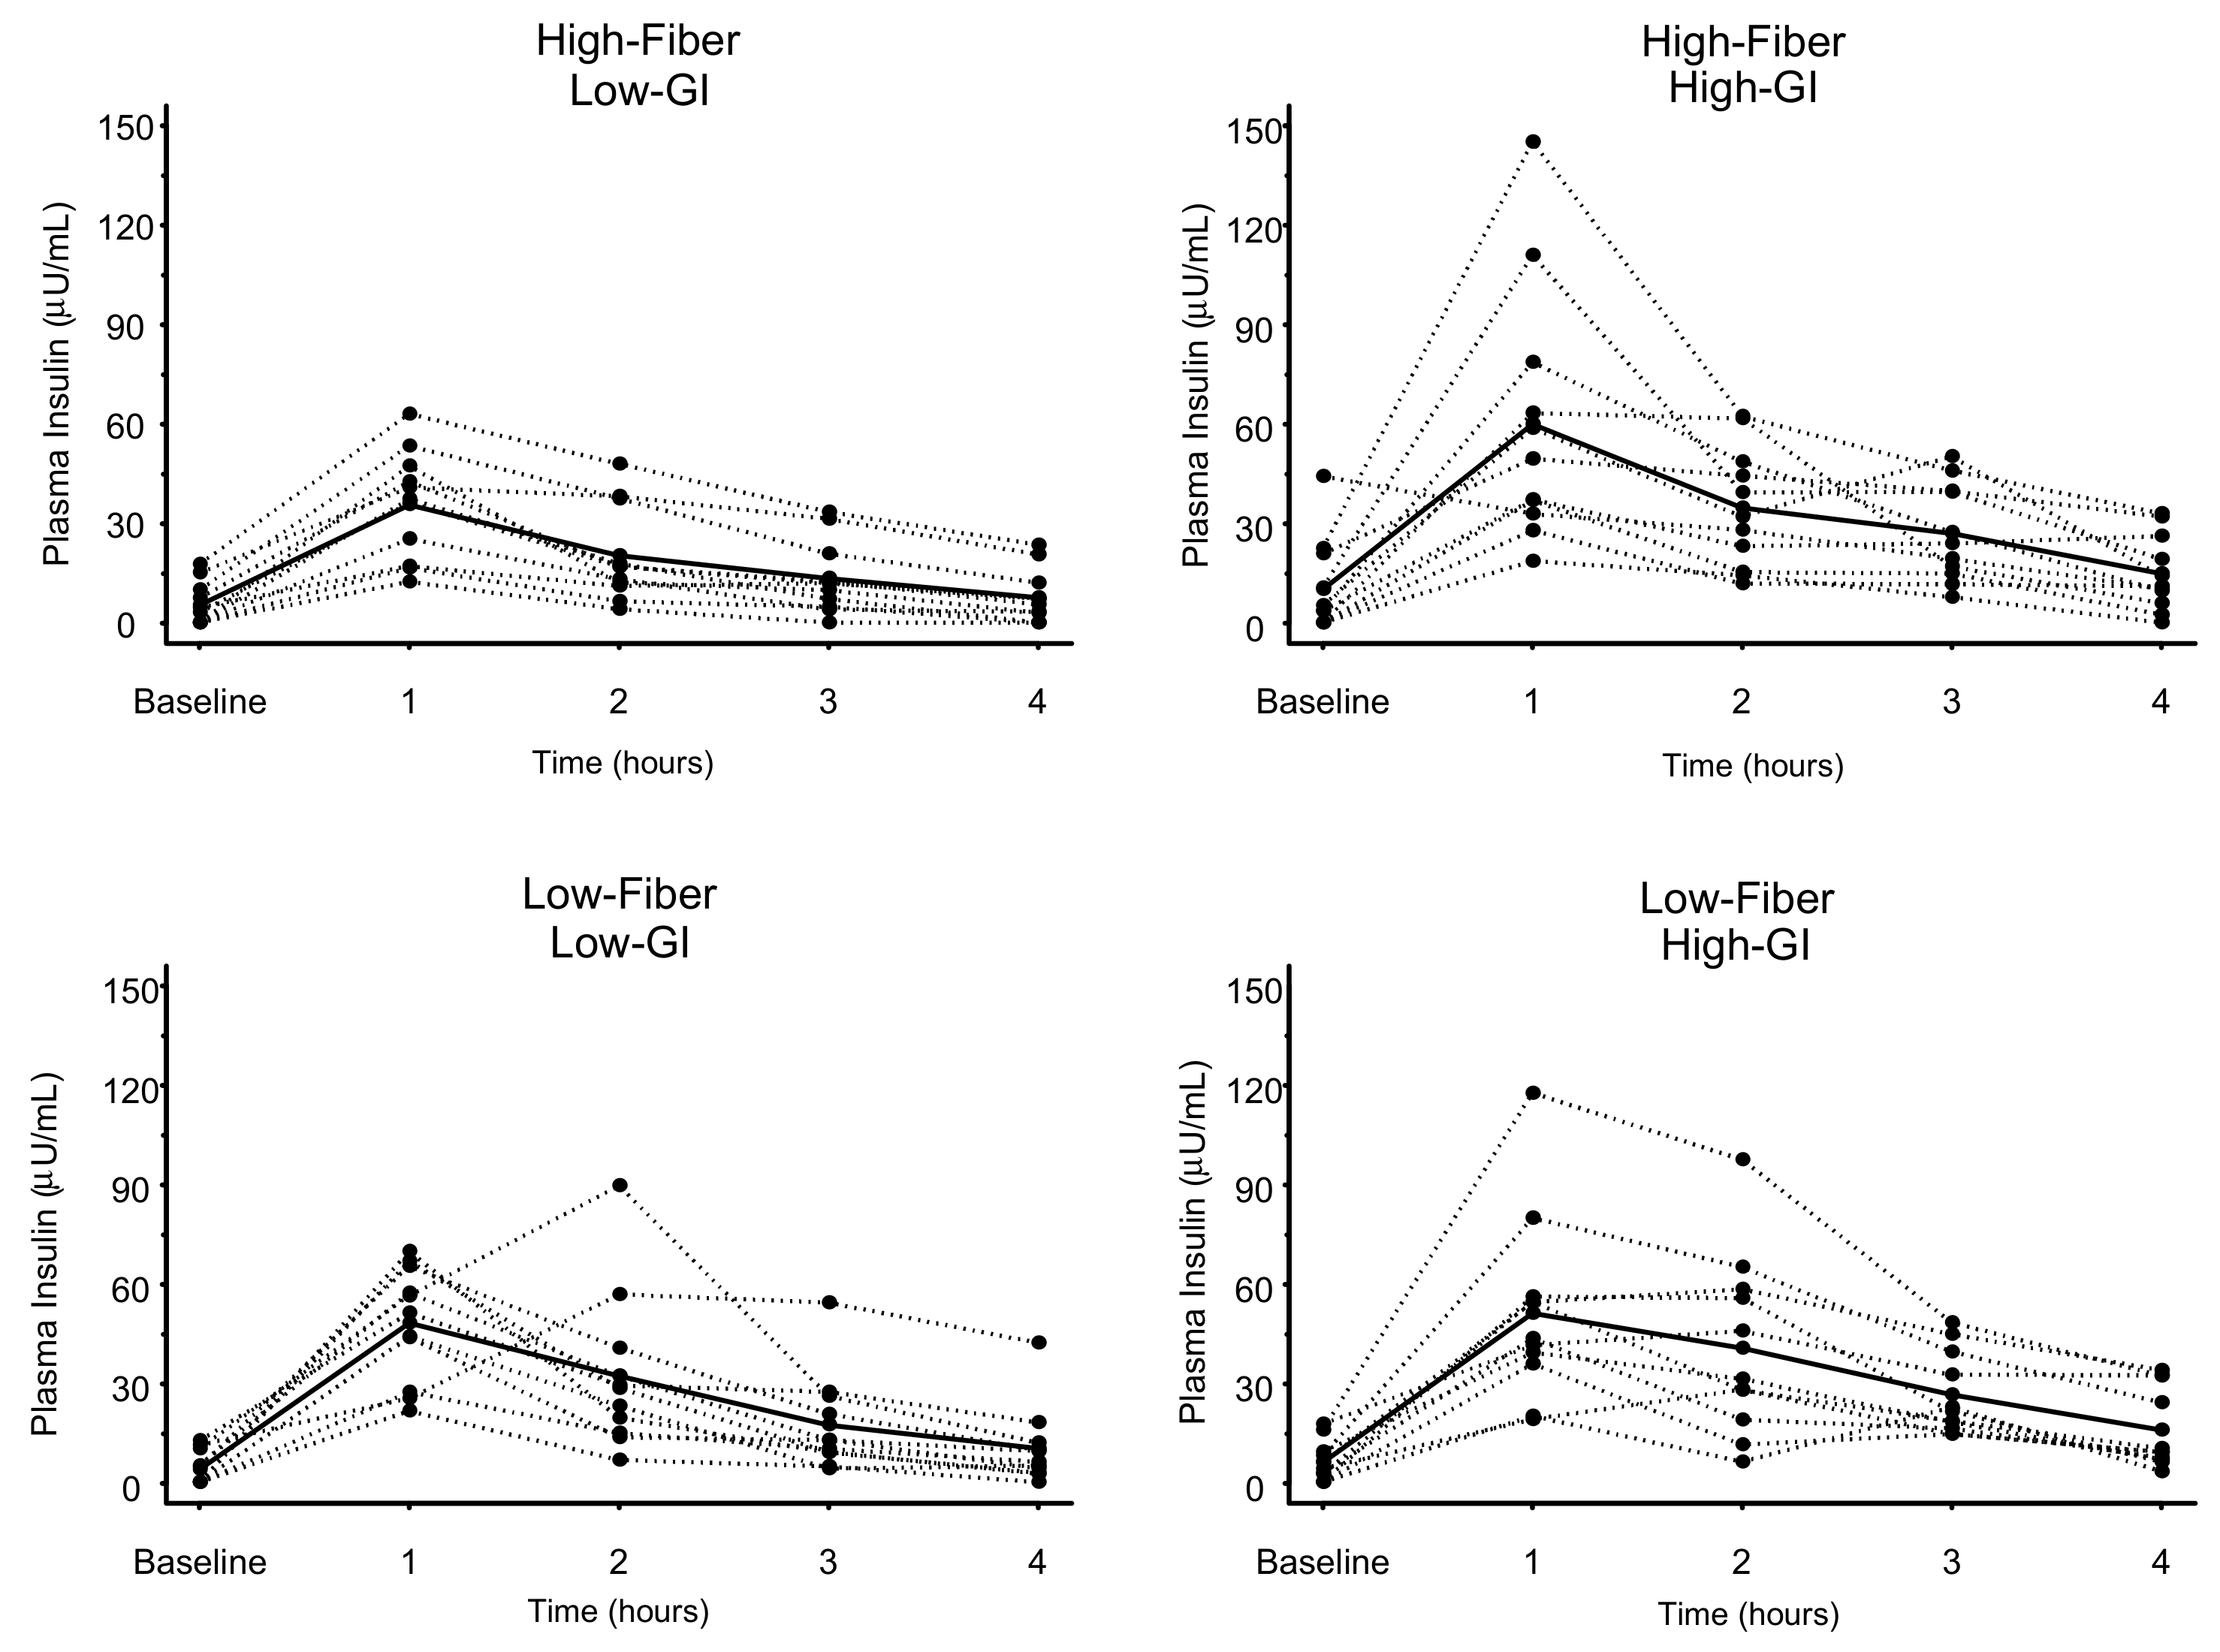
Postprandial 1-h Blood Glucose and Plasma Insulin
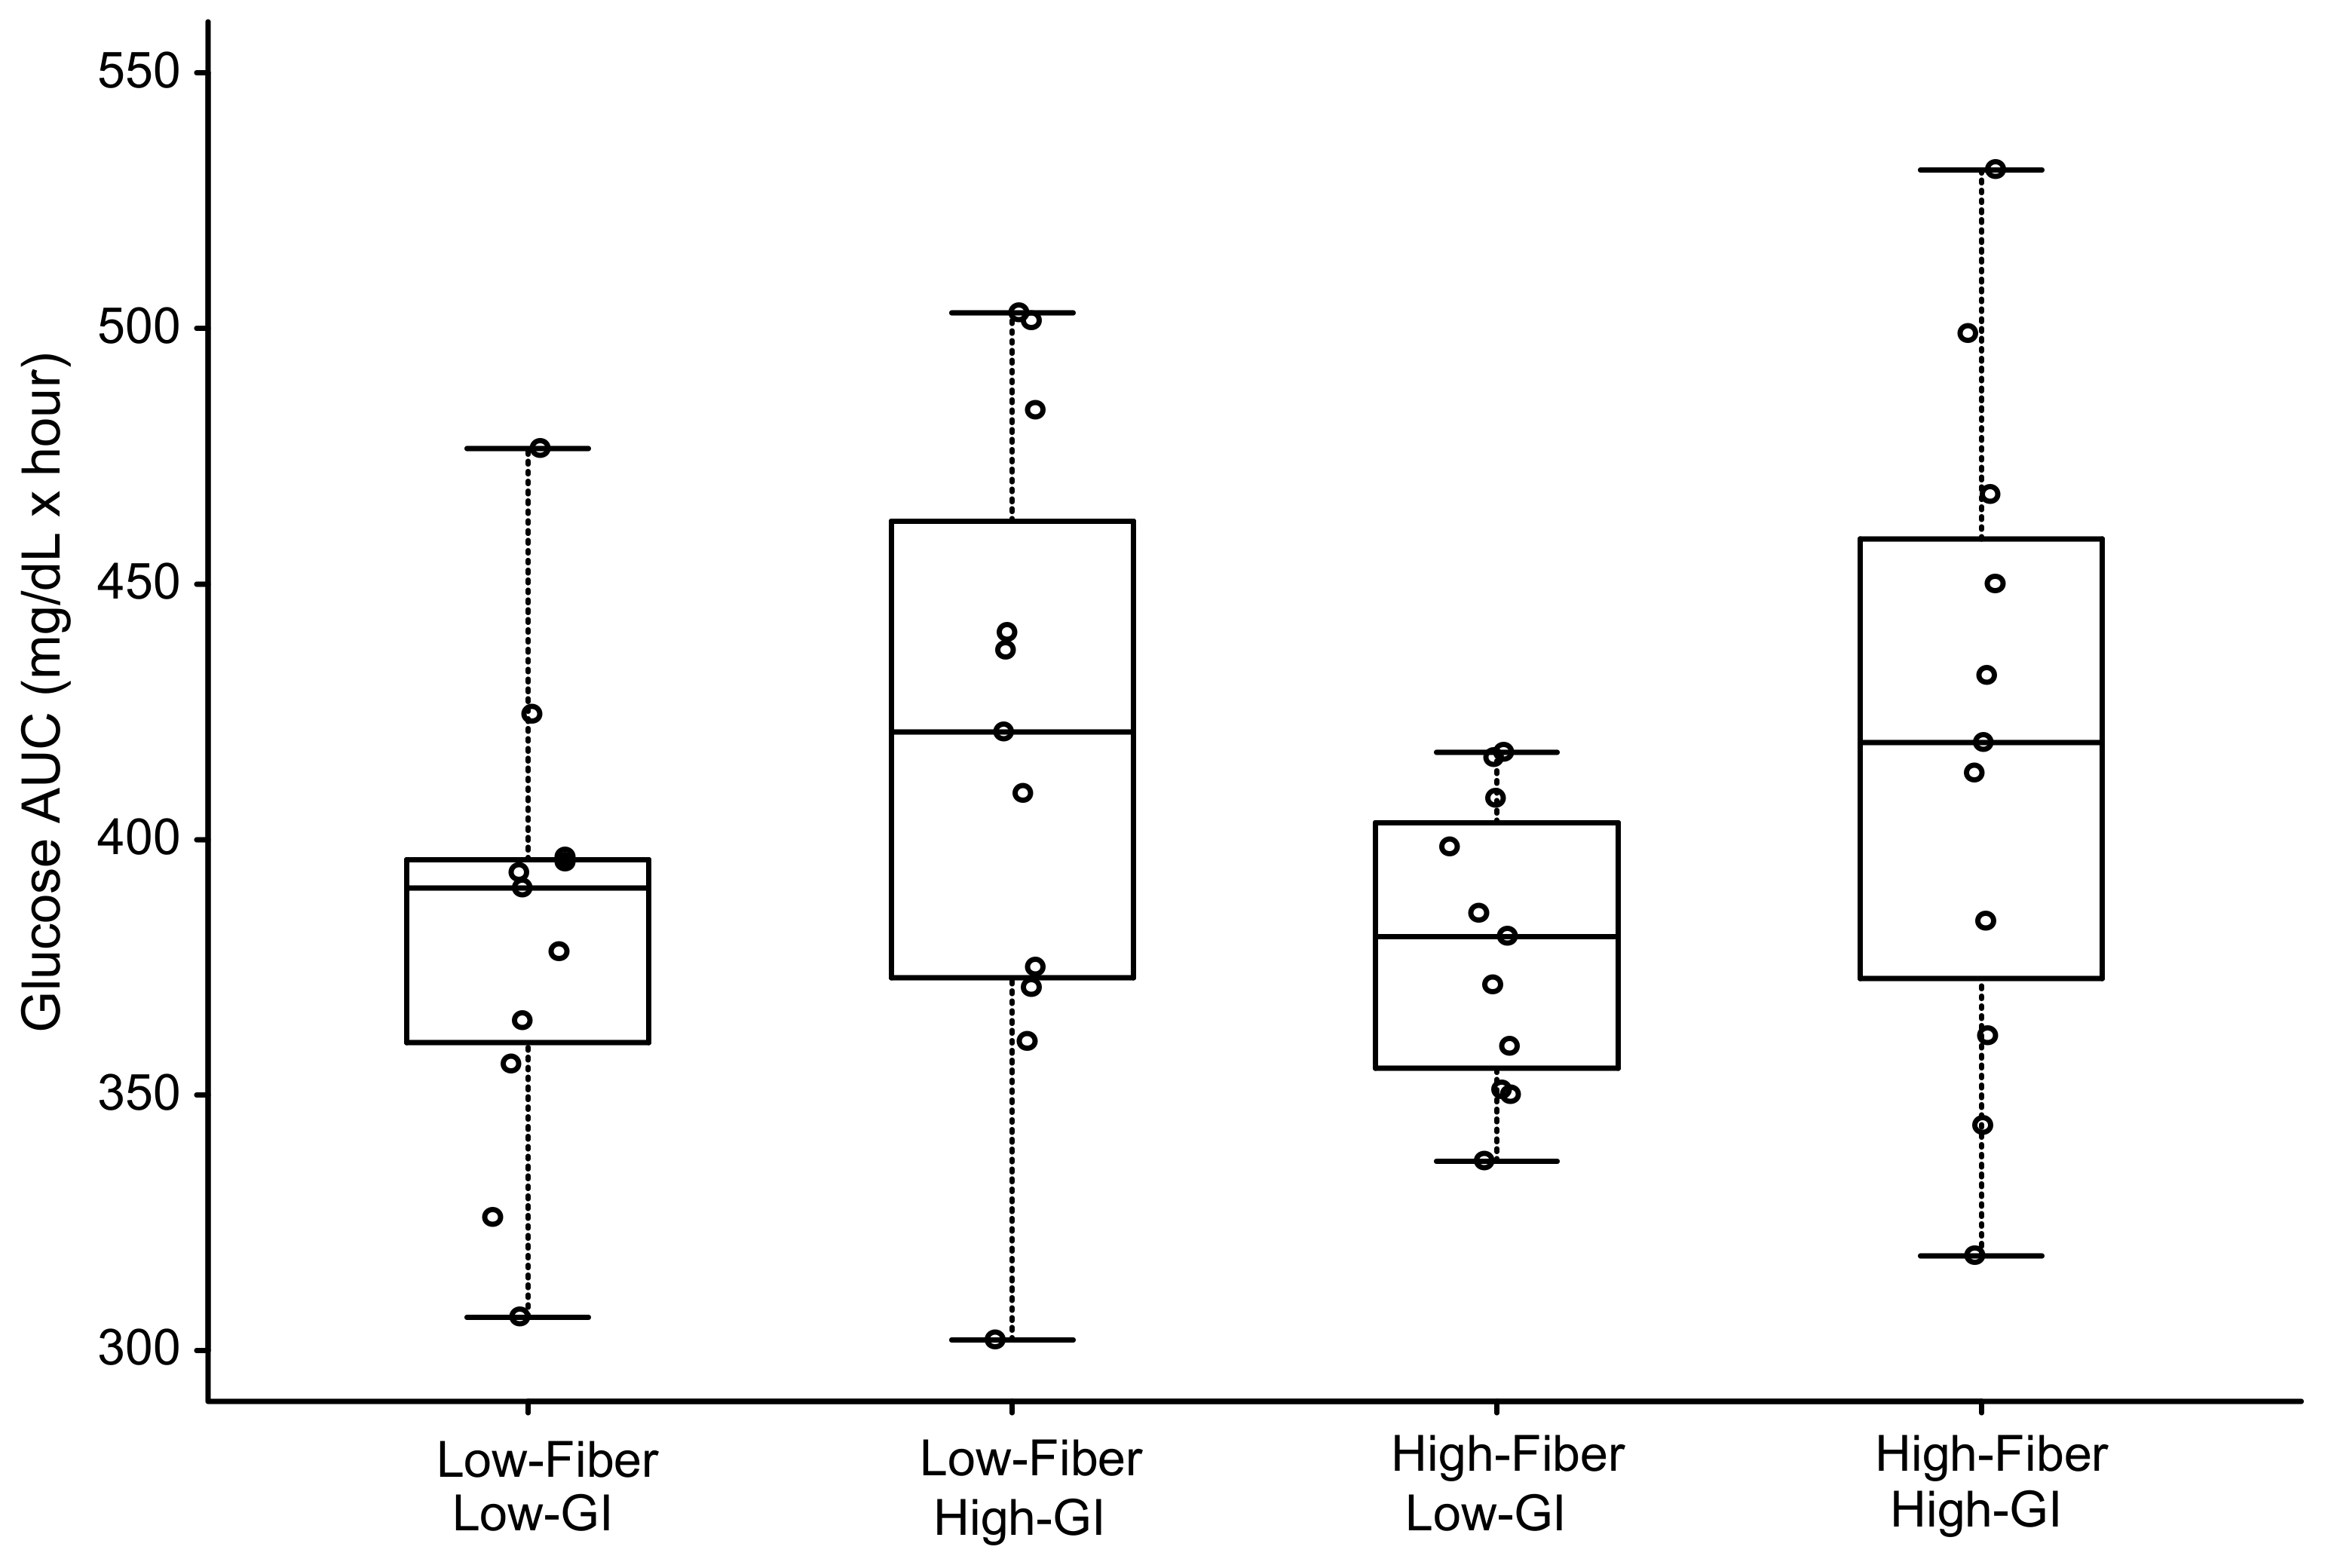
Glucose and Insulin Area under the Curve (AUC)
3. Results
3.1. Flow-Mediated Dilation
3.2. Blood Glucose
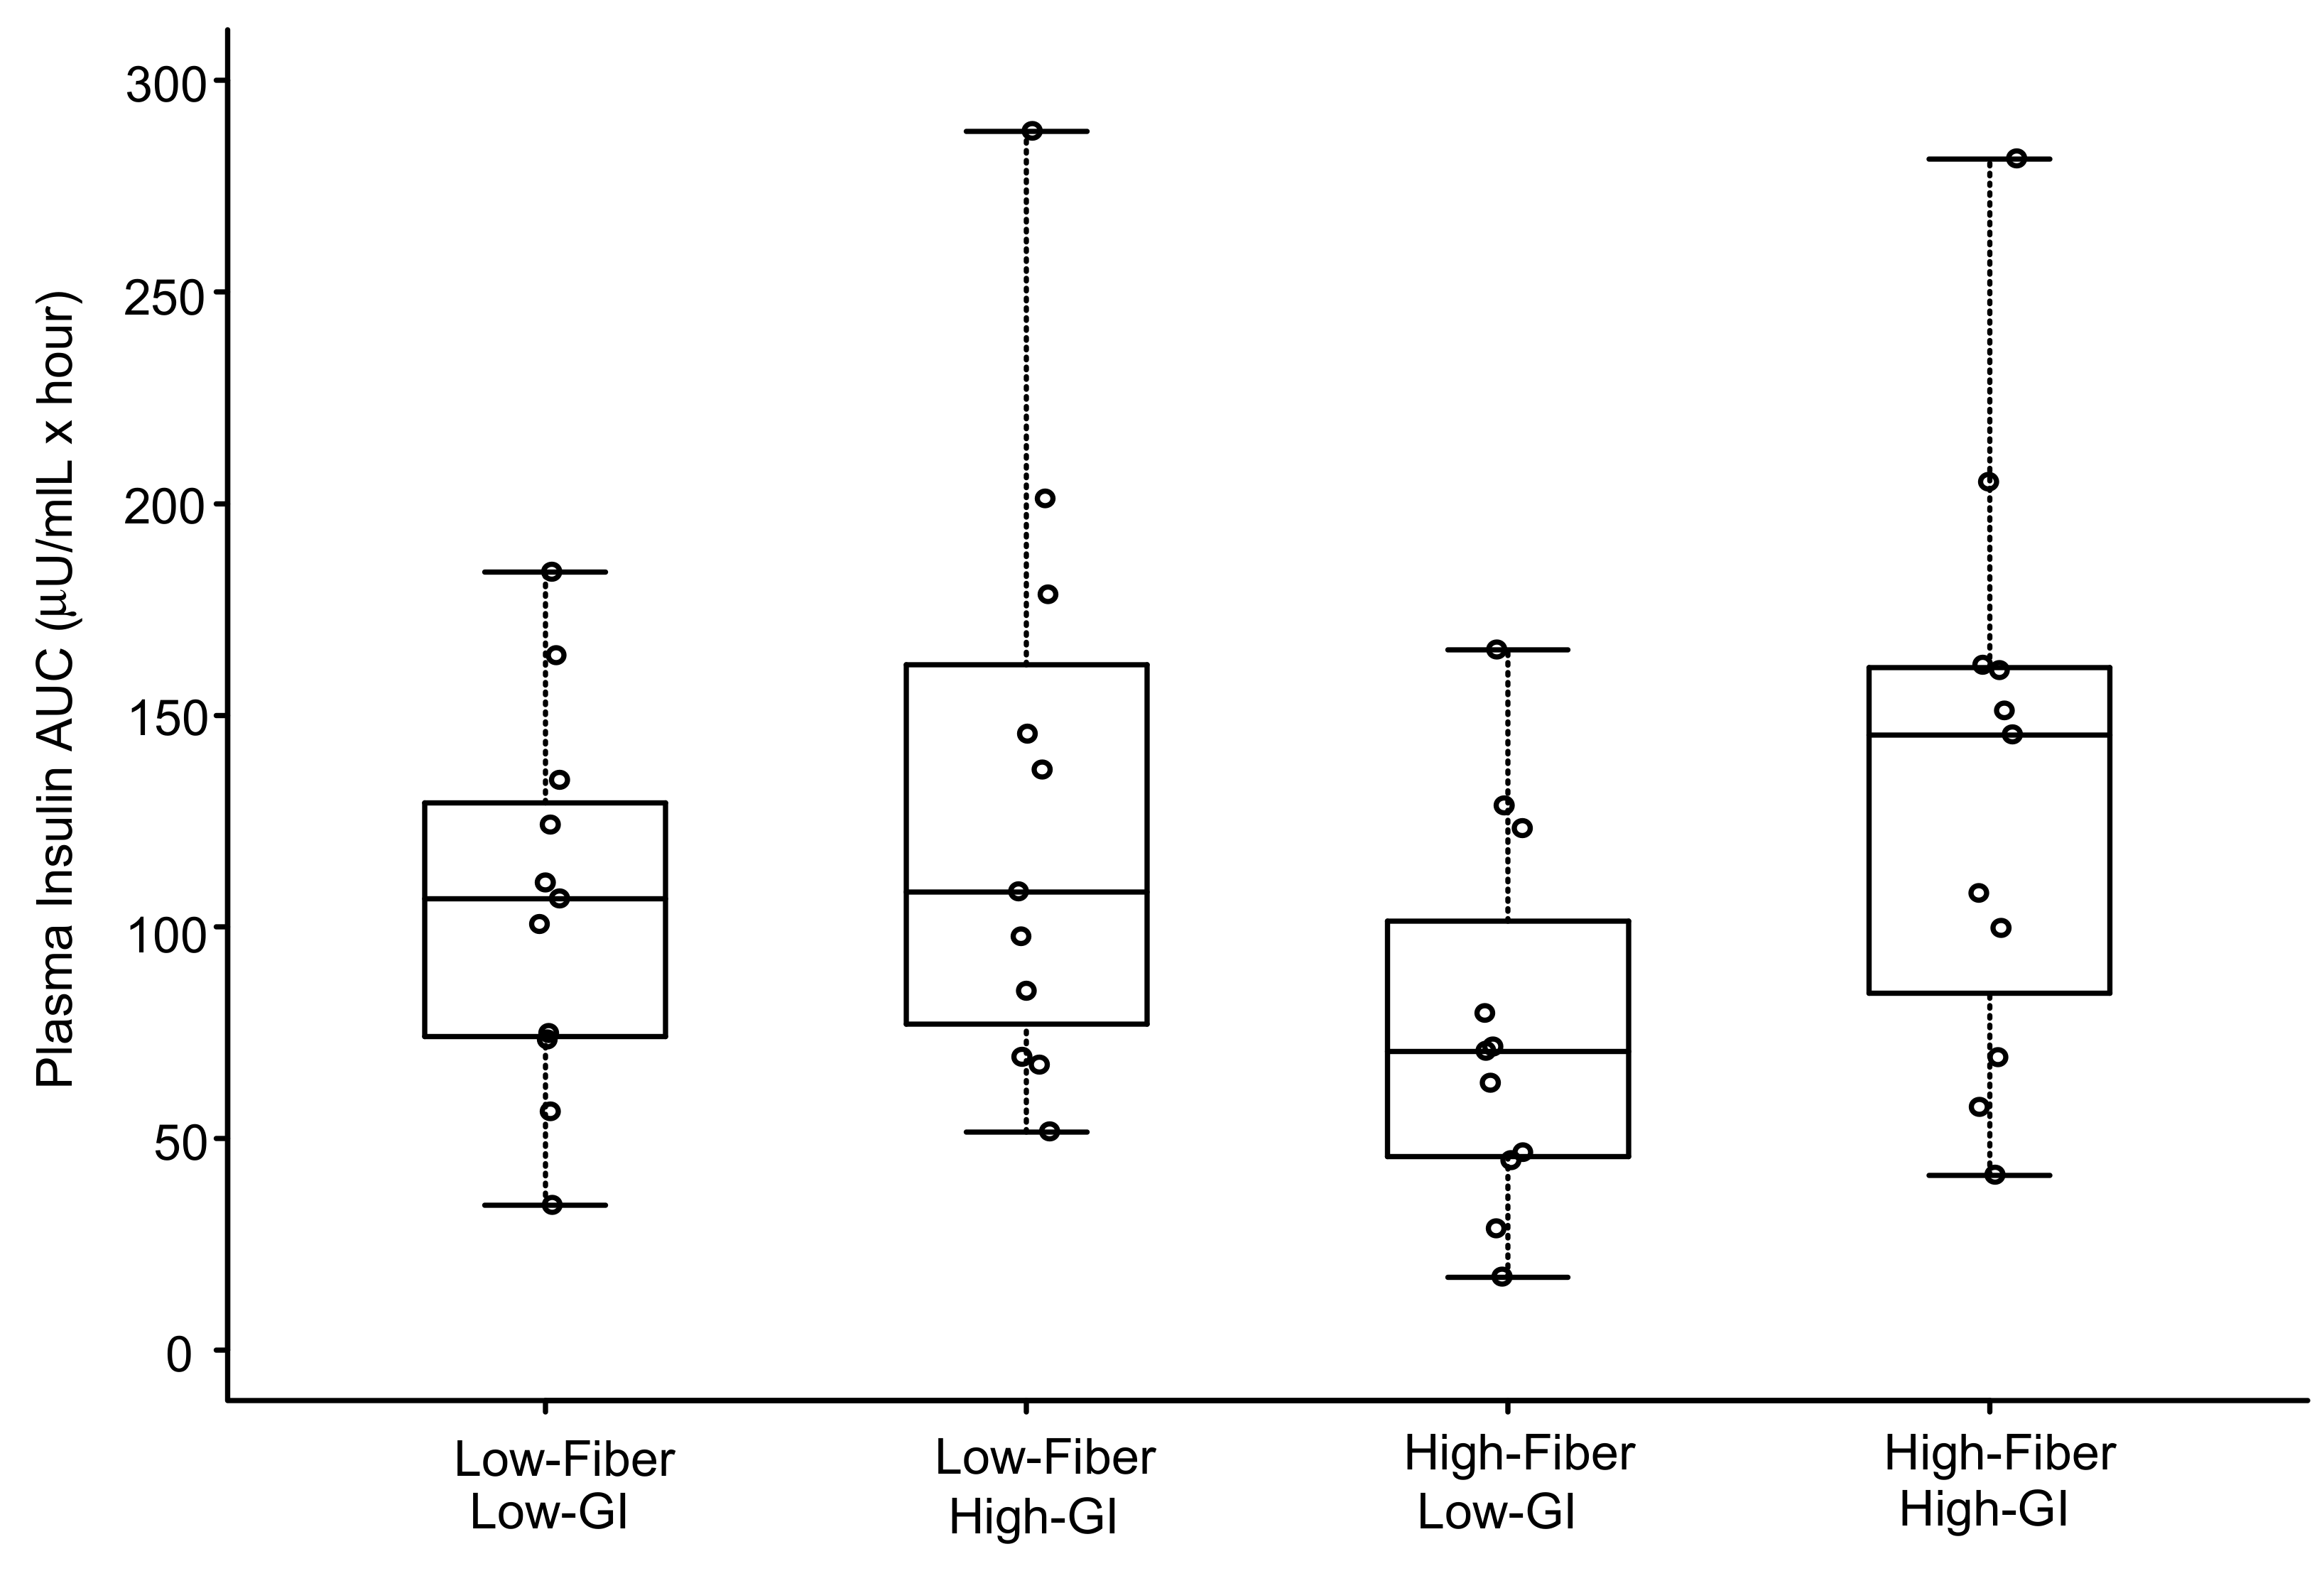
3.3. Plasma Insulin
4. Discussion
Strengths and Limitations
5. Conclusions
Author Contributions
Funding
Conflicts of Interest
References
- Levitan, E.B.; Song, Y.; Ford, E.S.; Liu, S. Is nondiabetic hyperglycemia a risk factor for cardiovascular disease? A meta-analysis of prospective studies. Arch. Intern. Med. 2004, 164, 2147–2155. [Google Scholar] [CrossRef] [PubMed]
- Brand-Miller, J.; Dickinson, S.; Barclay, A.; Celermajer, D. The glycemic index and cardiovascular disease risk. Curr. Atheroscler. Rep. 2007, 9, 479–485. [Google Scholar] [CrossRef] [PubMed]
- Decode Study Group, the European Diabetes Epidemiology Group. Glucose tolerance and cardiovascular mortality: Comparison of fasting and 2-hour diagnostic criteria. Arch. Intern. Med. 2001, 161, 397–405. [Google Scholar]
- Loader, J.; Montero, D.; Lorenzen, C.; Watts, R.; Meziat, C.; Reboul, C.; Stewart, S.; Walther, G. Acute Hyperglycemia Impairs Vascular Function in Healthy and Cardiometabolic Diseased Subjects: Systematic Review and Meta-Analysis. Arterioscler. Thromb. Vasc. Biol. 2015, 35, 2060–2072. [Google Scholar] [CrossRef] [PubMed]
- O’Keefe, J.H.; Gheewala, N.M.; O’Keefe, J.O. Dietary strategies for improving post-prandial glucose, lipids, inflammation, and cardiovascular health. J. Am. Coll. Cardiol. 2008, 51, 249–255. [Google Scholar] [CrossRef]
- Celermajer, D.S.; Sorensen, K.E.; Bull, C.; Robinson, J.; Deanfield, J.E. Endothelium-dependent dilation in the systemic arteries of asymptomatic subjects relates to coronary risk factors and their interaction. J. Am. Coll. Cardiol. 1994, 24, 1468–1474. [Google Scholar] [CrossRef]
- Vanhoutte, P.M. Endothelial dysfunction: The first step toward coronary arteriosclerosis. Circ. J. 2009, 73, 595–601. [Google Scholar] [CrossRef]
- Harris, R.A.; Nishiyama, S.K.; Wray, D.W.; Richardson, R.S. Ultrasound assessment of flow-mediated dilation. Hypertension 2010, 55, 1075–1085. [Google Scholar] [CrossRef]
- Inaba, Y.; Chen, J.A.; Bergmann, S.R. Prediction of future cardiovascular outcomes by flow-mediated vasodilatation of brachial artery: A meta-analysis. Int. J. Cardiovasc. Imaging 2010, 26, 631–640. [Google Scholar] [CrossRef]
- Brand-Miller, J.C.; Stockmann, K.; Atkinson, F.; Petocz, P.; Denyer, G. Glycemic index, postprandial glycemia, and the shape of the curve in healthy subjects: Analysis of a database of more than 1000 foods. Am. J. Clin. Nutr. 2009, 89, 97–105. [Google Scholar] [CrossRef]
- Wolever, T.M.; Yang, M.; Zeng, X.Y.; Atkinson, F.; Brand-Miller, J.C. Food glycemic index, as given in glycemic index tables, is a significant determinant of glycemic responses elicited by composite breakfast meals. Am. J. Clin. Nutr. 2006, 83, 1306–1312. [Google Scholar] [CrossRef] [PubMed]
- Moghaddam, E.; Vogt, J.A.; Wolever, T.M. The effects of fat and protein on glycemic responses in nondiabetic humans vary with waist circumference, fasting plasma insulin, and dietary fiber intake. J. Nutr. 2006, 136, 2506–2511. [Google Scholar] [CrossRef] [PubMed]
- Anderson, J.W.; O’Neal, D.S.; Riddell-Mason, S.; Floore, T.L.; Dillon, D.W.; Oeltgen, P.R. Postprandial serum glucose, insulin, and lipoprotein responses to high- and low-fiber diets. Metabolism 1995, 44, 848–854. [Google Scholar] [CrossRef]
- Hamedani, A.; Akhavan, T.; Samra, R.A.; Anderson, G.H. Reduced energy intake at breakfast is not compensated for at lunch if a high-insoluble-fiber cereal replaces a low-fiber cereal. Am. J. Clin. Nutr. 2009, 89, 1343–1349. [Google Scholar] [CrossRef] [PubMed]
- Lavi, T.; Karasik, A.; Koren-Morag, N.; Kanety, H.; Feinberg, M.S.; Shechter, M. The acute effect of various glycemic index dietary carbohydrates on endothelial function in nondiabetic overweight and obese subjects. J. Am. Coll. Cardiol. 2009, 53, 2283–2287. [Google Scholar] [CrossRef] [PubMed]
- Thom, N.J.; Early, A.R.; Hunt, B.E.; Harris, R.A.; Herring, M.P. Eating and arterial endothelial function: A meta-analysis of the acute effects of meal consumption on flow-mediated dilation. Obes. Rev. 2016, 17, 1080–1090. [Google Scholar] [CrossRef] [PubMed]
- Brock, D.W.; Davis, C.K.; Irving, B.A.; Rodriguez, J.; Barrett, E.J.; Weltman, A.; Taylor, A.G.; Gaesser, G.A. A high-carbohydrate, high-fiber meal improves endothelial function in adults with the metabolic syndrome. Diabetes Care 2006, 29, 2313–2315. [Google Scholar] [CrossRef]
- Dickinson, K.M.; Clifton, P.M.; Keogh, J.B. Endothelial function is impaired after a high-salt meal in healthy subjects. Am. J. Clin. Nutr. 2011, 93, 500–505. [Google Scholar] [CrossRef]
- Hallmark, R.; Patrie, J.T.; Liu, Z.; Gaesser, G.A.; Barrett, E.J.; Weltman, A. The effect of exercise intensity on endothelial function in physically inactive lean and obese adults. PLoS ONE 2014, 9, e85450. [Google Scholar] [CrossRef]
- Corretti, M.C.; Anderson, T.J.; Benjamin, E.J.; Celermajer, D.; Charbonneau, F.; Creager, M.A.; Deanfield, J.; Drexler, H.; Gerhard-Herman, M.; Herrington, D.; et al. Guidelines for the ultrasound assessment of endothelial-dependent flow-mediated vasodilation of the brachial artery: A report of the International Brachial Artery Reactivity Task Force. J. Am. Coll. Cardiol. 2002, 39, 257–265. [Google Scholar] [CrossRef]
- Vafeiadou, K.; Weech, M.; Sharma, V.; Yaqoob, P.; Todd, S.; Williams, C.M.; Jackson, K.G.; Lovegrove, J.A. A review of the evidence for the effects of total dietary fat, saturated, monounsaturated and n-6 polyunsaturated fatty acids on vascular function, endothelial progenitor cells and microparticles. Br. J. Nutr. 2012, 107, 303–324. [Google Scholar] [CrossRef]
- Suzuki, K.; Watanabe, K.; Futami-Suda, S.; Yano, H.; Motoyama, M.; Matsumura, N.; Igari, Y.; Suzuki, T.; Nakano, H.; Oba, K. The effects of postprandial glucose and insulin levels on postprandial endothelial function in subjects with normal glucose tolerance. Cardiovasc. Diabetol. 2012, 11, 98. [Google Scholar] [CrossRef] [PubMed]
- Mah, E.; Bruno, R.S. Postprandial hyperglycemia on vascular endothelial function: Mechanisms and consequences. Nutr. Res. 2012, 32, 727–740. [Google Scholar] [CrossRef] [PubMed]
- Meng, H.; Matthan, N.R.; Ausman, L.M.; Lichtenstein, A.H. Effect of macronutrients and fiber on postprandial glycemic responses and meal glycemic index and glycemic load value determinations. Am. J. Clin. Nutr. 2017, 105, 842–853. [Google Scholar] [CrossRef] [PubMed]
- Stevenson, L.; Phillips, F.; O’Sullivan, K.; Walton, J. Wheat bran: Its composition and benefits to health, a European perspective. Int. J. Food Sci. Nutr. 2012, 63, 1001–1013. [Google Scholar] [CrossRef]
- Threapleton, D.E.; Greenwood, D.C.; Evans, C.E.; Cleghorn, C.L.; Nykjaer, C.; Woodhead, C.; Cade, J.E.; Gale, C.P.; Burley, V.J. Dietary fibre intake and risk of cardiovascular disease: Systematic review and meta-analysis. BMJ 2013, 347, f6879. [Google Scholar] [CrossRef] [PubMed]
- Anson, N.M.; Aura, A.M.; Selinheimo, E.; Mattila, I.; Poutanen, K.; Van den Berg, R.; Havenaar, R.; Bast, A.; Haenen, G.R.M.M. Bioprocessing of Wheat Bran in Whole Wheat Bread Increases the Bioavailability of Phenolic Acids in Men and Exerts Antiinflammatory Effects ex Vivo. J. Nutr. 2011, 141, 137–143. [Google Scholar] [CrossRef]
- Kern, S.M.; Bennett, R.N.; Mellon, F.A.; Kroon, P.A.; Garcia-Conesa, M.T. Absorption of hydroxycinnamates in humans after high-bran cereal consumption. J. Agric. Food Chem. 2003, 51, 6050–6055. [Google Scholar] [CrossRef]
- Neacsu, M.; McMonagle, J.; Fletcher, R.J.; Hulshof, T.; Duncan, S.H.; Scobbie, L.; Duncan, G.J.; Cantlay, L.; Horgan, G.; De Roos, B.; et al. Availability and dose response of phytophenols from a wheat bran rich cereal product in healthy human volunteers. Mol. Nutr. Food Res. 2017, 61, 1600202. [Google Scholar] [CrossRef] [PubMed]
- Perez-Jimenez, J.; Saura-Calixto, F. Literature data may underestimate the actual antioxidant capacity of cereals. J. Agric. Food Chem. 2005, 53, 5036–5040. [Google Scholar] [CrossRef]
- Karabulut, A.; Iltumur, K.; Toprak, N.; Tuzcu, A.K.; Kara, I.H.; Kaplan, A.; Aksu, Y. Insulin response to oral glucose loading and coronary artery disease in nondiabetics. Int. Heart J. 2005, 46, 761–770. [Google Scholar] [CrossRef] [PubMed][Green Version]
- Miyazaki, T.; Shimada, K.; Iwama, Y.; Kume, A.; Sumiyoshi, K.; Sato, Y.; Ohmura, H.; Watanabe, Y.; Mokuno, H.; Daida, H. Insulin response to oral glucose load is associated with coronary artery disease in subjects with normal glucose tolerance. J. Atheroscler. Thromb. 2008, 15, 6–12. [Google Scholar] [CrossRef] [PubMed]
- Arcaro, G.; Cretti, A.; Balzano, S.; Lechi, A.; Muggeo, M.; Bonora, E.; Bonadonna, R.C. Insulin causes endothelial dysfunction in humans: Sites and mechanisms. Circulation 2002, 105, 576–582. [Google Scholar] [CrossRef] [PubMed]
- Campia, U.; Sullivan, G.; Bryant, M.B.; Waclawiw, M.A.; Quon, M.J.; Panza, J.A. Insulin impairs endothelium-dependent vasodilation independent of insulin sensitivity or lipid profile. Am. J. Physiol. Heart Circ. Physiol. 2004, 286, H76–H82. [Google Scholar] [CrossRef] [PubMed]
- Jahn, L.A.; Hartline, L.; Rao, N.; Logan, B.; Kim, J.J.; Aylor, K.; Gan, L.M.; Westergren, H.U.; Barrett, E.J. Insulin Enhances Endothelial Function Throughout the Arterial Tree in Healthy but Not Metabolic Syndrome Subjects. J. Clin. Endocrinol. Metab. 2016, 101, 1198–1206. [Google Scholar] [CrossRef] [PubMed]
- Watanabe, K.; Oba, K.; Suzuki, T.; Ouchi, M.; Suzuki, K.; Futami-Suda, S.; Sekimizu, K.; Yamamoto, N.; Nakano, H. Oral glucose loading attenuates endothelial function in normal individual. Eur. J. Clin. Investig. 2011, 41, 465–473. [Google Scholar] [CrossRef]
- Atkinson, F.S.; Foster-Powell, K.; Brand-Miller, J.C. International tables of glycemic index and glycemic load values: 2008. Diabetes Care 2008, 31, 2281–2283. [Google Scholar] [CrossRef] [PubMed]
- Cho, S.S.; Qi, L.; Fahey, G.C., Jr.; Klurfeld, D.M. Consumption of cereal fiber, mixtures of whole grains and bran, and whole grains and risk reduction in type 2 diabetes, obesity, and cardiovascular disease. Am. J. Clin. Nutr. 2013, 98, 594–619. [Google Scholar] [CrossRef]
- Hajishafiee, M.; Saneei, P.; Benisi-Kohansal, S.; Esmaillzadeh, A. Cereal fibre intake and risk of mortality from all causes, CVD, cancer and inflammatory diseases: A systematic review and meta-analysis of prospective cohort studies. Br. J. Nutr. 2016, 116, 343–352. [Google Scholar] [CrossRef]
- Pereira, M.A.; O’Reilly, E.; Augustsson, K.; Fraser, G.E.; Goldbourt, U.; Heitmann, B.L.; Hallmans, G.; Knekt, P.; Liu, S.; Pietinen, P.; et al. Dietary fiber and risk of coronary heart disease: A pooled analysis of cohort studies. Arch. Intern. Med. 2004, 164, 370–376. [Google Scholar] [CrossRef]
- Kaushik, S.; Wang, J.J.; Wong, T.Y.; Flood, V.; Barclay, A.; Brand-Miller, J.; Mitchell, P. Glycemic index, retinal vascular caliber, and stroke mortality. Stroke 2009, 40, 206–212. [Google Scholar] [CrossRef] [PubMed][Green Version]
- Mah, E.; Noh, S.K.; Ballard, K.D.; Matos, M.E.; Volek, J.S.; Bruno, R.S. Postprandial hyperglycemia impairs vascular endothelial function in healthy men by inducing lipid peroxidation and increasing asymmetric dimethylarginine: Arginine. J. Nutr. 2011, 141, 1961–1968. [Google Scholar] [CrossRef] [PubMed]
- Thazhath, S.S.; Wu, T.; Bound, M.J.; Checklin, H.L.; Jones, K.L.; Willoughby, S.; Horowitz, M.; Rayner, C.K. Changes in meal composition and duration affect postprandial endothelial function in healthy humans. Am. J. Physiol. Gastrointest. Liver Physiol. 2014, 307, G1191–G1197. [Google Scholar] [CrossRef] [PubMed]


| Nutrient | High-Fiber Low-GI | Low-Fiber Low-GI | Low-Fiber High-GI | High-Fiber High-GI |
|---|---|---|---|---|
| Glycemic Index | 44 | 43 | 70 | 71 |
| Total Fiber (g) | 20.4 | 4.3 | 3.6 | 20.3 |
| Total Kcal | 600 | 601 | 601 | 606 |
| Total Protein (g) | 20.0 | 20.9 | 21.5 | 21.1 |
| Total Carbohydrate (g) | 108.3 | 96.3 | 92.8 | 109.8 |
| Total Fat (g) | 15.7 | 15.6 | 15.8 | 14.9 |
| Saturated Fat (g) | 3.6 | 3.6 | 3.6 | 3.4 |
| Monounsaturated Fat (g) | 5.2 | 5.3 | 5.2 | 4.9 |
| Polyunsaturated Fat (g) | 5.4 | 5.0 | 5.4 | 5.1 |
| Trans Fat (g) | 0.9 | 0.7 | 0.8 | 0.8 |
| Sodium (mg) | 1007 | 1033 | 1039 | 1011 |
| Meal | Glucose mg/dL (mean ± SD) | High-Fiber Low-GI | Low-Fiber Low-GI | High-Fiber High-GI | Low-Fiber High-GI | |
|---|---|---|---|---|---|---|
| Baseline | 1-h | Unadjusted p-Values (Bonferroni-Adjusted p-Values) | ||||
| High-Fiber Low-GI | 91.6 ± 6.4 | 104.5 ± 23.9 | - | 0.025 (0.150) | 0.018 (0.108) | 0.086 (0.516) |
| Low-Fiber Low-GI | 88.4 ± 8.5 | 115.3 ± 23.3 * | - | 0.933 (1.000) | 0.532 (1.000) | |
| High-Fiber High-GI | 91.1 ± 9.3 | 125.0 ± 40.2 * | - | 0.464 (1.000) | ||
| Low-Fiber High-GI | 92.3 ± 8.5 | 119.4 ± 30.5 * | - | |||
| Meal | Glucose AUC mg/dL × hour (mean ± SD) | High-Fiber Low-GI | Low-Fiber Low-GI | High-Fiber High-GI | Low-Fiber High-GI |
|---|---|---|---|---|---|
| Unadjusted p-Values (Bonferroni-Adjusted p-Values) | |||||
| High-Fiber Low-GI | 380 ± 28 | - | 0.916 (1.000) | 0.015 (0.090) | 0.019 (0.114) |
| Low-Fiber Low-GI | 383 ± 46 | - | 0.020 (0.120) | 0.024 (0.144) | |
| High-Fiber High-GI | 420 ± 65 | - | 0.933 (1.000) | ||
| Low-Fiber High-GI | 419 ± 64 | - | |||
| Meal | Insulin µU/mL (mean ± SD) | High-Fiber Low-GI | Low-Fiber Low-GI | High-Fiber High-GI | Low-Fiber High-GI | |
|---|---|---|---|---|---|---|
| Baseline | 1-h | Unadjusted p-Values (Bonferroni-Adjusted p-Values) | ||||
| High-Fiber Low-GI | 5.5 ± 6.5 | 35.8 ± 16.2 | - | 0.032 (0.192) | 0.011 (0.066) | 0.001 (0.006) |
| Low-Fiber Low-GI | 4.2 ± 5.1 | 48.3 ± 17.2 * | - | 0.621 (1.000) | 0.169 (1.000) | |
| High-Fiber High-GI | 10.2 ± 13.9 | 60.1 ± 38.5 * | - | 0.353 (1.000) | ||
| Low-Fiber High-GI | 6.3 ± 6.2 | 51.2 ± 27.9 * | - | |||
| Meal | Insulin AUC µU/mL × hour (mean ± SD) | High-Fiber Low-GI | Low-Fiber Low-GI | High-Fiber High-GI | Low-Fiber High-GI |
|---|---|---|---|---|---|
| Unadjusted p-Values (Bonferroni-Adjusted p-Values) | |||||
| High-Fiber Low-GI | 76 ± 46 | - | 0.001 (0.006) | <0.001 (<0.006) | <0.001 (<0.006) |
| Low-Fiber Low-GI | 106 ± 45 | - | 0.003 (0.018) | 0.021 (0.126) | |
| High-Fiber High-GI | 135 ± 70 | - | 0.673 (1.000) | ||
| Low-Fiber High-GI | 130 ± 71 | - | |||
© 2019 by the authors. Licensee MDPI, Basel, Switzerland. This article is an open access article distributed under the terms and conditions of the Creative Commons Attribution (CC BY) license (http://creativecommons.org/licenses/by/4.0/).
Share and Cite
Gaesser, G.A.; Rodriguez, J.; Patrie, J.T.; Whisner, C.M.; Angadi, S.S. Effects of Glycemic Index and Cereal Fiber on Postprandial Endothelial Function, Glycemia, and Insulinemia in Healthy Adults. Nutrients 2019, 11, 2387. https://doi.org/10.3390/nu11102387
Gaesser GA, Rodriguez J, Patrie JT, Whisner CM, Angadi SS. Effects of Glycemic Index and Cereal Fiber on Postprandial Endothelial Function, Glycemia, and Insulinemia in Healthy Adults. Nutrients. 2019; 11(10):2387. https://doi.org/10.3390/nu11102387
Chicago/Turabian StyleGaesser, Glenn A., Jessica Rodriguez, James T. Patrie, Corrie M. Whisner, and Siddhartha S. Angadi. 2019. "Effects of Glycemic Index and Cereal Fiber on Postprandial Endothelial Function, Glycemia, and Insulinemia in Healthy Adults" Nutrients 11, no. 10: 2387. https://doi.org/10.3390/nu11102387
APA StyleGaesser, G. A., Rodriguez, J., Patrie, J. T., Whisner, C. M., & Angadi, S. S. (2019). Effects of Glycemic Index and Cereal Fiber on Postprandial Endothelial Function, Glycemia, and Insulinemia in Healthy Adults. Nutrients, 11(10), 2387. https://doi.org/10.3390/nu11102387