Effects of Different Dietary and Lifestyle Modification Therapies on Metabolic Syndrome in Prediabetic Arab Patients: A 12-Month Longitudinal Study

 , ,
, , 
Abstract
1. Introduction
2. Materials and Methods
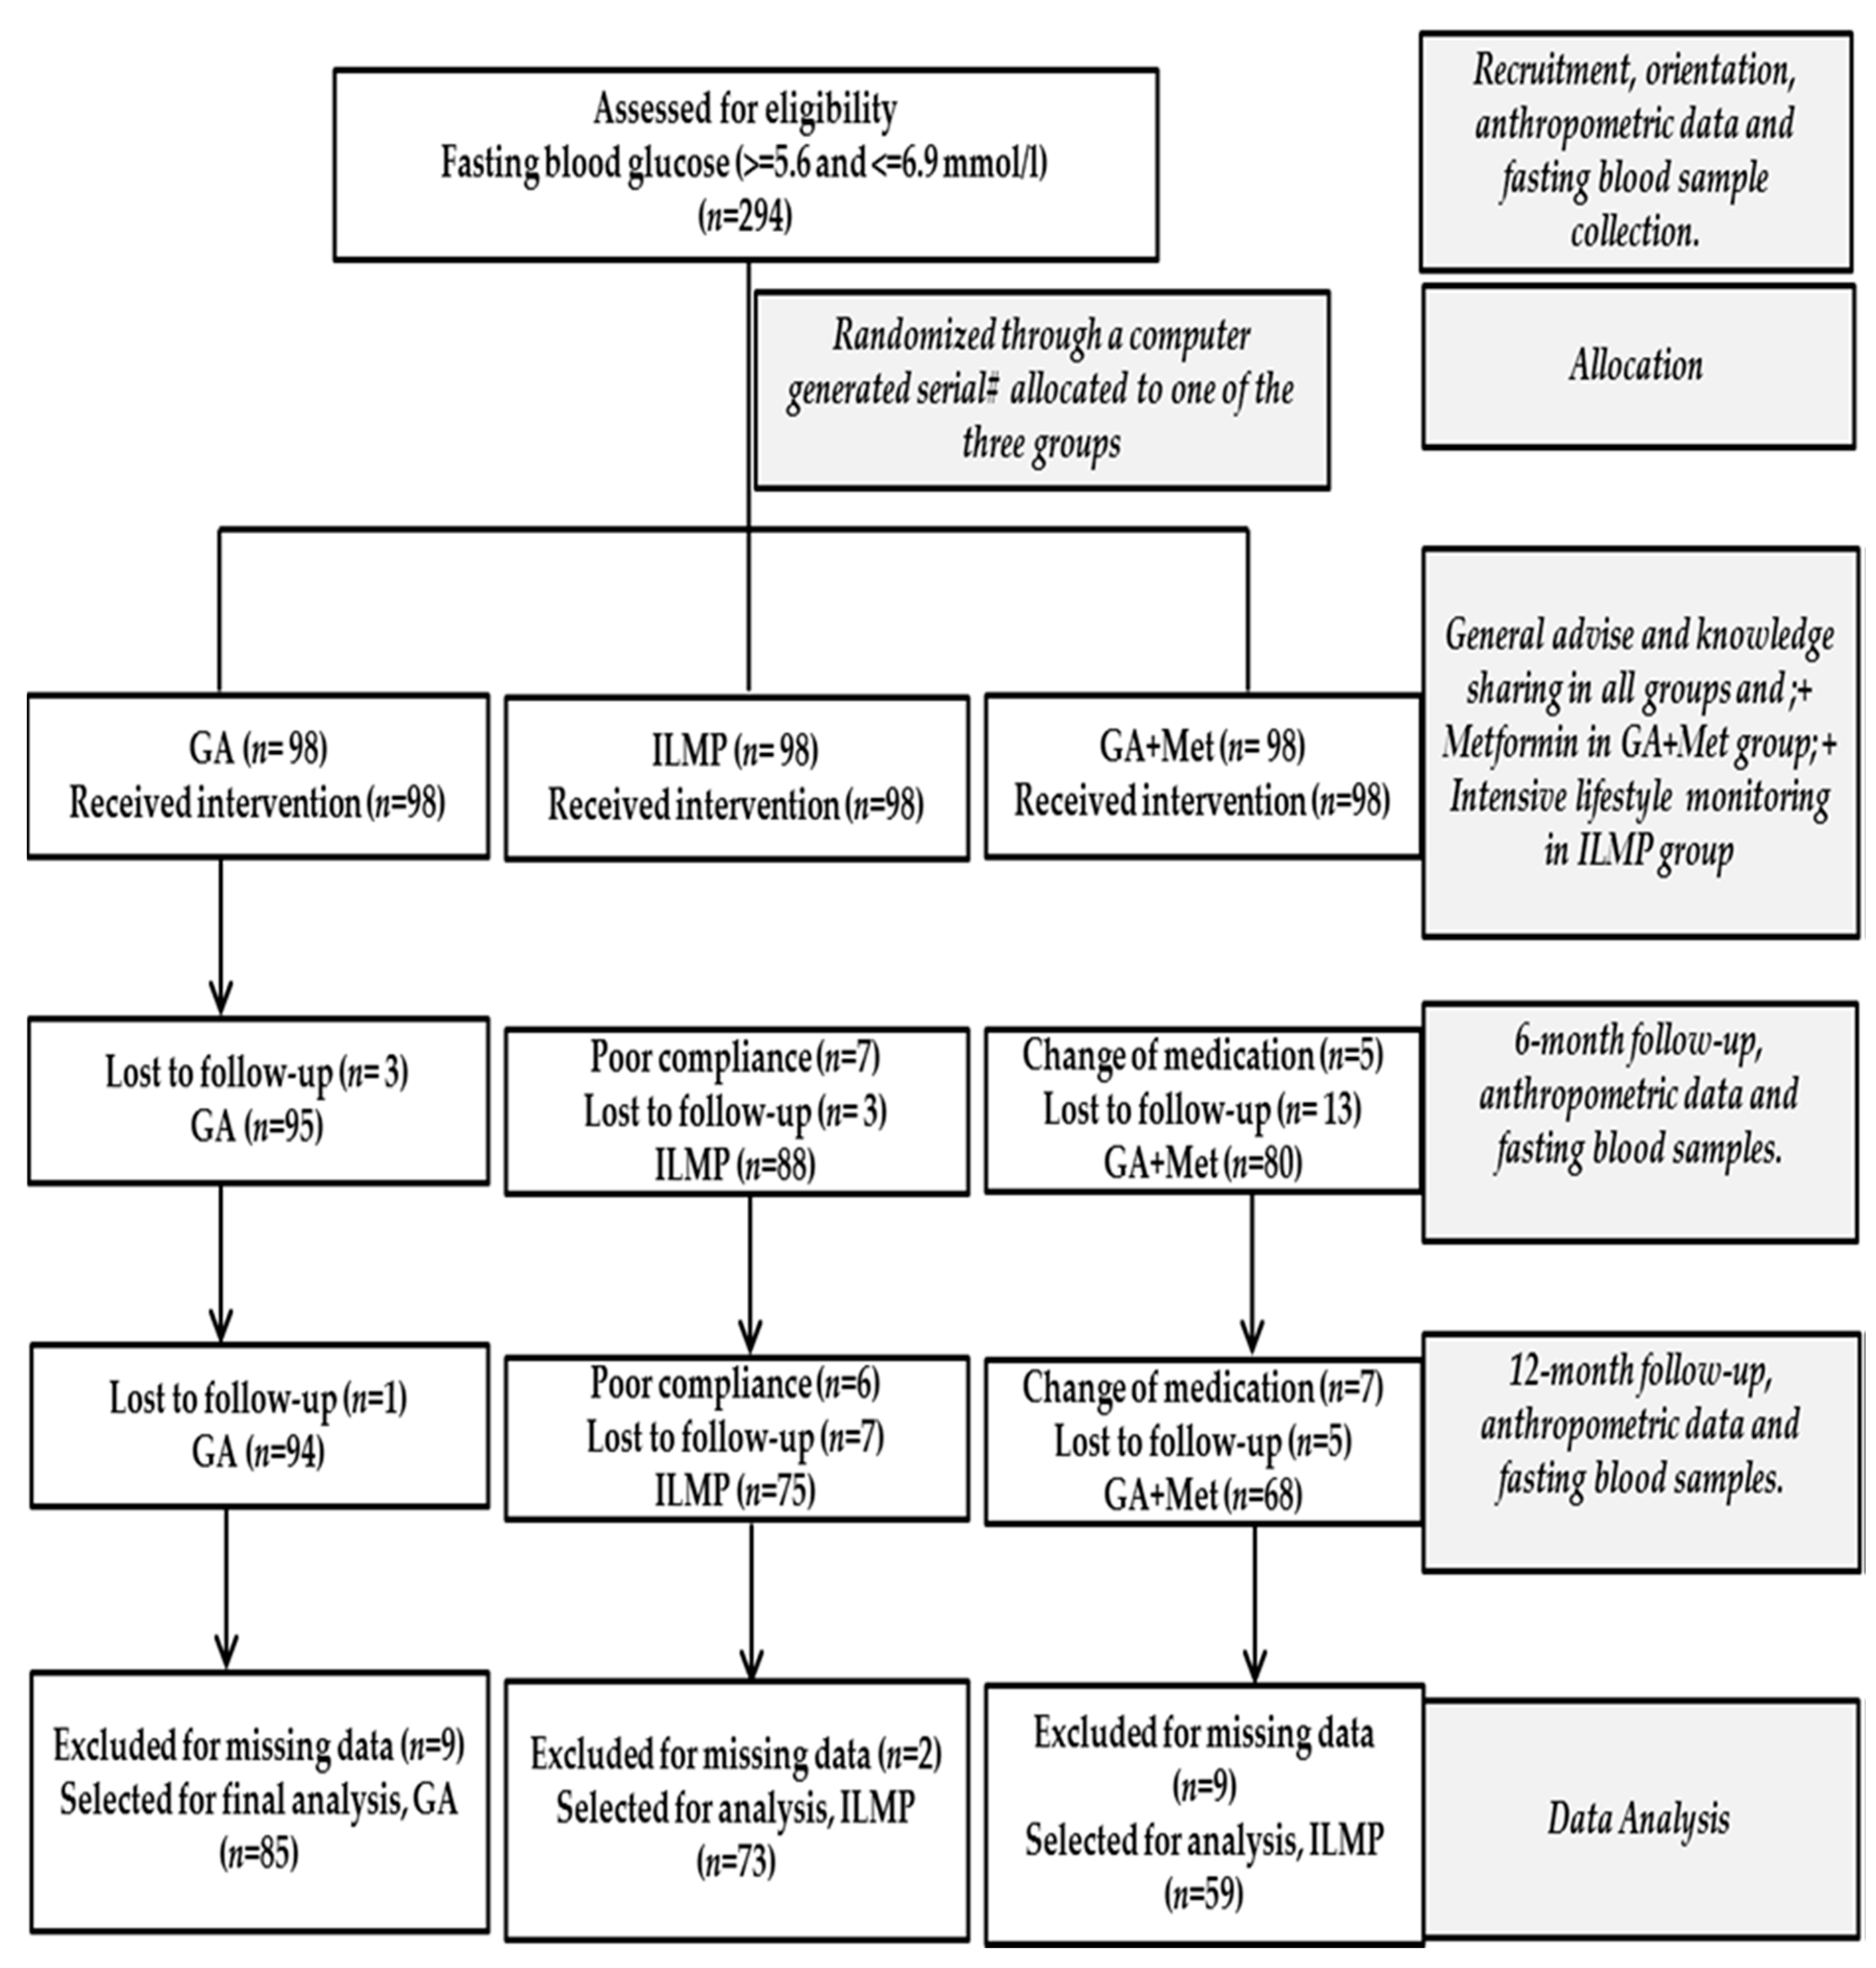
2.1. Study Population
2.2. Intervention
- (a)
- Individual consultation with the dietician was done to assess the participant’s food intake. Special dietary charts were supplied to participants explaining how to reduce the total fat intake to less than 30% of energy consume and increase the fiber intake to 15 g/1000 Kcal.
- (b)
- Guidelines for physical activity were supplied as pamphlets to each participant. Also, each participant was given a pedometer (081564483, Patterson Medical) and recommended at least 5000 steps per day to gradually increase as tolerance develops.
- (c)
- Individual consultation with an expert on vitamin D to educate about the benefits of optimal levels of vitamin D for good health. They were recommended to expose to sunlight for at least 30 min either before 10 a.m. and/or after 3 p.m. twice a week.
2.3. Anthropometric and Biochemical Measurements
2.4. Outcome Variables
- (a)
- Central obesity-waist circumference of >101.6 cm in males and >88.9 cm in females.
- (b)
- Hyperglycemia-fasting glucose > 5.6 mmol/L.
- (c)
- Low HDL-Cholesterol < 1.03 mmol/L in males and <1.30 mmol/L in females.
- (d)
- Hypertriglyceridemia-fasting triglycerides > 1.7 mmol/L.
- (e)
- Hypertension-systolic blood pressure > 130 mmHg and/or diastolic blood pressure > 85 mmHg.
2.5. Data Analysis
3. Results
3.1. Anthropometric and Biochemical Characteristics at Baseline and over Time
3.2. Prevalence of MetS and Its Components at Baseline and Overtime
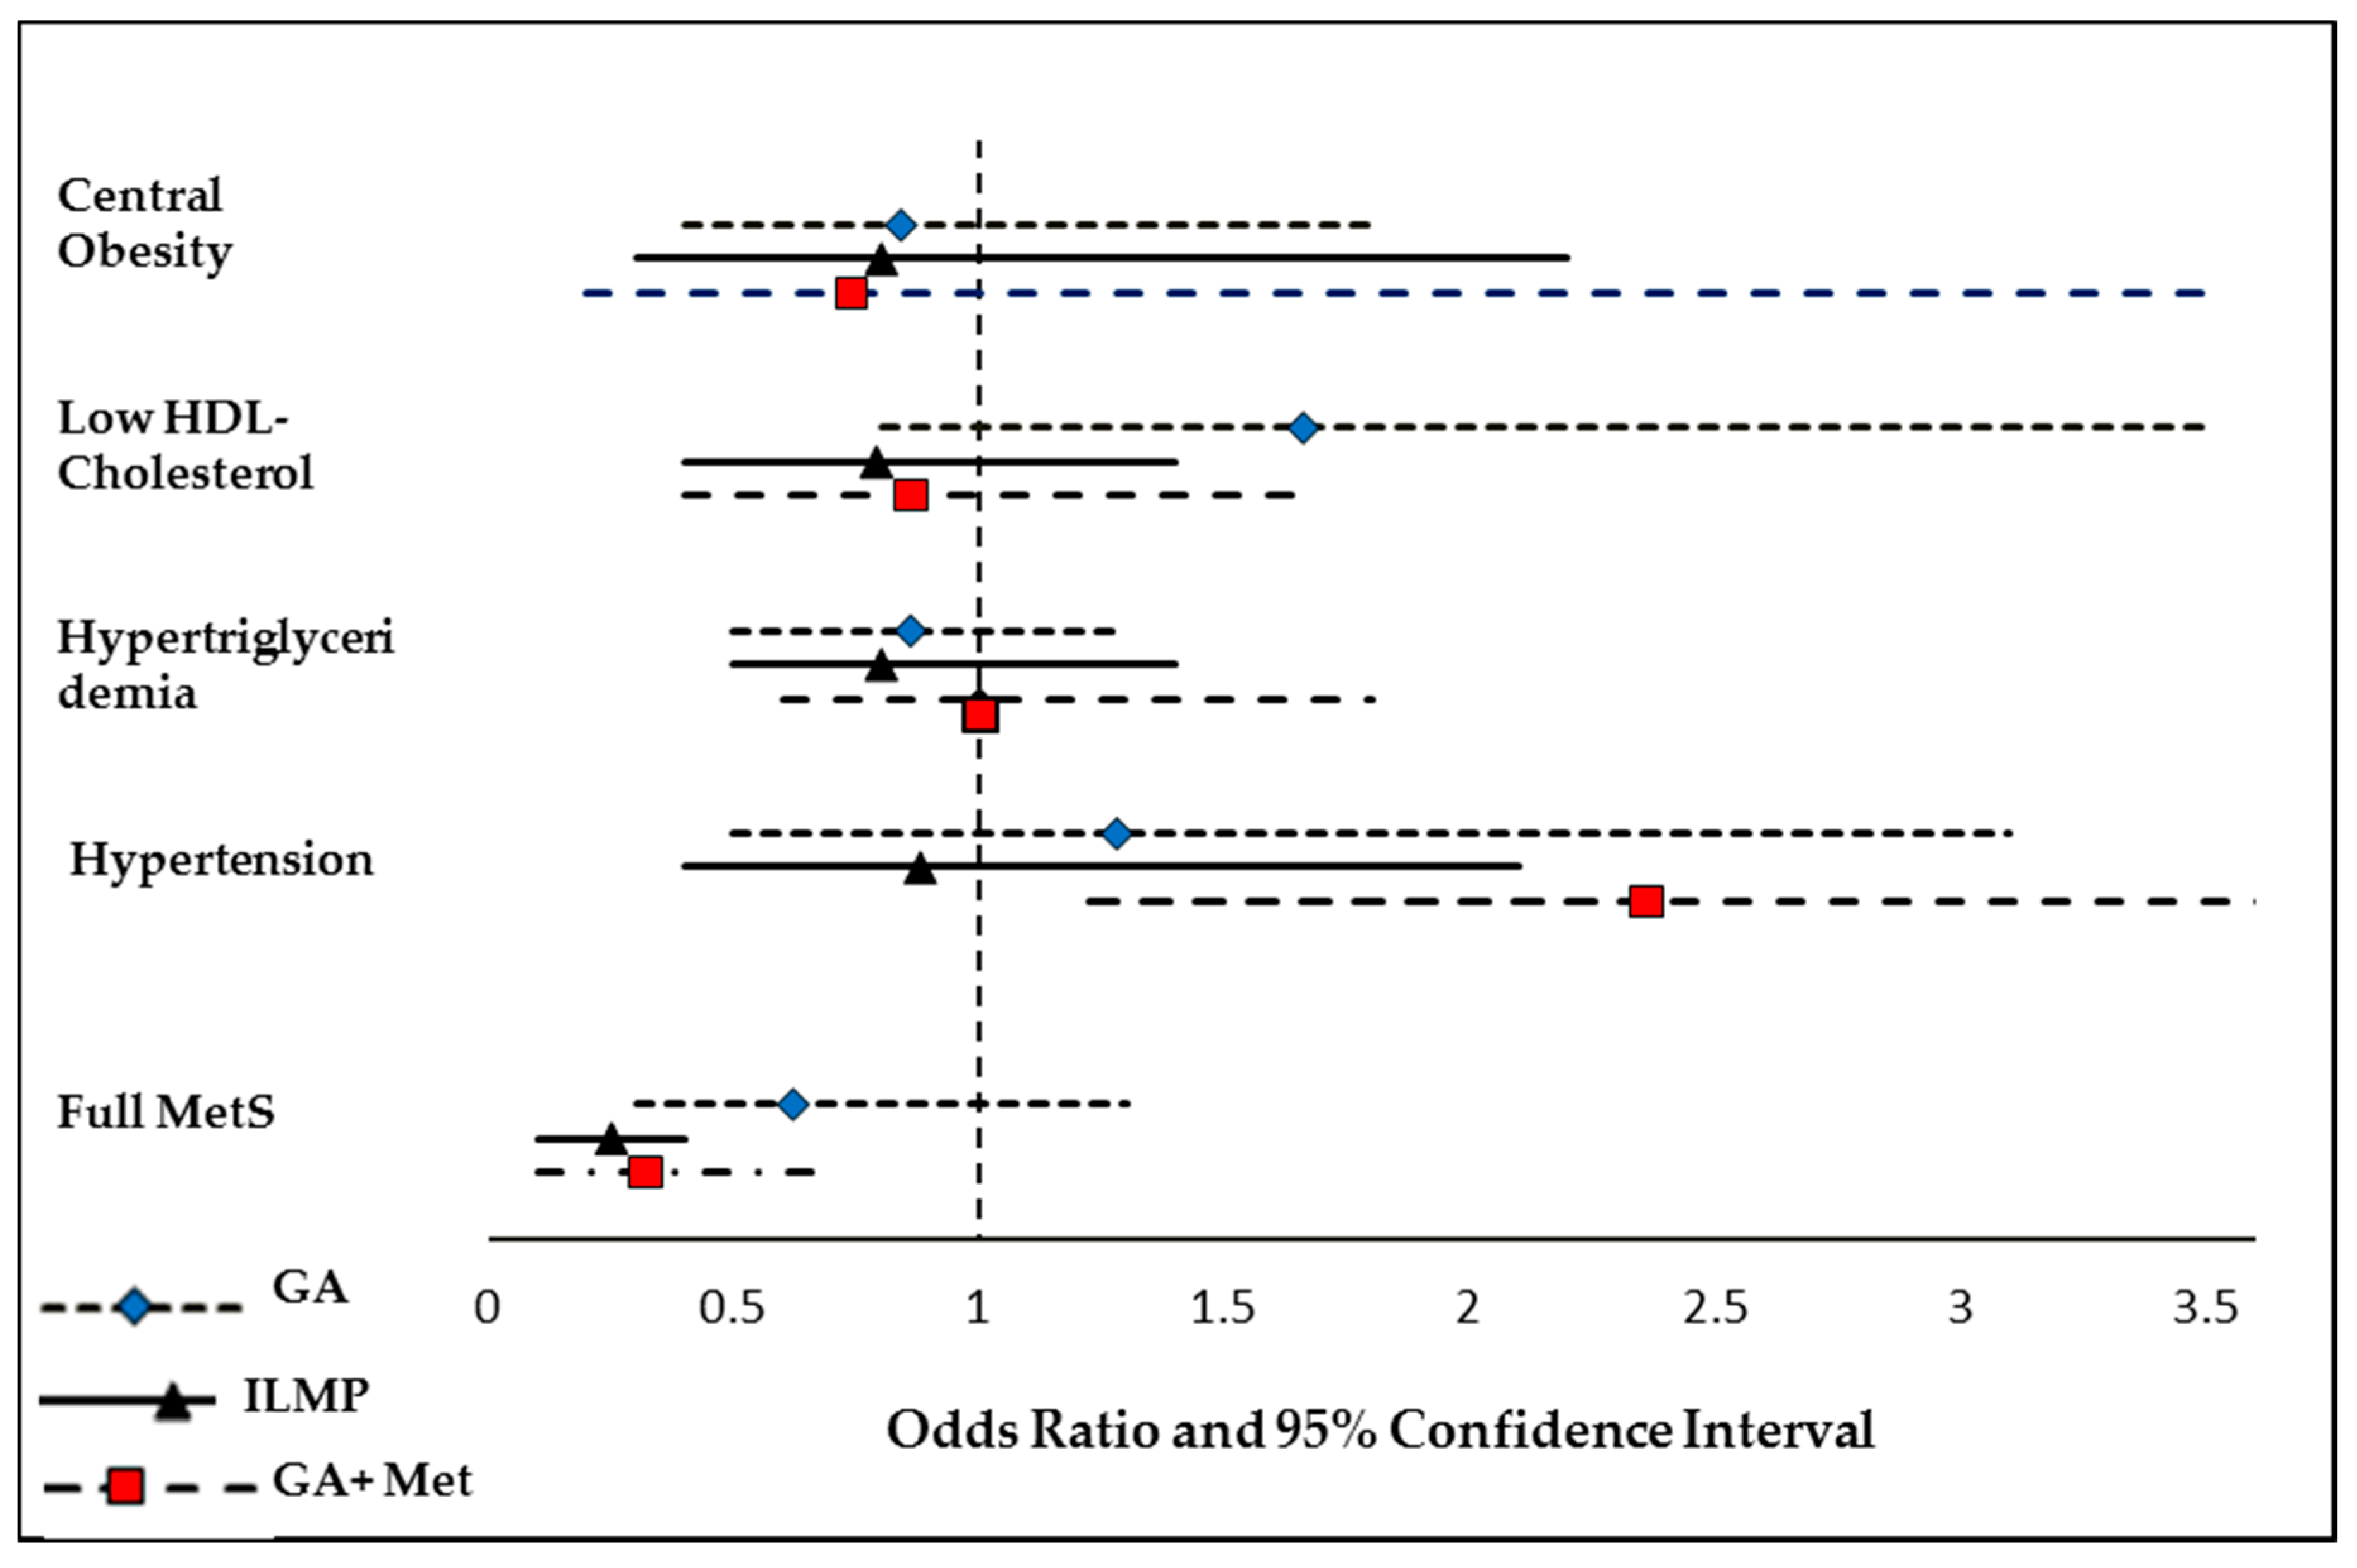
3.3. Odds of Having MetS and Its Components at Follow-Up Compared to Baseline
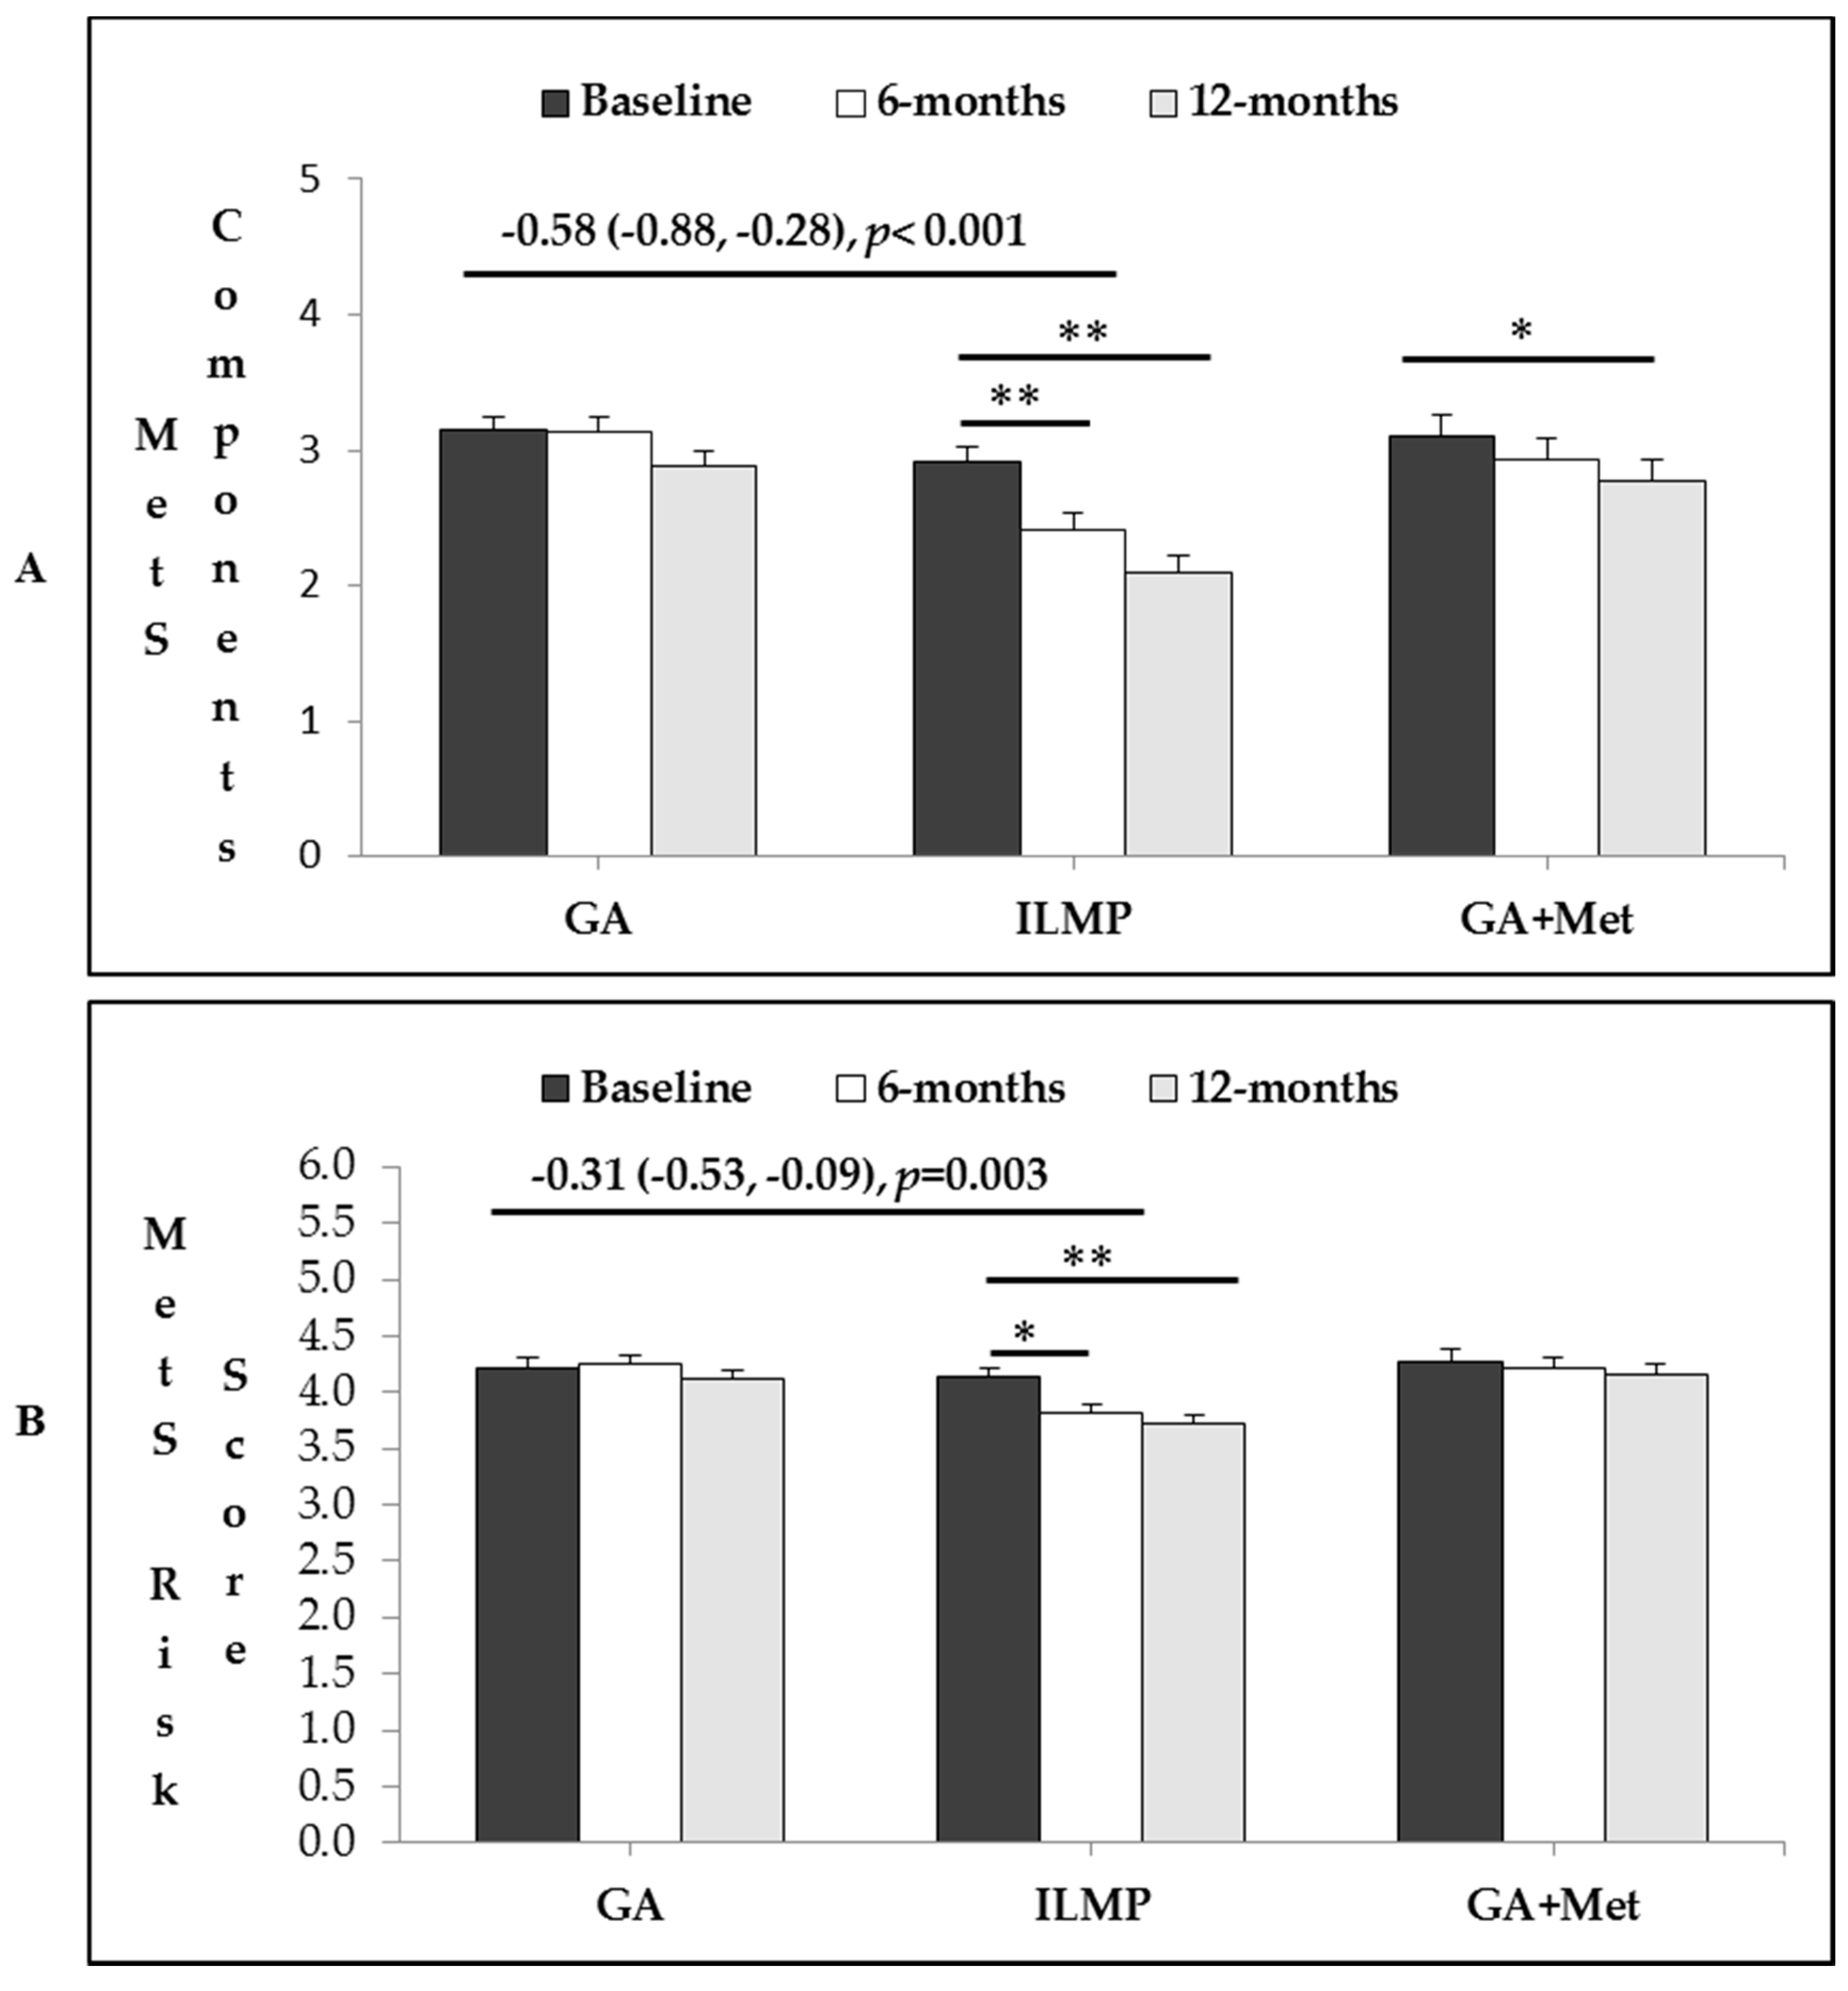
3.4. Intervention Effects in Total Number of MetS Components and MetS Risk Factor
4. Discussion
5. Conclusions
Supplementary Materials
Acknowledgments
Author Contributions
Conflicts of Interest
References
- American Diabetes Association. Diagnosis and classification of diabetes mellitus. Diabetes Care 2014, 37, S81–S90. [Google Scholar]
- Prediabetes and the Potential to Prevent Diabetes. Lancet 2012, 379. Available online: http://www.thelancet.com/journals/lancet/article/PIIS0140-6736%2812%2960960-X/fulltext (accessed on 15 March 2018).
- Bray, G.A.; Ehrmann, D.A.; Goldberg, R.B.; Diabetes Prevention Program Research Group. Reduction in the incidence of type 2 diabetes with lifestyle intervention or metformin. N. Engl. J. Med. 2002, 346, 393–403. [Google Scholar]
- Pan, X.R.; Li, G.W.; Hu, Y.H.; Wang, J.X.; Yang, W.Y.; An, Z.X.; Hu, Z.X.; Xiao, J.Z.; Cao, H.B.; Liu, P.A. Effects of diet and exercise in preventing NIDDM in people with impaired glucose tolerance: The Da Qing IGT and Diabetes Study. Diabetes Care 1997, 20, 537–544. [Google Scholar] [CrossRef] [PubMed]
- Ramachandran, A.; Snehalatha, C.; Mary, S.; Mukesh, B.; Bhaskar, A.; Vijay, V. The Indian Diabetes Prevention Programme shows that lifestyle modification and metformin prevent type 2 diabetes in Asian Indian subjects with impaired glucose tolerance (IDPP-1). Diabetologia 2006, 49, 289–297. [Google Scholar] [CrossRef] [PubMed]
- Cardona-Morrell, M.; Rychetnik, L.; Morrell, S.L.; Espinel, P.T.; Bauman, A. Reduction of diabetes risk in routine clinical practice: Are physical activity and nutrition interventions feasible and are the outcomes from reference trials replicable? A systematic review and meta-analysis. BMC Public Health 2010, 10, 653. [Google Scholar] [CrossRef] [PubMed]
- Johnson, M.; Jones, R.; Freeman, C.; Woods, H.B.; Gillett, M.; Goyder, E.; Payne, N. Can diabetes prevention programmes be translated effectively into real-world settings and still deliver improved outcomes? A synthesis of evidence. Diabet. Med. 2013, 30, 3–15. [Google Scholar] [CrossRef] [PubMed]
- Expert Panel on Detection, Evaluation. Executive summary of the Third Report of the National Cholesterol Education Program (NCEP) expert panel on detection, evaluation, and treatment of high blood cholesterol in adults (Adult Treatment Panel III). JAMA 2001, 285, 2486–2497. [Google Scholar]
- Al-Qahtani, D.A.; Imtiaz, M.L. Prevalence of metabolic syndrome in Saudi adult soldiers. Saudi Med. J. 2005, 26, 1360–1366. [Google Scholar] [PubMed]
- Al-Nozha, M.; Al-Khadra, A.; Arafah, M.R.; Al-Maatouq, M.A.; Khalil, M.Z.; Khan, N.B.; Al-Mazrou, Y.Y.; Al-Marzouki, K.; Al-Harthi, S.S.; Abdullah, M.; et al. Metabolic syndrome in Saudi Arabia. Saudi Med. J. 2005, 26, 1918–1925. [Google Scholar] [PubMed]
- Wilson, P.W.; D’Agostino, R.B.; Parise, H.; Sullivan, L.; Meigs, J.B. Metabolic syndrome as a precursor of cardiovascular disease and type 2 diabetes mellitus. Circulation 2005, 112, 3066–3072. [Google Scholar] [CrossRef] [PubMed]
- Hanson, R.L.; Imperatore, G.; Bennett, P.H.; Knowler, W.C. Components of the “metabolic syndrome” and incidence of type 2 diabetes. Diabetes 2002, 51, 3120–3127. [Google Scholar] [CrossRef] [PubMed]
- Al-Daghri, N.M.; Al-Attas, O.S.; Alokail, M.S.; Alkharfy, K.M.; Yousef, M.; Sabico, S.L.; Chrousos, G.P. Diabetes mellitus type 2 and other chronic non-communicable diseases in the central region, Saudi Arabia (Riyadh cohort 2): A decade of an epidemic. BMC Med. 2011, 9, 76. [Google Scholar] [CrossRef] [PubMed]
- Aljohani, N.J. Metabolic syndrome: Risk factors among adults in Kingdom of Saudi Arabia. J. Fam. Community Med. 2014, 21, 170–175. [Google Scholar] [CrossRef] [PubMed]
- Huang, P.L. A comprehensive definition for metabolic syndrome. Dis. Models Mech. 2009, 2, 231–237. [Google Scholar] [CrossRef] [PubMed]
- American Diabetes Association. Standards of Medical Care in Diabetes. Diabetes Care 2017, 40. Available online: http://care.diabetesjournals.org/content/diacare/suppl/2016/12/15/40.Supplement_1.DC1/DC_40_S1_final.pdf (accessed on 2 February 2018).
- Tuomilehto, J.; Lindström, J.; Eriksson, J.G.; Valle, T.T.; Hämäläinen, H.; Ilanne-Parikka, P.; Keinänen-Kiukaanniemi, S.; Laakso, M.; Louheranta, A.; Rastas, M. Prevention of type 2 diabetes mellitus by changes in lifestyle among subjects with impaired glucose tolerance. N. Engl. J. Med. 2001, 344, 1343–1350. [Google Scholar] [CrossRef] [PubMed]
- Kosaka, K.; Noda, M.; Kuzuya, T. Prevention of type 2 diabetes by lifestyle intervention: A Japanese trial in IGT males. Diabetes Res. Clin. Pract. 2005, 67, 152–162. [Google Scholar] [CrossRef] [PubMed]
- Al-Daghri, N.M.; Alfawaz, H.; Aljohani, N.J.; Al-Saleh, Y.; Wani, K.; Alnaami, A.M.; Alharbi, M.; Kumar, S. A 6-month “self-monitoring” lifestyle modification with increased sunlight exposure modestly improves vitamin D status, lipid profile and glycemic status in overweight and obese Saudi adults with varying glycemic levels. Lipids Health Dis. 2014, 13, 87. [Google Scholar] [CrossRef] [PubMed]
- Al-Daghri, N.M.; Alfawaz, H.; Aljohani, N.J.; Wani, K.; Alharbi, M.; Al-Saleh, Y.; Al-Attas, O.S.; Alokail, M.S. Age-specific improvements in impaired fasting glucose and vitamin D status using a lifestyle intervention programme in overweight and obese Saudi subjects. Int. J. Clin. Exp. Med. 2016, 9, 19850–19857. [Google Scholar]
- Orchard, T.J.; Temprosa, M.; Goldberg, R.; Haffner, S.; Ratner, R.; Marcovina, S.; Fowler, S. The effect of metformin and intensive lifestyle intervention on the metabolic syndrome: The Diabetes Prevention Program randomized trial. Ann. Intern. Med. 2005, 142, 611–619. [Google Scholar] [CrossRef] [PubMed]
- Watkins, L.L.; Sherwood, A.; Feinglos, M.; Hinderliter, A.; Babyak, M.; Gullette, E.; Waugh, R.; Blumenthal, J.A. Effects of exercise and weight loss on cardiac risk factors associated with syndrome X. Arch. Intern. Med. 2003, 163, 1889–1895. [Google Scholar] [CrossRef] [PubMed]
- Esposito, K.; Marfella, R.; Ciotola, M.; Di Palo, C.; Giugliano, F.; Giugliano, G.; D’armiento, M.; D’andrea, F.; Giugliano, D. Effect of a Mediterranean-style diet on endothelial dysfunction and markers of vascular inflammation in the metabolic syndrome: A randomized trial. JAMA 2004, 292, 1440–1446. [Google Scholar] [CrossRef] [PubMed]
- Azadbakht, L.; Mirmiran, P.; Esmaillzadeh, A.; Azizi, T.; Azizi, F. Beneficial effects of a Dietary Approaches to Stop Hypertension eating plan on features of the metabolic syndrome. Diabetes Care 2005, 28, 2823–2831. [Google Scholar] [CrossRef] [PubMed]
- Brand-Miller, J.; Hayne, S.; Petocz, P.; Colagiuri, S. Low–glycemic index diets in the management of diabetes. Diabetes Care 2003, 26, 2261–2267. [Google Scholar] [CrossRef] [PubMed]
- Rena, G.; Hardie, D.G.; Pearson, E.R. The mechanisms of action of metformin. Diabetologia 2017, 60, 1577–1585. [Google Scholar] [CrossRef] [PubMed]
- Malin, S.K.; Kashyap, S.R. Effects of metformin on weight loss: Potential mechanisms. Curr. Opin. Endocrinol. Diabetes Obes. 2014, 21, 323–329. [Google Scholar] [CrossRef] [PubMed]
- Yamaoka, K.; Tango, T. Effects of lifestyle modification on metabolic syndrome: A systematic review and meta-analysis. BMC Med. 2012, 10, 138. [Google Scholar] [CrossRef] [PubMed]
- American Diabetes Association. Impact of intensive lifestyle and metformin therapy on cardiovascular disease risk factors in the diabetes prevention program. Diabetes Care 2005, 28, 888–894. [Google Scholar]
- Wulffelé, E.M.; Kooy, A.; Zeeuw, D.D.; Stehouwer, C.; Gansevoort, R. The effect of metformin on blood pressure, plasma cholesterol and triglycerides in type 2 diabetes mellitus: A systematic review. J. Intern. Med. 2004, 256, 1–14. [Google Scholar] [CrossRef] [PubMed]
- Zhou, L.; Liu, H.; Wen, X.; Peng, Y.; Tian, Y.; Zhao, L. Effects of metformin on blood pressure in nondiabetic patients: A meta-analysis of randomized controlled trials. J. Hypertens. 2017, 35, 18–26. [Google Scholar] [CrossRef] [PubMed]
- Dean, A.; Nilsen, M.; Loughlin, L.; Salt, I.P.; MacLean, M.R. Metformin reverses development of pulmonary hypertension via aromatase inhibition. Hypertension 2016, 68, 446–454. [Google Scholar] [CrossRef] [PubMed]
- Kagan, A.; Faibel, H.; Ben-Arie, G.; Granevitze, Z.; Rapoport, J. Gender differences in ambulatory blood pressure monitoring profile in obese, overweight and normal subjects. J. Hum. Hypertens. 2007, 21, 128–134. [Google Scholar] [CrossRef] [PubMed][Green Version]
- Gleeson, M.; Bishop, N.C.; Stensel, D.J.; Lindley, M.R.; Mastana, S.S.; Nimmo, M.A. The anti-inflammatory effects of exercise: Mechanisms and implications for the prevention and treatment of disease. Nat. Rev. Immunol. 2011, 11, 607–615. [Google Scholar] [CrossRef] [PubMed]
- Messier, S.P.; Mihalko, S.L.; Legault, C.; Miller, G.D.; Nicklas, B.J.; DeVita, P.; Beavers, D.P.; Hunter, D.J.; Lyles, M.F.; Eckstein, F. Effects of intensive diet and exercise on knee joint loads, inflammation, and clinical outcomes among overweight and obese adults with knee osteoarthritis: The IDEA randomized clinical trial. JAMA 2013, 310, 1263–1273. [Google Scholar] [CrossRef] [PubMed]
- Andersen, L.B.; Harro, M.; Sardinha, L.B.; Froberg, K.; Ekelund, U.; Brage, S.; Anderssen, S.A. Physical activity and clustered cardiovascular risk in children: A cross-sectional study (The European Youth Heart Study). Lancet 2006, 368, 299–304. [Google Scholar] [CrossRef]
- Katzmarzyk, P.T.; Perusse, L.; Malina, R.M.; Bergeron, J.; Despres, J.; Bouchard, C. Stability of indicators of the metabolic syndrome from childhood and adolescence to young adulthood: The Quebec Family Study. J. Clin. Epidemiol. 2001, 54, 190–195. [Google Scholar] [CrossRef]


| Treatment (n) Female/Male | GA (85) 64/21 | ILMP (73) 51/22 | GA+Met (59) 42/17 | p B |
|---|---|---|---|---|
| Anthropometrics | ||||
| Age (years) | 42.3 ± 11.2 | 43.4 ± 7.8 | 42.6 ± 6.9 | 0.74 |
| Weight (Kg) | ||||
| Baseline | 81.7 ± 13.9 | 79.6 ± 15.9 | 80.4 ± 14.9 | 0.67 |
| 6-month | 82.3 ± 13.9 | 78.7 ± 15.9 | 77.6 ±13.9 | |
| 12-month | 82.2 ±13.4 | 77.7 ±16.2 | 76.3 ±14.1 | |
| Change at 6 months | 0.61 | −0.93 | −2.86 ** | |
| Change at 12 months | 0.49 | −1.86 * | −4.15 ** | |
| BMI (kg/m2) | ||||
| Baseline | 32.6 ± 5.8 | 31.3 ± 6.4 | 32.1 ± 5.7 | 0.18 |
| 6-month | 32.8 ± 5.9 | 31.0 ± 6.7 | 31.0 ± 5.4 | |
| 12-month | 32.8 ± 5.7 | 30.6 ± 6.6 | 30.4 ± 5.3 | |
| Change at 6 months | 0.26 | −0.32 | −1.14 ** | |
| Change at 12 months | 0.21 | −0.71 * | −1.68 ** | |
| Waist (cm) | ||||
| Baseline | 95.6 ± 6.8 | 97.9 ± 13 | 103.6 ± 12.5 | <0.01 |
| 6-month | 95.7 ± 6.7 | 97.7 ± 13.5 | 102.6 ± 12.8 | |
| 12-month | 95.5 ± 6.2 | 96.3 ± 13 | 102.6 ± 12.3 | |
| Change at 6 months | 0.12 | −0.25 | −0.95 | |
| Change at 12 months | −0.09 | −1.61 ** | −0.96 | |
| Hips (cm) | ||||
| Baseline | 110.2 ± 7.9 | 111. 9 ± 12 | 111.0 ± 12 | 0.60 |
| 6-month | 110.5 ± 7.9 | 111.0 ± 11.6 | 109.5 ± 10.9 | |
| 12-month | 110.6 ± 7.6 | 109.9 ± 12.2 | 109.6 ± 10.9 | |
| Change at 6 months | 0.26 | −0.86 * | −1.48 ** | |
| Change at 12 months | 0.44 | −1.98 ** | −1.39 * | |
| Systolic BP (mmHG) | ||||
| Baseline | 120.0 ± 12.1 | 122.1 ± 15.8 | 127.4 ± 11.6 | 0.01 |
| 6-month | 117.8 ± 14.4 | 120.0 ± 18.5 | 129.2 ± 11.1 | |
| 12-month | 119.2 ± 15.8 | 119.5 ± 16.6 | 129.3 ± 10.7 | |
| Change at 6 months | −2.25 | −2.12 | 1.86 | |
| Change at 12 months | −0.86 | −2.59 * | 1.97 | |
| Diastolic BP (mmHG) | ||||
| Baseline | 76.4 ± 9.7 | 76.0 ± 11.9 | 80.6 ± 9.0 | 0.02 |
| 6-month | 76.4 ± 12.1 | 76.0 ± 12.1 | 81.2 ± 11.1 | |
| 12-month | 77.1 ± 13.7 | 74.6 ± 12.8 | 83.3 ± 9.2 | |
| Change at 6 months | 0.06 | 0.14 | 0.68 | |
| Change at 12 months | 0.71 | −1.38 | 2.73 | |
| Glycemic Profile | ||||
| Fasting Glucose (mmol/L) | ||||
| Baseline | 6.0 ± 0.4 | 6.1 ± 0.4 | 6.6 ± 0.5 | <0.01 |
| 6-month | 6.1 ± 0.7 | 5.7 ± 0.8 | 6.0 ± 1.3 | |
| 12-month | 5.9 ± 0.9 | 5.7 ± 0.8 | 5.8 ± 1.7 | |
| Change at 6 months | 0.09 | −0.40 ** | −0.56 ** | |
| Change at 12 months | −0.05 | −0.39 ** | −0.81 ** | |
| HbA1c | ||||
| Baseline | 5.6 ± 0.5 | 5.8 ± 0.4 | 5.6 ± 0.5 | <0.01 |
| 6-month | 5.7 ± 1.6 | 5.6 ± 0.4 | 5.1 ± 1.5 | |
| 12-month | 5.6 ± 1.5 | 5.5 ± 1.0 | 5.0 ± 1.7 | |
| Change at 6 months | 0.06 | −0.22 | −0.47 ** | |
| Change at 12 months | −0.06 | −0.30 | −0.53 ** | |
| Lipid Profile | ||||
| Total Cholesterol (mmol/l) | ||||
| Baseline | 4.8 ± 1.0 | 5.2 ± 1.3 | 4.8 ± 1.2 | 0.06 |
| 6-month | 4.8 ± 1.2 | 5.0 ± 1.1 | 4.9 ± 1.0 | |
| 12-month | 4.6 ± 1.1 | 5.0 ± 1.0 | 4.9 ± 1.2 | |
| Change at 6 months | −0.05 | −0.19 | 0.04 | |
| Change at 12 months | −0.22 | −0.24 | 0.06 | |
| HDL-Cholesterol (mmol/l) | ||||
| Baseline | 1.1 ± 0.3 | 1.2 ± 0.4 | 1.2 ± 0.4 | 0.49 |
| 6-month | 0.93 ± 0.4 | 1.2 ± 0.4 | 1.1 ± 0.4 | |
| 12-month | 0.96 ± 0.4 | 1.2 ± 0.4 | 1.2 ± 0.3 | |
| Change at 6 months | −0.16 | 0.02 | −0.02 | |
| Change at 12 months | −0.13 | 0.03 | 0.01 | |
| Triglycerides (mmol/l) | ||||
| Baseline | 1.4 (1.1, 2.1) | 1.5 (1.1, 1.8) | 1.6 (1.2, 2.0) | 0.75 |
| 6-month | 1.5 (1.1, 2.1) | 1.3 (1.1, 1.8) | 1.6 (1.3, 2.2) | |
| 12-month | 1.4 (1.1, 2.0) | 1.2 (1.0, 1.7) | 1.6 (1.3, 2.0) | |
| Change at 6 months | 0.11 | −0.12 | 0.03 | |
| Change at 12 months | −0.03 | −0.23 * | 0.00 | |
| 25(OH) vitamin D (nmol/l) | ||||
| Baseline | 41.7 (24.0, 73.0) | 47.3 (30, 67.2) | 57.0 (38, 96) | 0.03 |
| 6-month | 45.0 (28.5, 72.6) | 54.1 (40, 68) | 62.4 (41, 95) | |
| 12-month | 48.3 (28.3, 74.7) | 56.1 (40, 72.2) | 62.4 (42, 96) | |
| Change at 6 months | 0.66 | 3.78 | 0.98 | |
| Change at 12 months | 2.49 | 5.82 | 3.79 | |
| Central Obesity | Hyperglycemia | Hyper Triglyceridemia | Low HDL-Cholesterol | Hypertension | MetS | ||
|---|---|---|---|---|---|---|---|
| GA (85) | Baseline | 63 (74.1) | 85 (100) | 64 (75.3) | 36 (42.4) | 14 (16.5) | 62 (72.9) |
| 6-month | 61 (71.8) | 76 (89.4) | 71 (83.5) | 36 (42.4) | 19 (22.4) | 63 (74.1) | |
| 12-month | 62 (72.9) | 66 (77.6) | 70 (82.4) | 33 (38.8) | 16 (18.8) | 55 (64.7) | |
| % change-6 | −2.3 | −10.6 | 8.2 | 0.0 | 5.9 | 1.2 | |
| % change-12 | −1.2 | −22.4 | 7.1 | −3.5 | 2.4 | −8.2 | |
| ILMP (73) | Baseline | 45 (61.6) | 73 (100) | 47 (64.4) | 23 (31.5) | 22 (30.1) | 45 (61.6) |
| 6-month | 46 (63.0) | 56 (76.7) | 43 (58.9) | 21 (28.8) | 22 (30.1) | 36 (49.3) | |
| 12-month | 44 (60.3) | 45 (61.6) | 42 (57.5) | 20 (27.4) | 21 (28.8) | 26 (35.6) | |
| % change-6 | 1.4 | −23.3 | −5.5 | −2.7 | 0.0 | −12.3 | |
| % change-12 | −1.4 | −38.4 | −6.8 | −4.1 | −1.4 | −26.0 ** | |
| GA + Met (59) | Baseline | 47 (79.7) | 59 (100) | 39 (66.1) | 25 (42.4) | 22 (37.3) | 49 (83.1) |
| 6-month | 46 (78.0) | 43 (72.9) | 42 (71.2) | 24 (40.7) | 29 (49.2) | 42 (71.2) | |
| 12-month | 46 (78.0) | 36 (61.0) | 37 (62.7) | 25 (42.4) | 27 (45.8) | 38 (64.4) | |
| % change-6 | −1.7 | −27.1 | 5.1 | −1.7 | 11.9 * | −11.9 | |
| % change-12 | −1.7 | −39.0 | −3.4 | 0.0 | 8.5 * | −22.4 * | |
| Baseline | 6-Month | 12-Month | ||||
|---|---|---|---|---|---|---|
| Reference | O.R. (95% C.I.) | p | O.R. (95% C.I.) | p | ||
| Central Obesity | ||||||
| GA | Model a | 1.00 | 0.89 (0.8, 1.0) | 0.15 | 0.94 (0.7, 1.2) | 0.65 |
| Model b | 1.00 | 0.73 (0.5, 1.1) | 0.13 | 0.85 (0.4, 1.7) | 0.65 | |
| Model c | 1.00 | 0.71 (0.5, 1.1) | 0.12 | 0.84 (0.4, 1.8) | 0.65 | |
| ILMP | Model a | 1.00 | 1.06 (0.8, 1.4) | 0.65 | 0.94 (0.7, 1.2) | 0.65 |
| Model b | 1.00 | 1.08 (0.8, 1.5) | 0.65 | 0.92 (0.7, 1.3) | 0.654 | |
| Model c | 1.00 | 1.25 (0.5, 3.2) | 0.64 | 0.80 (0.3, 2.2) | 0.67 | |
| GA + Met | Model a | 1.00 | 0.90 (0.6, 1.3) | 0.56 | 0.90 (0.5, 1.5) | 0.71 |
| Model b | 1.00 | 0.88 (0.6, 1.4) | 0.56 | 0.88 (0.4, 1.7) | 0.70 | |
| Model c | 1.00 | 0.74 (0.3, 2.1) | 0.56 | 0.74 (0.2, 3.5) | 0.71 | |
| Low HDL-Cholesterol | ||||||
| GA | Model a | 1.00 | 1.66 (0.9, 3.2) | 0.13 | 1.53 (0.8, 2.8) | 0.18 |
| Model b | 1.00 | 1.80 (0.8, 3.8) | 0.13 | 1.64 (0.8, 3.4) | 0.18 | |
| Model c | 1.00 | 1.83 (0.8, 4.0) | 0.13 | 1.66 (0.8, 3.5) | 0.18 | |
| ILMP | Model a | 1.00 | 0.75 (0.4, 1.3) | 0.34 | 0.79 (0.4, 1.4) | 0.43 |
| Model b | 1.00 | 0.75 (0.4, 1.4) | 0.34 | 0.79 (0.4, 1.4) | 0.43 | |
| Model c | 1.00 | 0.74 (0.4, 1.4) | 0.34 | 0.79 (0.4, 1.4) | 0.43 | |
| GA + Met | Model a | 1.00 | 1.27 (0.7, 2.4) | 0.47 | 0.86 (0.4, 1.7) | 0.67 |
| Model b | 1.00 | 1.27 (0.6, 2.4) | 0.47 | 0.86 (0.4, 1.7) | 0.67 | |
| Model c | 1.00 | 1.27 (0.7, 2.4) | 0.47 | 0.86 (0.4, 1.7) | 0.67 | |
| Hypertriglyceridemia | ||||||
| GA | Model a | 1.00 | 1.00 (0.7, 1.5) | 1.00 | 0.86 (0.6, 1.3) | 0.49 |
| Model b | 1.00 | 1.00 (0.6, 1.5) | 1.00 | 0.86 (0.6, 1.3) | 0.49 | |
| Model c | 1.00 | 1.00 (0.6, 1.6) | 1.00 | 0.86 (0.5, 1.3) | 0.49 | |
| ILMP | Model a | 1.00 | 0.88 (0.5, 1.5) | 0.62 | 0.82 (0.5, 1.4) | 0.44 |
| Model b | 1.00 | 0.87 (0.5, 1.5) | 0.62 | 0.80 (0.5, 1.4) | 0.44 | |
| Model c | 1.00 | 0.86 (0.5, 1.5) | 0.62 | 0.80 (0.5, 1.4) | 0.44 | |
| GA + Met | Model a | 1.00 | 0.93 (0.6, 1.5) | 0.78 | 1.00 (0.6, 1.7) | 1.00 |
| Model b | 1.00 | 0.93 (0.5, 1.6) | 0.78 | 1.00 (0.6, 1.7) | 1.00 | |
| Model c | 1.00 | 0.92 (0.5, 1.6) | 0.78 | 1.00 (0.6, 1.8) | 1.00 | |
| Hypertension | ||||||
| GA | Model a | 1.00 | 1.46 (0.8, 2.6) | 0.19 | 1.18 (0.6, 2.1) | 0.59 |
| Model b | 1.00 | 1.48 (0.8, 2.7) | 0.19 | 1.18 (0.6, 2.2) | 0.59 | |
| Model c | 1.00 | 1.80 (0.8, 4.2) | 0.18 | 1.28 (0.5, 3.1) | 0.59 | |
| ILMP | Model a | 1.00 | 1.00 (0.7, 1.5) | 1.00 | 0.94 (0.6, 1.4) | 0.76 |
| Model b | 1.00 | 1.00 (0.6, 1.6) | 1.00 | 0.93 (0.6, 1.5) | 0.76 | |
| Model c | 1.00 | 1.00 (0.5, 2.2) | 1.00 | 0.88 (0.4, 2.1) | 0.76 | |
| GA + Met | Model a | 1.00 | 2.13 (1.1, 4.0) | 0.019 | 1.86 (1.1, 3.1) | 0.016 |
| Model b | 1.00 | 2.25 (1.1, 4.5) | 0.020 | 1.95 (1.1, 3.4) | 0.017 | |
| Model c | 1.00 | 2.85 (1.2, 6.7) | 0.017 | 2.36 (1.2, 4.6) | 0.012 | |
| MetS | ||||||
| GA | Model a | 1.00 | 1.06 (0.6, 1.8) | 0.83 | 0.68 (0.4, 1.2) | 0.21 |
| Model b | 1.00 | 1.07 (0.6, 2.0) | 0.83 | 0.64 (0.3, 1.3) | 0.21 | |
| Model c | 1.00 | 1.08 (0.6, 2.1) | 0.83 | 0.62 (0.3, 1.3) | 0.21 | |
| ILMP | Model a | 1.00 | 0.61 (0.4, 0.9) | 0.035 | 0.34 (0.2, 0.5) | <0.001 |
| Model b | 1.00 | 0.56 (0.3, 0.9) | 0.033 | 0.29 (0.2, 0.5) | <0.001 | |
| Model c | 1.00 | 0.52 (0.3, 0.9) | 0.033 | 0.25 (0.1, 0.4) | <0.001 | |
| GA + Met | Model a | 1.00 | 0.50 (0.3, 0.9) | 0.049 | 0.37 (0.2, 0.8) | 0.006 |
| Model b | 1.00 | 0.49 (0.2, 0.9) | 0.047 | 0.36 (0.2, 0.7) | 0.006 | |
| Model c | 1.00 | 0.46 (0.2, 0.9) | 0.043 | 0.32 (0.1, 0.7) | 0.005 | |
| Treatment Groups | Intervention Effects: Mean Change (95% C.I.), p | ||||
|---|---|---|---|---|---|
| GA | ILMP | GA + Met | ILMP-GA | (GA + Met)-GA | |
| No. of MetS Components | |||||
| Baseline | 3.15 (0.10) | 2.91 (0.11) | 3.11 (0.15) | −0.58 (−0.88, −0.28), <0.001 | −0.12 (−0.53, 0.27), 1.0 |
| 6-month | 3.14 (0.11) | 2.41 (0.12) | 2.93 (0.16) | ||
| 12-month | 2.88 (0.11) | 2.10 (0.12) | 2.77 (0.16) | ||
| 6 M | −0.02 (0.12) | −0.49 (0.13) ** | −0.18 (0.17) | ||
| 12 M | −0.28 (0.12) | −0.81 (0.13) ** | −0.35 (0.18) * | ||
| MetS Risk-score | |||||
| Baseline | 4.22 (0.08) | 4.13 (0.09) | 4.28 (0.10) | −0.31 (−0.53, −0.09), 0.003 | −0.11 (−0.42, 0.19), 1.0 |
| 6-month | 4.25 (0.07) | 3.82 (0.08) | 4.22 (0.09) | ||
| 12-month | 4.12 (0.07) | 3.72 (0.08) | 4.16 (0.10) | ||
| 6 M | 0.04 (0.07) | −0.31 (0.07) * | −0.06 (0.09) | ||
| 12 M | −0.09 (0.07) | −0.41(0.08) ** | −0.12 (0.10) | ||
© 2018 by the authors. Licensee MDPI, Basel, Switzerland. This article is an open access article distributed under the terms and conditions of the Creative Commons Attribution (CC BY) license (http://creativecommons.org/licenses/by/4.0/).
Share and Cite
Alfawaz, H.A.; Wani, K.; Alnaami, A.M.; Al-Saleh, Y.; Aljohani, N.J.; Al-Attas, O.S.; Alokail, M.S.; Kumar, S.; Al-Daghri, N.M. Effects of Different Dietary and Lifestyle Modification Therapies on Metabolic Syndrome in Prediabetic Arab Patients: A 12-Month Longitudinal Study. Nutrients 2018, 10, 383. https://doi.org/10.3390/nu10030383
Alfawaz HA, Wani K, Alnaami AM, Al-Saleh Y, Aljohani NJ, Al-Attas OS, Alokail MS, Kumar S, Al-Daghri NM. Effects of Different Dietary and Lifestyle Modification Therapies on Metabolic Syndrome in Prediabetic Arab Patients: A 12-Month Longitudinal Study. Nutrients. 2018; 10(3):383. https://doi.org/10.3390/nu10030383
Chicago/Turabian StyleAlfawaz, Hanan A., Kaiser Wani, Abdullah M. Alnaami, Yousef Al-Saleh, Naji J. Aljohani, Omar S. Al-Attas, Majed S. Alokail, Sudhesh Kumar, and Nasser M. Al-Daghri. 2018. "Effects of Different Dietary and Lifestyle Modification Therapies on Metabolic Syndrome in Prediabetic Arab Patients: A 12-Month Longitudinal Study" Nutrients 10, no. 3: 383. https://doi.org/10.3390/nu10030383
APA StyleAlfawaz, H. A., Wani, K., Alnaami, A. M., Al-Saleh, Y., Aljohani, N. J., Al-Attas, O. S., Alokail, M. S., Kumar, S., & Al-Daghri, N. M. (2018). Effects of Different Dietary and Lifestyle Modification Therapies on Metabolic Syndrome in Prediabetic Arab Patients: A 12-Month Longitudinal Study. Nutrients, 10(3), 383. https://doi.org/10.3390/nu10030383